Agilent 气相色谱基本原理(英文版)解析
安捷伦气相色谱基础培训分析94页

2020/1/25
色谱过程示意图
载气 A
待分离组分
,和
B
C
D
2020/1/25
分离的过程示意图
流动 相
样品
固定 相
2020/1/25
1.2 气相色谱法的定义和分类
定义:用气体作为流动相的色谱法称为气相色谱法。 分类:根据固定相的状态不同,气固色谱(GSC) (吸附原理)、
气液色谱(GLC) (分配原理) 气固色谱可用活性炭,硅胶,分子筛,高分子多孔小球等作
辅助气:氧气或空气
2020/1/25
气体的净化
1、气体不纯的不良影响
1) 样品失真或消失 2) 柱失效 3) 对固定液保留特性的影响 4) 对检测器的影响
2、气体的净化方法 3、常用的净化物质的使用与老化
2020/1/25
气流调节阀
• 通常在减压阀输出气体的管线中还要串联稳 压阀,用以稳定载气(或燃气)的压力
• 色谱图:试样中各组分经色谱柱分离后,在柱 的末端收集各组分,经检测器转换为电信号, 用纪录仪将各组分浓度记录下来,得到色谱 图。
2020/1/25
• 如图所示为一色谱流出曲线
:
• 1)基线:在实验条件下,
色谱柱后仅有纯流动相进
入检测器时的流出曲线称
为基线。基线在稳定的条
Agilent-GCMS培训(完整版330页)

进样口和检测器出口
气路连接口
电缆连接口
电源连接口
炉箱冷却风进口
Agilent 7890A 键盘介绍
*
运行按键
气相部件按键
数字按键
信息按键
方法存储和自动运行按键
维护按键
*
Agilent GC6890前视图
*
Agilent GC6890侧后视图
*
即时功能键 功能键 快捷键 信息键 数字键 多功能键 方法存贮与自动 运行
MSD
10-5 Torr
<2 mL/min
760 Torr
0.5 - 15 mL/min
传输线
*
气相色谱和质谱的联用技术——传输线
传输线
涡轮泵
自动进样器
离子源
炉箱
*
色谱柱
流量 控制器
稳压器
空气
氢气
载气
分子筛
脱水管
固定
进样口
检测器
电子部件
PC
限流器
典型的气相色谱
*
分子筛 P/N 5060-9084
(0 to 218 V)
Signal Out
EM Voltage
电子倍增器
电压有使用上限(3000伏) 电压的提高,可以提高检测器的信号
*
电子倍增器的寿命曲线
*
提供足够的平均自由程 提供无碰撞的离子轨道 减少离子-分子反应 减少背景干扰 延长灯丝寿命 消除放电 增加灵敏度
为什么MS需要真空
空气压力应为 80 psi。
推荐管线压力
氢气压力应为 60 psi。
载气必须通过控制形成恒定的压力和恒定的流量。上下游控制器压差保持1公斤以上。
Agilent化学工作站讲义解析

色谱流出曲线及有关术语
在定性分析中,通常固定一个色谱峰作为标准 (s),然后再求其它峰(i)对这个峰的相对保留 值,此时可用符号表示,即
= tr (i) / tr (s) 大于式1的中。tr 相(i对)为保后留出值峰往的往调可整作保为留衡时量间固,定所相以选择总性是
的指标,又称选择因子。
(五) 区域宽度
Agilent化学工作站讲义
主要内容
预备知识:色谱峰、色谱的定性与定量 Agilent化学工作站的使用 实际演练 TL色谱工作站的使用 实际演练
色谱流出曲线及有关术语
(一)色谱流出曲线和色谱峰 由检测器输出的电信号强度对时间作图,所得
曲线称为色谱流出曲线。曲线上突起部分就是色谱
峰。
如果进样量很小,浓度很低,在吸附等温线 (气固吸附色谱)或分配等温线(气液分配色谱) 的线性范围内,则色谱峰是对称的。
化学工作站的启动
进入方法和运行控制界面
工作站处于待工作状态
菜单:“方法和运行控制”界面
该主题介绍了“方法和运行控制”界面中的菜单。 “方法和运行控制”界面包含以下菜单: 文件 运行控制 仪器 方法 序列 视图 中断 Analyst ChemStore
“文件”菜单
使用“文件”菜单,您可以管理数据文件和进行打印机设置。可以进行 以下操作:
保留时间是色谱法定性的基本依据,但同一组分的保留时间 常受到流动相流速的影响,因此色谱工作者有时用保留体积 来表示保留值。
色谱流出曲线及有关术语
4. 死体积V0
指色谱柱在填充后,柱管内固定相颗粒间所剩留的空间、 色谱仪中管路和连接头间的空间以及检测器的空间的总和。 当后两相很小可忽略不计时,死体积可由死时间与色谱柱出 口的载气流速Fco(cm3·min-1)计算。
AgilentA气相色谱使用培训ppt文档

SCOT 10~50 200~1000 0.5~0.8 0.8~2 50~300
10~10E6
<100
500~1000 1000~4000
0.5~2
0.1~2
低
高
高
低
5~20
10~100
50~300 600~1200
0.2~2 中等 低
20~160
毛细管色谱柱
feature of capillary gas chromatograph
减压阀和流量控制器
载气必须通过控制形成恒定的压力和恒定的流量。 上下游控制器压差保持1公斤以上。
推荐管线压力
根据所用的柱类型,载气压力应在60-100psi (大 孔径柱即取60,细孔径柱即取 100)。 空气压力应为 80 psi。 氢气压力应为 60 psi。
主供气 开关阀
气路连接
二级减压阀 开关阀
1. 提高色谱分离能力的途径
(1)塔板理论:增加柱长,减小柱径,即增加柱子塔板数; (2)速率理论:减小组分在柱中的涡流扩散和传质阻力,可 降低塔板高度。
2. 毛细管色谱柱的结构特点
(1) 不装填料阻力小,长度可达百米的毛细管柱,管径 0.1~0.5mm 。 (2)气流单途径通过柱子,消除了组分在柱中的涡流扩散。 (3)固定液直接涂在管壁上,总柱内壁面积较大,涂层很薄, 则气相和液相传质阻力大大降低。
Detector Support Gases
管路和净化器
须使用GC 专用铜管或不锈钢管。 塑料管会渗透O2和其它污染物。还可能会释放其 它可被检测到的干扰物。 管子使用前先用溶剂冲洗,载气吹干。 根据工厂的推荐,每用完3瓶气,应更换过滤器, 以防止发生气体的污染。 每隔一定时间,应对所有外加接头进检漏(大约每 隔 4-6个月)。
安捷伦gc的工作原理
安捷伦gc的工作原理
安捷伦GC(Gas Chromatography)的工作原理是基于物质在柱子中的分离和检测。
1. 样品进样:将待分析的样品注入到GC系统中。
通常使用液体进样器,将样品溶解在适当的溶剂中,并通过进样针注入到气相色谱柱中。
2. 色谱柱:GC柱是一个长而细的管状结构,通常由不同类型的固态填充物填充而成,如液态化合物会使用融点较高的固态化合物填充。
柱子的内壁通常被涂上一层液态涂层以促进分离。
样品进入柱子后,其中的化合物会根据其物理化学性质在柱子中发生分离。
3. 载气:载气是GC系统中的一个核心部分,通常使用氢气、氦气或氮气。
载气将样品带动通过色谱柱并将化合物分离。
4. 检测器:在GC系统的最后阶段,分离的化合物进入检测器中进行检测和量化。
常见的检测器包括火焰离子化检测器(FID)、热导率检测器(TCD)、质谱检测器(MS)等。
这些检测器测量化合物生成的特定信号,并将其转换为可读的结果。
5. 数据分析:GC系统通常与计算机或数据处理软件连接,将检测得到的瞬时信号转换为峰面积或峰高度,并与标准曲线进行比较以确定待测化合物的浓度。
总结起来,安捷伦GC工作的基本原理是利用载气将样品分子带动通过填充柱子并分离,然后通过检测器检测化合物并将其转换为可读的结果,最后使用计算机对数据进行处理和分析。
安捷伦气相色谱发展史介绍
安捷伦气相色谱发展史介绍1. 引言1.1 概述安捷伦气相色谱(Agilent Gas Chromatography, GC)作为一种高效的分离技术,自诞生以来在化学、医药、环境科学等领域发挥着重要作用。
本文将全面介绍安捷伦气相色谱的发展历程和其在实验条件优化方面的贡献,并展望了当前技术的发展趋势及未来可能的应用领域。
1.2 文章结构本篇文章共分为五个部分:引言、安捷伦气相色谱发展史介绍、安捷伦气相色谱在实验条件优化方面的贡献、当前安捷伦气相色谱技术及趋势展望以及结论。
首先,我们将简要概述本文内容并介绍安捷伦气相色谱的背景和意义。
其次,我们将详细回顾安捷伦气相色谱的发展历程,包括早期探索阶段、技术突破与创新以及应用领域拓展与广泛应用。
第三部分将讨论安捷伦气相色谱在实验条件优化方面的贡献,重点涵盖仪器改进和性能提升、分析方法优化和提高灵敏度以及数据处理和结果解读的进展。
接下来,我们将介绍当前安捷伦气相色谱技术的最新设备和仪器技术,并对其发展趋势和所面临的挑战进行分析。
最后,我们将总结已探讨内容并回顾安捷伦气相色谱的历史意义,强调其重要性及贡献,并展望未来发展方向和潜在创新机会。
1.3 目的本文的目的是系统介绍安捷伦气相色谱的发展历程及其在实验条件优化方面的贡献,并提出当前技术发展趋势及未来可能的应用领域。
通过本文的阐述,读者能够更全面地了解安捷伦气相色谱技术在科学研究与实际应用中所起到的重要作用,并为相关领域研究人员提供参考和启示。
同时,本文也为相关企业和科技工作者指明了未来技术发展方向,为行业创新提供支持与推动。
2. 安捷伦气相色谱发展史介绍2.1 创始和早期探索安捷伦气相色谱(Agilent Gas Chromatography)作为一项重要的分析技术,起源于20世纪中期。
在当时,化学家对于快速、高效地分离和鉴定化合物的需求越来越大。
安捷伦公司则成为了这一需求下发展起来的先驱者。
在早期探索阶段,研究人员们通过不断尝试和实践来改进气相色谱技术。
安捷伦气相色谱柱接头
安捷伦气相色谱柱接头1.引言1.1 概述安捷伦(Agilent)气相色谱柱接头是一种用于连接气相色谱仪上的柱子和进样口的关键部件。
它扮演着连接和密封的双重作用,确保样品分析的准确性和可靠性。
该接头采用特殊的材料制成,能够承受高压和高温的环境,具有良好的耐用性和稳定性。
安捷伦气相色谱柱接头的工作原理是通过螺纹结构将进样口、柱子和检测器等部件紧密地连接在一起,形成完整的气相色谱分析系统。
该接头具有优异的密封性能,能够防止气体泄漏和柱子间的杂质交叉污染,从而确保分析结果的准确性。
安捷伦气相色谱柱接头具有许多优势。
首先,它的设计合理,容易安装和拆卸,节省了调试和维护的时间。
其次,该接头具有良好的耐腐蚀性和耐高温性,适用于各种复杂的样品分析。
此外,安捷伦气相色谱柱接头具有较低的背景噪声和灵敏度,能够提高分析的精确度和灵敏度。
目前,安捷伦气相色谱柱接头广泛应用于化学、环境、食品、医药等领域的样品分析。
它能够有效地分离和检测各种化合物,包括有机物、无机物、揮发性物质等。
在药物研发、环境监测、食品安全等领域,安捷伦气相色谱柱接头为科研人员和实验室提供了强有力的分析工具。
总之,安捷伦气相色谱柱接头作为气相色谱仪的重要组成部分,在样品分析中起着至关重要的作用。
它的优异性能和广泛应用前景使其成为科研人员和实验室中不可或缺的工具。
未来,随着科学技术的不断发展和应用需求的增加,安捷伦气相色谱柱接头将继续蓬勃发展,并为样品分析领域带来更多的创新和突破。
1.2 文章结构文章结构部分的内容如下:文章结构部分旨在介绍本篇长文的组织架构和主要内容安排。
本文共分为引言、正文和结论三个主要部分,具体如下:1. 引言:本部分主要对安捷伦气相色谱柱接头的研究背景和意义进行概述。
首先简要介绍气相色谱的基本原理和应用领域,然后重点引出安捷伦气相色谱柱接头的重要作用和研究现状。
2. 正文:本部分是本篇长文的核心内容,主要分为两个小节。
2.1 安捷伦气相色谱柱接头的定义和原理:本小节详细介绍安捷伦气相色谱柱接头的定义、组成和工作原理。
安捷伦气相色谱基础培训

根据固定液的化学性能,色谱柱可分为非极性、极性与手性 色谱分离柱等。固定液的种类繁多,极性各不相同。色谱柱 对混合样品的分离能力,往往取决于固定液的极性。常用的 固定液有烃类、聚硅氧烷类、醇类、醚类、酯类以及腈和腈 醚类等。新近发展的手性色谱柱使用的是手性固定液,主要 有手性氨基酸衍生物、手性金属配合物、冠醚、杯芳烃和环 糊精衍生物等。其中以环糊精及其衍生物为色谱固定液的手 性色谱柱,用于分离各种对映体十分有效,是近年来发展极 为迅速且应用前景相当广阔的一种手性色谱柱。 在进行气相色谱分析时,色谱柱的选择是至关重要的。不仅 要考虑被测组分的性质,实验条件例如柱温、柱压的高低, 还应注意和检测器的性能相匹配。有关内容我们将在以后章 节中加以详细讨论。
2018年11月21日星期三 兰州制造中心实验室
• 如图所示为一色谱流出曲线 • 1)基线:在实验条件下, :
色谱柱后仅有纯流动相进 入检测器时的流出曲线称 为基线。基线在稳定的条 件下应是一条水平的直线。 它的平直与否可反应出实 验条件的稳定情况。 • 2)峰高(h)和峰面积 : 色谱峰顶点与基线的距离 叫峰高。色谱峰与峰底基 线所围成区域的面积叫峰 面积。
气流调节阀 • 通常在减压阀输出气体的管线中还要串联稳 压阀,用以稳定载气(或燃气)的压力 • 当用程序升温进行色谱分析时,由于色谱柱 柱温不断升高引起色谱柱阻力不断增加,也会使 载气流量发生变化。为了在气体阻力发生变化时 ,也能维持载气流速的稳定,需要使用稳流阀来 自动控制载气的稳定流速。
2018年11月21日星期三
2018年11月21日星期三
兰州制造中心实验室
1.4 色谱图及有关术语
• 从载气带着组分进入色谱柱起就用检测器 检测流出柱后的气体,并用记录器记录信 号随时间变化的曲线,此曲线就叫色谱流 出曲线,当待测组分流出色谱柱时,检测 器就可检测到其组分的浓度,在流出曲线 上表现为峰状,叫色谱峰。 • 色谱图:试样中各组分经色谱柱分离后,在柱 的末端收集各组分,经检测器转换为电信号, 用纪录仪将各组分浓度记录下来,得到色谱 图。
气相色谱工作原理
气相色谱工作原理气相色谱(Gas Chromatography, GC)是一种在化学分析中常用的分离技术,它基于样品中化合物在气相和液相之间的分配行为,通过不同化合物在固定相柱中的分离来实现对混合物的分析和定量。
气相色谱的工作原理主要包括样品进样、分离、检测和数据处理等步骤。
首先,样品进样是气相色谱分析的第一步。
通常,样品会被注入到色谱柱中,然后在高温下挥发成气态,进入气相状态。
在进样过程中,需要考虑到样品的挥发性、溶解性和化学稳定性等因素,以保证分析结果的准确性和可靠性。
接下来是分离过程。
在气相色谱柱中,通常填充有固定相,样品进入柱后会在固定相上发生分配和吸附作用,不同化合物的分配系数不同,因此会在柱中发生分离。
分离的效果受到柱温、流动相流速、柱长度和直径等因素的影响。
通过调节这些条件,可以实现对不同化合物的有效分离。
分离后的化合物会被送入检测器进行检测。
气相色谱常用的检测器包括质谱检测器(MS)、火焰光度检测器(FID)、氮磷检测器(NPD)等。
这些检测器可以根据化合物的特性,如质量、电子亲和力、热导率等进行检测,并输出相应的信号。
最后是数据处理。
检测器输出的信号会被记录下来,并通过数据处理系统进行处理和分析。
这些数据可以用来确定样品中不同化合物的种类和含量,为进一步的定性和定量分析提供依据。
总的来说,气相色谱工作原理是基于化合物在气相和液相之间的分配行为,通过分离、检测和数据处理等步骤实现对混合物的分析和定量。
在实际应用中,需要根据样品的特性和分析要求,合理选择色谱柱、流动相和检测器等条件,以获得准确可靠的分析结果。
气相色谱技术在化学、生物、环境等领域具有广泛的应用前景,对于研究和生产实践具有重要意义。
安捷伦气象色谱仪说明书

自动进样器是解决进样问题的一个方法 它们能够实现高度重复 的进样 因此 它们通常允许采用更简单的峰的含量计算方法
用外标法 而不是内标法
如果配备有自动进样器 装备有样品盘 并与数据系统连接 就可以进行全自动分析
气相色谱基本原理
23
2 进样方式
进样阀
气体进样阀
气体样品进样阀包括一个定量管和将定量管接入载气流和脱离载 气流的阀体
图 11 所示为一种常用的进样机理
接色谱柱
载气入口
样品入口 样品放空
定量管上样
图 11
气体进样阀
注射进样
样品量通过定量管来确定 定量管是可以更换的 因此一个进样 阀能够提供多种高度重复的进样体积
液体进样阀
这与气体进样阀的原理是一样的 由于液体进样要求更小的进样 体积 因此 定量管 是构成阀体的一部分 且是不可更换的
9
1 什么是气相色谱
基于时间的差别进行分离
和物理分离 比如蒸馏和类似的技术 不同 气相色谱 (GC) 是 基于时间差别的分离技术 将气化的混合物或气体通过含有某种物质的管 基于管中物质对 不同化合物的保留性能不同而得到分离 这样 就是基于时间的 差别对化合物进行分离 样品经过检测器以后 被记录的就是色 谱图 图 1 每一个峰代表最初混合样品中不同的组分 峰出现的时间称为保留时间 可以用来对每个组分进行定性 而 峰的大小 峰高或峰面积 则是组分含量大小的度量
7
8
气相色谱基本原理
安捷伦气相色谱仪 气相色谱基本原理
1 什么是气相色谱
基于时间的差别进行分离 10 系统 11
气源 12 进样口 12 色谱柱 14 检测器 14 数据处理 15 仪器控制 15
气相色谱 (GC) 是一种把混合物分离成单个组分的实验技术 它被 用来对样品组分进行鉴定和定量测定
气相色谱基础英文图文介绍
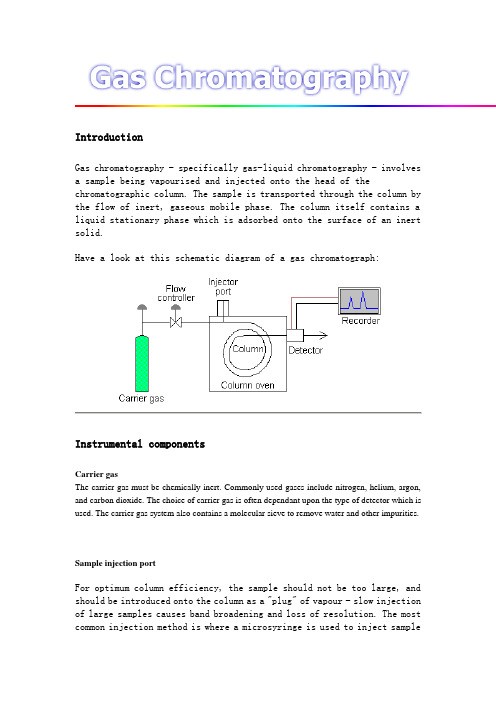
IntroductionGas chromatography - specifically gas-liquid chromatography - involves a sample being vapourised and injected onto the head of the chromatographic column. The sample is transported through the column by the flow of inert, gaseous mobile phase. The column itself contains a liquid stationary phase which is adsorbed onto the surface of an inert solid.Have a look at this schematic diagram of a gas chromatograph:Instrumental componentsCarrier gasThe carrier gas must be chemically inert. Commonly used gases include nitrogen, helium, argon, and carbon dioxide. The choice of carrier gas is often dependant upon the type of detector which is used. The carrier gas system also contains a molecular sieve to remove water and other impurities.Sample injection portFor optimum column efficiency, the sample should not be too large, and should be introduced onto the column as a "plug" of vapour - slow injection of large samples causes band broadening and loss of resolution. The most common injection method is where a microsyringe is used to inject samplethrough a rubber septum into a flash vapouriser port at the head of the column. The temperature of the sample port is usually about 50︒C higher than the boiling point of the least volatile component of the sample. For packed columns, sample size ranges from tenths of a microliter up to 20 microliters. Capillary columns, on the other hand, need much less sample, typically around 10-3μL. For capillary GC, split/splitless injection is used. Have a look at this diagram of a split/splitless injector;The injector can be used in one of two modes; split or splitless. The injector contains a heated chamber containing a glass liner into which the sample is injected through the septum. The carrier gas enters the chamber and can leave by three routes (when the injector is in split mode). The sample vapourises to form a mixture of carrier gas, vapourised solvent and vapourised solutes. A proportion of this mixture passes onto the column, but most exits through the split outlet. The septum purge outlet prevents septum bleed components from entering the column.ColumnsThere are two general types of column, packed and capillary (also known as open tubular). Packed columns contain a finely divided, inert, solid support material (commonly based on diatomaceous earth) coated with liquid stationary phase. Most packed columns are 1.5 - 10m in length and have an internal diameter of 2 - 4mm.Capillary columns have an internal diameter of a few tenths of a millimeter. They can be one of two types; wall-coated open tubular (WCOT) or support-coated open tubular (SCOT). Wall-coated columns consist of a capillary tube whose walls are coated with liquid stationary phase. In support-coated columns, the inner wall of the capillary is lined with a thin layer of support material such as diatomaceous earth, onto which the stationary phase has been adsorbed. SCOT columns are generally less efficient than WCOT columns. Both types of capillary column are more efficient than packed columns.In 1979, a new type of WCOT column was devised - the Fused Silica Open Tubular (FSOT) column;These have much thinner walls than the glass capillary columns, and are given strength by the polyimide coating. These columns are flexible and can be wound into coils. They have the advantages of physical strength, flexibility and low reactivity.Column temperatureFor precise work, column temperature must be controlled to within tenths of a degree. The optimum column temperature is dependant upon the boiling point of the sample. As a rule of thumb, a temperature slightly above the average boiling point of the sample results in an elution time of 2 - 30 minutes. Minimal temperatures give good resolution, but increase elution times. If a sample has a wide boiling range, then temperature programming can be useful. The column temperature is increased (either continuously or in steps) as separation proceeds.DetectorsThere are many detectors which can be used in gas chromatography. Different detectors will give different types of selectivity. Anon-selective detector responds to all compounds except the carrier gas, a selective detector responds to a range of compounds with a common physical or chemical property and a specific detector responds to a single chemical compound. Detectors can also be grouped into concentration dependant detectors and mass flow dependant detectors. The signal from a concentration dependant detector is related to the concentration of solute in the detector, and does not usually destroy the sample Dilution of with make-up gas will lower the detectors response. Mass flow dependant detectors usually destroy the sample, and the signal is related to the rate at which solute molecules enter the detector. The response of a mass flow dependant detector is unaffected by make-up gas. Have a look at this tabular summary of common GC detectors:The effluent from the column is mixed with hydrogen and air, and ignited. Organic compounds burning in the flame produce ions and electrons which can conduct electricity through the flame. A large electrical potential is applied at the burner tip, and a collector electrode is located above the flame. The current resulting from the pyrolysis of any organic compounds is measured. FIDs are mass sensitive rather than concentration sensitive; this gives the advantage that changes in mobile phase flow rate do not affect the detector's response. The FID is a useful general detector for the analysis of organic compounds; it has high sensitivity, a large linear response range, and low noise. It is also robust and easy to use, but unfortunately, it destroys the sample.Gas Chromatography: Procedure(1) Add the sample to be injected to the syringe.A 25µL glass Hamilton syringe is used to i nject the GC samples. Only 2-4µL of sample is injected onto the column, which means that you fill onlya small part of the barrel with sample. Examine the syringe carefullybefore you fill it. The divisions are marked "5 - 10 - 15 - 20 - 25".This is a 25 µL glass Hamilton syringe. You only inject 2.5µL, so it will NOT be filled to the top.Click on the photo to see an enlargement.Place the tip of the needle in the liquid. Slowly draw up a small amountof liquid by raising the plunger, then press on the plunger to expel theliquid back into the liquid. This serves to “rinse” the syringe withyour sample, ensuring that what you will measure in the GC run is thecomposition of your mixture. Repeat the rinse process one or two times.Then, draw up the plunger slowly again while the needle is in the liquidand carefully f ill the syringe with liquid about halfway to the “5”.It is often hard to see the liquid in the syringe.If the syringe is clogged, the plunger will be inthe correct position but the barrel of the syringewill be filled with only air, as in the bottomsyringe in the photo to the left.The best thing to do is to carefullyexaming the syringe after you thinkthat you have filled it. Hold it upto the light to get a better view.Small air bubbles in the syringewill not affect the GC run (middlesyringe in the photo to the left).As long as there is enough liquid inthe syringe, the GC run will workfine. If you keep getting bubbles,just pull the plunger up a bit pastthe "halfway to the 5" mark tocompensate.If you have a VERY large air bubble,you will not have enough liquid toshow a reading on the GC (e.g., thebottom syringe in the photo).(2) Inject the sample into the injector port.You are need to do two things sequentially and quickly, so make sure you know where the injection port is and where the start button on the recorderis.Push the needle of the syringe through the injection port and immediately press the plunger to inject the sample, then immediately press the start button on the recorder.You will feel a bit of resistance from the rubber septum in the injection port; this is to be expected and you should be prepared to apply some pressure to the syringe as you force the needle into the instrument allthe way to the base of the needle.(Click on each of the photos below for a larger view.)Push the needle of thefilled syringe through theinjector (as far as it willgo) and quickly push theplunger.Remove the syringeimmediately . . .. . . and quickly press thestart button on theintegrating recorder orthe start recording buttonon the computer (askyour TA which device isconnected to the GC thatyou are using)Here's a close-up ofthe integratingrecorder.Here's a series of picturesshowing how to run thecomputer program.(3) Sit back and wait.Observe the recorder. Within several minutes, it should record several peaks.(4) End the GC run.When you have seen all of the peaks which you suspect are in the mixture,or when the recorder has shown a flat baseline for a few minutes or so,press stop on the recorder.When you press stop, the recorder will print out the peaks, the retentiontimes, and the areas under the peaks. When it is done printing, you canpress “enter” a couple times to advance the paper.Carefully tear the paper off the recorder. The paper is not perforated, so do not try to pull up and expect it to pop out of the recorder. Instead, pull it down to start a tear from one edge, and then continue the tear until the paper is cut and free.This may seem trivial -- showing you how totear the paper. But too many times a studenthas tried to yank the paper out instead ofstarting a tear and tearing it neatly. Yankingthe paper can result in the paper being tornbelow the plastic cutting surface on therecorder, and the paper gets jammed downinside the recorder.If this happens, the entirerecorder has to be dis-assembled,a process which takes about 15minutes, thus putting the entireGC out of service until it can befixed.Gas ChromatographyStudy Questions/Answers from the Handbook for Organic Chemistry LabIn gas chromatography (GC), the stationary phase is a high-boiling liquid and the mobile phase is an inert gas. In the organic chemistry teaching labs at CU Boulder, GC is used as an analytical tool to find out how many components are in a mixture. It can also be used to separate small amountsof material.Movie on how to run a GC. To view this movie, you need the RealOne movie player. If you do not have this installed in your browser, go to and click on the box in the upper right hand corner that says "free download". Streaming video works best if you are on the University campus; if you are using a dialup modem, the quality is acceptable but not great.The GC InstrumentThe process of gas chromatography is carried out in a specially designed instrument. A very small amount of liquid mixture is injected into the instrument and is volatilized in a hot injection chamber. Then, it is swept by a stream of inert carrier gas through a heated column which contains the stationary, high-boiling liquid. As the mixture travels through this column, its components go back and forth at different rates between the gas phase and dissolution in the high-boiling liquid, and thus separate into pure components. Just before each compound exits the instrument, it passes through a detector. When the detector “sees” a compound, it sends an electronic message to the recorder, which responds by printing a peak on a piece of paper.The two brands of GCs used in the organic chemistry teaching labs are shown below: Gow-Mac series 350 on the left, Varian Aerograph Model 920 on the right. Click on each photo for a detailed enlargement.The GC consists of an injection block, a column, and a detector. An inert gas flows through the system. The injection chamber is a heated cavitywhich serves to volatilize the compounds. The sample is injected bysyringe into this chamber through a port which is covered by a rubberseptum. Once inside, the sample becomes vaporized and is carried out ofthe chamber and onto the column by the carrier gas.The large photo below is of the inside of a GC, showing the column in theoven and the insulated chamber tht houses the detector. Click on thethumbnails to see larger photos of the column and detector, as well asthe inside of the injector port (showing the septum).inside ofthe injector port the septumthe columnthe detector inside the housing On the Varian 920 andGow Mac 350chromatographs, detectionof the compounds is achieved with a thermalconductivity (TC or hotwire) detector.The column (see the photo above) is an integral part of the GC system.On the outside, all you see is a long stainless steel tube, 1/8 to 1/4inch in diameter and 4-5 feet long, which is coiled to fit inside theinstrument. Inside the column is the important component: the stationaryphase composed of the high-boiling liquid. The liquid is usuallyimpregnated on a high surface area solid support like diatomaceous earth,crushed firebrick, or alumina. The liquid can be applied in variousconcentrations: the more liquid, the more sites it has to interact withthe compounds.All of our GCs have columns which are five feet long and 1/8" or 1/4" indiameter and contain a methyl silicone polymer liquid phase (OV-101, 1.5%)on a diatomaceous earth support (chromosorb G). Methyl silicone is aliquid phase of intermediate polarity, and non-polar compounds such willseparate according to their respective boiling points.The carrier gas is an inert gas, helium. The flow rate of the gas influenceshow fast a compound will travel through the column; the faster the flowrate,the lower the retention time. Generally, the flow rate is held constantthroughout a run. (The GCs at CU Boulder are set at a flow rate of 55mL/min.)This is where the carrier gas enters the Variathe gas flow rate can be adjusted. Click onfor details.In a professional laboratory, the GC conditions would be critical foranother experimenter trying to duplicate your observations. All of ourGCs have the same columns (1.5% OV-101 on Chromasorb G) and the same flowrate (55 mL/minute) and detector bridge current (150 mAmps). Eachinstrument will have a different setting for:∙column temperature∙injection port temperature∙detector temperatureIt is a good practice to write down some of the settings on the instrument.The values for these temperaturs are viewed by turning the knob on theinstrument below the gauge -- click on the thumbnails below to see detailedphotos of how to do this.reading temperatures on theGow-Macreading temperatures on the VarianRecordersTwo devices are used to record the GC traces/areas under peaks:∙integrating recorders∙computer programEach type of device records the messages sent to them by the detector as peaks, calculates the retention time, and calculates the area under each peak; all of this information is included in the printout. For similar compounds, the area under a GC peak is roughly proportional to the amount of compound injected. If a two-component mixture gives relative areas of 75:25, you may conclude that the mixture contains approximately 75% of one component and 25% of the other.An integrating recorder is pictured below. Click on the photo for a detailed picture and the location of the start button (press when you inject), the stop button (press when you have seen your peaks, it tells the recorder to do the calculations and to print), and the enter button (paper feed).The screen of one of the computers is pictured below. Click on this image to link to screen shots of how to start, stop, calculate, and print a GC trace using the computer program.Retention Time (RT)The retention time, RT, is the time it takes for a compound to travel from the injection port to the detector; it is reported in minutes on our GCs. The retention time is measured by the recorder as the time between the moment you press start and the time the detector sees a peak. If you do not press start at the same time you inject your sample, the RT values will not be consistent from run to run.Factors which affect GC separationsEfficient separation of compounds in GC is dependent on the compounds traveling through the column at different rates. The rate at which a compound travels through a particular GC system depends on the factors listed below:∙Volatility of compound: Low boiling (volatile) components will travel faster through the column than will high boiling components∙Polarity of compounds: Polar compounds will move more slowly, especially if the column is polar.∙Column temperature: Raising the column temperature speeds up all the compounds in a mixture.∙C olumn packing polarity: Usually, all compounds will move slower on polar columns, but polar compounds will show a larger effect.∙Flow rate of the gas through the column: Speeding up the carrier gas flow increases the speed with which all compounds move through the column.∙Length of the column: The longer the column, the longer it will take all compounds to elute. Longer columns are employed to obtain better separation.Generally the number one factor to consider in separation of compoundson the GCs in the teaching labs is the boiling points of the differentcomponents. Differences in polarity of the compounds is only importantif you are separating a mixture of compounds which have widely differentpolarities. Column temperature, the polarity of the column, flow rate,and length of a column are constant in GC runs in the Organic ChemistryTeaching Labs. For each planned GC experiment, these factors have beenoptimized to separate your compounds and the instrument set up by thestaff.Procedure for GCGas ChromatographyGas Chromatography (GC) is used to separate volatile components of a mixture. A small amount of the sample to be analyzed is drawn up into a syringe. The syringe needle is placed into a hot injector port of the gas chromatograph, and the sample is injected. The injector is set to a temperature higher than the components’ boiling points. So, components of the mixture evaporate into the gas phase inside the injector. A carrier gas, such as helium, flows through the injector and pushes the gaseous components of the sample onto the GC column. It is within the column that separation of the components takes place. Molecules partition between the carrier gas (the mobile phase) and the high boiling liquid (the stationary phase) within the GC column.Top View of Oven and ColumnsTwo columns will fit insidethe oven of our GCs. Aheating element is used toraise the oven temperature,when desired, and thus raisethe column temperature. GCcolumns typically have ametal identification tagclipped onto the column thatlists column length anddiameter, what material isinside, and the maximumoperating temperature.After components of the mixture move through the GC column, they reach a detector. Ideally, components of the mixture will reach the detector at varying times due to differences in the partitioning between mobile and stationary phases. The detector sends a signal to the chart recorder which results in a peak on the chart paper. The area of the peak is proportional to the number of molecules generating the signal.To use the GC, follow these simple steps:1.Wash a syringe with acetone by filling the syringe completely and ejecting the waste acetone onto a paper towel. Wash 2-3 times.2.Pull some of your sample into the syringe. You will most likely need to remove air bubbles in the syringe by rapidly moving the plunger up and down while the needle is in the sample. Usually 1-2 L of sample is injected into the GC. It is okay to have small air bubbles in the syringe. However, you do not want to inject mostly air or your peaks will be too small on the chart recorder.3.Make sure the chart recorder is on and set to the appropriate chart speed (Arrow A). Set the baseline using the zero on the chart recorder (Arrow B). With the pen in place, turn on the chart (Arrow D), make sure the pen is down (marking the paper) and the paper is moving.ArrowA Set chart speed in cm/minArrow B Set zero so that the baseline is ~ 1 cm from bottom (right edge) of chart paperArrow C Record (but do not adjust) full scale settingArrow D Switch to turn movement of chart paper on and off.4.Inject your sample onto either column A or column B as instructed. Hold the syringe level and push the needle completely into the injector. Once you can no longer see the needle, quickly push the plunger and then pull the syringe out of the injection port.Injection Notes:A) The injectors are very hot, so be careful not to touch the silver disk.B)The needle will pass through a rubber septum, so you should feel some resistance. For some of our GC’s, the column does notalign properly in the injector, so the needle hits the front of the metal column. If you feel that you are pushing against metal, pull the needle out of the injector and try again, perhaps at a slightly different angle. The needle should completely disappear into the injector for proper injection of the sample onto the GC column.C)Inject quickly for best results. Do not hesitate to inject once the needle is properly positioned in the injection port.D)Remove the syringe immediately after injection. (Carrying out notes C and D helps to insure that all of the sample enters theGC column at approximately the same time.)5.Mark your injection time on the chart recorder. This can be done by adjusting the zero just after the sample is injected. It is often convenient for one person to inject the sample while a lab partner marks the injection time at the chart recorder.6.Clean your syringe immediately after injection. Syringe needles often clog quickly and must be replaced if they are not cleaned after each use.7.Record the settings of your chart recorder during a run. You need to know the chart speed and the full-scale setting.8.Record the settings of your GC during a run. A knob on the bottom center of the GC can be turned to read column (or oven) temperature, detector temperature, and injector port temperature in °C. The bridge current is displayed in mA. Note that there are two scales on the display. Be careful to read the appropriate scale!ArrowA Top scale is reported in milliamps and is used to read the bridge current.Arrow B Bottom scale is reported in degrees Celsius and is used to read all temperatures.Arrow C Typically the ONL Y knob to be adjusted by students. Knob is turned for corresponding reading on the scale above the knob.Arrow D Increasing the Attenuator setting decreases the area of a peak on the chart recorder. This knob should only be adjusted with permission of instructor. Always return the knob to its original setting if you are given permission to change it.Analysis of the Gas ChromatographReport the retention time of each peak (in minutes), the identity of each component in the mixture, and the percent composition of the mixture. To determine the percent composition, you will first need to find the area under each curve.Area = (height) x (width at ½ height)Mark retention time, height, half-height, and width at ½ height on your GC trace. Show your calculations either in your final report or directly on the chromatograph.You may assume that each component of the mixture causes the same response in thedetector. Therefore, the areas under the curves can be used to calculate percent composition of the mixture of alkenes. (This is a reasonable assumption when the components of the mixture are very similar in structure, as are 2-methyl-1-butene and 2-methyl-2-butene.)% Component 1 = [(area under peak 1)/(total area)] x 100%The sample used to obtain the GC trace that is shown above did not have any solvent in it. Student samples will have at least one solvent present, so you will see another peak in your GC traces that typically appears very soon (usually within a minute) after injection. It is normal for the solvent peak to go off scale.。
安捷伦气相色谱基础培训资料(课堂PPT)

转化为易挥发的液体和固体。 分析的有机物,约占全部有机物(约300万种)的20%。 6.不足之处:对被分离组分的定性能力较差。
8
1.4 色谱图及有关术语
• 从载气带着组分进入色谱柱起就用检测器 检测流出柱后的气体,并用记录器记录信 号随时间变化的曲线,此曲线就叫色谱流 出曲线,当待测组分流出色谱柱时,检测 器就可检测到其组分的浓度,在流出曲线 上表现为峰状,叫色谱峰。
载气 A
待分离组分
,和
B
C
D
5
分离的过程示意图
流动 相
样品
固定 相
Analytical Training Center
GCTECH 2-04
6
1.2 气相色谱法的定义和分类
定义:用气体作为流动相的色谱法称为气相色谱法。 分类:根据固定相的状态不同,气固色谱(GSC) (吸附原理)、
气液色谱(GLC) (分配原理) 气固色谱可用活性炭,硅胶,分子筛,高分子多孔小球等作
7
1.3 气相色谱法的特点
• “三高” “一快” “一广” 1.高效能:一般填充柱的理论塔板数可达数千,毛细管柱可
达一百多万。 2.高选择性:可以使一些分配系数很接近的以及极为复杂、
难以分离的物质,获得满意的分离。 3.高灵敏度:可以检测1011~1013g物质,适合于痕量分析 4.分析速度快:一个试样的分析可在几分钟到几十分钟内完
验条件的稳定情况。
• 2)峰高(h)和峰面积 : 色谱峰顶点与基线的距离
叫峰高。色谱峰与峰底基
线所围成区域的面积叫峰 面积。
10
3)保留值 a. 死时间(tM) :不与固定相作用的物质从进样到出现峰极大值时的
安捷伦气相色谱基础

电子部件 PC
载气 氢气 空气
气源与载气种类
对载气的要求如下:
1、 惰性(不与样品或固定相反应) 2、 气体扩散小,以提高柱效率 3、 容易得到并易纯化 4、 价格便宜 5、 满足检测器要求
常用载气:N2 H2 He Ar TCD 用氢气、氦气比较好,灵敏度高, FID 用氮气
辅助气:氧气或空气
气体的净化
管路:使用GC专用铜管, 使用前先用溶剂冲洗,载气吹干。
气流调节阀
• 通常在减压阀输出气体的管线中还要串联稳 压阀,用以稳定载气(或燃气)的压力
•
当用程序升温进行色谱分析时,由于色谱柱
柱温不断升高引起色谱柱阻力不断增加,也会使
载气流量发生变化。为了在气体阻力发生变化时
,也能维持载气流速的稳定,需要使用稳流阀来
种化合物的能力大于另一类,则认为这种固定液对于前一类
化合物有较高的选择性。人们最初用来描述和区别固定液分 离特性的方法是罗胥耐德(Rohrschneider)于1959年提出的相 对极性方法。他首先规定固定液β,β-氧二丙腈的相对极性为 100,角鲨烷为零, 选用正丁烯与正丁烷或环已烷与苯作为 物质对,然后分别测定物质对在氧二丙腈、角鲨烷以及被测 固定液柱上的相对调整保留值并取对数。
。
• 两相:固定相和流动相 • 具体到气相色谱: • 固定相就是色谱柱(column),流动相就是气
体或者称为载气(carrier gas )。 • 差异就是指分配系数的差异。
色谱过程示意图
载气 A
待分离组分
,和
B
C
D
分离的过程示意图
流动 相
样品
固定 相
Analytical Training Center GCTECH 2-04
气相色谱基本原理(精)

Indicating O2 Trap P/N 3150-0528
Fundamentals of Gas Chromatography Definitions:
Solubility Volatile Vaporize Carb and Choke Cleaner Gas Line anti-freeze - Methanol; Water is soluble in methanol - both are polar - In GC or LC polar compounds are separated on polar stationary phases.
CARRIER GAS
DETECTOR
PRESSURE OR FLOW CONTROLLER DETECTOR TEMPERATURE 300 O C
TANK PRIMARY PRESSURE - 2000 PSI SECONDARY - 100 PSI
COLUMN OVEN TEMPERATURE
Pneumatic Fundamentals Recommended GC Carrier/Makeup Gas Plumbing
Gas Purity 99.9995% Minimum Purity
NO LEAKS!!!
1/8” Copper Tubing P/N 5180-4196
Moisture Trap P/N 5060-9084
Identify - Qualitative - What is it? Measure - Quantitative - How much?
6850/90 - SPLIT/SPLITLESS CAPILLARY INLET Capillary Column Stationary Phases
气相色谱仪结构原理

气相色谱仪结构原理气相色谱仪(Gas Chromatograph,GC)是一种广泛应用于化学、药物、食品、环境等领域中的分离和分析仪器。
其基本原理是利用样品在气相(载气)中的分配系数差异,通过微量分离和移动的方法,将混合物中的组分分离开来并进行定量检测。
1.进样系统:进样系统负责将样品引入色谱仪中,进样量的精确控制对分析结果的准确性至关重要。
进样系统主要包括进样装置、进样口和进样器。
进样装置可以是液体自动进样器或气体自动进样器。
样品通过注射器进入进样容器,然后进入柱箱。
2.柱箱:柱箱是气相色谱仪中用于分离混合物成分的核心部分,柱箱一般包括柱子、柱温控制系统和载气分配系统。
柱子是一个长而细的管道,通常是由包覆固定化的液相(固定相)的管道构成。
样品分离过程主要发生在柱子内部。
3.载气系统:载气是在柱子内部传递样品的介质,它的选择对分离结果和灵敏度等重要指标有很大的影响。
常用的载气有氮气、氢气和氦气等。
载气系统包括载气瓶、压力调节器、流量计和气动阀等。
其中,压力调节器常用来控制载气的压力,流量计用于测量和调节载气的流速。
4.检测器:检测器通过检测柱子输出的物质信号来实现对样品成分的定量检测。
常用的检测器有火焰离子化检测器(FID)、电子捕获检测器(ECD)、氮磷检测器(NPD)、热导检测器(TCD)等。
不同的检测器具有不同的检测原理和特点,广泛应用于分析不同性质的样品。
5.数据处理系统:数据处理系统主要用于采集、处理和分析检测器输出的信号。
数据处理系统包括模拟信号转换为数字信号的模数转换器(A/D转换器)、数据采集卡以及计算机等。
数据处理系统能够实时记录并显示样品分析的结果,并进行数据处理和分析。
6.控制系统:控制系统主要用于控制进样系统、柱箱温度控制系统、载气系统和检测器等部分的工作状态和参数。
通过控制系统,可以实现对整个气相色谱仪工作过程的自动化控制和监控。
总结起来,气相色谱仪的工作原理是将样品由进样系统引入柱箱,经过柱子内部的分离过程,由载气带动各组分逐一通过检测器进行检测并输出信号,再由数据处理系统采集和处理信号,最后通过控制系统控制和监控整个仪器的工作过程。
气相色谱原理与方法

气相色谱原理与方法气相色谱(Gas Chromatography,简称GC)是一种高效、高分辨率的色谱分离技术,广泛应用于各个领域,如化学分析、环境监测、食品安全等。
其原理是将待分析样品的组分在高温下蒸发为气体态,然后通过色谱柱进行分离和定性定量分析。
1.揮发性:气相色谱只适用于揮发性物质的分离,因为需要将样品蒸发成气体态。
样品中较揮发性物质越多,分离效果越好。
2.分隔:样品气体态进入色谱柱后将与固定相发生相互作用,根据样品分子与固定相的相互作用大小不同,使各组分在色谱柱中停留时间不同,从而实现分离。
3.检测:分离后的组分将进入检测器进行检测,常用检测器有火焰离子化检测器(FID)、热导检测器(TCD)、电子捕获检测器(ECD)等。
气相色谱方法:1.样品制备:将待分析的样品加入适当的溶剂中,通过溶解或提取的方式制备成气态样品。
常用的样品制备方法包括固相微萃取(SPME)、液-液萃取、固-液萃取等。
2.色谱柱选择:选择合适的色谱柱是气相色谱分析的关键,常用的色谱柱有非极性柱、极性柱、手性柱等。
根据待分析样品的性质和目标分析物的特点选择合适的色谱柱。
3.色谱条件设置:色谱条件的设置对于气相色谱分析的结果具有重要影响,主要包括载气选择、流速设定、进样方式、柱温设定等。
需要根据实际分析要求进行优化和调整。
4.检测器选择和设置:根据需要测定的目标物质的特点选择合适的检测器。
常用的检测器有FID、TCD、ECD等。
并根据待测样品的性质进行检测器的参数设置。
5.数据分析:将分离和检测得到的色谱峰进行峰面积或峰高的计算,并与标准曲线进行比对,确定目标物质的浓度或定性分析。
气相色谱的优点:1.分离效果好:气相色谱技术可以将复杂的混合物分离成单一组分,提高分析的灵敏度和准确度。
2.分析速度快:气相色谱分析时间较短,可以在数分钟内完成一次分析,适用于高通量的分析需求。
3.灵敏度高:气相色谱联用高灵敏度的检测器,对待测物质有较低的检出限。
安捷伦顶空气相色谱

安捷伦顶空气相色谱:准确、高效、可靠的分析方法安捷伦顶空气相色谱(Agilent Headspace Gas Chromatography,简称HS-GC),是一种快速、准确、高效的气相色谱技术,主要用于分析挥发性有机化合物的成分和含量。
相比传统的溶剂萃取、反渗透和萃取等技术,顶空气相色谱具有分离度高、分析速度快、准确度高等优点,因此得到了广泛的应用。
安捷伦顶空气相色谱的原理是通过高纯度惰性气体(如氮气或氦气)将样品中的挥发性有机化合物赶出,并集中在顶空瓶的头空中,然后将头空中的样品进样到气相色谱仪中进行分析。
顶空气相色谱的分离原理与普通气相色谱相同,基于化合物在固定相和流动相之间的分配系数不同而实现分离。
不同之处在于其样品处理方式更为简单、高效,且可以在无需特殊处理的情况下直接对样品进行测定。
安捷伦顶空气相色谱的应用非常广泛。
首先,它可以用于食品、药品、化妆品、含氧化合物、溶剂残留等样品中分析挥发性成分的含量和种类,以检测产品质量和安全性。
例如,用来检测食品中的挥发性香味成分、药品中的挥发性治疗成分、化妆品中的挥发性香料成分和含甲醛类挥发性有机化合物的产品中的残留量等。
另外,安捷伦顶空气相色谱还可用于环境监测、石油化工、建筑装饰材料等领域,以检测空气中和水中的挥发性有机物质、油品和石油化工产品中的挥发性成分含量、建筑装饰材料中的有害物质含量等。
安捷伦顶空气相色谱的优点不仅在于其快速、准确的分析速度和分离度,还在于其操作简便、重复性好、自动化程度高等特点。
在试样的制备方面,只需要将样品装入顶空管中并进行加热、搅拌,即可将样品的挥发性化合物赶出并收集到顶空空间中,从而避免了传统处理样品的繁琐过程。
在分析过程中,自动化的进样和精密的控制系统可以实现多样品连续分析,无需人工干预,大大提高了工作效率和准确性。
在实际操作中,需要根据不同的样品性质选择适当的顶空气相色谱分析条件,包括样品加热温度、顶空时间、顶空头空体积、流量、进样模式等参数。
《气相色谱基本原理:理论篇》

成就
您的科学探索之路
安捷伦与您一路同行
安捷伦内部材料 2015 年 2 月 1 日 1
安捷伦致力于为教育事业贡献力量, 愿意无偿提供公司拥有的技术培训 材料。
这组幻灯片由安捷伦科技公司制作,仅可用于教学目的。 如果您希望将其中的图片、示意图或绘图用于其他任何目 的,请事先与安捷伦科技公司取得联系。
选择性 因子 保留 程度因子
柱效因子
我们可以通过优化下述任何一个参数来改善分离度:
• 选择性因子对分离度影响最大。选择性因子的微小改变也会导致分离度发 生重大变化
• 保留程度因子在 k 值较小时才有显著影响
• 柱效因子描述了色谱柱的分离能力
TOC
仅用于教学目的 2015 年 2 月 10 日 15
关键参数
TOC
仅用于教学目的 2015 年 2 月 10 日 24
Van Deemter 方程
载气
N2
载气的线性速度(流速)取决于 色谱柱温度。当柱头压恒定时, 线性速度随温度升高而降低。载 气平均线速度 (u) 对柱效的影响可 以利用 van Deemter 方程曲线加 以充分说明。
理论塔板的折算高度 (h)
前言
色谱柱内部的作用原理
气相色谱利用气体流动相使样品通过色谱 柱,色谱柱内部含有填充物或者其内表面 有涂层。在多数情况下,相比液相色谱柱, 气相色谱柱的内径更小,柱长更长。 当气相色谱柱受热后,化合物将根据沸点 开始进行分离。当色谱柱的固定相换成 极性固定相后,色谱柱的分离能力也随 之改变。沸点和化合物极性共同影响化 合物的分离。
TOC
仅用于教学目的 2015 年 2 月 10 日 9
关键参数
选择性或分离因子 (α)
