JT-100A型多功能计数器ppm计使用说明
计数器计米器安全操作及保养规程

计数器计米器安全操作及保养规程计数器和计米器是目前工业生产中广泛使用的计量设备,它们在生产过程中起到了重要作用。
然而,由于使用不当或者维护不当等原因,这些计量设备也有可能出现安全事故,对生产带来严重的影响。
为了保障人员的生命财产安全,以下是计数器计米器在安全操作和保养方面的规程。
安全操作规程1. 使用前阅读说明书在使用计数器计米器前,请仔细阅读它们的说明书,了解设备的功能、特点和操作方法,确保您能够正确使用这些计量设备。
2. 给计数器计米器配备状态指示器使用计数器计米器的过程中,我们需要时刻关注设备状态。
为了方便使用者观察设备的状态,需要给计数器计米器配备状态指示器。
使用者只需要观察指示灯的亮灭状态,就能了解设备是否正常工作。
3. 定期进行设备检查和维护在正式使用计数器计米器之前,需要进行多项检查,如检查电源线是否损坏、检查接线是否牢固等。
此外,为了保证设备的正常运行,还需要定期进行维护,如清洁设备、更换零部件等。
4. 使用适当的工具和配件在使用计数器计米器时,请使用适当的工具和配件。
不要随意更换或者使用其他工具,以免发生意外事故。
5. 合理安放计数器计米器在使用计数器计米器时,需要将其放置在干燥、通风良好的地方,并且要避免与其他设备和物品摩擦。
此外,在使用计数器计米器过程中,需要注意设备的重心,避免重心不稳或者发生摇晃的情况。
6. 避免将计数器计米器放置在易燃、易爆的环境中如果计数器计米器被放置在易燃、易爆的环境中,就会面临着严重的安全隐患。
因此,在使用这些设备的过程中,需要将它们放置在安全的地方,避免发生安全事故。
保养规程1. 定期清洁设备计数器计米器使用一段时间后,会积聚一定的灰尘和污垢,影响设备的正常运作。
因此,在设备使用过程中,需要定期进行清洁,保持设备的清洁和整洁。
2. 定期更换零部件在计数器计米器使用过程中,由于工作条件的限制,设备上某些零部件可能会磨损或者失效。
因此,在设备使用过程中,需要定期检查设备的零部件,出现明显磨损、老化或者失效的情况,就需要及时更换,确保设备正常运作。
1 计数仪表 中文操作说明书

计数仪表中文操作说明书一.设定说明及参数描述1-1最大称量及感量设定说明1)按【累计/保存】键开机,进入称量设置。
2)方式一:按【清除/HI】或【列印/LO】键切换至各个常见称量,按【③/重示】或【扣重/④】键左右移动小数点,按【取样】键选择单位kg或g或lb。
方式二:若常见称量无所需称量,则按【净毛重/设置】键进入自由称量设置,窗口最左边数字闪烁。
按【③/重示】或【扣重/④】键左右移位,按【清除/HI】或【列印/LO】键修改数值或按相应的数字键进行修改;当移动到小数点闪烁时,按【清除/HI】或【列印/LO】键选择小数点的位置。
按【取样】键选择单位kg或g或lb。
修改完成后如果按【累计/保存】键则会保存并进入到感量设置。
按【歸零/ESC】键则会返回至称重状态。
3)称量设置完成后进入感量设置。
4)方式一:按【清除/HI】或【列印/LO】键选择常用感量,按【③/重示】或【扣重/④】键左右移动小数点。
5)方式二:若常见感量无所需感量,则按【净毛重/设置】键进入自由感量设置(按照最小刻度1/2/5原则来设置),窗口最右边数字闪烁。
按【③/重示】或【扣重/④】键左右移位,按【清除/HI】或【列印/LO】键修改数值或按相应的数字键进行修改;当移动到小数点闪烁时,按【清除/HI】或【列印/LO】键选择小数点的位置。
修改完成后如果按【累计/保存】键进入到校正状态。
按【歸零/ESC】键则会取消当前设置,并回到称量设置。
6)感量设置完成后进入校正。
如果按【扣重/④】键则会进入校正,按【歸零/ESC】键则退出校正并返回秤重状态。
1-2功能设定1)按【净毛重/设置】键开机或在称重状态下长按【净毛重/设置】键进入参数设定。
2)按【③/重示】或【扣重/④】键可循环选择参数。
3)按【净毛重/设置】键则进入参数选项。
4)按【③/重示】或【扣重/④】键键循环选择参数选项。
5)按【累计/保存】保存修改内容并返回参数选项或者按【归零/ESC】键不变更设置返回参数选项。
数字万用表的使用方法之欧阳理创编
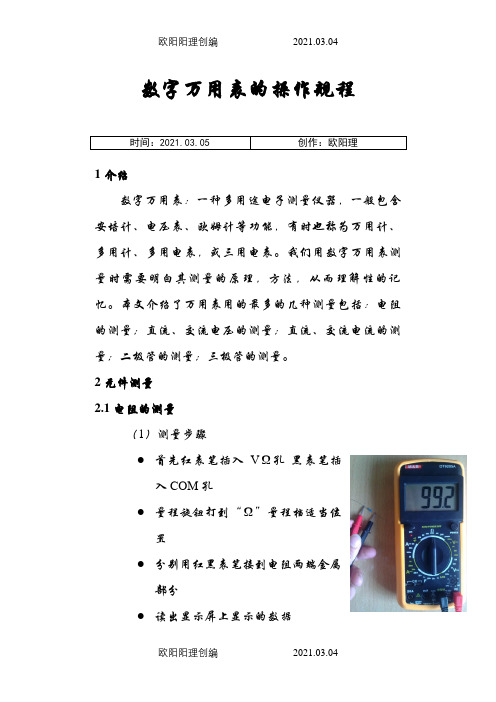
数字万用表的操作规程时间:2021.03.05 创作:欧阳理1 介绍数字万用表:一种多用途电子测量仪器,一般包含安培计、电压表、欧姆计等功能,有时也称为万用计、多用计、多用电表,或三用电表。
我们用数字万用表测量时需要明白其测量的原理,方法,从而理解性的记忆。
本文介绍了万用表用的最多的几种测量包括:电阻的测量;直流、交流电压的测量;直流、交流电流的测量;二极管的测量;三极管的测量。
2 元件测量2.1 电阻的测量(1)测量步骤●首先红表笔插入VΩ孔黑表笔插入COM孔●量程旋钮打到“Ω”量程档适当位置●分别用红黑表笔接到电阻两端金属部分●读出显示屏上显示的数据(2)注意●量程的选择和转换。
量程选小了显示屏上会显示“1.”此时应换用较之大的量程;反之,量程选大了的话,显示屏上会显示一个接近于“0”的数,此时应换用较之小的量程。
●如何读数?显示屏上显示的数字再图1 测电阻加上边档位选择的单位就是它的读数。
要提醒的是在“200”档时单位是“Ω”,在“2k~200k” 档时单位是“kΩ”,在“2M~2000M”档时单“M”。
●如果被测电阻值超出所选择量程的最大值,将显示过量程“1”,应选择更高的量程,对于大于1MΩ或更高的电阻,要几秒钟后读数才能稳定,这是正常的.●当没有连接好时,例如开路情况,仪表显示为“1”●当检查被测线路的阻抗时,要保证移开被测线路中的所有电源,所有电容放电.被测线路中,如有电源和储能元件,会影响线路阻抗测试正确性。
●万用表的200MΩ档位,短路时有10个字,测量一个电阻时,应从测量读数中减去这10个字。
如测一个电阻时,显示为101.0,应从101.0中减去10个字.被测元件的实际阻值为100.0即100MΩ。
2.2直流电压的测量(1)测量步骤●红表笔插入VΩ孔●黑表笔插入COM孔●量程旋钮打到V-或V~适当位置●读出显示屏上显示的数据(2)注意●把旋钮选到比估计值大的量程档(注意:直流档是V-,交流档是V~)接着把表笔接电源或电池两端;保持接触稳定。
JT系列电子天平使用说明书

JT系列电子天平使用说明书上海精天电子仪器有限公司JT系列基本技术指标注:检定分度值用e表示,实际分度值用d表示,1e=10d使用方法◎ 准备1、将天平安放在稳定及水平的工作台上,避免振动、气流、阳光直射和剧烈的温度波动;2、安装称盘;3、接通电源前请确认当地交流电压是否与天平所附的电源适配器所需电压一致;4、为获得准确的称量结果,在进行称量前天平应接通电源预热30分钟。
◎ 电源V ~ 50Hz1.天平随机附配交流电源适配器,输入220+22-33输出9V 300mA2.天平选用电池供电时可打开天平底部的电池盖按极性指示装入电池即可,建议使用9伏碱性电池,可连续工作约12小时。
当天平电池供电时,显示屏左上角电量指示框显示段数表明电池的状态(显示3段:电池充足,显示0段:电池耗尽),当电池电量将耗尽时,最后一个显示段闪烁。
◎ 开机在称盘空载情况下按<开/关>键,天平依次进入自检显示(显示屏所有字段短时点亮)、型号显示和零状态显示,当天平显示零状态时即可进行称量;当遇到相关功能键设置有误无法恢复时,按<开/关>键重新开机即可恢复初始设置状态。
◎ 校准为获得准确的称量结果,必须对天平进行校准以适应当地的重力加速度。
校准应在天平预热结束后进行,遇到以下情况必须使用外部校准砝码对天平进行校准。
1.首次使用天平称量之前;2.天平改变安放位置后。
校准方法与步骤:1.准备好校准用的标准砝码并确保称盘空载;2.按<去皮>键:天平显示零状态;3.按<校准>键:天平显示闪烁的CAL—XXX,(XXX一般为100、200或其它数字,提醒使用相对应的100g、200g或其它规格的标准砝码)4.将标准砝码放到称盘中心位置,天平显示CAL-XXX,等待几秒钟后,显示标准砝码的量值。
此时移去砝码,天平显示零状态,则表示校准结束,可以进行称量。
如天平不零状态,应重复进行一次校准工作。
JT系列天平使用说明书

JF/JT系列精密电子天平使用说明书余姚市金诺天平仪器有限公司一、概述本使用说明书用于JF/JT系列多功能电子天平。
JF/JT系列多功能电子天平是金诺天平仪器有限公司最新开发研制的新一代产品。
JT系列采用特种合金材料一次加工成型的单体高精度传感器结合先进的电子微机技术JF系列采用高精度电磁力平衡传感器。
使得测量结果精确性更高,响应速度更快,故障更少。
JF/JT系列多功能电子天平具有:✧称量快。
称量速度比一般天平快几倍,而且可以调速;✧操作简单易学,质量单位转换,JF/JT系列多功能电子天平的软件系统为用户提供了可任意选择单位的功能,用户可任意选择软件提供的多种国际上常用的质量单位(见质量单位转换);✧高智能化。
可在全量程范围内去皮,清零,累计,超载,欠载显示,故障报警;✧具有技术功能等多种功能可供选择;✧内装有RS-232接口,可与打印机、计算机等外部设备相联;二、安装1、拆箱请小心的打开包装箱,将天平及箱内物品轻轻取出,将包装材料保存好,以备再用。
箱内物品:⑴天平主机(JT1003 JT2003 JT3003 JT5003 JF3104 JF2104 JF2004 JF1604 JF1104 JF1004)⑵秤盘(3) 电源线(交流适配器)(4) 使用说明书(5) 检定证书(6) 保修卡(7)砝码图一称盘水平调节脚水平泡适配器插空RS232接口2、工作环境的选择JF/JT系列多功能电子天平在常规实验室或工业计量室条件下进行称量时,可加快称量速度,提高称量精度。
若条件不允许,应按下面的要求选择工作环境:⑴工作室应保持清洁、干燥;⑵天平应放置在一平稳、固定的工作台上;⑶工作台应远离门窗,这样可减少因开窗开门而产生的气流的影响;⑷ 工作台应设置在受振动干扰少的地方。
房间的四周受振动影响较小,是放置工作台的理想位置;⑸ 天平应放置在避免阳光直射和远离发热器等易引起温度变化的地方; ⑹ 应使天平远离带有磁性或能产生磁场的物体及设备; ⑺ 不得在具有爆炸性危险的区域内使用天平;⑻ 不得长时间在高湿度或高粉尘的环境中使用天平;⑼ 最佳环境温度为20摄氏度±5摄氏度,最佳湿度为50-60%RH ; ⑽ 当天平从一较冷环境转移到另一较暖的环境时,空气中的水分会在天平的内部凝结,以致于影响称量的精确度和可靠性。
计数器说明书2
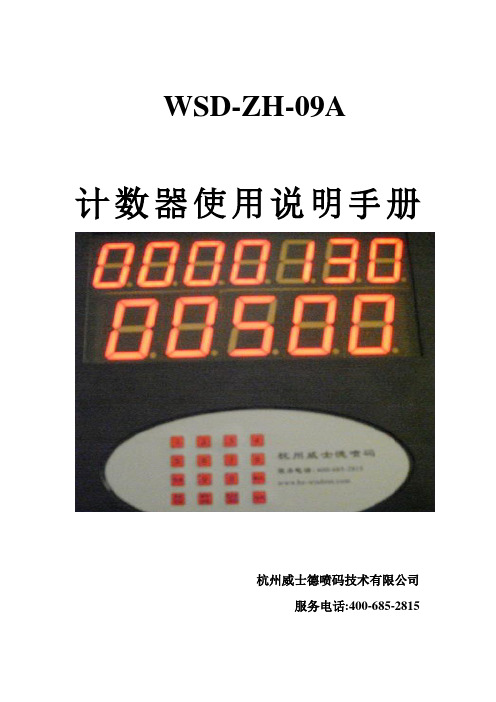
WSD-ZH-09A计数器使用说明手册杭州威士德喷码技术有限公司服务电话:400-685-2815杭州威士德喷码技术有限公司是专门经销和生产喷码设备和耗材的一家优秀企业,从事喷码行业多年,有着非常丰富的经验。
为了适应广大用户的生产需求,特为水泥行业开发WSD-ZH-09 型计数器,该计数器使用简单,计数准确,使用方便,可以用一台主机最多连接12个计数器窗口,可在不同的地方随时观察计数数值,子窗口链接距离1000米。
可减少人工计数人员的工作量,降低误差,以一个年产100万吨的水泥厂为例,0.5%的误差是(1000000吨*20包/吨*0.5%)=100000包,这样的误差对于水泥企业来说无疑是巨大的,还容易造成企业利益流失及客户信任度下降。
设备面板显示:上面7位数码管为计数总和,总计数为9999999,可自动循环计数。
下面一行为单次车装量,最大值为59999。
使用方法:开机显示:月份日期星期以及时间1.时间的设定:当时间不准确时请按累加数/时间键,机器将显示年二位。
月二位,日二位,星期一位,空一位,小时二位,分钟二位。
如:2009年2月27号星期五9:55分,将显示成:按正确的数字键将修改闪烁那位的数字并前进一位,如有错误可按取消键退格。
最后按确认修改保存,回到初时时间界面。
如不保存只能关电源。
2.计包学习:本产品可以适应任何长度、任何流水线速度的包装产品的计数,主要是通过计包学习来完成的,通过对水泥厂的流水线进行速度和包长的综合检测,当设备安装完成(即接近开关和红外感应检测都正常)后,先必须进行计包长度学习。
按清零/学习键,屏幕将出现表示第一次学习(按取消可退出),开动流水线,让包过红外对管,此时屏幕下行会出现一数字,如:07 08。
07表示接近开关的计数值,08表示光电开关的计数基值。
此数字表示一包在红外对管接收到信号时接近开关翻转次数,建议此数据要大于5小于16,按确认完成,这时候会出现表示第二学习,共学习四次,每次按确认完成。
计量检测仪器操作规程
计量检测仪器操作规程广州市食品有限公司文件编号:QJ3-RL-001-A编制:质技部审核:批准:2011年11月06日发布实施目录1.分析天平---------------------------------------------------------------------------------12.计量容量分析仪器─滴定管、移液管、容量瓶---------------------------------43.电子称------------------------------------------------------------------------------------104.恒温干燥箱------------------------------------------------------------------------------105.马弗炉------------------------------------------------------------------------------------ 12分析天平1. 概述:1.1用途:用于精密称量1.2环境要求:天平室内温度应保持在20±2℃,避免阳光晒射及涡流侵袭或单面受冷受热,室内要求干燥。
1.3使用者要求:掌握分析天平的使用方法,天平的使用规则、天平的维护和保养等。
2.使用前检查及准备工作:2.1称量前,先将天平罩轻轻取下,折叠整齐后放在天平箱左后方的台面上。
操作者面对天平端坐,记录本放在胸前的台面上,存放或随称量物的器皿放在天平箱右侧,然后再作如下的检查和调整。
2.2了解待称物品的温度与天平箱里的温度是否相同。
如果待称物体曾经加热或冷却过,必须将该物体放置在干燥器,待该称量物的温度与天平箱的温度相同后再进行称量。
2.3检查天平的各个部件是否都处于正常位置,主要察看的部件是横梁、吊耳、称盘和挂环码等,指数盘是否对准零位,砝码是否齐全。
综合物性测量系统(PPMS)操作规范(写写帮推荐)

综合物性测量系统(PPMS)操作规范(写写帮推荐)第一篇:综合物性测量系统(PPMS)操作规范(写写帮推荐)综合物性测量系统(PPMS)操作规范1.检查样品室内是否有样品,如有则取出并将测量线取下,取消上次测量的Option;(参阅第9步)2.下拉Utilities 菜单,选择Activate Option;3.点击Connection Diagrams, 点击所要测量的选项,查看连线图,按照图示连接相应的测量线;4.选择测量选项,并将其激活(Activate),被激活的选项会弹出Control Centre 窗口;5.使用Control Centre中的Install下的命令,按照提示装卸样品;6.打开一个数据文件以便保存数据;7.用单步测量调试测量参数;8.编辑Sequence 并运行;9.升温至300K(Stable),磁场设为0,等待30分钟, 取出样品,Deactivate测量选项;10.下拉Instrument 菜单,选择Shut Down。
注意事项:1.不要随意靠近杜瓦瓶,注意磁卡、手表、手机等要取出放在安全地点。
2.装卸样品过程中要注意及时盖上样品室上盖,并Purge & Seal。
3.PPMS 高度集成化,部件设计很精密,要轻拿轻放。
4.如果你不懂某些命令的真正含义,千万不要尝试去执行它。
5.遵守操作程序。
第二篇:OA系统应用操作规范(模版)OA系统应用操作规范总则 1.OA系统介绍XXXXX有限公司OA系统采用的是XXX科技有限公司研发的OA 增强版V8.0,OA系统的运用目的是为了促进信息传递,减少办公成本,为信息共享提供多种途径,促进公司信息化建设。
2.OA系统功能模块包括 2.1个人信息设置2.2审批管理:本系统的重点模块,包括申请管理、审批裁决、检索查阅。
2.3资料柜子:共享文件信息存放模块2.4社区中心:公司内部BBS论坛2.5协同办公:本系统的另一个重点模块3.OA系统审批管理中的表格类别目前系统中的文件分类3.1行政类:本类表格适用行政管理,人事管理,资产管理范畴3.2费用类:本类表格适用财务费用管理 3.3报告类:通用报告类别3.4运控管理类:适用于运控部监督检查3.5车管类:适用与公司于车辆相关表格第一章目的、职责1.目的:规范在OA系统中的应用操作,提升对OA系统的整体认知程度,减少失误和选择错误从而影响审批进度和耽误时间。
多功能数显表使用说明书
多功能电力监测仪使用手册版本:杭州正普科技有限公司使用前必读在您使用本产品之前,请务必仔细阅读此使用手册内容,正确按照用户手册指导操作,这会有助于您更好地使用本产品,并有助于解决现场出现的各种问题。
1、监测仪在施加工作电源之前,务必确保工作电源在仪表规定范围之内;2、现场安装使用时,电流输入端子严禁开路,电压输入端子严禁短路;3、通讯端子(RS485)严禁施加高压;4、使用时仪表接线方式务必与内部系统设置方式一致;5、与后台通讯时,仪表通讯参数务必与后台一致;不能带电拔插通信接口;6、本手册中的信息如有变动,恕不另行通知;我公司自始至终本着“质量第一服务第一”的宗旨,将以优质的产品、优良的服务奉献给国内外用户!●使用前请仔细阅读本用户使用手册●请注意妥善保存目录一、概述-------------------------------------------------- 1二、型号定义---------------------------------------------- 1三、尺寸对照表-------------------------------------------- 1四、型号与功能对照表-------------------------------------- 2五、技术指标---------------------------------------------- 3六、外形及安装尺寸---------------------------------------- 4七、接线图------------------------------------------------ 6八、操作说明----------------------------7(RS485通讯规约、CT/PT设置、开关量操作、变送输出操作)一、概述多功能电力监测仪具有对电网中电流、电压、频率、有功功率、无功功率、视在功率、电能、功率因数等进行同时测量的功能。
百特数显表操作方法之欧阳道创编

百特智能数显表说明书工作状态下按SET显示LOCY→按SET输入密码18→按SET显示RAN9→按SET通过△▽选择分度号→按SET显示Poin设置小数点→按SET显示r9.00设置量程下限→按SET显示r9.FS设置量程上限工作状态下按SET→通过△▽选择COrr按SET显示old.1→按SET通过△▽修正温度值参数设定说明:Locy:菜单上锁操作入口;按SET键确认;按△▽键退出;开锁密码为18Ran9.:分度号和量程设置入口;按SET键确认;按△▽键退出010/…/y:分度号设置;按△▽键设置;按SET确认PoIn:小数点位置设置;按△▽键设置;按SET确认R9.00:量程零点设置;按△▽键设置;按SET确认R9.FS:量程满度设置;按△▽键设置;按SET确认Corr:量程迁移和滤波时间设置菜单入口;按SET 键确认;按△▽键取消Old.1:修正温度值;按△▽键设置;按SET确认按键说明:△:变更参数设定时,用于增加数值SET:参数设定确认键▽:变更参数设定时,用于减少数值常见故障处理:仪表通电不亮:供电电源未接入,正确接入仪表电源;接触不良,取出表芯确认弹片接触是否良好。
LED屏显示:broy分度号选择错,选择与输入信号相符的分度号;输入信号太大,调节与输入信号保证在仪表范围内;信号短线,正确接入信号线。
H.oFL.分度号选择错,选择与输入信号相符的分度号;输入信号太大,调节与输入信号保证在仪表范围内;仪表标定错误,选择正确标定信号重新标定。
L.Ofl.:选择与输入信号相符的分度号;输入信号太小,调节与输入信号保证在仪表范围内;仪表标定错误,选择正确标定信号重新标定昌辉SWP系列智能仪表说明书控制方式:1、正确的接线仪表卡入表盘后,请参照仪表随机接线图接妥输入、输入及电源线,并请确认无误。
2、仪表的上电本仪表与电源开关,接入电源即进入工作状态。
3、仪表设备号及版本号的显示仪表在投入电源后,可立即确认仪表设备号及版本号。
PM100 多功能电力表 说明书
直入 55~600 V 無外接 PT=1
則 PT 比值設定 0001.0 倍
電流比值(CT) 設定範圍 0~60000 如:1000/5A CT=1000÷5=200
則 CT 比值設定 00200 倍
4.3 舉例說明
例 1.系統為 3P3W PT:22KV / 110V CT:1000A / 5A 換算 W=38.10MW PT=200 倍 CT=200 倍 顯示:22.00KV 1000A 38.10MW 參數設定 進入選單 DISPLAY 按 Enter 鍵進入以下設定
3P4W
Enter
00001
Enter
V
Enter
8888.8
Enter
00001
Enter
88.888
Enter
KW
Enter
88.888
RS-485
Enter BAUD
9600
PULSE
Enter DO1
4-20
Enter CH1
RELAY
Enter CH1
FAC CODE Enter FUN
00
按→鍵切換 KW/MW
按→鍵切換 (注意小數點移位)
參考第 13 頁通信設定說明
參考第 7 頁 PULSE 設定說明
參考第 9 頁 4-20 設定說明
參考第 11 頁繼電器設定說明
進階設定(工廠設定用)
按→鍵切換 NO-YES 選擇是否儲存
按↑鍵改數字;按→鍵移位 輸入 0088 密碼 按 Enter 儲存設定 (PS:出廠密碼預設 0088,修改請參考 5 頁說明)
7.1 功能介紹..-------------------------------------------------------------------------------------------------------------------------10
浓度计说明书

前言本浓度计采用国际先进技术,可以测量所有大管径流动液体的浓度及流速,尤其适用大型挖泥系统的浓度、产量检测。
本系统由以下三部分组成:一.检测:1.电磁流速传感器2.密度传感器3.放射源二.信号处理:两次处理机三.附加设备:打印机及其他选用设备简单工作原理:示意图放射源发出的射线经过管壁、液体而衰减,并随着液体浓度增加而减少。
传感器(探头)收到信号放大后送交两次处理机,两次处理机通过合理的计算处理最后输出及显示实时浓度及产量,同时输出数据到计算机进行报表等处理。
第一章放射源一.放射源简介:1.射线种类:γ源2.核素:铯——1373.数量: 一个4.标称活度:1500mCi5.建议工作年限:30年6.供应商:放射源放置于安全屏蔽的源罐中,源罐由三层金属制成,内层为带空腔的屏蔽铅罐,空腔即放置放射源,其唯一的开口保证只有所需方向及角度能射出不经屏蔽衰减的放射线,其唯一开口处有可控制的活门控制放射线射出与屏蔽。
中间层由不锈钢制成,保证在高温高腐蚀情况下即使超过铅的溶点也不会遭致放射线的泄露。
外层由防腐蚀金属材料制作,使源罐自成整体便于安装和运输。
二.放射源管理:1.本系统应装置于专门区域内并指定专人使用,操作人员在源周围一米范围内的工作时间应控制在10小时/周内。
(符合国家标准规定的居民安全剂量标准)一米以外不受限制。
2.放射源不能和易燃易爆物品放在一起,原始说明书和源罐钥匙应由用户安全部门保管。
3.放射源使用许可证由最终用户申请使用。
4.放射源开启时严禁在面对放射源的方向停留。
5.发生恶性事故应及时报告卫生监督、公安部门。
三.废源处理:废源的处理及回收由最终用户自行解决,其方式方法应符合国家有关规定,发生费用由最终拥护承担。
四.技术参数:1.放射源出射角:10度2.剂量标准:《2μSv/h3.极限温度:+2500C4.外包装:钢材、涂黄色油漆,红色放射线警告标志5.屏蔽材料:铅6.屏蔽标准:GB4076-83、GB4792-837.重量:〈=150公斤放射源的制作规范、射线泄漏量均由国家专门机构检测,保证符合国家安全规范,保证书在交货时交给最终用户第二章密度传感器密度传感器密度传感器有极高的灵敏度,可以感知γ射线的微小变化,密度传感器由碘化钠晶体、光电备增管、前置线路组成,安装在防水耐腐蚀的不锈钢圆筒内,其整体安装在专用支架上,探测放射源射线的变化,因整体的密封性能保证传感器可以长期可靠的工作,但:1.因碘化钠晶体、光电倍增管中有玻璃材料,所以应轻拿轻放不能摔跌。
Pencel压力计(PPMT)说明书

1 INTRODUCTIONThe Pencel pressuremeter (PPMT) consists of a cy-lindrical probe of 1.35-inch diameter, containing an expandable flexible membrane connected to the unit through tubing and the pressure and volume gauges for recording data (Fig. 1). PPMT Probe is lowered into the soil to produce in situ stress-strain respons-es. The soil response curve can be interpreted to ob-tain fundamental soil properties and design parame-ters, such as strength, stiffness and in-situ horizontal stress. PPMT probe can be connected to standard cone penetration test (CPT) rods enabling a large number of PPMT tests to be conducted within a site (Briaud & Shields 1979 ). Based on the proper cali-bration and pushing to the desired depth the test is conducted by manually recording data from analogue pressure and volume gages that can be difficult to read. The pushed-in PPMT allows engineers to effi-ciency use reduced stress-strain data to determine lift-off pressure (p 0) elastic moduli (E) and limit pressure (p L ) (Briaud & Shields 1979 ), (cosentino 1987) and (Messaoud 2008) that can be used for ge-otechnical analysis and design; In addition to classical geotechnical applications, Cosentino & Briaud (1989) developed procedures for using the (PPMT) in pavement design.The current PPMT as distributed by ROCTEST® consists of three main parts, the operators control unit supported on a tripod stand and placed at the ground surface, the probe inserted into the soil and the tubing connecting the probe to the readout unit. The control unit has pressure and volume displays. A rotation of the handle by the operator moves the piston inside the control unit which forces water through the system that produces a change in the probe volume and a corresponding pressure that can be measured. This device could be enhanced by in-corporating digital gages with data collection, reduc-tion and analysis software. A strain-controlled pro-cess is typically performed requiring operators to inject equal 5 cm 3 volumes of water into the probe and wait 30 seconds (Cosentino et al. 2006) or 15 seconds (Roctest 2005) and record the corresponding pressures.ABSTRACT: In all foundations design, it is necessary to know the pertinent parameters controlling the soil behavior. The aim was to reveal that Pencel pressuremeter (PPMT) pushed to the preferred test depth using the cone penetrometer equipment would produce reliable engineering parameters. The PENCEL pressure-meter is defined as a cylindrical devices designed to apply uniform pressure to walls of a borehole by means of a flexible membrane. Pressure is exerted on the borehole walls via an incompressible liquid (water). PPMT has sufficient length to diameter ratios, the soil expansion is assumed to be cylindrical allowing plain strain assumptions to be used to reduce the data. The cavity expansion and corresponding pressure increase are re-duced to stress-strain, from which strength-deformation properties are determined. This study was performed to describe the standard method of PPMT testing to allow engineers to more precisely carry out the standard-ized tests. Comparison of typical tests from various PMT’s is presented. Theoretical interpretation of PPMT results was developed. From PPMT data, which were reduced to graphs of pressure versus volume and pres-sure versus relative change in probe radius, soil parameters including the initial pressure, the elastic moduli, the reload moduli, and the limit pressure of the soil could be determined. Pencel pressuremeter is a suitable device to allow the rapid and reliable measurement of engineering parameters for foundations design. Practice of the PENCEL Pressuremeter in Foundations DesignF. MessaoudUniversity of Tebessa, Tebessa, AlgeriaP.J. CosentinoFlorida Institute of Technology, Florida, USAGeotechnical and Geophysical Site Characterisation 5–Lehane, Acosta-Martínez & Kelly (Eds)© 2016 Australian Geomechanics Society, Sydney, Australia, ISBN 978-0-9946261-1-0P r e s s u r e (k P a )Volume (cm 3)0102030405060708090Volume (cm 3)P r e s s u r e (k P a )Figure 1. The PENCEL Pressuremeter2 DATA REDUCTION AND INTERPRETATIONFollowing equipment saturation, the calibrations are performed. First, the membrane calibration is deter-mined by inflating the probe in air, at the same ele-vation as the pressure gage while recording pressure and volume data. Second, the volume calibration is determined by inserting the probe into a 32 mm di-ameter steel tube and inflating it while pressures and volumes are recorded. The membrane and volume corrections are subtracted from the raw data produc-ing a reduced curve (Fig. 2). The hydrostatic pres-sure developed between the control unit and the cen-ter of the probe is added to the raw pressures prior to making these corrections (Messaoud 2008).Figure 2. Raw and Reduced Data with Calibrations AppliedIn order to determine the critical engineering parameters, four portions of the reduced curve are analyzed (Fig. 3). It includes an initial zone where the soil is repositioned to its original stress state, followed by an elastic zone, the rebound zone and then a plastic zone to estimate the soil limit pressure. The moduli (E) are determined from the slopes (S) while the other parameters are estimated. The PPMTlimit pressure (p L ) defined as the pressure associated with doubling the initial probe volume (Messaoud et al 2011).Figure 3. Typical PPMT Curve to obtain Engineering Parame-tersThe Following expression for determining an elastic modulus from (E) is used (Baguelin et al. 1978): ()m V ΔVΔPν+12=E (1)Where, E = Young’s modulus, ΔP = change in pressure, (∆P = P 2 - P 1),ΔV = change in volume related to ΔP , V m = average volume, and ν = Poisson's RatioTucker (1987) & Briaud (1992) suggested using the radial strain to determine moduli. In an effort to normalize the PPMT curve it is recommended that the curve be plotted as pressure versus relative increase on probe radius (Fig. 4). Hence, Equation 1 for the initial modulus E 0 will be:(3)The value of ⎪⎪⎭⎫⎝⎛⎪⎪⎭⎫ ⎝⎛101R R ,P Δand ⎪⎪⎭⎫ ⎝⎛⎪⎪⎭⎫ ⎝⎛202R R ,P Δ are taken from steepest initial linear portion of the correctedpressuremeter curve (Fig. 4).Figure 4. Typical PPMT Curve to obtain Engineering Parame-tersControl UnitTripod⎥⎥⎦⎤⎢⎢⎣⎡⎪⎪⎭⎫ ⎝⎛+-⎪⎪⎭⎫ ⎝⎛+⎥⎥⎦⎤⎢⎢⎣⎡⎪⎪⎭⎫ ⎝⎛++⎪⎪⎭⎫ ⎝⎛++=2012021-22022010ΔR 1ΔR 1ΔP ΔR 1ΔR 1ν)(1E R R R RThe pressuremeter reload modulus, E r , is calculated as the same manner (Fig. 4) as the E 0. It is calculated by using the following formula:(4) with andbeing the two data points on the reload portion of the pressuremeter test (Fig. 4).Where:∆R 1 = Increase in probe radii at the beginning of the pressure increment of the initial linear portion∆R 2 = Increase in probe radii at the end of the pressure increment of the initial linear portion∆R 3 = decrease in probe radii at the beginning of the pressure increment of the reload portion∆R 4 = decrease in probe radii at the end of the pressure increment of the reload portion R 0 = Initial radius of the probe. 3 DATA ACQUISITION SOFTWARE IMPROVEMENTA stand-alone data acquisition program APMT was developed and compiled into an executable package to reduce data collection errors and simplify operator requirements during testing. Operators can use APMT to record digital pressures and volumes during all calibrations or tests, then quickly reduce test data and finally determine the engineering parameters (p 0, E 0, E r and p L ). The reduced data is displayed on the screen during testing as either pressure versus volume, volumetric strain or radial strain. APMT records four samples per second throughout testing. This sampling rate produces sufficient data points to allow proper engineering analyses. One of the most complex operations required during testing is for the operator to wait for 30 seconds after each volume injection and then accurately record pressures as the analogue pressure gage continues to change. APMT data collection software was developed such that the display available to the operator includes a sequence of three lights; red, yellow and green that change, based on the rate of change of successive pressure readings (Fig. 5).A red light was chosen to indicate that successive readings are within 5 kPa. It was assumed that this change was small enough to involve that the soil pressure was nearly stable. Subsequently, a yellow light would indicate that successive readings are within 1 kPa. The software would then record threesuccessive pressures, average them and save them to a file. The green light would indicate that the datawas saved and the testing could continue. Once the data has been collected for a test, a new screen becomes available to the operator. This screen allows for determining both a lift-off and limit pressure (p 0 , p L ) along with initial and reload moduli (E 0, E r ). Figure 6, shows this typical APMT screen which includes both the raw and reduced data(Cosentino et al 2006). Figure 5. APMT Automatic Recording of Data PointFigure 6. Typical APMT Screen4 FIELD TESTING PROGRAM AND DATA COLLECTIONTwo sites were chosen. The first site on the Florida Institute of Technology (FIT) Melbourne campus and the second site on the Archer Landfill in Gainesville, Florida, consisted predominately of sand. Testing was conducted using the FDOT SMO Cone Penetrometer rig with FDOT field technicians. To categorize the soils, Standard Penetration (SPT), CPT, Dilatometer (DMT) and PPMT tests were performed. The soil at the FIT site consisted of three sand layers. The upper medium-dense sand layer, interbedded with silt and clay lenses, varies from the surface to about 2 m. The second layer, also about3.05 m thick, consists of very loose to loose silty⎥⎥⎦⎤⎢⎢⎣⎡⎪⎪⎭⎫ ⎝⎛+-⎪⎪⎭⎫ ⎝⎛+⎥⎥⎦⎤⎢⎢⎣⎡⎪⎪⎭⎫ ⎝⎛++⎪⎪⎭⎫ ⎝⎛++=2042034-3204203r ΔR 1ΔR 1ΔP ΔR 1ΔR 1ν)(1E R R R R ⎪⎪⎭⎫⎝⎛⎪⎪⎭⎫ ⎝⎛303R R ,P Δ⎪⎪⎭⎫ ⎝⎛⎪⎪⎭⎫ ⎝⎛404R R ,P Δ5001000150020002500-5,00010,00015,00020,00025,00030,00035,000Initial Modulus (kPa)L i m i t P r e s s u r e (k P a)5,00010,00015,00020,00025,000Initial Modulus (kPa)R e b o u n d M o d u l u s (k P a )sand. The third layer beginning at about 6.1 m consists of dense cemented sands. The sands at archer Landfill site displayed consistent which were divided into layers. The first layer to 2.1 m consists of loose silty sand. From 2.1 to 4.2 m, the second layer was medium dense silty sand. The third layer from 4.2 -9.1 m was predominantly medium dense sand to silty sand.5 CORRELATION FROM PPMT ENGINEERING PARAMETERSThe initial elastic modulus was compared to the limit pressures using the engineering parameters from 96 PPMT tests in the silty sands at the FIT and Archer sites. These soils ranged from very loose to dense silty sands. An excellent correlation exists when modeled nonlinearly shown in Figure 7a. A nonlinear relationship would be expected because the limit pressure cannot increase infinitely as stiffness increases. Briaud (1992) presented linear correlations based on over 400 records, between the limit pressure and initial elastic modulus of p L = 0.125 E 0 for sands and p L = 0.071 E 0 for clays. He specifically states that the wide scatter in the data used to develop them, “makes these correlations essentially useless for design;” however, they give the engineers a relative feel for the engineering parameters (Cosentino et al 2008). When a linear regression through the origin was used to describe this data the equation becomes p L = 0.079 E 0. In conclusion, this nonlinear relationship shows thatPPMT data are realistic and can be used by engineers. (a)(b)Figure 7: Correlation between Limit Pressure and Initial Elastic Modulus in Silty Sands ( a), Correlation between Reload Mod-ulus and Initial Modulus for Silty Sands (b).A nonlinear correlation was developed between the initial elastic modulus and the reload modulus in Figure 7b. Using data from 36 tests performed in silty sands from both the FIT and Archer sites. Twenty of the 36 tests were performed and recorded using the digital system (Cosentino et al 2008). When only digital information was evaluated the regression equation became E r = 0.15 E 01.4864 and had a corresponding regression coefficient (i.e. R 2) of 0.93. This improved correlation suggests that thedigital instrumentation combined with the APMTsoftware improves the PPMT data. Briaud (1992) presents a linear correlation between these twoparameters where E r = 8 E 0 in sands. If the data inFigure 7b is represented linearly a regression of E r = 16 E 0 results with an R 2 value of 0.76 and if onlydigital data is used the equation becomes E r = 21 E 0results with an R 2 of 0.79. These linear results indicate that digital testing should be used toimprove pressuremeter data.Similar correlations between the lift-off or initial pressure and limit pressure were developed; howeverthe data were not well represented statistically as shown in the equation and corresponding correlation coefficient below.p L = 24.2 (p 0)0.9685 R 2 = 0.62Linear correlations between the lift-off pressure and initial elastic moduli were developed from the testing in sands. The overall regression coefficientwas 0.30, therefore the resulting equation is notpresented. Again, limited knowledge of the stress history at these sites could be a major factor in thepoor statistical fit. The data recorded by hand was compared to the digitally recorded data. The regression coefficient from the digital information was nearly 0.58 producing the equation below; while the data recorded manually was 0.36. This 60 % increase in the regression coefficient indicates that digital stress-strain data is a significant improvement over manually recorded data.E0=68 (p0) + 37246 CONCLUSIONSReliable correlations exist from the large number of PPMT test data, indicating that this device can produce useful parameters for engineers to use in geotechnical analysis and designA precise nonlinear correlation was developed between the PPMT initial elastic modulus and the limit pressures in sands.A reliable nonlinear correlation was developed between the PPMT initial elastic and the reload moduli in sands. This correlation improved when digital information along with the APMT software was used, indicating that the combination of digital instruments and this software will provide engineers with more reliable data than the analogue equipment alone.The APMT software allows quick evaluations of the soil parameters, including the lift-off pressure p0, initial modulus E0, reload modulus E r and limit pressure p L.The raw data obtained from APMT was in agreement with the data recorded using the conventional PPMT.The pushed-in PPMT test is much faster than conventional pressuremeter testing and is recommended for use in determining the soils stress-strain response and the associated engineering parameters.7 ACKNOWLEDGEMENTSThe authors would like to acknowledge the following people for their invaluable guidance and help in the completion of this study; John Shoucair, Brian Bixler and Todd Britton of the Florida Department of Transportation State Materials Office.8 REFERENCESBriaud, J.L. & Shields, D.H. 1979. A Special Pressuremeter and Pressuremeter Test for Pavement Evaluation and De-sign. Geotechnical Testing Journal, ASTM 2:3. Cosentino, P.J. 1987. Pressuremeter Moduli for Airport Pave-ment Design. Ph.D. Dissertation, Department of Civil Engi-neering, Texas A&M University,Messaoud, F. 2008. Pressuremeter Test Evaluation for Devel-oping P-Y Curves for Driven Piles. In Proc. 11th BalticSea Geotechnical Conference, Geotechnic in Maritime En-gineering. Gdansk, Poland, 271-278Cosentino, P.J. & Briaud, J.L. 1989. FWD Back Calculation Moduli Compared with Pavement Pressuremeter Moduli and Cyclic Triaxial Moduli. Philadelphia, Pennsylvania: ASTM 23–340.Cosentino, P. Kalajian, E., Stansifer, R. Anderson, J. B.Kattamuri, K. Sundaram, S. Messaoud, F. Misilo, T. & Cot-tingham, M. 2006. Standardizing the Pressuremeter Test for Determining p-y Curves for Laterally Loaded Piles, FDOT Research Report. Contract BD 658.Roctest, 2005. PENCEL Pressuremeter Instruction Manual.Plattsburgh, N.Y, Roctest, Inc.Messaoud, F. Nouaouria M.S. & Cosentino, P.J. 2011. PEN-CEL pressuremeter test evaluation for developing p-y curves for driven piles. ACEE International Journal on Transportation and Urban Development, v. 1:2, 14-18. Bagueling, F. Jezequel, J.F. & Shields, D.H. 1978. The Pres-suremeter and Foundation Engineering. 1st ed., trans., Tech Publications, Causthal, Germany.Tucker, L.M. & Briaud, J.L. 1987. Laterally loaded piles and the Pressuremeter: comparison of existing methods. ASTM.97-111.Briaud, J.L. 1992. The Pressuremeter. A.A Balkema, Brookfield, Vermont.Cosentino, P. Kalajian, E. Messaoud, F. Sundaram, S. Misilo, & T. David Horhota, 2008. Correlation Between PENCEL Pressuremeter, Cone Penetrometer and Dilatometer Parame-ters. Transportation Research Record, Soil Mechanics, Vol 2053, 65-71.。
JT-100A型多功能计数器ppm计使用说明

JT-100A型多功能计数器/ppm计使用说明一、概述JT - 100型多功能计数器/ppm计。
以单片机为核心,进行功能切换,测量控制,数据处理。
采用倒数测量计数技术,实现了全范围内的等精度测量。
日稳5×10⁻⁷ / 日的恒温晶体振荡器,保证了测量数据的可靠性。
JT - 100型多功能计数器/ppm计具有频率、周期、累计、ppm等测量功能,并根据用户的需要,可增添合适的功能。
面板示意图:1二、使用的环境条件工作环境温度:0 —40℃相对温度: < 90‰三、技术参数3.1 测量范围:3.1.1 频率测量范围:0.1 Hz ~ 100 MHz3.1.2 周期测量范围:10 ns ~ 10 s3.1.3 计数容量:1 × 10 83.1.4 ppm:1ppm3.2 动态范围:50 mV ~ 1.5 Vms3.3 输入耦合方式:AC3.4 闸门时间:0.01s 、0.1s 、1s(可设定)3.5 准确度:±时基准确度 ±触发误差×被测频率(周期)±LSO其中LSO = (100 ns / 闸门时间)×被测频率(被测周期)3.6 时基:3.6.1 标称频率:10 MHz3.6.2 频率稳定度:5 × 10 – 7/D3.7 显示:九位LED数码管显示3.8 电源:220 V ± 22 V 50 H z± 2.5 Hz3.9 整机功耗:≤ 10 VA3.10 可靠性:平均无故障工作时间MTBF ≥ 10000 h四、使用说明4.1 在仪器使用前,应检查电源是否符合本仪器的电压工作范围,仪器使用三芯电源线,电源插座接地良好。
4.2 经上述检查后仪器即可通电。
按下电源开关键,仪器即开始进入初始化,并进入自校状态,显示全“8”。
4.3序号名称用途1 电源开关按下数字窗口18显示888 …,16 KHz灯亮2 复位键按下刷新当前的操作3 功能选择↑按下功能指示灯往下移动一位,灯亮表示仪器当前执行的测量状态4 功能选择↓按一下,往下移动一位,其余同上5 闸门选择按一下依次0.01s|、0.1s、1s循环6 选择/确认键按一下依次数据Fo、闸门、鸣叫循环7 设置选择↑按一下确定位数据增加8 设置选择↓按一下确定位数据减少9 设置选择→按一下确定选择位右移/累计开始,停止10 设置选择←按一下确定选择位左移/累计清零11 衰减选择键按下时被测信号衰减10db12 低通选择键按下时KHz低通微波13 A输入插座接输入信号0.1Hz ~100MH z14 B输入插座接输入信号0.1Hz~100MHz15 KHz指示灯灯亮所显示数据的单位为KHz16 ―ms‖指示灯灯亮所显示数据的单位为ms17 ―ppm‖指示灯亮所显示数据的单位为ppm灯18 数据显示窗九位LED数据显示口19 晶振指示灯灯亮机内晶体振荡器工作20 闸门指示灯灯亮开始测量工作灯灭数据处理4.4 面板操作:4.4.1 频率测量操作:a) 按3或4键,置功能指示灯“测频A”亮。
计数器使用说明书

安徽巨森电器JPB计数器使用说明书
JS-3过电压动作计数器是对3-10KV组合式过电压产品工作状态进行实时及累计计数的装置,通过本产品可以详细监视组合式过电压产品及其所保护线路的状况,预知事故前异常情况,达到分析异常动作原因,预防事故发生的作用。
采集:JS-3过电压动作计数器采用自行设计的高速率数据处理单元,抗干扰能力强,软件数字滤波可以实时准确记录过电压保护三相之间动作次数,分相累计。
显示:JS-3过电压动作计数器采用STN点阵式液晶显示。
结构:JS-3过电压动作计数器为两分体结构,通过RJ45接口用网线连接,可根据现场需要任意拆分为本体安装或者柜门安装。
运行维护:
1、JS-3过电压动作计数器为无源设计,无须外接电源,本体附带电池可以使用3
年,电量不是时请立即与我单位联系供应。
电池位于数据显示盒内,打开后盖
即可更换。
2、统计软件设计采用了实时省电模式,需要观察数据时,请轻触一次读数按键,
将依次显示“AB、AC、AD、BC、BD、CD”相相之间的过压累计次数,依序
出现完毕后,液晶显示将自动关闭。
3、清除,需要清除数据,长按按键三秒,当出现“ERASE”时,每隔一秒将出现
一个点,三个点都出现后,则说明清除数据已完成。
在此过程中,如需要放弃
清除,在第二个点出现之前松开按键,清零将被取消。
安装方式:
柜门安装:计数器的显示部分安装在柜门上,因此要考虑保护器显示部分的信号长度和柜门的开孔尺寸,如下图所示:。
XMT100说明书
1.4 仪表需要提供梯度报警时,需设置梯度值,梯度的 单位是℃/s。(如不需要梯度报警,请将梯度值设置为 0)
闪动位
按
键修改闪动位,按
存贮同时闪光位右移到下一位,
按 闪动位
键修改闪动位, 按
存贮;
依次设置完成后,按
键退出设置状态,梯度报警设置完毕。
-9-
1.5 线路电阻的补偿值的设定:
当仪表配接二线制电阻时, 可以事先测量线路电阻值,然后折
② 当温度在下限值以上变化时,如果相邻两次显示的变化值 超过梯度值,下限报警指示和梯度报警指示同时亮, 而且一直保 持, 直到显示值低于下限时才能撤消;当梯度报警指示有效时, 上限报警指示被自动锁定即使显示值超过上限也不报警);只有变 化值不超过梯度值(即梯度不报警),显示值越上限时上限指示才 报警。
三、用途及选型:
本仪表可接收温度,压力传感器信号, 标准模拟直流信号或其 它模拟直流信号及产生电阻变化的传感器信号。 本仪表可显示全量 程的值,输出开关控制信号或PID控制信号。
--2--
型号及其含义:
X M T - 10××
控制报警类型: A:高低限报警及控制 B:0-10mA 或 4-20mA 标准电流输出。 C:程序 PID 控制调节 D:三位控制调节
分度号
S(LB-3) K(EU-2) T E(EA-2) B(LL-2) 同上
同上
测量范围
0~1700℃ -99~1000℃ -99~ 400℃ -99~ 800℃ 800~1800℃ 同上
同上
控制调 节形式
高低限 报警及 控制
高低限 报警 三位
输出形式
继电器 标准信号输出 继电器
XMT-102A 热电阻
杰尼奥科技电子计量仪说明书
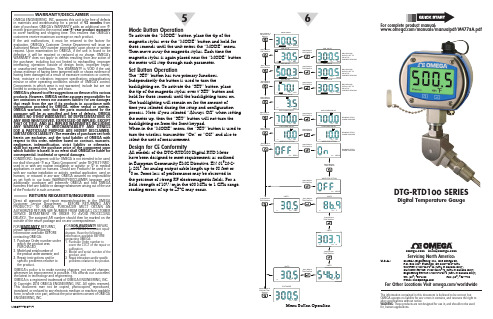
Mode Button OperationTo activate the “MODE” button, place the tip of the magnetic stylus over the “MODE” button and hold for three seconds until the unit enters the “MODE” menu. Then move away the magnetic stylus. Each time themagnetic stylus is again placed near the “MODE” button the meter will step through each parameter.Set Button OperationThe “SET” button has two primary functions. Independently the button is used to turn thebacklighting on. To activate the “SET” button, place the tip of the magnetic stylus over t“SET” button and hold for three seconds until the backlighting turns on. The backlighting will remain on for the amount of time you selected during the setup and configuration process. Note: if you selected “Always Off” when setting the meter up, then the “SET” button will not turn the backlighting on from the front keypad.When in the “MODE” menu, the “SET” button is used to turn the wireless transmitter “On” or “Off” and also to select the unit of measurement.Design for CE ConformityAll models of the DTG-RTD100 Digital RTD Meter have been designed to meet requirements as outlined in European Community EMC Directive. EN 61326-2-1: 2013 for analog output cable length up to 98 feet or 30 m. Some loss of performance may be observed in the presence of strong RF electromagnetic fields. For a field strength of 10V/m in the 400 MHz to 1 GHz range, reading errors of up to ±5°C may occur.WGS/START HERE ARRO 5WGS/START HERE ARRO6DTG-RTD100 SERIESDigital Temperature GaugeMQS4778/0714Menu Button Operation/manuals/manualpdf/M4778A.pdf***********************®The information contained in this document is believed to be correct, but OMEGA accepts no liability for any errors it contains, and reserves the right to alter specifications without notice.WARNING: These products are not designed for use in, and should not be used for, human applications.WARRANTY/DISCLAIMEROMEGA ENGINEERING, INC. warrants this unit to be free of defects in materials and workmanship for a period of 13 months from date of purchase. OMEGA’s WARRANTY adds an additional one (1) month grace period to the normal one (1) year product warranty to cover handling and shipping time. T his ensures that OMEGA’s customers receive maximum coverage on each product.If the unit malfunctions, it must be returned to the factory for evaluation. OMEGA’s Customer Service Department will issue an Authorized Return (AR) number immediately upon phone or written request. Upon examination by OMEGA, if the unit is found to be defective, it will be repaired or replaced at no charge. OMEGA’s WARRANT Y does not apply to defects resulting from any action of the purchaser, including but not limited to mishandling, improper interfacing, operation outside of design limits, improper repair, or unauthorized modification. T his WARRANT Y is VOID if the unit shows evidence of having been tampered with or shows evidence of having been damaged as a result of excessive corrosion; or current, heat, moisture or vibration; improper specification; misapplication; misuse or other operating conditions outside of OMEGA’s control. Components in which wear is not warranted, include but are not limited to contact points, fuses, and triacs.OMEGA is pleased to offer suggestions on the use of its various products. However, OMEGA neither assumes responsibility for any omissions or errors nor assumes liability for any damages that result from the use if its products in accordance with information provided by OMEGA, either verbal or written. OMEGA warrants only that the parts manufactured by the company will be as specified and free of defects. OMEGA MAKES NO OTHER WARRANTIES OR REPRESENTATIONS OF ANY KIND WHATSOEVER, EXPRESSED OR IMPLIED, EXCEPT THAT OF TITLE, AND ALL IMPLIED WARRANTIES INCLUDING ANY W ARRANTY OF MERCHANTABILITY AND FITNESS FOR A PARTICULAR PURPOSE ARE HEREBY DISCLAIMED. LIMITATION OF LIABILITY: The remedies of purchaser set forth herein are exclusive, and the total liability of OMEGA with respect to this order, whether based on contract, warranty, negligence, indemnification, strict liability or otherwise, shall not exceed the purchase price of the component upon which liability is based. In no event shall OMEGA be liable for consequential, incidental or special damages.CONDITIONS: Equipment sold by OMEGA is not intended to be used, nor shall it be used: (1) as a “Basic Component” under 10 CFR 21 (NRC), used in or with any nuclear installation or activity; or (2) in medical applications or used on humans. Should any Product(s) be used in or with any nuclear installation or activity, medical application, used on humans, or misused in any way, OMEGA assumes no responsibility as set forth in our basic WARRANT Y/DISCLAIMER language, and, additionally, purchaser will indemnify OMEGA and hold OMEGA harmless from any liability or damage whatsoever arising out of the use of the Product(s) in such a manner.RETURN REQUESTS/INQUIRIESDirect all warranty and repair requests/inquiries to the OMEGA Customer Service Department. BEFORE RE URNING ANY PRODUC (S) O OMEGA, PURCHASER MUS OB AIN AN AUTHORIZED RETURN (AR) NUMBER FROM OMEGA’S CUSTOMER SERVICE DEPART MENT (IN ORDER T O AVOID PROCESSING DELAYS). T he assigned AR number should then be marked on the outside of the return package and on any correspondence.FOR WARRANTY RETURNS, please have the followinginformation available BEFORE contacting OMEGA:1. Purchase Order number under which the product was PURCHASED,2. Model and serial number of the product under warranty, and3. Repair instructions and/or specific problems relative to the product.FOR NON-WARRANTY REPAIRS, consult OMEGA for current repair charges. Have the following information available BEFORE contacting OMEGA:1. Purchase Order number to cover the COST of the repair or calibration,2. Model and serial number of the product, and3. R epair instructions and/or specific problems relative to the product.OMEGA’s policy is to make running changes, not model changes, whenever an improvement is possible. This affords our customers the latest in technology and engineering.OMEGA is a registered trademark of OMEGA ENGINEERING, INC.© Copyright 2014 OMEGA ENGINEERING, INC. All rights reserved. T his document may not be copied, photocopied, reproduced, translated, or reduced to any electronic medium or machine-readable form, in whole or in part, without the prior written consent of OMEGA ENGINEERING, INC.be re-installed into your meter housing or you willnot have the proper water tight seal. Failure to installthese screws correctly may results in damage to yourunit when the meter is exposed to wet conditions.When reinstalling enclosure screws they must betightened to 9 in-lb ±10%.Setting Up Your MeterConnect the USB Programming cable included with yourunit to your PC and your meter.USB Connector LocationNow that you have connected your USB cable to yourPC and to your meter, you can now configure yourmeter before placing the unit into operation. You will beusing the configuration software utility that you installedonto your PC. If you have not installed the configurationsoftware utility you should do so now.Launch Setup Utility ProgramTo launch the setup utility program on your PC begin byfinding and clicking on the DG program Icon that wasplaced on your computer desk top during installationof the software or in your “Programs” list accessiblethrough your “Start Menu”.Configuring Your MeterThe Omega Digital Gauge Configuration Wizard willopen once you have launched the DG ConfigurationWizard software. Follow the step-by-step instructionsgiven to you by the Configuration Wizard. Step 5 -Choose Options: Select the type of analog output yourapplication requires. You can leave the default setting ifyou will not be using the analog output feature.WGS/START HERE ARRO WGS/START HERE ARRO2WGS/START HERE ARRO34Using This Quick Start ManualUse this Quick Start Manual with yourDTG-RTD100 Series Digital Temperature Gaugefor quick installation and basic operation. Fordetailed information, refer to the User’s Guide(Manual Number M4778A).General DescriptionThe DTG-RTD100 Thermometer Series featuresa rugged 316 stainless steel enclosure that isdesigned specifically for wash-down, sanitary andmarine applications. The large backlit LCD displayincorporates both large 25 mm (1") digits and a 25segment bar graph that makes reading at distancesup to 10.7 m (35') easy. Models are available with orwithout integral industrial or sanitary temperaturesensors. Standard features include: internalbattery or external DC power supply operation,analog output and user programmable alarms.The optional built-in wireless transmitter allowsfor remote monitoring, chat recording and datalogging. A variety of user configurable options andsettings include: sample interval, units, backlightlevel, alarm setting, analog output scaling.The DTG-RTD100 is NEMA 4X rated (watertight, dust tight, corrosion – resistance - indoor& outdoor use). The temperature gauge can beinstalled in locations where it will be intermittentlyexposed to spraying water, rain or high humidity.The meter should never be used under water.Software InstallationInsert the software CD that was included withyour unit into the CD-ROM drive on your PC.Your system should begin the installation processautomatically. The installer will guide you throughthe steps required to install the DG ConfigurationWizard on your computer.Lid/Cover RemovalTo access the USB programming connector on yourmeter, the enclosure lid/cover must be removed.Four screws must be removed. Be careful to not loseor discard these screws. These screws play a vitalpart in providing the water tight seal on your unit.WiringTemperature Sensor WiringModel DTG-RTD100 is designed to operate witha 3-wire, PT100 external sensor or integral probeassembly. Wires are connected to TB1 located onthe rear circuit board between the battery holder.Keypad OperationA magnetic stylus is attached to your meter. Thisstylus is used to activate the front buttons on thedisplay. If you do not need to view the “MIN”,“MAX” or “AVERAGE” readings during normaloperation, or have a need to turn the backlight onduring normal operation you can remove and storethis stylus. You will need to select “Disable Keypad”during the setup and configuration process.Button OperationThe “MODE” and “SET” buttons located on thefront of the display of your meter are activated bywaving or tapping the magnetic stylus includedwith your unit above or onto the keypad buttonsymbol on the front meter label.REMOVE THESE FOUR SCREWSIN ORDER TO REMOVETHE METER FRONT COVERof your meter to match the analog output type youselected here in the setup process.Analog Output OptionsInstallation, Mounting, & WiringMountingFor mounting instructions with or without optionalintegral probe, refer to the User’s Guide Page 4-3Section 4.5.Ambient TemperatureYour meter should only be installed in locations thatmaintain an ambient temperature between -40 to 70°C(-40 to 158°F).Battery Installation/ReplacementTo install or replace the battery in your DTG-RTD100you must first remove the four screws located on theLid of the enclosure. This will allow you to remove thenormal operation (Battery 1). A second battery(Battery 2) can be added to extend operation whenon battery power. It is also recommended that theadditional battery (Battery 2) be installed for modelsthat include the optional wireless transmitter.Battery Installation/ReplacementStandard Wiring Option-1 Wiring OptionM12 Male ConnectorStandard Wiring Option-1 Wiring Option。
普瑞逊电子计数天平操作规范

秤盘上未放置任何物品-〉按“扣重预设”键-〉输入已知的包装物品的重量-〉按“扣重预设”键,即进入计数模式。放入需称重物品,电子秤重量栏显示所称物品扣除包装后重量。
6.3计数
6.3.1待称物品单重未知:将取样物品置于秤盘上-〉输入秤盘上取样物品数量-〉按“个数设定”键-〉当计数天平稳定后,即取样完成,进入计数模式
4.4为保证称重结果的准确性,请在称重前开机预热15~20分钟后使用;
4.5使用前将电充足,以确保使用中不会因电力不足带来不便;
4.6当秤有欠压指示时必须立即对春充电,开机充电时不会影响该秤的正常使用。若长时间不用,至少每两月需充电一次,以保护电池寿命;
4.7避免在高温(>40℃)、低温(<0℃)、高湿度(80%RH)以上的环境中使用;
5.2.5取样不足“∴/取样不足”:取样时,若秤盘上样品总重量小于“最小样品重”,则此符号显示,此时,请增加样品数,直到此符号消失,再作取样,以确保其准确度。
5.2.6单重不足“g/单重不足”:若秤盘上物品之单量小于“最小单重”,则此符号显示,此情况表示物品之单量太轻,虽然计数天平仍可计算数量,但可能引起误差。
4.11在搬运或称物品时要轻拿轻放,不能太大力冲击秤盘,避免因局部受力而损坏传感器;
4.12严禁超过最大秤量,避免因过载损坏秤体结构和传感器。
5.显示、字符及按键说明
5.1显示窗口
5.1.1重量:共6位数字,用以显示秤盘上物品或累计之总重量,最左边一位可显示符号。
5.1.2单重:共6位数字,显示物品这单重或累计之总笔数,小数点可浮动。
电子计数天平操作规范
1.目的:
确保仪器的正确使用、避免仪器和产品因使用不当而造成损坏,提高产品测试数据的有效性、真实性、准确性。
DT-100A电子天平操作规程

DT-100A电子天平操作规程
1.接触电源,打开开关,显示窗显示“CD-0到CH-9”后稳定一段时间后,出现0.0g,通电预热15分钟,如果在空称情况下显示偏零点,应按“去皮键”(T)使显示回归零点。
2.天平在使用要校正,先按“去皮键”(T)再按“校正键”(C)显示窗出“CAL”进行校准状态,再把相对应的校准砝码放在称盘上,待稳定后天平显示校准砝码的重量值即校准完毕,可以进行正常称重。
(200g-1000g配有相应的校正砝码)
3.如被称物体重量超出天平称量范围,天平将显示“H”以示警告。
4.计数功能的使用:天平的计数功能是在用户对大量相同物件进行统计时使用。
在天平空称情况下,先按“去皮键”(T),使天平归零,按“计数键”(P),显示窗显示“PUT-102”时,即天平进入计数计数工作状态,此时按“去皮键”(T)即会由10-20-50-100四种样品数的选择(如果此时不放样品物件,按“F”键,即会退出计数状态而回到正常称重状态)用户可根据物件大小来决定选择样品数,然后放上相同数量的物件,特别要注意此时一定要等待一会,待天平稳定后再按“F”键确认,拿去样品数,显示0.0P即为“0”件,放在最大称量范围内同类物件,显示的是该物件的个数。
要使计数状态回到正常称量状态,按“计数键”(F)即可。
5.重量单位转换:按“量值转换键”(F),可使称量单位转
换,一般有常用的“g”(克),“OS”(盎司)“ct”()克拉等。
- 1、下载文档前请自行甄别文档内容的完整性,平台不提供额外的编辑、内容补充、找答案等附加服务。
- 2、"仅部分预览"的文档,不可在线预览部分如存在完整性等问题,可反馈申请退款(可完整预览的文档不适用该条件!)。
- 3、如文档侵犯您的权益,请联系客服反馈,我们会尽快为您处理(人工客服工作时间:9:00-18:30)。
JT-100A型多功能计数器/ppm计使用说明
一、概述
JT - 100型多功能计数器/ppm计。
以单片机为核心,进行功能切换,测量控制,数据处理。
采用倒数测量计数技术,实现了全范围内的等精度测量。
日稳5×10⁻⁷ / 日的恒温晶体振荡器,保证了测量数据的可靠性。
JT - 100型多功能计数器/ppm计具有频率、周期、累计、ppm等测量功能,并根据用户的需要,可增添合适的功能。
面板示意图:1
二、使用的环境条件
工作环境温度:0 —40℃
相对温度: < 90‰
三、技术参数
3.1 测量范围:
3.1.1 频率测量范围:
0.1 Hz ~ 100 MHz
3.1.2 周期测量范围:
10 ns ~ 10 s
3.1.3 计数容量:
1 × 10 8
3.1.4 ppm:
1ppm
3.2 动态范围:
50 mV ~ 1.5 Vms
3.3 输入耦合方式:AC
3.4 闸门时间:0.01s 、0.1s 、1s(可设定)
3.5 准确度:
±时基准确度 ±触发误差×被测频率(周期)±LSO
其中LSO = (100 ns / 闸门时间)×被测频率(被测周期)
3.6 时基:
3.6.1 标称频率:10 MHz
3.6.2 频率稳定度:5 × 10 – 7/D
3.7 显示:九位LED数码管显示
3.8 电源:220 V ± 22 V 50 H z± 2.5 Hz
3.9 整机功耗:≤ 10 VA
3.10 可靠性:平均无故障工作时间MTBF ≥ 10000 h
四、使用说明
4.1 在仪器使用前,应检查电源是否符合本仪器的电压工作范围,仪器使用三芯电源线,电源插座接地良好。
4.2 经上述检查后仪器即可通电。
按下电源开关键,仪器即开始进入初始化,并进入自校状态,显示全“8”。
4.3
序号名称用途
1 电源开关按下数字窗口18显示888 …,16 KHz灯亮
2 复位键按下刷新当前的操作
3 功能选择↑按下功能指示灯往下移动一位,灯亮表示仪器当前
执行的测量状态
4 功能选择↓按一下,往下移动一位,其余同上
5 闸门选择按一下依次0.01s|、0.1s、1s循环
6 选择/确认键按一下依次数据Fo、闸门、鸣叫循环
7 设置选择↑按一下确定位数据增加
8 设置选择↓按一下确定位数据减少
9 设置选择→按一下确定选择位右移/累计开始,停止
10 设置选择←按一下确定选择位左移/累计清零
11 衰减选择键按下时被测信号衰减10db
12 低通选择键按下时KHz低通微波
13 A输入插座接输入信号0.1Hz ~100MH z
14 B输入插座接输入信号0.1Hz~100MHz
15 KHz指示灯灯亮所显示数据的单位为KHz
16 ―ms‖指示灯灯亮所显示数据的单位为ms
17 ―ppm‖指示
灯亮所显示数据的单位为ppm
灯
18 数据显示窗
九位LED数据显示
口
19 晶振指示灯灯亮机内晶体振荡器工作
20 闸门指示灯灯亮开始测量工作灯灭数据处理
4.4 面板操作:
4.4.1 频率测量操作:
a) 按3或4键,置功能指示灯“测频A”亮。
b) 按5键,置0.1s灯亮,表示仪器进入测频的状态。
c) 将被测信号接入13A输入插座。
注:闸门的选择,依据显示被测信号有效位数,来确定或测量的速度。
4 .4.2 周期测量操作:
按3或4键,置功能指示灯“周期”亮,其余操作同上。
4.4.3 累计测量操作:
a) 按3或4键置功能指示灯“累计”亮。
b) 将被测信号接入13A输入插座。
c) 按设置选择键9,开始计数。
注:1)在计数过程中,需暂停并保持暂停时的数据,按设置键9。
若需在暂停的基础上继续计数时,再按设置键9,则继续计数。
2)在计数过程中需停止,则按10键计数值复位。
若需重新计数,则按9键,计数重0开始。
4.4.4 PPM操作:
a) 按3或4键,置功能指示灯“PPM”亮。
b) 按5键,置“0.1s”灯亮。
c) 将被测信号接入13A输入插座。
注:PPM操作前必须先进行数据设置,见4.4.5。
4.4.5 设置操作:
仪器进入设置状态时,设置指示灯亮,进行数据Fo、闸门、鸣叫功能的设置。
4.4.
5.1 数据设置:
置―设置‖灯亮,按7或8键,使“数据”指示灯亮。
按6键,18显示数据窗口的某一位数字跳动。
n = 1 ~ 8,p = 00 v ~ 999,(n —组数,共8组。
P = 数据)。
按7、8、9、10键,输入数据,最后按6表示数据输入完毕。
4.4.
5.2 Fo设置:
置―设置‖灯亮,按7或8键,使“Fo‖指示灯亮,按6键,18显示数据窗口的某一位跳动。
按7、8、9、10键,输入所需数据。
最后按6键,表示数据输入完毕(小数点表示KHz单位)。
4.4.
5.2 闸门设置:
置―设置‖灯亮,按7或8键,使“闸门‖指示灯亮,操作同4.4.5.2 。
4.4.
5.3 鸣叫:
置―设置‖灯亮,按7或8键,使“鸣叫‖指示灯亮,18显示b = ON / OFF.。
按6键,使某一状态跳动,7、8键选择所需的状态,6键加以确定。
五、操作维护注意事项
5.1 本仪器维修时,严禁使用两芯电源线的电烙铁。
测试仪器或其他设备外壳应接地良好。
5.2 本仪器出现故障时,若用户自己修理有困难时应及时返回工厂修理。
晶体测试仪操作指南
打开包装,将测试仪器和电源线,测试盒取出,放在干净,通风,无尘的环境下。
操作如下:
1 将电源线一头插入仪器的电源插座上(插紧),另一头接入市电(220V,50-60HZ)。
接通电源后,前面板左上方的绿色指示灯亮。
2 将测试盒的测试接口接入测试仪前面板插测处,(注意:接插件的缺口在插入时应听到―哒‖声。
)
3.打开前面板左下方的电源开关。
即按下红色件,当前面示窗显示10,000000000。
同时左上方闸门指示灯亮,并闪动。
闸门时间灯:―1S‖亮,功能在自校指示灯亮,右上方指示在MHZ。
说明测试仪器一切正常,此时显示为:10MHE。
4.移动功能键可选择测频,测误差和频率设置。
5.频率的测量:前面板右边有两个测量接口,输入接口可做有源信号的测试。
插测接口可做晶体的测量,做测量时需用附件——晶体测试盒。
(注意:两个接口不能做同时测量。
)
6.频率误差的测量:将功能选择呈‖误差‖.将被测晶体插入测试盒的晶体插入口,显示窗口就可显示被测晶体的PPM值.如被测晶体偏负,显示窗口显示―-‖符号。
如被测晶体偏正,显示窗口则不加符号。
前面板右上方单位指示在PPM上。
7.移动键可改变取样时间(即测试速度)。
取样时间分别有:0。
01S;0。
1S;1S;10S。
0.01S速度最快,10S速度最慢。
为保证测试精度准确,请尽可能慢速测量。
因为取样速度越快,精度相对越低。
建议用0。
1S或1S测量。
8.设置:设置是对被测频率而设置的频率比对标准。
如被测晶体的频率是非颠倒32。
768KHG,仪器设置频率就显示32。
768KHG。
如改变了比对标准(即设置的频率),所测量的结果就不准确。
故本仪器出厂设置在本世纪内32。
768KHG上。
如果所测晶体频率没有改变,不要去动设置功能键。
如果测量结果远离正常值,请查看设置标准是否在所需测量的标准频率上。
9.注意:前面板右下方的插测接口不能金属短路,否则将损坏该仪器。
10.在测量1MHZ以下的频率必须将干扰键按下。
如不按下干扰键,则测量结果不准确。
在测量MHZ频率时则不可按下干扰键。
11.当所测量的频率大于5V时,请按下衰减键。
12.若由于操作不当而造成仪器死机(即不能进入工作状态)可关机。
将红色键弹出后按上述步骤重新启动。
