Generation of Anammox-optimal nitriteammonium ratio with SHARON process usefulness of proce
兰花的遗传结构和进化

Evolution through either natural selection or genetic drift is dependent on variation at the genetic and mor-phological levels. Processes that influence the genetic structure of populations include mating systems, effective population size, mutation rates and gene flow among populations. We investigated the patterns of population genetic structure of orchids and evaluated if evolutionary processes are more likely at the indi-vidual population level than at the multipopulation/species level. We hypothesized that because orchid populations are frequently small and reproductive success is often skewed, we should observe many orchids with high population genetic substructure suggesting limited gene flow among pop-ulations. If limited gene flow among populations is a common pattern in orchids, then it may well be an important component that affects the likelihood of genetic drift and selection at the local population level. Such changes may lead to differentiation and evolu-tionary diversification.A main component in evolutionary processes is the necessary condition of isolation. The amount of gene flow among local populations will determine whether or not individual populations (demes) can evolve inde-pendently which may lead to cladogenesis. Usually one migrant per generation is sufficient to prevent populations from evolving independently from other populations when effective population sizes are large. Theoretically, if the gene flow rate, Nm (the effective number of migrants per generation; N = effective pop-ulation size, m = migration rate), is larger than two individuals per generation, then it is sufficient to pre-vent local adaptation while gene flow less than one per generation will likely result in population differen-tiation by selection or genetic drift (Merrell 1981, Roughgarden 1996). If Nm lies between one and two, there will be considerable variation in gene frequen-cies among populations (Merrell 1981). Consequently,populations will have similar genetic structure as if mating were panmictic (Nm >2). Alternatively, if gene flow is low (Nm < 1), populations will have different genetic structures that may result in evolutionary change through either adaptation to the local environ-ments via natural selection or through random effects such as genetic drift.Direct observation of gene flow can be viewed by the use of mark and recapture studies (for mobile organisms, or stained pollen) or tracking marker alle-les (paternity analysis) over a short number of genera-tions. Few orchid studies have attempted to directly observe gene flow and thus far only staining or micro-tagging pollinaria have been used (Peakall 1989, Nilsson et al.1992, Folsom 1994, Tremblay 1994, Salguero-Faría & Ackerman 1999). All these studies examined gene flow only within populations. Indirect methods for detecting gene flow are obtained from allele frequencies and are an estimate of the average long-term effect of genetic differentiation by genetic drift. The alleles are assumed to be neutral so that genetic differentiation based on these markers would be a consequence of drift rather than natural selection. Bohomak (1999) concluded that simple population genetic statistics are robust for inferring gene flow among groups of individuals.The most common approach is the degree of popula-tion differentiation at the genetic level using Wright’s F estimates on data obtained through protein elec-trophoresis or various PCR type approaches. The F statistics separate the amount of genetic variation which can be attributed to inbreeding among closely related individuals in a population: FIS is the inbreed-ing coefficient within individuals; FIT is the result of non random mating within a population and the effect of population subdivision; and a third statistic, FST, is the fixation index due to random genetic drift and the lack of panmixia among populations (Wright 1978).THE GENETIC STRUCTURE OF ORCHID POPULATIONSAND ITS EVO L U T I O N A R Y IMPORTA N C ER AYMOND L. T REMBLAY1,3&J AMES D. A CKERMAN21University of Puerto Rico – Humacao, Department of Biology, Humacao, Puerto Rico, 00791, U.S.A.2University of Puerto Rico – Río Piedras, Department of BiologyP.O. Box 23360, San Juan, Puerto Rico, 00931-3360, U.S.A.3Author for correspondence: raymond@LANKESTERIANA 7: 87-92. 2003.LANKESTERIANA SpeciesReferencesNm(W)Gst Calypso bulbosa (L.) Oakes Alexandersson & Ågren 2000 3.200.072Caladenia tentaculata TatePeakall & Beattie 19967.1010.0346Cephalanthera damasonium (Mill.) Druce Scacchi, De Angelis & Corbo 1991--5--5C ephalanthera longifolia (L.) Fritsch Scacchi, De Angelis & Corbo 1991 2.1510.104Cephalanthera rubra (L.) Rich.Scacchi, De Angelis & Corbo 19910.7610.247Cymbidium goeringii Rchb. f.Chung & Chung 1999 2.300.098Cypripedium acaule Ait.Case 19941.2710.164Cypripedium calceolus L.Case 1993, 1994 1.6310.196Cypripedium candidum Muhl. ex Willd.Case 19943.3710.069Cypripedium fasciculatum Kellogg ex S. Watson Aagaard, Harrod & Shea 1999 6.000.04Cypripedium kentuckiense C. F. Reed Case et al.1998 1.1210.182Cypripedium parviflorum Salisb.var. pubescens (Willd.) O. W. Knight Case et al.19981.2810.163Southern populations Wallace & Case 20000.940.209Northern populations1.570.137var. makasin (Farw.) Sheviak 1.000.199var parviflorum 1.430.149species level0.830.232Cypripedium reginae WalterCase 19940.4710.349Dactylorhiza romana (Sebastiani) SoóBullini et al.2001 3.3210.07Dactylorhiza sambucina (L.) SoóBullini et al.20011.3110.16Epidendrum conopseum R. Br.Bush, Kutz & Anderton 19991.4330.149Epipactis helleborine (L.) Crantz Scacchi, Lanzara & De Angelis 19877.310.033European populations Squirrell et al., 20011.0010.2000.241,40.5064North AmericanHollingsworth & Dickson 19970.09042.5310.2400.791Epipactis youngiana Richards & Porter Harris & Abbott 1997 2.4310.093Eulophia sinensis Miq.Sun & Wong 2001---0.00.1331,30.6533Gooyera procera Ker-Gawl.Wong & Sun 19990.22110.5230.3971,30.3863Gymnadenia conopsea (L.) R. Br.Scacchi & De Angelis 19900.28010.471Gymnadenia conopsea (L.) R. Br. conopsea Soliva & Widmer 19992.960.078Gymnadenia conopsea (L.) R. Br.subsp densiflora (Wahl) E.G. Camus & A. Camus Soliva & Widmer 19990.390.391Lepanthes caritensis Tremblay & Ackerman Carromero, Tremblay & Ackerman 1.300.167(unpublished)Lepanthes rupestris Stimson Tremblay & Ackerman 2001 1.840.170Lepanthes rubripetala Stimson Tremblay & Ackerman 20010.620.270Lepanthes eltoroensis Stimson Tremblay & Ackerman 20010.890.220Lepanthes sanguinea Hook.Carromero, Tremblay & Ackerman 1.450.144(unpublished)Table 1. Estimates of gene flow in orchids. Nm(W) = gene flow estimates based on Wright’s statistics; Gst coeff-cient of genic differentiation among populations. 1Nm calculated by the present authors from Gst or Fst using formula on p. 320 of Hartl & Clark (1989). 2Recalculated using previous formula, original Nm value 3.70. 3Calculated from RAPD markers. 4Calculated from cpDNA. 5No genetic differentiation found among populations. 6Calculated according to Weir and Cockerham’s statistics. 7. Estimated using RAPD’s and AMOVA.88Nº 7T REMBLAY&A CKERMAN- Genetic structure of orchid populationsConsequently, if we make the assumption that the genetic markers sampled are neutral or nearly neutral and that the observed level of FST is a measure of the current gene flow among populations (rather than a historical remnant), then we can evaluate the likelihood that populations are effectively isolated. The scale of FST is from 0 (no population subdivision) to 1.0 (com-plete genetic differentiation among populations).We gathered population genetic data for 58 species of terrestrial and epiphytic orchids from temperate and tropical species. The data are biased toward ter-restrial/temperate species (N = 44). We found only three studies of terrestrial/tropical species and ten epi-phytic/tropical. There is also a bias toward certain taxa: Orchis, Cypripedium, Pterostylis and Lepanthes account for nearly half (30) of the 61 records (Table 1), 10 species of O r c h i s, 7 species each of Cypripedium and Pterostylis, 6 species of Lepanthes,3 species of S p i r a n t h e s, Epipactis, Cephalantheraa n d G y m n a d e n i a, 2 species of D a c t y l o r h i z a, Epipactis, Vanilla and Zeuxine, and one species each of Caladenia, Calypso, Cymbidium, Epidendrum, Eulophia, Goodyera, Nigritella, Paphiopedilum, Platanthera, Tipularia, and Tolumnia.89Mayo 2003Gene flow among populations varies among species ranging from a high of 12 effective migrants per gen-eration in Orchis longicornu(Corrias et al. 1991) to lows of less then 0.2 in Zeuxine strateumatica(Sun & Wong 2001). Assembling the species in groups based on their estimates of gene flow, we note that 18 species have less then one migrant per generation, while 19 species have more than two migrants per generation, and 17 of the species have a migration rates between one and two. No genetic differentiation was found among populations for C e p h a l a n t h e r a d a m a s o n i u m(Scacchi, De Angelis & Corbo 1991) and Spiranthes hongkongensis(Sun 1996). Consequently these two species are excluded from further analysis.O r c h i s species typically have high estimates of gene flow among populations (Scacchi, De Angelis & Lanzara 1990, Corrias et al. 1991, Rossi et al. 1992) whereas Lepanthes and Pterostylis species have much lower gene flow estimates (Tremblay & Ackerman 2001, Sharma, Clements & Jones 2000; Sharma et al.2001). However even within a genus variation in gene flow can be extensive (Table 1).Are there phylogenetic associations with gene flow? The data for O r c h i s(mean Nm = 5.7), L e p a n t h e s(mean Nm = 2.1) and P t e r o s t y l i s( m e a n Nm = 1.0) are suggestive, but much more extensive sampling is needed for both temperate and tropical species. Curiously, L e p a n t h e s and O r c h i s have very different population genetic parameters yet both are species-rich genera and are likely in a state of evolu-tionary flux. It seems to us that orchids have taken more than one expressway to diversification. For the group of species which has more than 2 migrants per generation local populations will not evolve indepen-dently, but as a group, consequently local morpholog-ical and genetic differences among groups will be wiped out, and populations will become homoge-neous if gene flow continues at the level. When gene flow is high, selection studies from different popula-tions should be evaluated together (Fig. 1).For populations that have less than one migrant perLANKESTERIANAFigure 1: Distribution of mean (s.e.) gene flow (Nm) among genera of Orchids. Bars without error bars of single datap o i n t s.90Nº 7T REMBLAY&A CKERMAN- Genetic structure of orchid populationsgeneration, local populations can evolve independent-ly, and evolutionary studies should be done at the local level. In small populations, we may expect genetic drift to be present and selection coefficients should be high to counteract the effects of drift.For species with intermediate gene flow it is proba-bly wise to evaluate evolutionary processes at the local and multi-population/species level. We expect variance in migration rates to be large because of the skewed reproductive success among individuals, time periods and populations. Consequently, the outcome of the evolutionary process will likely depend on the amount and variation of the migration events and consistency in migration rates in time. If variance in gene flow through space and time is small, then the genetic dif-ferentiation will be more or less stable. But, for exam-ple, if variance in gene flow is high, with some periods having high gene flow followed by little or no gene flow for an extended period of time, it is possible that through natural selection and genetic drift local popula-tions might differentiate sufficiently for cladogenesis during the period of reduced immigration.Species with less than one migrant per population are basically unique evolutionary units evolving inde-pendently from other local populations. In popula-tions with large Ne (> 50), it is likely that natural selection will dominate evolutionary processes while if Ne is small (< 50) genetic drift and selection can both be responsible for evolution. Consequently for these species, local adaptation to specific environ-mental conditions is possible.This survey of population genetics studies of orchids shows that multiple evolutionary processes have likely been responsible for the remarkable diver-sification in orchids.L ITERATURE C ITEDAagaard J.E., R.J. Harrod & K.L. Shea. 1999. Genetic vari-ation among populations of the rare clustered lady-slip-per orchid (Cypripedium fasciculatum) from Washington State, USA. Nat. Areas J. 19: 234-238Ackerman J.D. & S. Ward. 1999. Genetic variation in a widespread epiphytic orchid: where is the evolutionary potential? Syst. Bot. 24: 282-291.Alexandersson, R. & J. Ågren. 2000. Genetic structure of the nonrewarding bumblebee pollinated Calypso bul-bosa. Heredity 85: 401-409Arduino, P., F. Verra, R. Cianchi, W. Rossi, B. Corrias, & L. Bullini. 1996. Genetic variation and natural hybridization between Orchis laxiflora and O r c h i s palustris(Orchidaceae). Pl. Syst. Evol. 202: 87-109. Arft, A.M. & T.A. Ranker. 1998. Allopolyploid origin and population genetics of the rare orchid Spiranthes diluvi-alis. Am. J. Bot. 85: 110-122.Bohomak, A.J. 1999. Dispersal, gene flow, and population structure. Quart. Rev. Biol. 74: 21-45.Bullini, L., R. Cianchi, P. Arduino, L. De Bonis, M. C. Mosco, A. Verdi, D. Porretta, B. Corrias & W. Rossi. 2001. Molecular evidence for allopolyploid speciation and a single origin of the western Mediterranean orchid Dactylorhiza insularis(Orchidaceae). Biol. J. Lin. Soc. 72: 193-201.Bush, S.T., W.E. Kutz & J.M. Anderton. 1999. RAPD variation in temperate populations of epiphytic orchid Epidendrum conopseum and the epiphytic fern Pleopeltis polypodioides. Selbyana 20: 120-124. Case, M.A. 1993. High levels of allozyme variation within Cypripedium calceolus(Orchidaceae) and low levels of divergence among its varieties. Syst. Bot. 18: 663-677. Case, M.A. 1994. Extensive variation in the levels of genetic diversity and degree of relatedness among five species of Cypripedium(Orchidaceae). Amer. J. Bot. 81: 175-184.Case, M.A., H.T. Mlodozeniec, L.E. Wallace & T.W. Weldy. 1998. Conservation genetics and taxonomic sta-tus of the rare Kentucky Lady’s slipper: C y p r i p e d i u m k e n t u c k i e n s e(Orchidaceae). Amer. J. Bot. 85: 1779-1779.Chung, M.Y. & M.G. Chung. 1999. Allozyme diversity and population structure in Korean populations of Cymbidium goeringii(Orchidaceae). J. Pl. Res. 112: 139-144.Corrias, B., W. Rossi, P. Arduino, R. Cianchi & L. Bullini. 1991. Orchis longicornu Poiret in Sardinia: genetic, morphological and chronological data. Webbia 45: 71-101.Folsom, J.P. 1994. Pollination of a fragrant orchid. Orch. Dig. 58: 83-99.Harris, S.A. & R. J. Abbott. 1997. Isozyme analysis of the reported origin of a new hybrid orchid species, Epipactis y o u n g i a n a(Young’s helleborine), in the British Isles. Heredity 79: 402-407.Hedrén, M., E. Klein & H. Teppner. 2000. Evolution of polyploids in the European orchid genus N i g r i t e l l a: Evidence from allozyme data. Phyton 40: 239-275. Hollingsworth, P.M. & J.H. Dickson. 1997. Genetic varia-tion in rural and urban populations of Epipactis helle-b o r i n e(L.) Crantz. (Orchidaceae) in Britain. Bot. J. Linn. Soc. 123: 321-331.Li, A, Y., B. Luo & S. Ge. 2002. A preliminary study on conservation genetics of an endangered orchid (Paphiopedilum micranthum) from Southwestern China. Bioch. Gen. 40: 195-201.Merrell, D.J. 1981. Ecological Genetics. University of Minnesota Press, Minneapolis, Minnesota.Nielsen, L.R. & H.R. Siegismund. 2000. Interspecific dif-ferentiation and hybridization in V a n i l l a s p e c i e s (Orchidaceae). Heredity 83: 560-567.91Mayo 2003LANKESTERIANANilsson, L.A., E. Rabakonandrianina & B. Pettersson. 1992. Exact tracking of pollen transfer and mating in plants. Nature 360: 666-667.Peakall, R. 1989. A new technique for monitoring pollen flow in orchids. Oecologia 79: 361-365.Peakall, R. & A. J. Beattie. 1996. Ecological and genetic consequences of pollination by sexual deception in the orchid Caladenia tentaculata. Ecology 50: 2207-2220. Rossi, W., B. Corrias, P. Arduino, R. Cianchi & L. Bullini L. 1992. Gene variation and gene flow in Orchis morio (Orchidaceae) from Italy. Pl. Syst. Evol. 179: 43-58. Roughgarden, J. 1996. Theory of population genetics and evolutionary ecology: An Introduction. Prentice Hall, Upper Saddle River, NJ, USA.Salguero-Faría, J.A. & J.D. Ackerman. 1999. A nectar reward: is more better? Biotropica 31: 303-311. Scacchi, R., G. De Angelis & R.M. Corbo. 1991. Effect of the breeding system ion the genetic structure in C e p h a l a n t h e r a spp. (Orchidaceae). Pl. Syst. Evol. 176: 53-61.Scacchi, R., G. De Angelis & P. Lanzara. 1990. Allozyme variation among and within eleven Orchis species (fam. Orchidaceae), with special reference to hybridizing apti-tude. Genetica 81: 143-150.Scacchi, R. and G. De Angelis. 1990. Isoenzyme polymor-phisms in G y m n a e d e n i a[sic] c o n o p s e a and its infer-ences for systematics within this species. Bioch. Syst. Ecol. 17: 25-33.Scacchi, R., P. Lanzara & G. De Angelis. 1987. Study of electrophoretic variability in Epipactis heleborine ( L.) Crantz, E. palustris(L.) Crantz and E. microphylla (Ehrh.) Swartz (fam. Orchidaceae). Genetica 72: 217-224.Sharma, I.K., M.A. Clements & D.L. Jones. 2000. Observations of high genetic variability in the endan-gered Australian terrestrial orchid Pterostylis gibbosa R. Br. (Orchidaceae). Bioch. Syst. Ecol. 28: 651-663. Sharma, I.K., D.L. Jones, A.G. Young & C.J. French. 2001. Genetic diversity and phylogenetic relatedness among six endemic P t e r o s t y l i s species (Orchidaceae; series Grandiflorae) of Western Australia, as revealed by allozyme polymorphisms. Bioch. Syst. Ecol. 29: 697-710.Smith, J.L., K.L. Hunter & R.B. Hunter. 2002. Genetic variation in the terrestrial orchid Tipularia discolor. Southeastern Nat. 1: 17-26Soliva, M. & A. Widmer A. 1999. Genetic and floral divergence among sympatric populations of Gymnadenia conopsea s.l. (Orchidaceae) with different flowering phenology. Int. J. Pl. Sci. 160: 897-905. Squirrell, J., P.M. Hollingsworth, R.M. Bateman, J.H. Dickson, M.H.S. Light, M. MacConaill & M.C. Tebbitt. 2001. Partitioning and diversity of nuclear and organelle markers in native and introduced populations of Epipactis helleborine(Orchidaceae). Amer. J. Bot. 88: 1409-1418.Sun, M. 1996. Effects of Population size, mating system, and evolution origin on genetic diversity in S p i r a n t h e s sinensis and S. hongkongensis. Cons. Biol. 10: 785-795. Sun, M. & K.C. Wong. 2001. Genetic structure of three orchid species with contrasting breeding system using RAPD and allozyme markers. Amer. J. Bot. 88: 2180-2188.Tremblay, R.L. 1994. Frequency and consequences of multi-parental pollinations in a population of Cypripedium calceolus L. var. pubescens(Orchidaceae). Lindleyana 9: 161-167.Tremblay, R.L & J.D. Ackerman. 2001. Gene flow and effective population size in Lepanthes(Orchidaceae): a case for genetic drift. Biol. J. Linn. Soc. 72: 47-62. Wallace, L.A. 2002. Examining the effects of fragmenta-tion on genetic variation in Platanthera leucophaea (Orchidaceae): Inferences from allozyme and random amplified polymorphic DNA markers. Pl. Sp. Biol 17: 37-39.Wallace, L.A. & M. A. Case. 2000. Contrasting diversity between Northern and Southern populations of Cypripedium parviflorum(Orchidaceae): Implications for Pleistocene refugia and taxonomic boundaries. Syst. Bot. 25: 281-296.Wong, K.C. & M. Sun. 1999. Reproductive biology and conservation genetics of Goodyera procera (Orchidaceae). Amer. J. Bot. 86: 1406-1413.Wright, S. 1978. Evolution and the genetics of popula-tions. Vol. 4. Variability within and among natural pop-ulations. Chicago, The University of Chicago Press.Raymond L. Tremblay is an associate professor at the University of Puerto Rico in Humacao and the graduate faculty at UPR- Río Piedras. He obtained his B.Sc. with Honours at Carleton University, Ottawa, Canada in 1990 and his PhD at the University of Puerto Rico in Rio Piedras in 1996. He is presently the chairman of the In situ Orchid Conservation Committee of the Orchid Specialist Group. He is interested in evolutionary and con-servation biology of small populations. Presently his interest revolves in determining the life history characters that limit population growth rate in orchids and evaluating probability of extinction of small orchid populations. James D. Ackerman, Ph.D., is Senior Professor of Biology at the Univesrity of Puerto Rico, Río Piedras. He is an orchidologist, studying pollination an systematics.92Nº 7。
预氧化技术

3 Introduction
• ClO2 oxidation prior to chlorination can reduce the levels of THM and total organic halogen (TOX) formation (Lykins and Griese,1986; Linder et al., 2006 ).
(1) the changes of NOM properties with ClO2 pretreatment.
(2) the formation of regulated and emerging DBPs from ClO2 preoxidation and in combination with chlorination or chloramination.
第33页,共33页。
• 与浊度不同,滤后水高锰酸盐指数自运行开始后一直保持稳定,说 明生物过滤对水中易氧化有机物的去除相关性不大;滤后水UV254 变化很小,说明难生物降解(shēnɡ wù jiànɡ jiě)有机物很难在生物 过滤中被去除; O3 —生物过滤对DOC 的去除率稍高。O3 和PPC 预氧化后SUVA 相对于空白试验分别降低和升高(见表1) ,而 O3 —生物过滤出水SUVA 升高较明显(见表2) ,说明O3 预氧化更 有助于生物过滤对可生物降解(shēnɡ wù jiànɡ jiě)有机物的去除。
transformed large aromatic and long aliphatic chain organic structures to small
and hydrophilic organics.
第33页,共33页。
Conclusion
氧化钛纳米片材料的合成及其催化应用进展

CHEMICAL INDUSTRY AND ENGINEERING PROGRESS 2017年第36卷第7期·2488·化 工 进展氧化钛纳米片材料的合成及其催化应用进展李路1,2,徐金铭2,齐世学1,黄延强2(1烟台大学化学与化工学院,山东 烟台 264005;2中国科学院大连化学物理研究所,航天催化与新材料研究室,辽宁 大连 116023)摘要:氧化钛纳米片材料为一种新兴的二维层状材料,在催化、环境、能源和电子领域引起人们广泛的关注。
本文从催化研究的角度出发,综述了氧化钛纳米片材料的结构、制备方法、金属及非金属元素的掺杂、纳米片基复合材料和其在光催化、光电催化和热催化等方面的应用进展。
分析表明氧化钛纳米片材料拥有特殊的形貌和特别的物理化学性质,通过控制材料的组成及结构变化,能够实现氧化钛纳米片材料的多种功能化。
指出氧化钛纳米片材料虽然有着优良的性能,但是在实际应用中远不能满足要求。
因此,优化合成和探索新形式的二氧化钛纳米片材料,对其表面进行改性及开发具有特殊功能纳米复合材料是解决其瓶颈的有效途径。
探索催化反应过程中的反应机理,开发氧化钛纳米片基工业应用催化剂将是今后重要的研究方向。
关键词:氧化钛纳米片;层状钛酸盐;催化;合成;纳米材料中图分类号:O611.4 文献标志码:A 文章编号:1000–6613(2017)07–2488–09 DOI :10.16085/j.issn.1000-6613.2016-2340Recent advances in titanium oxide nanosheets for catalytic applicationsLI Lu 1,2,XU Jinming 2,QI Shixue 1,HUANG Yanqiang 2(1College of Chemistry and Chemical Engineering ,Yantai University ,Yantai 264005,Shandong ,China ;2Laboratory of Catalysts and New Materials for Aerospace ,Dalian Institution of Chemical Physics ,Chinese Academy of Science ,Dalian 116023,Liaoning ,China )Abstract: As a new class 2D layered materials ,Titanium oxide nanosheets have attracted great interest inthe fields of catalysis ,environment ,energy and electronics. In this work ,we provide an overview of the recent advance of titanium oxide nanosheets on their layered structure ,synthetic methods ,doping with metals or nonmetal ,as well as their nanocomposites and applications in catalysis. Recent researches indicate that titanium oxide nanosheets with unique structure and special physical and chemical properties can achieve multiple functions by controlling their compositions and structures. Although titanium oxide nanosheets have a lot of advantages ,they are still far from practical applications. Therefore it is demanded to explore new synthesis ,doping and modification methods ,and develop new composite materials. In addition ,the reaction mechanism in the catalytic reaction process and the industrial application of titanium oxide nanosheets will be important research directions in the future. Key words :titanium oxide nanosheets ;layered titanate compounds ;catalysis ;synthesis ;nanomaterials助理研究员,从事有序介孔材料合成及表面修饰和生物质催化转化制化学品相关科研工作。
舒敏之星导入绽美娅屏障修复乳治疗敏感性皮肤疗效观察

fiber laser with few-layer molybdenum disulfide n a n o p l a t e s[J].O p t L e t t,2015,40(15):3576-9.DOI:10.1364/OL.40.003576.[8] 吕克己,汪锋.调Q激光治疗黄褐斑52例临床观察[J].中国中西医结合皮肤性病学杂志,2017,16(02):160.DOI:10.3969/j.issn.1672-0709.2017.02.022.[9] Wang L,Schmid M,Nilsson ZN,et ser AnnealingImproves the Photoelectrochemical Activity of Ultrathin MoSe2 Photoelectrodes[J].ACS Appl Mater Interfaces,2019,11:(21):19207-19217.DOI:10.1021/acsami.9b04785.Epub 2019 May 17.[10] 滕春雨.不同波长调Q激光治疗雀斑的疗效及安全性分析[J].中国医药指南,2018,16(13):188-189.DOI:CNKI:SUN:YYXK.0.2018-13-135.[11] Wang B,Xie HF,Tan J,et al.Induction of melasmaby 1064-nm Q-switched neodymium:yttrium-aluminum-garnet laser therapy for acquired bilateral nevus of Ota-like macules (Hori nevus):A study on related factors in the Chinese population[J].J Dermatol,2016,43(6):655-661.DOI:10.1111/1346-8138.13193.[12] 贾高蓉,赵文文,黄玉清,等.调Q-Nd:YAG激光治疗口周黑子肠道息肉综合征的护理[J].中华现代护理杂志,2016,22(3):395-397.DOI:10.3760/cma.j.issn.1674-2907.2016.03.028.舒敏之星导入绽美娅屏障修复乳治疗敏感性皮肤疗效观察林丽丽,许文萍(泉州市皮肤病防治院医学美容中心,福建 泉州,362000)【摘 要】目的 观察舒敏之星导入绽美娅屏障修复乳治疗敏感性皮肤的疗效。
金属离子对厌氧氨氧化工艺的影响研究综述

作者简介:刘野(1992.02-),男,汉族,吉林省人,本科,吉林省松原石油化工股份有限公司,水处理方向。
厌氧氨氧化(Anammox)是指在厌氧或者缺氧条件下,Anammox 菌利用NO 2-为电子受体,将NH 4+直接氧化成N 2的过程,是目前为止最为经济简便的生物脱氮方式[1-2]。
Anammox 提供了一种新的思路,与传统脱氮工艺相比,可大大降低能源和化学药剂的消耗,为今后污水处理降低成本、简化脱氮过程提供了可能,具有很好的发展空间。
尽管厌氧氨氧化工艺的应用目前仅限于高浓度氨氮废水的脱氮处理,但有关低温厌氧氨氧化、反硝化耦合厌氧氨氧化的实验室研究表明,Anammox 菌具有非常大的潜能,将会以几种不同的方式应用于污水处理领域。
为了实现这些最新研究成果的工业化应用,进一步的可行性研究很有必要。
但是Anammox 菌倍增时间长,极难富集,且影响Anammox 菌生长因素众多,其中金属离子对Anammox 菌的影响更是复杂多变。
因此,国内外众多学者研究了各金属离子对Anammox 菌群的影响,以便在实际应用中强化有利方面,规避不利的影响,以提高Anammox 工艺的脱氮效率。
1Fe 离子对厌氧氨氧化活性的影响Fe 离子作为细胞血红素的合成元素,对Anammox 菌起着至关重要的作用,因此研究Fe 离子对Anammox 工艺的影响显得尤为重要[3]。
李祥等[4]通过接种厌氧氨氧化污泥研究了Fe 2+和Fe 3+浓度对Anammox 菌活性的影响,得出当进水铁离子浓度达5mg/L 时,厌氧氨氧化污泥活性达最大,且不同价态铁离子浓度对污泥的脱氮效能没有明显差异。
而Fe 2+比Fe 3+更适合Anammox 菌的生长需求,有利于Anammox 菌的富集。
因此可以在反应器内少量铁块,防止Fe 2+转化为Fe 3+。
2Ca 2+、Mg 2+离子对厌氧氨氧化活性的影响Ca 2+和Mg 2+等金属阳离子可以压缩双电子层,促进生物污泥的聚集,而且其与胞外多聚物的粘黏可以加速污泥颗粒化的形成[5]。
全身运动不安运动阶段质量评估对婴幼儿神经系统疾病预测价值的Meta分析

全身运动不安运动阶段质量评估对婴幼儿神经系统疾病预测价值的Meta分析门光国;王凤敏;崔英波【摘要】目的探讨婴幼儿早期(出生后20周内)全身运动(GMs)不安运动阶段质量评估对婴幼儿神经系统疾病的预测价值.方法利用数据库检索到2015年12月前发表的相关文献,共有16篇文献纳入研究并进行Meta分析.结果 16篇文献QUADAS评分≥10的有8篇,临床特征等信息差异均无统计学意义(P>0.05).GMs 不安运动阶段质量评估对神经系统发育不良结局(包括脑性瘫痪)的预测分析显示,灵敏度、特异度、阳性似然比(PLR)、阴性似然比(NLR)和诊断比值比(DOR)分别为0.78、0.93、11.26、0.24和55.43;SROC曲线表明灵敏度和特异度最佳结合点的Q值为0.852 2,AUC值为0.919 0.GMs不安运动阶段质量评估对脑性瘫痪的预测分析显示,灵敏度、特异度、PLR、NLR和DOR分别为0.91、0.94、12.91、0.12和133.66,SROC曲线表明灵敏度和特异度最佳结合点的Q值为0.918 5,AUC值为0.969 2.结论 GMs不安运动阶段质量评估是预测婴幼儿神经系统疾病的一种有效方法,但不推荐单独使用.【期刊名称】《浙江医学》【年(卷),期】2016(038)014【总页数】5页(P1161-1165)【关键词】全身运动;不安运动阶段;婴幼儿;神经系统疾病;脑性瘫痪;Meta分析【作者】门光国;王凤敏;崔英波【作者单位】315012 宁波市妇女儿童医院新生儿科;315012 宁波市妇女儿童医院新生儿科;315012 宁波市妇女儿童医院新生儿科【正文语种】中文全身运动(general movements,GMs)是一种复杂的动作,包括头部、躯干、手臂和腿的运动,出现于胎儿早期并持续到出生后3~4个月。
近年来,GMs质量评估对婴幼儿脑性瘫痪(CP)等神经系统疾病的预测价值得到越来越多证据支持[1-2]。
一种具有大斯托克斯位移和高光学稳定性的线粒体靶向近红外染料及其细胞成像应用(英文)

A mitochondria-targeting near-infrared dye with large Stokes shift and high optical stability for cellular imaging applicationsAbstractMitochondrial imaging is of great significance for studying mitochondrial function and for investigating diseases related to dysfunction in these organelles. Fluorescent dyes have been widely used for imaging mitochondria, however, there are challenges associated with achieving high optical stability and sufficient sensitivity for visualization. In this study, we developed a mitochondria-targeting near-infrared dye with a large Stokes shift and high optical stability for cellular imaging applications. The dye demonstrated excellent mitochondria-targeting ability and low cytotoxicity. Additionally, it displayed a large Stokes shift, which reduces spectral overlap and enables high signal-to-background ratios. This dye provides a powerful tool for mitochondrial imaging and has the potential to advance our understanding of mitochondrial biology and disease.IntroductionMitochondria are organelles that exist within eukaryotic cells, which play a crucial role in energy metabolism, programmed cell death and other cellular processes. Therefore, mitochondrial imaging has significant clinical and research applications, such as in diseases such as cancer, cardiovascular disease and neurological disorders.Fluorescent imaging is commonly used for mitochondrial imaging, but it remains challenging to achieve high optical stability and sufficient sensitivity. This is due to low fluorescence quantum yields of dyes, spectral overlap, and issues with photobleaching, phototoxicity and poor targeting efficiency.In order to overcome these challenges, we have developed a mitochondria-targeting near-infrared dye with a large Stokes shift and high optical stability, which has promising indications for use in cellular imaging applications.Materials and MethodsThe design of the dye was based on a coumarin-based chromophore coupled to a triphenylphosphonium ion (TPP) moiety, which is known for strong mitochondrial targeting. The TPP-coumarin (TPPC) conjugate was synthesized and characterized using standard synthetic methods.Cytotoxicity was measured by incubating the dye with human embryonic kidney cells (HEK293) for 24 hours and assessing cell viability. The mitochondrial-targeting ability of the dye was evaluated using confocal microscopy with MitoTracker as a reference.The optical stability of the dye was assessed through measurements of fluorescence intensity, and photobleaching and photostability tests were also performed.ResultsThe TPPC dye showed excellent mitochondria-targeting ability and low cytotoxicity. Confocal microscopy showed that the dye co-localized with MitoTracker in live cells, indicating that the dye can effectively target and accumulate in the mitochondria.The dye demonstrated a large Stokes shift of 104 nm, which significantly reduces spectral overlap and hence improves signal-to- background ratios, making it an ideal candidate for fluorescence imaging.The dye also showed high optical stability, with fluorescence intensity remaining stable over an extended period of time. Photobleaching and photostability tests demonstrated that the dye is highly resistant to photobleaching, and is maintained at high fluorescence intensity in prolonged exposure to intense light.DiscussionIn this study, we have demonstrated the successful development of a mitochondria-targeting near-infrared dye with a large Stokes shift and high optical stability. The dye showed excellent mitochondrial- targeting ability, low cytotoxicity, high photostability, and a large Stokes shift, indicating great potential for use in cellular imaging applications.With continued research and development, this dye could potentially be used to deepen our understanding of mitochondrial biology and related diseases. Future studies should continue to optimize the design of this dye, and explore its potential as a theranostic tool in targeted drug delivery and disease therapy.ConclusionIn summary, the mitochondria-targeting near-infrared dye with a large Stokes shift and high optical stability developed in this study represents a significant step towards the improvement of cellular imaging applications. The dye showed excellent mitochondrial-targeting ability, low cytotoxicity, and high photostability, and a large Stokes shift. It has the potential to advance our understanding of mitochondrial biology and disease. With further optimization, this research may lead to the development of a potent theranostic tool for targeted drug delivery and disease therapy.。
水凝胶文献
Research ArticleOrganic/Inorganic Superabsorbent HydrogelsBased on Xylan and MontmorilloniteShuang Zhang,1Ying Guan,1Gen-Que Fu,1Bo-Yang Chen,1Feng Peng,1Chun-Li Yao,1and Run-Cang Sun1,21Institute of Biomass Chemistry and Technology,College of Materials Science and Technology,Beijing Forestry University,Beijing100083,China2State Key Laboratory of Pulp and Paper Engineering,South China University of Technology,Guangzhou510640,ChinaCorrespondence should be addressed to Feng Peng;fengpeng@ and Chun-Li Yao;chunliyao2006@Received10December2013;Accepted2January2014;Published12February2014Academic Editor:Ming-Guo MaCopyright©2014Shuang Zhang et al.This is an open access article distributed under the Creative Commons Attribution License, which permits unrestricted use,distribution,and reproduction in any medium,provided the original work is properly cited.The unique organic/inorganic superabsorbent hydrogels based on xylan and inorganic clay montmorillonite(MMT)were prepared via grafting copolymerization of acrylic acid(AA)and2-acrylamido-2-methylpropanesulfonic acid(AMPS)with N,N-methylenebisacrylamide(MBA)as a cross-linking agent and potassium persulfate(KPS)as an initiator.The effect of variables on the swelling capacity of the hydrogels,such as the weight ratios of MMT/xylan,MBA/xylan,and AMPS/AA,was systematically optimized.The results indicated that the superabsorbent hydrogels comprised a porous cross-linking structure of MMT and xylan with side chains that carry carboxylate,carboxamide,and sulfate.The hydrogels exhibit the high compressive modulus(E),about 35–55KPa,and the compression strength of the hydrogels increased with an increment of the MMT content.The effect of various cationic salt solutions(LiCl,CaCl2,and FeCl3)on the swelling has the following order:Li+>Ca2+>Fe3+.Furthermore,the influence of pH values on swelling behaviors showed that the superabsorbent composites retained around1000g g−1over a wide pH range of6.0–10.0.The xylan-based hydrogels with the high mechanical and swelling properties are promising for the applications in the biomaterials area.1.IntroductionSuperabsorbent hydrogels are slightly cross-linked hydro-philic polymers with a three-dimensional network structure. They can absorb water in the amount from10%up to thousands of times based on their dry weight and retain large amounts of aqueous fluids even under some pressure.Due to the special characteristics,these materials have been widely applied in various fields,such as agriculture[1,2],biomedical area[3,4],waste-water treatment[5,6],biosensors[7],and tissue engineering[8,9].Polysaccharide-based hydrogels are currently attracting much interest for their unique properties,that is,biocompati-bility,biodegradability,renewability,and nontoxicity.Various polysaccharides,such as chitosan[10],starch[11],cellulose [12],alginate[13],carrageenan[14],and gellan gum[15],have been investigated on hydrogel formulations.Typically,hemi-celluloses are the second most abundant polysaccharides in biomass,which are commonly defined as cell wall het-erogeneous pared with other polysac-charides,hemicelluloses have been somewhat neglected in research and are normally disposed as organic waste from the forest industry side streams.While recent research has shown that hemicelluloses have significant potential as a material resource for hydrogel preparation.A series of hemicelluloses-based hydrogels were synthesized from galactoglucoman-nans,via introducing functional monomers with unsatu-rated bonds to the backbone of hemicelluloses and chemi-cally cross-linking the modified hemicelluloses[16–20].The hydrogels,presenting good biodegradability,nontoxicity,and controllable swelling capacity,were fully developed for drug delivery systems.In addition,xylan-based hydrogels have also shown potential applications as pH-sensitive controlled drug delivery vehicles by blending aspen hemicelluloses and chitosan in acidic conditions[21].Furthermore,xylan-rich hemicelluloses-based hydrogels were prepared and usedHindawi Publishing Corporation Journal of NanomaterialsVolume 2014, Article ID 675035, 11 pages /10.1155/2014/675035as a novel porous bioabsorbent by graft copolymerization of acrylic acid and hemicelluloses for absorption of heavy metal ions from aqueous solutions[22,23].Therefore,the applications of hemicelluloses in hydrogels field are gradually expanding.Arabinoxylans(AXs)are the main hemicelluloses of Gramineae,which have been generally present in a variety of tissue of the main cereals of commerce:wheat,rye,barley, oat,rice,corn,and sorghum,as well as other plants:pangola grass,bamboo shoot,and ray grass[24].Gramineae is similar to hardwood xylan,but the amount of L-arabinose is higher. Hydrogels have been prepared from AXs extracted from wheat bran as controlled release matrices,which were syn-thesized via the oxidative cross-linking using either chemical (ferulic chloride and ammonium persulphate)or enzymatic (laccase/O2and peroxidase/H2O2)free radical-generating agents[25–27].The gels present interesting properties like neutral taste and odor,high water absorption capability (up to100g of water per gram of dry polymer),and absence of pH,electrolyte,and temperature susceptibility [28].However,the water absorption capacity and mechanical strength of the AXs hydrogels are much lower than those of petroleum-based hydrogels such as poly(acrylic acid) and poly(acrylamide)hydrogels.Furthermore,the absence of multistimulus response properties severely restricts their applications.Therefore,more research attention should be paid to develop new approaches for modifying and cross-linking AXs to improve the properties of the hydrogels,such as absorption capacity,mechanical strength,and stimuli-responsive physical properties(normally temperature-,pH-, salt-,or osmosis-controlled changes).Recently,much attention has been focused on inorganic materials for preparation of superabsorbent composites,such as attapulgite[29],kaolin[30],and sodium silicate[31].The introduction of inorganic clay into polysaccharides not only reduces production costs but also improves the properties (e.g.,swelling ability,gel strength,and mechanical and thermal stability)of hydrogels and accelerates the generation of new materials for special application[32].Among the clays,montmorillonite(MMT),a layered aluminum silicate with exchangeable cations and reactive–OH groups on the surface,has been widely used to improve the properties of hydrogels,due to its good absorption,extensive swelling in water and cation exchange capacity[33].Y et,to the best of our knowledge,there has been no report on the preparation of superabsorbent hydrogels based on xylan and inorganic clays.Acrylic acid(AA)and2-acrylamido-2-methylprop-anesulfonic acid(AMPS)are important monomers that are widely used for the preparation of functional hydrogels. AMPS is hydrophilic monomer containing nonionic and anionic groups;meanwhile,AA is anionic monomer.The incorporation of ionic groups in the superabsorbent is known to increase their swelling capacity,while the nonionic groups can improve their salt tolerance.In this paper,a unique organic/inorganic hydrogel was prepared by grafting copolymerization of AA and AMPS monomers along the chains of AXs in the presence of MMT.The intermolecular interaction and morphological change of the hydrogels were characterized by FT-IR spectra and scanning electron microscope(SEM).Moreover,the swelling properties and behaviors under different pH and salt concentrations were investigated.2.Experimental2.1.Materials.Xylan was isolated from bamboo(Phyl-lostachys pubescens)holocellulose obtained by using3% NaOH at75∘C for3h with a solid to liquid ratio of1:25 (g⋅mL−1).The holocellulose was obtained by delignifica-tion of the extractive-free bamboo(40–60mesh)with6% sodium chlorite in acidic solution(pH3.6–3.8,adjusted by10%acetic acid)at75∘C for2h.The composition of neutral sugars and uronic acids and the molecular weights of the hemicellulosic samples were determined according to the literature[34].The sugar composition of the xylan (83.5%xylose,5.1%arabinose,4.2%glucose,0.4%galactose, and6.8%glucuronic acid(relatively molar percent))was tested by high performance anion exchange chromatography (HPAEC).The molecular weights obtained by gel permeation chromatography(GPC)showed that the native xylan had a weight average molecular weight(Mw)of13,420g⋅mol−1and a polydispersity of4.1,corresponding to a degree of polymer-ization of88.2-Acrylamido-2-methyl-1-propanesulfonic acid (AMPS)and montmorillonite(MMT)were purchased from A Johnson Mattey Company.N,N-Methylenebisacrylamide (MBA)and potassium persulfate(KPS)were purchased from Tianjin Jinke Refined Chemical Engineering Research Institute,China.All of these chemicals were used without any further purification.AA(Beijing Yili Fine Chemical Co.,Ltd., China)was purified by distillation under reduced pressure to remove the inhibitor hydroquinone before use.All other reagents used were analytical grade,and all solutions were of prepared with distilled water.2.2.Preparation of Hydrogels.Xylan(1.0g)was dissolved in 35.0mL of distilled water in a three-neck reactor equipped with a mechanical stirrer,a reflux condenser,and a nitrogen line at85∘C until a homogeneous solution was obtained. Then appropriate amounts(0.00–0.12g)of MMT were added to this solution with stirring to form a uniform sticky solution under nitrogen.After cooling the reactant to70∘C, 0.08g of KPS were added,stirred,and kept for10min to generate radicals.Subsequently,the mixture of AA(1.43–2.86g,neutralization degree of70%with sodium hydroxide solution),AMPS(1.14–2.57g),and MBA(0.05–0.25g)was added to the flask.All the reactions were carried out under nitrogen,and the reaction mixture was continuously stirred for4h.At the end of the propagation reaction,the gel product was poured into excess ethanol(200mL)and remained for 48h to dewater.Then,the dewatered product was dried to constant mass at70∘C,grounded,and passed through100-mesh sieve.Finally,the powdered products were stored away from moisture,heat,and light.The feed compositions of all samples are listed in Table1.Table1:The reaction conditions for xylan-g-poly(AA-AMPS)/MMT hydrogels.Sample codes MMT/xylan(g g−1)AMPS(g)MBA(g)AA(g) 1— 1.000.10 2.00 20.03 1.000.10 2.00 30.05 1.000.10 2.00 40.08 1.000.10 2.00 50.11 1.000.10 2.00 60.08 2.000.05 2.00 70.08 2.000.10 2.00 80.08 2.000.15 2.00 90.08 2.000.20 2.00 100.08 2.000.25 2.00 110.08 1.140.10 2.28 120.08 1.780.10 2.22 130.08 2.000.10 2.00 140.08 2.330.10 1.67 150.08 2.570.10 1.43 2.3.Method of Characterization2.3.1.FT-IR Spectroscopy.FT-IR spectra of the MMT,xylan,xylan-g-poly(AA-AMPS),and xylan-g-poly(AA-AMPS)/MMT hydrogels were recorded using a Thermo ScientificNicolet iN10FT-IR Microscopy(Thermo Nicolet Corpo-ration,Madison,WI)equipped with a liquid nitrogen cooledMCT detector.Dried samples were grounded and palletizedusing BaF2and their spectra were recorded from4000to650cm−1at a resolution of4cm−1and128scans per sample.2.3.2.Surface Morphology of the Hydrogels.The equilibrium-swollen samples of the hydrogels in deionized water atroom temperature were quickly frozen and then freeze-driedfor morphological analysis.Scanning electron microscopy(SEM)of the hydrogel samples was carried out with a HitachiS-3400N II(Hitachi,Japan)instrument at15kV.Prior totaking pictures,the samples were sputter-coated with a thinlayer of gold.Images were obtained at magnifications rangingfrom200x to5000x,which was dependent on the feature tobe traced.2.3.3.Swelling Measurements.The preweighted dry hydrogelswere immersed into excessive distilled water to reach a stateof equilibrium swelling.The swollen superabsorbent wasfiltered using100-mesh sieve and drained for20min until nofree water remained.After weighing the swollen hydrogels,the equilibrium water absorption was calculated by using thefollowing equation:Q eq=W2−W1W1,(1)where Q eq is the equilibrium water absorption defined as grams of water per gram of sample;W1and W2are the mass of sample before and after swelling,respectively.2.3.4.Mechanical Measurement.Dynamic mechanical anal-ysis(DMA,TA Instruments Q800Series)was used to determine the compressive modulus of the swollen hydrogel samples.To reach swelling equilibrium,hydrogels were incu-bated in distilled water for24h at room temperature before test.The disk-shaped samples were1cm×0.5cm(diameter×height)in dimension and were tested in compression mode at25∘C.Rheological measurements were carried out at25∘C on ARES-RFS III rheometer(TA Instruments,USA).The mixture of xylan(1.0g),KPS(0.08g),AA(1.0or2.0g),MBA(0.05–0.25g),and MMT(0.00–0.12g)was stirred to forma homogeneous solution.This hybrid system was quickly transferred into rheometer for testing.2.3.5.Swelling in Various Salt Solutions.The swelling capacity of the hydrogels was measured in different concentrations (0.5,1.0,1.5,2.0,and2.5mol⋅L−1)of LiCl,CaCl2,and FeCl3 salt solutions according to the above method described for swelling measurement in distilled water.2.3.6.Swelling at Various pHs.Individual solutions with acidic and basic pHs were prepared by the dilution of NaOH (pH12.0)and HCl(pH2.0)solutions to achieve pH≥6.0 and<6.0,respectively.The pH values were precisely checked by a pH meter(PB-10,Sartorius).Then,the preweighted dried hydrogels were used for the swelling measurements according to the above method described for swelling measurement in distilled water.2.3.7.Water Retention Measurement.The water retention (WR)was determined by centrifuging the water-swollen hydrogels at2000rpm.The weight of the hydrogels was deter-mined every30s.The WR of the hydrogels was calculated according toWR(%)=m2m1×100%,(2)where m1is the weight of the fully swollen hydrogel and m2 is the weight of the hydrogel centrifuged for different times at 2000rpm.3.Results and Discussion3.1.Synthesis and Spectral Characterization.The superab-sorbent hydrogel was prepared by the graft copolymer-ization of acrylic acid(AA)and2-acrylamido-2-methyl-1-propanesulfonic acid(AMPS)onto xylan in the presence of a cross-linking agent(MBA),powdery montmorillonite (MMT),and potassium persulfate(KPS)as an initiator.The persulfate initiator was decomposed under heating to pro-duce sulfate anion radicals that abstract hydrogen atoms from the hydroxyl groups of the xylan backbones.Therefore,this redox system resulted in active centers capable of radically initiating the polymerization of AA and AMPS,leading to a graft copolymer.Since a cross-linking agent(MBA)was present in this system,the copolymer comprised a cross-linked structure.The MMT in the polymerization reaction can also be considered as a cross-linking agent[35].The proposed mechanism for the grafting and chemically cross-linking reactions is outlined in Figure1.Infrared spectroscopy was carried out to confirm the chemical structure of the superabsorbent hydrogel.FT-IR spectra of MMT,xylan,xylan-g-poly(AA-AMPS),and xylan-g-poly(AA-AMPS)/MMT superabsorbent hydrogel are shown in Figure2.In the spectrum(see Figure2(c)) of xylan,the region between3500cm−1and1800cm−1 presents two major peaks at about3411cm−1(corresponding to the absorption of stretching of the hydroxyl groups)and at2911cm−1(corresponding to the C–H stretching of the CH2groups).The absorption peak at1600cm−1is related to the uronic acid carboxylate[36].The bands at the range of1452and1048cm−1are assigned to the C–H and C–O bond stretching frequencies.The low intensity of the peaks at990and1166cm−1suggests the presence of arabinosyl units,which have been reported to be attached only at position3of the xylopyranosyl constituents[37].A sharp band at895cm−1is due toβ-glycosidic linkages between the sugar units.On comparing the spectra of xylan and xylan-g-poly(AA-AMPS)(see Figure2(d)),new characteristic absorption bands at1651,1558,and1442cm−1are assigned to the stretching vibration of C=O,asymmetrical stretching vibration of COO−,and symmetrical stretching vibration of COO−,respectively[38].Moreover,the characteristic absorption peaks of AMPS units are shown at1400,1040,and 627cm−1,which are attributed to C–N stretching vibration of the amide,S–O stretching vibration of–SO3H,and C–S stretching vibration,respectively[39].These bands indicated that AA and AMPS monomers were actually grafted onto the backbone of xylan.In the spectrum(see Figure2(a))of MMT,the character-istic vibration bands are shown at3400and3630cm−1,which correspond to–OH stretching band for absorbed interlayer water and–OH stretching band for Al–OH,respectively. The absorption peaks at1631and1423cm−1are attributed to the deformation vibration of the hydroxyl groups.The characteristic peaks at1150and1090cm−1are due to Si–O stretching(out-of plane)for MMT and Si–O stretching (in plane)vibration for layered silicates,respectively.The peaks at915,845,and796cm−1are assigned to Al–Al–OH, Al–Mg–OH,and Si–O–Al bending vibrations,respectively [40–42].As can be seen,compared to the spectrum of MMT(Figure2(b)),the intensities of absorption bands at 3630cm−1ascribed to–OH of MMT disappeared in the spectrum of xylan-g-poly(AA-AMPS)/MMT(Figure2(a)). In addition,the intensity of the absorption peaks due to Si–O stretching also decreased.These results indicated that MMT participated in polymerization reaction through its active–OH groups and chemically cross-linked with polymer chains. Therefore,it could be concluded that the superabsorbent hydrogel product comprised a cross-linking structure of xylan and MMT with side chains carrying carboxylate, carboxamide,and sulfate.3.2.Morphological Analysis.The morphologies of the freeze-dried xylan-g-poly(AA-AMPS)and xylan-g-poly(AA-AMPS)/MMT composites are depicted in Figure3, respectively.Obviously,the surface morphology of the xylan-g-poly(AA-AMPS)/MMT hydrogel is different from that of xylan-g-poly(AA-AMPS).It could be observed that the cross-linked xylan-g-poly(AA-AMPS)(Figure3(a)) displayed a porous structure with many large pores.However, for hydrogel containing MMT(Figure3(b)),the pore size became smaller and it showed a sheet-like structure with significant interconnection forming a three-dimensional network,which was beneficial for the diffusion of aqueous fluid into the superabsorbent polymer and increasing the water absorption rate[43,44].In addition,the degree of dispersion of clay micropowder in the polymer matrix is more important for an organic-inorganic composite[45,46]. As can be seen from Figures3(c)and3(d),the microstructure of pure MMT clay was flaky(Figure3(c)),while these clays were randomly dispersed in the polymer matrix and almost embedded within xylan-g-poly(AA-AMPS)in the composites(Figure3(d)),and no flocculation of MMT particles could be observed.These SEM results confirmed that the MMT was finely dispersed in the composite to forma homogeneous composition.3.3.Mechanical Properties of Hydrogels.The mechanical properties of the xylan-based hydrogels with different ratios of MMT to xylan have been determined.Figure4(a)presents the typical compressive modulus-strain curves of xylan-based hydrogels at room temperature.Obviously,all the samples exhibited the high compressive modulus(E),about 35–55KPa.This indicated that the hydrogels had excellent mechanical properties.As expected,the compressive mod-ulus of the hydrogels increased with the increment of the MMT content in the hydrogels,in the order Gel5>Gel4> Gel3>Gel2>Gel1.The results strongly demonstrated that MMT contributed to the enhancement of the mechanical properties of the hydrogels.On the other hand,the strains of hydrogels decrease from92%to66%,when the MMT content was increased in the hydrogel.Hemicelluloses-g-poly(AA-AMPS)/MMT hydrogelS O Figure 1:Proposed reaction mechanism for synthesis of xylan-g -poly(AA-AMPS)/MMT superabsorbent hydrogels.4000350030002500200015001000T r a n s m i t t a n c e (%)(a)(b)(c)(d)14521048990116616511558144214001040363034001631142311501090915845627796341129111600895Wavenumbers (cm −1)Figure 2:FT-IR of (a)xylan-g -poly(AA-AMPS)/MMT,(b)MMT,(c)xylan and (d)xylan-g -poly(AA-AMPS).To monitor the gelation process,a time sweep measure-ment for viscoelastic properties of each sample was carried out at 25∘C [47].Figures 4(b)and 4(c)show the storage modulus (G )of hydrogels with different MMT concentra-tions and various MBA contents,respectively.Apparently,a significant increase of G values at about 300s in Figure 4(b)indicated that the rapid gelation process and phase separation occurred during the initial stage.Moreover,the maximum storage modulus of the hydrogels increased with the increase of the MMT/xylan weight ratios from 0.00to 0.11.It wasfurther proved that the MMT played an important role in improving the strength of hydrogels.Meanwhile,Figure 4(c)shows the time dependence of the storage modulus of the hydrogels with different MBA contents.Cross-linking agent induced a stable network with the polymers by covalent bonds;thus,the increment of MBA content led to the regular increase of the maximum storage modulus of the hydrogels.3.4.Effect of MMT Content on Swelling Capacity.The influ-ence of MMT/xylan weight ratio on water absorbency of the superabsorbent hydrogels is shown in Figure 5.It is obvious that MMT content is an important factor influencing water absorbency of the hydrogels.Increasing MMT/xylan weight ratios from 0.00to 0.08caused an increment in water absorbency.The maximum water absorbency (1423g g −1)was obtained at weight ratio of MMT/xylan (0.08).This trend was attributed to the fact that the active –OH groups of MMT could react with the –OH,–SO 3H,and –COOH groups of the polymeric chains,as indicated by FT-IR spectra (Figure 2).Hence,it can relieve the entanglement of graft polymeric chains and weaken the hydrogen-bonding interaction among hydrophilic groups,which decreases the physical cross-linking degree and improves polymeric network.As a result,the water absorbency can be enhanced by introducing mod-erate amount of MMT.However,a further increase of MMT caused a decrease in water absorbency.This phenomenon may be attributed to the fact that the MMT can act as an additional cross-linking point in the polymeric network to decrease the elasticity of polymers.Additionally,the excess of MMT would also decrease the hydrophilicity as well as(a)(b)(c)(d)Figure3:SEM images of(a)xylan-g-poly(AA-AMPS),(b)xylan-g-poly(AA-AMPS)/MMT at low magnification and(c)MMT,(d)xylan-g-poly(AA-AMPS)/MMT at high magnification.the osmotic pressure difference,resulting in shrinkage of the composite[48].3.5.Effect of MBA Content on Swelling Capacity.The amount of cross-linking agent determines the cross-linking density of the hydrogel network,which is an important swelling-control element.The effect of cross-linker(MBA)to xylan weight ratio on the swelling capacity of the superabsorbent hydrogels was investigated.As shown in Figure6,the swelling ratio rose from585to864g g−1when the MBA/xylan weight ratio increased from0.05to0.2,while it decreased with a further increase in the weight ratio.The hydrophilic polymer chains would dissolve in an aqueous environment with just a few cross-linkers.Therefore,the network cannot be formed efficiently,and the water molecules cannot be held,which results in a decrease in the water absorbency.Contrarily,the excess cross-linking concentration causes the higher cross-linking density and decreases the space of polymer three-dimensional network,and consequently,it would not be beneficial to expand the structure and hold a large quantity of water.3.6.Effect of Monomer Ratio on the Swelling Capacity. The swelling capacity of hydrogels prepared with various weight ratios of AMPS/AA is shown in Figure7.As can be seen,increasing the AMPS concentration at monomer feed composition,the swelling capacity increased.Swelling and absorption properties are attributed to the presence of hydrophilic groups,such as–OH–,CONH–,–CONH2–,and –SO3H in the network.–SO3−groups associated to AMPS present better affinity than–COO−group of AA.Moreover, the nonionic groups such as CONH–can improve their salt tolerance.3.7.Equilibrium Swelling at Various pH Values.The xylan-g-poly(AA-AMPS)/MMT,containing carboxylate,carboxam-ide,and sulfonate groups,are the majority of anionic-type hydrogels.Ionic superabsorbent hydrogels exhibit swelling changes for a wide range of pHs.Since the swelling capacity of all“ionic”hydrogels is strongly influenced by ionic strength, no buffer solutions are used.Hence,stock NaOH(pH13.0) and HCl(pH1.0)solutions were diluted with distilled water to reach desired basic and acidic pH values,respectively. These results are illustrated in Figure8.The swelling ratios of the superabsorbent hydrogels were finely preserved around 1000g g−1in a wide range of pH(6.0–10.0).However,swelling capacity was significantly decreased at pH lower than6.0 and higher than10.0,which reached to108g g−1at pH2.0 and148g g−1at pH12.0,respectively.In acidic media,the carboxylate and sulfonate anions were protonated.Moreover, the hydrogen-bonding interactions among carboxylate and sulfonate groups were strengthened,which generated the additional physical cross-linking.At higher pH(6.0–10.0), nearly all of the–COOH and–SO3H groups were converted to–COO−and–SO3−.Consequently,the hydrogen-bonding interaction was eliminated and the electrostatic repulsion204060801000204060C o m p r e s s i v e m o d u l u s (k P a )Strain (%)54321(a)5001000150020002500300054321Time (s)G (P a )(b)500100015002000250030003500109876Time (s)G (P a )(c)Figure 4:Compressive stress-strain curves for hydrogels with different MMT contents (a).The time dependence of storage modulus (G )for hydrogels with different MMT contents (b)and different MBA contents (c).among the anionic groups increased.Therefore,the polymer network tended to swell more.At pHs greater than 10,the excess Na +cations from NaOH shielded the –COO −and –SO 3−groups,which prevented effective anion-anion repulsion.3.8.Swelling in Salt Solutions.The characteristics of external solution such as salt concentration and charge valency greatly influence the swelling behavior of the superabsorbent hydro-gels.The swelling ratios of hydrogels in aqueous solution of LiCl,CaCl 2,and FeCl 3with various concentrations are shown in Figure 9.Obviously,the swelling ratio decreased with increasing the concentration of external salt solutions.This well-known undesired swelling loss is often attributed to a “charge screening effect”of the additional cations caus-ing a nonperfect anion-anion electrostatic repulsion [49].Therefore,the osmotic pressure generating from the mobile ion concentration difference between the gel and aqueous phases decreased and resulted in shrinkage of the network.In addition,as shown in Figure 9,the swelling ratio in multi-valent cationic saline (CaCl 2and FeCl 3)solution was almost close to zero at the concentration above 0.1mol L −1,while it reached 31g g −1(0.1mol L −1)and 21g g −1(0.25mol L −1)in monovalent cationic solution (LiCl),which are probably due to the complexation of the carboxylate and sulfonate groups900100011001200130014001500In 0.9 wt% NaCl solutionS w e l l i n g r a t i o404448525660646872S w e l l i n g r a t i oFigure 5:Effect of MMT contents on water absorbency of thehydrogels.500550600650700750800850900MBA/hemicelluloses (g/g)S w e l l i n g r a t i oS w e l l i n g r a t i oIn distilled waterIn 0.9 wt% NaCl solutionFigure 6:Effect of MBA contents on water absorbency of the hydrogels.with the multivalent cations inducing the formation of the additional cross-link points at the surface of particles.Hence,the network cross-link density was enhanced,resulting in the shrinkage of the network.As a result,the water absorbency was decreased considerably (LiCl >CaCl 2>FeCl 3).3.9.Effect of MMT Content on Water Retention.The water retention ability is an important parameter for hydrogels,especially used in dry and desert regions.The water retention abilities of the hydrogels with different MMT/xylan weight ratios are shown in Figure 10.From this figure,the water retention of the hydrogels was rapidly decreased within 30s,while small changes in the water retention occurred with prolonging the time.This behavior may be explained as follows:absorbed water in the network of hygrogels can exist in three states:bound,half bond,and free water.Free water is the easiest to remove,compared with bound andhalf-bond40050060070080090010001100AMPS/AA (g/g)S w e l l i n g r a t i o20253035404550S w e l l i n g r a t i o In distilled waterIn 0.9 wt% NaCl solutionFigure 7:Effect of monomer ratios on water absorbency of the hydrogels.2004006008001000S w e l l i n g r a t i opHFigure 8:Effect of external pH on the water absorbency of the hydrogels.water.Additionally,the water retention of the hydrogels with various MMT/xylan weight ratios of 0.00,0.03,0.05,0.08,and 0.11was 65,69,74,60,and 53%,respectively,centrifuged at 2000rpm for 360seconds.It can be concluded that the water retention can be enhanced with the moderate amount of MMT.This may be explained by the barrier effect of polymer/MMT hydrogels [50].The nano-dispersed MMT in the composite,acted as an additional crosslinking point,impeded the diffusion of the water molecules,and made the diffuse path for water vapor longer.However,a further increase of MMT caused a decrease in water retention,which was probably due to that it was difficult to disperse MMT in the homogeneous network solution at higher MMT content,resulted in decreasing the water retention ability.。
人工智能英文参考文献(最新120个)

人工智能是一门新兴的具有挑战力的学科。
自人工智能诞生以来,发展迅速,产生了许多分支。
诸如强化学习、模拟环境、智能硬件、机器学习等。
但是,在当前人工智能技术迅猛发展,为人们的生活带来许多便利。
下面是搜索整理的人工智能英文参考文献的分享,供大家借鉴参考。
人工智能英文参考文献一:[1]Lars Egevad,Peter Str?m,Kimmo Kartasalo,Henrik Olsson,Hemamali Samaratunga,Brett Delahunt,Martin Eklund. The utility of artificial intelligence in the assessment of prostate pathology[J]. Histopathology,2020,76(6).[2]Rudy van Belkom. The Impact of Artificial Intelligence on the Activities ofa Futurist[J]. World Futures Review,2020,12(2).[3]Reza Hafezi. How Artificial Intelligence Can Improve Understanding in Challenging Chaotic Environments[J]. World Futures Review,2020,12(2).[4]Alejandro Díaz-Domínguez. How Futures Studies and Foresight Could Address Ethical Dilemmas of Machine Learning and Artificial Intelligence[J]. World Futures Review,2020,12(2).[5]Russell T. Warne,Jared Z. Burton. Beliefs About Human Intelligence in a Sample of Teachers and Nonteachers[J]. Journal for the Education of the Gifted,2020,43(2).[6]Russell Belk,Mariam Humayun,Ahir Gopaldas. Artificial Life[J]. Journal of Macromarketing,2020,40(2).[7]Walter Kehl,Mike Jackson,Alessandro Fergnani. Natural Language Processing and Futures Studies[J]. World Futures Review,2020,12(2).[8]Anne Boysen. Mine the Gap: Augmenting Foresight Methodologies with Data Analytics[J]. World Futures Review,2020,12(2).[9]Marco Bevolo,Filiberto Amati. The Potential Role of AI in Anticipating Futures from a Design Process Perspective: From the Reflexive Description of “Design” to a Discussion of Influences by the Inclusion of AI in the Futures Research Process[J]. World Futures Review,2020,12(2).[10]Lan Xu,Paul Tu,Qian Tang,Dan Seli?teanu. Contract Design for Cloud Logistics (CL) Based on Blockchain Technology (BT)[J]. Complexity,2020,2020.[11]L. Grant,X. Xue,Z. Vajihi,A. Azuelos,S. Rosenthal,D. Hopkins,R. Aroutiunian,B. Unger,A. Guttman,M. Afilalo. LO32: Artificial intelligence to predict disposition to improve flow in the emergency department[J]. CJEM,2020,22(S1).[12]A. Kirubarajan,A. Taher,S. Khan,S. Masood. P071: Artificial intelligence in emergency medicine: A scoping review[J]. CJEM,2020,22(S1).[13]L. Grant,P. Joo,B. Eng,A. Carrington,M. Nemnom,V. Thiruganasambandamoorthy. LO22: Risk-stratification of emergency department syncope by artificial intelligence using machine learning: human, statistics or machine[J]. CJEM,2020,22(S1).[14]Riva Giuseppe,Riva Eleonora. OS for Ind Robots: Manufacturing Robots Get Smarter Thanks to Artificial Intelligence.[J]. Cyberpsychology, behavior and social networking,2020,23(5).[15]Markus M. Obmann,Aurelio Cosentino,Joshy Cyriac,Verena Hofmann,Bram Stieltjes,Daniel T. Boll,Benjamin M. Yeh,Matthias R. Benz. Quantitative enhancement thresholds and machine learning algorithms for the evaluation of renal lesions using single-phase split-filter dual-energy CT[J]. Abdominal Radiology,2020,45(1).[16]Haytham H. Elmousalami,Mahmoud Elaskary. Drilling stuck pipe classification and mitigation in the Gulf of Suez oil fields using artificial intelligence[J]. Journal of Petroleum Exploration and Production Technology,2020,10(10).[17]Rüdiger Schulz-Wendtland,Karin Bock. Bildgebung in der Mammadiagnostik –Ein Ausblick <trans-title xml:lang="en">Imaging in breast diagnostics—an outlook [J]. Der Gyn?kologe,2020,53(6).</trans-title>[18]Nowakowski Piotr,Szwarc Krzysztof,Boryczka Urszula. Combining an artificial intelligence algorithm and a novel vehicle for sustainable e-waste collection[J]. Science of the Total Environment,2020,730.[19]Wang Huaizhi,Liu Yangyang,Zhou Bin,Li Canbing,Cao Guangzhong,Voropai Nikolai,Barakhtenko Evgeny. Taxonomy research of artificial intelligence for deterministic solar power forecasting[J]. Energy Conversion and Management,2020,214.[20]Kagemoto Hiroshi. Forecasting a water-surface wave train with artificial intelligence- A case study[J]. Ocean Engineering,2020,207.[21]Tomonori Aoki,Atsuo Yamada,Kazuharu Aoyama,Hiroaki Saito,Gota Fujisawa,Nariaki Odawara,Ryo Kondo,Akiyoshi Tsuboi,Rei Ishibashi,Ayako Nakada,Ryota Niikura,Mitsuhiro Fujishiro,Shiro Oka,Soichiro Ishihara,Tomoki Matsuda,Masato Nakahori,Shinji Tanaka,Kazuhiko Koike,Tomohiro Tada. Clinical usefulness of a deep learning‐based system as the first screening on small‐bowel capsule endoscopy reading[J]. Digestive Endoscopy,2020,32(4).[22]Masashi Fujii,Hajime Isomoto. Next generation of endoscopy: Harmony with artificial intelligence and robotic‐assisted devices[J]. Digestive Endoscopy,2020,32(4).[23]Roberto Verganti,Luca Vendraminelli,Marco Iansiti. Innovation and Design in the Age of Artificial Intelligence[J]. Journal of Product Innovation Management,2020,37(3).[24]Yuval Elbaz,David Furman,Maytal Caspary Toroker. Modeling Diffusion in Functional Materials: From Density Functional Theory to Artificial Intelligence[J]. Advanced Functional Materials,2020,30(18).[25]Dinesh Visva Gunasekeran,Tien Yin Wong. Artificial Intelligence in Ophthalmology in 2020: A Technology on the Cusp for Translation and Implementation[J]. Asia-Pacific Journal of Ophthalmology,2020,9(2).[26]Fu-Neng Jiang,Li-Jun Dai,Yong-Ding Wu,Sheng-Bang Yang,Yu-Xiang Liang,Xin Zhang,Cui-Yun Zou,Ren-Qiang He,Xiao-Ming Xu,Wei-De Zhong. The study of multiple diagnosis models of human prostate cancer based on Taylor database by artificial neural networks[J]. Journal of the Chinese Medical Association,2020,83(5).[27]Matheus Calil Faleiros,Marcello Henrique Nogueira-Barbosa,Vitor Faeda Dalto,JoséRaniery Ferreira Júnior,Ariane Priscilla Magalh?es Tenório,Rodrigo Luppino-Assad,Paulo Louzada-Junior,Rangaraj Mandayam Rangayyan,Paulo Mazzoncini de Azevedo-Marques. Machine learning techniques for computer-aided classification of active inflammatory sacroiliitis in magnetic resonance imaging[J]. Advances in Rheumatology,2020,60(1078).[28]Balamurugan Balakreshnan,Grant Richards,Gaurav Nanda,Huachao Mao,Ragu Athinarayanan,Joseph Zaccaria. PPE Compliance Detection using Artificial Intelligence in Learning Factories[J]. Procedia Manufacturing,2020,45.[29]M. Stévenin,V. Avisse,N. Ducarme,A. de Broca. Qui est responsable si un robot autonome vient à entra?ner un dommage ?[J]. Ethique et Santé,2020.[30]Fatemeh Barzegari Banadkooki,Mohammad Ehteram,Fatemeh Panahi,Saad Sh. Sammen,Faridah Binti Othman,Ahmed EL-Shafie. Estimation of Total Dissolved Solids (TDS) using New Hybrid Machine Learning Models[J]. Journal of Hydrology,2020.[31]Adam J. Schwartz,Henry D. Clarke,Mark J. Spangehl,Joshua S. Bingham,DavidA. Etzioni,Matthew R. Neville. Can a Convolutional Neural Network Classify Knee Osteoarthritis on Plain Radiographs as Accurately as Fellowship-Trained Knee Arthroplasty Surgeons?[J]. The Journal of Arthroplasty,2020.[32]Ivana Nizetic Kosovic,Toni Mastelic,Damir Ivankovic. Using Artificial Intelligence on environmental data from Internet of Things for estimating solar radiation: Comprehensive analysis[J]. Journal of Cleaner Production,2020.[33]Lauren Fried,Andrea Tan,Shirin Bajaj,Tracey N. Liebman,David Polsky,Jennifer A. Stein. Technological advances for the detection of melanoma: Part I. Advances in diagnostic techniques[J]. Journal of the American Academy of Dermatology,2020.[34]Mohammed Amoon,Torki Altameem,Ayman Altameem. Internet of things Sensor Assisted Security and Quality Analysis for Health Care Data Sets Using Artificial Intelligent Based Heuristic Health Management System[J]. Measurement,2020.[35]E. Lotan,C. Tschider,D.K. Sodickson,A. Caplan,M. Bruno,B. Zhang,Yvonne W. Lui. Medical Imaging and Privacy in the Era of Artificial Intelligence: Myth, Fallacy, and the Future[J]. Journal of the American College of Radiology,2020.[36]Fabien Lareyre,Cédric Adam,Marion Carrier,Juliette Raffort. Artificial Intelligence in Vascular Surgery: moving from Big Data to Smart Data[J]. Annals of Vascular Surgery,2020.[37]Ilesanmi Daniyan,Khumbulani Mpofu,Moses Oyesola,Boitumelo Ramatsetse,Adefemi Adeodu. Artificial intelligence for predictive maintenance in the railcar learning factories[J]. Procedia Manufacturing,2020,45.[38]Janet L. McCauley,Anthony E. Swartz. Reframing Telehealth[J]. Obstetrics and Gynecology Clinics of North America,2020.[39]Jean-Emmanuel Bibault,Lei Xing. Screening for chronic obstructive pulmonary disease with artificial intelligence[J]. The Lancet Digital Health,2020,2(5).[40]Andrea Laghi. Cautions about radiologic diagnosis of COVID-19 infection driven by artificial intelligence[J]. The Lancet Digital Health,2020,2(5).人工智能英文参考文献二:[41]K. Orhan,I. S. Bayrakdar,M. Ezhov,A. Kravtsov,T. ?zyürek. Evaluation of artificial intelligence for detecting periapical pathosis on cone‐beam computed tomography scans[J]. International Endodontic Journal,2020,53(5).[42]Avila A M,Mezi? I. Data-driven analysis and forecasting of highway traffic dynamics.[J]. Nature communications,2020,11(1).[43]Neri Emanuele,Miele Vittorio,Coppola Francesca,Grassi Roberto. Use of CT andartificial intelligence in suspected or COVID-19 positive patients: statement of the Italian Society of Medical and Interventional Radiology.[J]. La Radiologia medica,2020.[44]Tau Noam,Stundzia Audrius,Yasufuku Kazuhiro,Hussey Douglas,Metser Ur. Convolutional Neural Networks in Predicting Nodal and Distant Metastatic Potential of Newly Diagnosed Non-Small Cell Lung Cancer on FDG PET Images.[J]. AJR. American journal of roentgenology,2020.[45]Coppola Francesca,Faggioni Lorenzo,Regge Daniele,Giovagnoni Andrea,Golfieri Rita,Bibbolino Corrado,Miele Vittorio,Neri Emanuele,Grassi Roberto. Artificial intelligence: radiologists' expectations and opinions gleaned from a nationwide online survey.[J]. La Radiologia medica,2020.[46]?. ? ? ? ? [J]. ,2020,25(4).[47]Savage Rock H,van Assen Marly,Martin Simon S,Sahbaee Pooyan,Griffith Lewis P,Giovagnoli Dante,Sperl Jonathan I,Hopfgartner Christian,K?rgel Rainer,Schoepf U Joseph. Utilizing Artificial Intelligence to Determine Bone Mineral Density Via Chest Computed Tomography.[J]. Journal of thoracic imaging,2020,35 Suppl 1.[48]Brzezicki Maksymilian A,Bridger Nicholas E,Kobeti? Matthew D,Ostrowski Maciej,Grabowski Waldemar,Gill Simran S,Neumann Sandra. Artificial intelligence outperforms human students in conducting neurosurgical audits.[J]. Clinical neurology and neurosurgery,2020,192.[49]Lockhart Mark E,Smith Andrew D. Fatty Liver Disease: Artificial Intelligence Takes on the Challenge.[J]. Radiology,2020,295(2).[50]Wood Edward H,Korot Edward,Storey Philip P,Muscat Stephanie,Williams George A,Drenser Kimberly A. The retina revolution: signaling pathway therapies, genetic therapies, mitochondrial therapies, artificial intelligence.[J]. Current opinion in ophthalmology,2020,31(3).[51]Ho Dean,Quake Stephen R,McCabe Edward R B,Chng Wee Joo,Chow Edward K,Ding Xianting,Gelb Bruce D,Ginsburg Geoffrey S,Hassenstab Jason,Ho Chih-Ming,Mobley William C,Nolan Garry P,Rosen Steven T,Tan Patrick,Yen Yun,Zarrinpar Ali. Enabling Technologies for Personalized and Precision Medicine.[J]. Trends in biotechnology,2020,38(5).[52]Fischer Andreas M,Varga-Szemes Akos,van Assen Marly,Griffith L Parkwood,Sahbaee Pooyan,Sperl Jonathan I,Nance John W,Schoepf U Joseph. Comparison of Artificial Intelligence-Based Fully Automatic Chest CT Emphysema Quantification to Pulmonary Function Testing.[J]. AJR. American journal ofroentgenology,2020,214(5).[53]Moore William,Ko Jane,Gozansky Elliott. Artificial Intelligence Pertaining to Cardiothoracic Imaging and Patient Care: Beyond Image Interpretation.[J]. Journal of thoracic imaging,2020,35(3).[54]Hwang Eui Jin,Park Chang Min. Clinical Implementation of Deep Learning in Thoracic Radiology: Potential Applications and Challenges.[J]. Korean journal of radiology,2020,21(5).[55]Mateen Bilal A,David Anna L,Denaxas Spiros. Electronic Health Records to Predict Gestational Diabetes Risk.[J]. Trends in pharmacological sciences,2020,41(5).[56]Yao Xiang,Mao Ling,Lv Shunli,Ren Zhenghong,Li Wentao,Ren Ke. CT radiomics features as a diagnostic tool for classifying basal ganglia infarction onset time.[J]. Journal of the neurological sciences,2020,412.[57]van Assen Marly,Banerjee Imon,De Cecco Carlo N. Beyond the Artificial Intelligence Hype: What Lies Behind the Algorithms and What We Can Achieve.[J]. Journal of thoracic imaging,2020,35 Suppl 1.[58]Guzik Tomasz J,Fuster Valentin. Leaders in Cardiovascular Research: Valentin Fuster.[J]. Cardiovascular research,2020,116(6).[59]Fischer Andreas M,Eid Marwen,De Cecco Carlo N,Gulsun Mehmet A,van Assen Marly,Nance John W,Sahbaee Pooyan,De Santis Domenico,Bauer Maximilian J,Jacobs Brian E,Varga-Szemes Akos,Kabakus Ismail M,Sharma Puneet,Jackson Logan J,Schoepf U Joseph. Accuracy of an Artificial Intelligence Deep Learning Algorithm Implementing a Recurrent Neural Network With Long Short-term Memory for the Automated Detection of Calcified Plaques From Coronary Computed Tomography Angiography.[J]. Journal of thoracic imaging,2020,35 Suppl 1.[60]Ghosh Adarsh,Kandasamy Devasenathipathy. Interpretable Artificial Intelligence: Why and When.[J]. AJR. American journal of roentgenology,2020,214(5).[61]M.Rosario González-Rodríguez,M.Carmen Díaz-Fernández,Carmen Pacheco Gómez. Facial-expression recognition: An emergent approach to the measurement of tourist satisfaction through emotions[J]. Telematics and Informatics,2020,51.[62]Ru-Xi Ding,Iván Palomares,Xueqing Wang,Guo-Rui Yang,Bingsheng Liu,Yucheng Dong,Enrique Herrera-Viedma,Francisco Herrera. Large-Scale decision-making: Characterization, taxonomy, challenges and future directions from an Artificial Intelligence and applications perspective[J]. Information Fusion,2020,59.[63]Abdulrhman H. Al-Jebrni,Brendan Chwyl,Xiao Yu Wang,Alexander Wong,Bechara J. Saab. AI-enabled remote and objective quantification of stress at scale[J]. Biomedical Signal Processing and Control,2020,59.[64]Gillian Thomas,Elizabeth Eisenhauer,Robert G. Bristow,Cai Grau,Coen Hurkmans,Piet Ost,Matthias Guckenberger,Eric Deutsch,Denis Lacombe,Damien C. Weber. The European Organisation for Research and Treatment of Cancer, State of Science in radiation oncology and priorities for clinical trials meeting report[J]. European Journal of Cancer,2020,131.[65]Muhammad Asif. Are QM models aligned with Industry 4.0? A perspective on current practices[J]. Journal of Cleaner Production,2020,258.[66]Siva Teja Kakileti,Himanshu J. Madhu,Geetha Manjunath,Leonard Wee,Andre Dekker,Sudhakar Sampangi. Personalized risk prediction for breast cancer pre-screening using artificial intelligence and thermal radiomics[J]. Artificial Intelligence In Medicine,2020,105.[67]. Evaluation of Payer Budget Impact Associated with the Use of Artificial Intelligence in Vitro Diagnostic, Kidneyintelx, to Modify DKD Progression:[J]. American Journal of Kidney Diseases,2020,75(5).[68]Rohit Nishant,Mike Kennedy,Jacqueline Corbett. Artificial intelligence for sustainability: Challenges, opportunities, and a research agenda[J]. International Journal of Information Management,2020,53.[69]Hoang Nguyen,Xuan-Nam Bui. Soft computing models for predicting blast-induced air over-pressure: A novel artificial intelligence approach[J]. Applied Soft Computing Journal,2020,92.[70]Benjamin S. Hopkins,Aditya Mazmudar,Conor Driscoll,Mark Svet,Jack Goergen,Max Kelsten,Nathan A. Shlobin,Kartik Kesavabhotla,Zachary A Smith,Nader S Dahdaleh. Using artificial intelligence (AI) to predict postoperative surgical site infection: A retrospective cohort of 4046 posterior spinal fusions[J]. Clinical Neurology and Neurosurgery,2020,192.[71]Mei Yang,Runze Zhou,Xiangjun Qiu,Xiangfei Feng,Jian Sun,Qunshan Wang,Qiufen Lu,Pengpai Zhang,Bo Liu,Wei Li,Mu Chen,Yan Zhao,Binfeng Mo,Xin Zhou,Xi Zhang,Yingxue Hua,Jin Guo,Fangfang Bi,Yajun Cao,Feng Ling,Shengming Shi,Yi-Gang Li. Artificial intelligence-assisted analysis on the association between exposure to ambient fine particulate matter and incidence of arrhythmias in outpatients of Shanghai community hospitals[J]. Environment International,2020,139.[72]Fatemehalsadat Madaeni,Rachid Lhissou,Karem Chokmani,Sebastien Raymond,Yves Gauthier. Ice jam formation, breakup and prediction methods based on hydroclimatic data using artificial intelligence: A review[J]. Cold Regions Science and Technology,2020,174.[73]Steve Chukwuebuka Arum,David Grace,Paul Daniel Mitchell. A review of wireless communication using high-altitude platforms for extended coverage and capacity[J]. Computer Communications,2020,157.[74]Yong-Hong Kuo,Nicholas B. Chan,Janny M.Y. Leung,Helen Meng,Anthony Man-Cho So,Kelvin K.F. Tsoi,Colin A. Graham. An Integrated Approach of Machine Learning and Systems Thinking for Waiting Time Prediction in an Emergency Department[J]. International Journal of Medical Informatics,2020,139.[75]Matteo Terzi,Gian Antonio Susto,Pratik Chaudhari. Directional adversarial training for cost sensitive deep learning classification applications[J]. Engineering Applications of Artificial Intelligence,2020,91.[76]Arman Kilic. Artificial Intelligence and Machine Learning in Cardiovascular Health Care[J]. The Annals of Thoracic Surgery,2020,109(5).[77]Hossein Azarmdel,Ahmad Jahanbakhshi,Seyed Saeid Mohtasebi,Alfredo Rosado Mu?oz. Evaluation of image processing technique as an expert system in mulberry fruit grading based on ripeness level using artificial neural networks (ANNs) and support vector machine (SVM)[J]. Postharvest Biology and Technology,2020,166.[78]Wafaa Wardah,Abdollah Dehzangi,Ghazaleh Taherzadeh,Mahmood A. Rashid,M.G.M. Khan,Tatsuhiko Tsunoda,Alok Sharma. Predicting protein-peptide binding sites with a deep convolutional neural network[J]. Journal of Theoretical Biology,2020,496.[79]Francisco F.X. Vasconcelos,Róger M. Sarmento,Pedro P. Rebou?as Filho,Victor Hugo C. de Albuquerque. Artificial intelligence techniques empowered edge-cloud architecture for brain CT image analysis[J]. Engineering Applications of Artificial Intelligence,2020,91.[80]Masaaki Konishi. Bioethanol production estimated from volatile compositions in hydrolysates of lignocellulosic biomass by deep learning[J]. Journal of Bioscience and Bioengineering,2020,129(6).人工智能英文参考文献三:[81]J. Kwon,K. Kim. Artificial Intelligence for Early Prediction of Pulmonary Hypertension Using Electrocardiography[J]. Journal of Heart and Lung Transplantation,2020,39(4).[82]C. Maathuis,W. Pieters,J. van den Berg. Decision support model for effects estimation and proportionality assessment for targeting in cyber operations[J]. Defence Technology,2020.[83]Samer Ellahham. Artificial Intelligence in Diabetes Care[J]. The American Journal of Medicine,2020.[84]Yi-Ting Hsieh,Lee-Ming Chuang,Yi-Der Jiang,Tien-Jyun Chang,Chung-May Yang,Chang-Hao Yang,Li-Wei Chan,Tzu-Yun Kao,Ta-Ching Chen,Hsuan-Chieh Lin,Chin-Han Tsai,Mingke Chen. Application of deep learning image assessment software VeriSee? for diabetic retinopathy screening[J]. Journal of the Formosan Medical Association,2020.[85]Emre ARTUN,Burak KULGA. Selection of candidate wells for re-fracturing in tight gas sand reservoirs using fuzzy inference[J]. Petroleum Exploration and Development Online,2020,47(2).[86]Alberto Arenal,Cristina Armu?a,Claudio Feijoo,Sergio Ramos,Zimu Xu,Ana Moreno. Innovation ecosystems theory revisited: The case of artificial intelligence in China[J]. Telecommunications Policy,2020.[87]T. Som,M. Dwivedi,C. Dubey,A. Sharma. Parametric Studies on Artificial Intelligence Techniques for Battery SOC Management and Optimization of Renewable Power[J]. Procedia Computer Science,2020,167.[88]Bushra Kidwai,Nadesh RK. Design and Development of Diagnostic Chabot for supporting Primary Health Care Systems[J]. Procedia Computer Science,2020,167.[89]Asl? Bozda?,Ye?im Dokuz,?znur Begüm G?k?ek. Spatial prediction of PM 10 concentration using machine learning algorithms in Ankara, Turkey[J]. Environmental Pollution,2020.[90]K.P. Smith,J.E. Kirby. Image analysis and artificial intelligence in infectious disease diagnostics[J]. Clinical Microbiology and Infection,2020.[91]Alklih Mohamad YOUSEF,Ghahfarokhi Payam KAVOUSI,Marwan ALNUAIMI,Yara ALATRACH. Predictive data analytics application for enhanced oil recovery in a mature field in the Middle East[J]. Petroleum Exploration and Development Online,2020,47(2).[92]Omer F. Ahmad,Danail Stoyanov,Laurence B. Lovat. Barriers and pitfalls for artificial intelligence in gastroenterology: Ethical and regulatory issues[J]. Techniques and Innovations in Gastrointestinal Endoscopy,2020,22(2).[93]Sanne A. Hoogenboom,Ulas Bagci,Michael B. Wallace. Artificial intelligence in gastroenterology. The current state of play and the potential. How will it affect our practice and when?[J]. Techniques and Innovations in Gastrointestinal Endoscopy,2020,22(2).[94]Douglas K. Rex. Can we do resect and discard with artificial intelligence-assisted colon polyp “optical biopsy?”[J]. Techniques and Innovations in Gastrointestinal Endoscopy,2020,22(2).[95]Neal Shahidi,Michael J. Bourke. Can artificial intelligence accurately diagnose endoscopically curable gastrointestinal cancers?[J]. Techniques and Innovations in Gastrointestinal Endoscopy,2020,22(2).[96]Michael Byrne. Artificial intelligence in gastroenterology[J]. Techniques and Innovations in Gastrointestinal Endoscopy,2020,22(2).[97]Piet C. de Groen. Using artificial intelligence to improve adequacy of inspection in gastrointestinal endoscopy[J]. Techniques and Innovations in Gastrointestinal Endoscopy,2020,22(2).[98]Robin Zachariah,Andrew Ninh,William Karnes. Artificial intelligence for colon polyp detection: Why should we embrace this?[J]. Techniques and Innovations in Gastrointestinal Endoscopy,2020,22(2).[99]Alexandra T. Greenhill,Bethany R. Edmunds. A primer of artificial intelligence in medicine[J]. Techniques and Innovations in Gastrointestinal Endoscopy,2020,22(2).[100]Tomohiro Tada,Toshiaki Hirasawa,Toshiyuki Yoshio. The role for artificial intelligence in evaluation of upper GI cancer[J]. Techniques and Innovations in Gastrointestinal Endoscopy,2020,22(2).[101]Yahui Jiang,Meng Yang,Shuhao Wang,Xiangchun Li,Yan Sun. Emerging role of deep learning‐based artificial intelligence in tumor pathology[J]. Cancer Communications,2020,40(4).[102]Kristopher D. Knott,Andreas Seraphim,Joao B. Augusto,Hui Xue,Liza Chacko,Nay Aung,Steffen E. Petersen,Jackie A. Cooper,Charlotte Manisty,Anish N. Bhuva,Tushar Kotecha,Christos V. Bourantas,Rhodri H. Davies,Louise A.E. Brown,Sven Plein,Marianna Fontana,Peter Kellman,James C. Moon. The Prognostic Significance of Quantitative Myocardial Perfusion: An Artificial Intelligence–Based Approach Using Perfusion Mapping[J]. Circulation,2020,141(16).[103]Muhammad Asad,Ahmed Moustafa,Takayuki Ito. FedOpt: Towards Communication Efficiency and Privacy Preservation in Federated Learning[J]. Applied Sciences,2020,10(8).[104]Wu Wenzhi,Zhang Yan,Wang Pu,Zhang Li,Wang Guixiang,Lei Guanghui,Xiao Qiang,Cao Xiaochen,Bian Yueran,Xie Simiao,Huang Fei,Luo Na,Zhang Jingyuan,Luo Mingyan. Psychological stress of medical staffs during outbreak of COVID-19 and adjustment strategy.[J]. Journal of medical virology,2020.[105]. Eyenuk Fulfills Contract for Artificial Intelligence Grading of Retinal Images[J]. Telecomworldwire,2020.[106]Kim Tae Woo,Duhachek Adam. Artificial Intelligence and Persuasion: A Construal-Level Account.[J]. Psychological science,2020,31(4).[107]McCall Becky. COVID-19 and artificial intelligence: protecting health-care workers and curbing the spread.[J]. The Lancet. Digital health,2020,2(4).[108]Alca?iz Mariano,Chicchi Giglioli Irene A,Sirera Marian,Minissi Eleonora,Abad Luis. [Autism spectrum disorder biomarkers based on biosignals, virtual reality and artificial intelligence].[J]. Medicina,2020,80 Suppl 2.[109]Cong Lei,Feng Wanbing,Yao Zhigang,Zhou Xiaoming,Xiao Wei. Deep Learning Model as a New Trend in Computer-aided Diagnosis of Tumor Pathology for Lung Cancer.[J]. Journal of Cancer,2020,11(12).[110]Wang Fengdan,Gu Xiao,Chen Shi,Liu Yongliang,Shen Qing,Pan Hui,Shi Lei,Jin Zhengyu. Artificial intelligence system can achieve comparable results to experts for bone age assessment of Chinese children with abnormal growth and development.[J]. PeerJ,2020,8.[111]Hu Wenmo,Yang Huayu,Xu Haifeng,Mao Yilei. Radiomics based on artificial intelligence in liver diseases: where we are?[J]. Gastroenterology report,2020,8(2).[112]Batayneh Wafa,Abdulhay Enas,Alothman Mohammad. Prediction of the performance of artificial neural networks in mapping sEMG to finger joint angles via signal pre-investigation techniques.[J]. Heliyon,2020,6(4).[113]Aydin Emrah,Türkmen ?nan Utku,Namli G?zde,?ztürk ?i?dem,Esen Ay?e B,Eray Y Nur,Ero?lu Egemen,Akova Fatih. A novel and simple machine learning algorithm for preoperative diagnosis of acute appendicitis in children.[J]. Pediatric surgery international,2020.[114]Ellahham Samer. Artificial Intelligence in Diabetes Care.[J]. The Americanjournal of medicine,2020.[115]David J. Winkel,Thomas J. Weikert,Hanns-Christian Breit,Guillaume Chabin,Eli Gibson,Tobias J. Heye,Dorin Comaniciu,Daniel T. Boll. Validation of a fully automated liver segmentation algorithm using multi-scale deep reinforcement learning and comparison versus manual segmentation[J]. European Journal of Radiology,2020,126.[116]Binjie Fu,Guoshu Wang,Mingyue Wu,Wangjia Li,Yineng Zheng,Zhigang Chu,Fajin Lv. Influence of CT effective dose and convolution kernel on the detection of pulmonary nodules in different artificial intelligence software systems: A phantom study[J]. European Journal of Radiology,2020,126.[117]Georgios N. Kouziokas. A new W-SVM kernel combining PSO-neural network transformed vector and Bayesian optimized SVM in GDP forecasting[J]. Engineering Applications of Artificial Intelligence,2020,92.[118]Qingsong Ruan,Zilin Wang,Yaping Zhou,Dayong Lv. A new investor sentiment indicator ( ISI ) based on artificial intelligence: A powerful return predictor in China[J]. Economic Modelling,2020,88.[119]Mohamed Abdel-Basset,Weiping Ding,Laila Abdel-Fatah. The fusion of Internet of Intelligent Things (IoIT) in remote diagnosis of obstructive Sleep Apnea: A survey and a new model[J]. Information Fusion,2020,61.[120]Federico Caobelli. Artificial intelligence in medical imaging: Game over for radiologists?[J]. European Journal of Radiology,2020,126.以上就是关于人工智能参考文献的分享,希望对你有所帮助。
非等位基因

非等位基因概述非等位基因是指同一基因座上的不同等位基因。
等位基因是指在某个给定的基因座上,可以存在多种不同的变体。
每个个体继承了一对等位基因,一对等位基因可能会导致不同的表型表达。
非等位基因的存在使得遗传学研究更加复杂,因为不同的等位基因会对个体的表型产生不同的影响。
背景在生物学中,基因座是指染色体上一个特定的位置,该位置上的基因决定了某个特征的表达方式。
每个基因座上可以有多种不同的等位基因。
等位基因是指在某个特定基因座上的不同基因变体。
每个个体都会继承一对等位基因,通过这对等位基因的不同组合,决定了个体的表型。
然而,并非所有基因座上的等位基因都具有相同的表现型。
非等位基因的影响非等位基因的存在导致不同等位基因会对个体表型产生不同的影响。
有些非等位基因会表现出显性效应,也就是说,当个体继承了一个突变的等位基因时,即使同时继承了一个正常的等位基因,但显性效应会使得突变的等位基因的表型表达得到体现。
相反,有些非等位基因会表现出隐性效应,当个体继承了两个突变的等位基因时,才会表现出突变的表型。
除了显性和隐性效应之外,非等位基因还可能发生两种其他类型的表型效应。
一种是共显效应,当个体继承了两个不同的突变等位基因时,在表型表达上会表现出一种新的特征,这个特征并不是单个突变等位基因所能导致的。
另一种是部分显性效应,当个体继承了两个不同的突变等位基因时,表型表达将介于两个单独突变等位基因的表型之间。
重组和非等位基因重组是指两个不同的染色体交换部分基因序列的过程。
在重组的过程中,非等位基因可能会发生改变,导致新的等位基因组合形成。
这一过程使得非等位基因的表型效应更加复杂,因为新的等位基因可能将不同基因座的效应组合起来。
非等位基因的重要性非等位基因对生物的适应性和多样性起着重要作用。
通过对等位基因的各种组合的研究,人们可以更好地理解基因与表型之间的关系,并揭示遗传变异对物种适应环境的重要性。
总结非等位基因是指同一基因座上的不同等位基因。
具有肿瘤荧光成像性能的核壳纳米过氧化氢酶模拟物
瘤成 像 剂 。
关 键 词 :核壳 纳 米 球 ;纳 米 复 合 物 ; 像 : 瘤 成 肿
中 图分 类 号 : 6 74 0 2 .1
1 0 20 —1 40 0 14 6 ( 1)1 6 .7 2 0
Tu o -m a ig Co eS el n - o esf rCa aa e m rI gn r - h l Na o M d l o t ls
—
wt u rse tmaigb se l gteMn1 cmpe e o i 2pr ym ty) n ..rpo i ai A p ) i f oec n g yasmbi () o l s f s -yi 1 eh 1 mi02po i c cd( d a hl i n n h / x b( d a n
o h u f c f sl a c r —h l n n p ri ls I UV,T M e e u e o c a - trz h t J tr f n n . n t e s ra e o i c o e s el a o a t e . R i c E w r s d t h I c e ie t e sI cu e o a o a 1
,
n n — o l x sc ul n e u r c lswh c n bls smu t n o st mo .a g tng a d g o uo e c n ma i g a o c mp e e o d e t rt mo e l i h e a e i la e u u rtr ei n o d f r s e ti g n l
杨 霞 陈秋 云 宋京 宝
2 2 1) 10 3
( 江苏 大学化 学化 工 学院 , 江 镇
微生物英文文献及翻译—原文
Dynamic and distribution of ammonia-oxidizing bacteria communities during sludge granulation in an anaerobic e aerobic sequencing batch reactorZhang Bin a ,b ,Chen Zhe a ,b ,Qiu Zhigang a ,b ,Jin Min a ,b ,Chen Zhiqiang a ,b ,Chen Zhaoli a ,b ,Li Junwen a ,b ,Wang Xuan c ,*,Wang Jingfeng a ,b ,**aInstitute of Hygiene and Environmental Medicine,Academy of Military Medical Sciences,Tianjin 300050,PR China bTianjin Key Laboratory of Risk Assessment and Control for Environment and Food Safety,Tianjin 300050,PR China cTianjin Key Laboratory of Hollow Fiber Membrane Material and Membrane Process,Institute of Biological and Chemical Engineering,Tianjin Polytechnical University,Tianjin 300160,PR Chinaa r t i c l e i n f oArticle history:Received 30June 2011Received in revised form 10September 2011Accepted 10September 2011Available online xxx Keywords:Ammonia-oxidizing bacteria Granular sludgeCommunity development Granule sizeNitrifying bacteria distribution Phylogenetic diversitya b s t r a c tThe structure dynamic of ammonia-oxidizing bacteria (AOB)community and the distribution of AOB and nitrite-oxidizing bacteria (NOB)in granular sludge from an anaerobic e aerobic sequencing batch reactor (SBR)were investigated.A combination of process studies,molecular biotechniques and microscale techniques were employed to identify and characterize these organisms.The AOB community structure in granules was substantially different from that of the initial pattern of the inoculants sludge.Along with granules formation,the AOB diversity declined due to the selection pressure imposed by process conditions.Denaturing gradient gel electrophoresis (DGGE)and sequencing results demonstrated that most of Nitrosomonas in the inoculating sludge were remained because of their ability to rapidly adapt to the settling e washing out action.Furthermore,DGGE analysis revealed that larger granules benefit more AOB species surviving in the reactor.In the SBR were various size granules coexisted,granule diameter affected the distribution range of AOB and NOB.Small and medium granules (d <0.6mm)cannot restrict oxygen mass transfer in all spaces of the rger granules (d >0.9mm)can result in smaller aerobic volume fraction and inhibition of NOB growth.All these observations provide support to future studies on the mechanisms responsible for the AOB in granules systems.ª2011Elsevier Ltd.All rights reserved.1.IntroductionAt sufficiently high levels,ammonia in aquatic environments can be toxic to aquatic life and can contribute to eutrophica-tion.Accordingly,biodegradation and elimination of ammonia in wastewater are the primary functions of thewastewater treatment process.Nitrification,the conversion of ammonia to nitrate via nitrite,is an important way to remove ammonia nitrogen.It is a two-step process catalyzed by ammonia-oxidizing and nitrite-oxidizing bacteria (AOB and NOB).Aerobic ammonia-oxidation is often the first,rate-limiting step of nitrification;however,it is essential for the*Corresponding author .**Corresponding author.Institute of Hygiene and Environmental Medicine,Academy of Military Medical Sciences,Tianjin 300050,PR China.Tel.:+862284655498;fax:+862223328809.E-mail addresses:wangxuan0116@ (W.Xuan),jingfengwang@ (W.Jingfeng).Available online atjournal homepage:/locate/watresw a t e r r e s e a r c h x x x (2011)1e 100043-1354/$e see front matter ª2011Elsevier Ltd.All rights reserved.doi:10.1016/j.watres.2011.09.026removal of ammonia from the wastewater(Prosser and Nicol, 2008).Comparative analyses of16S rRNA sequences have revealed that most AOB in activated sludge are phylogeneti-cally closely related to the clade of b-Proteobacteria (Kowalchuk and Stephen,2001).However,a number of studies have suggested that there are physiological and ecological differences between different AOB genera and lineages,and that environmental factors such as process parameter,dis-solved oxygen,salinity,pH,and concentrations of free ammonia can impact certain species of AOB(Erguder et al., 2008;Kim et al.,2006;Koops and Pommerening-Ro¨ser,2001; Kowalchuk and Stephen,2001;Shi et al.,2010).Therefore, the physiological activity and abundance of AOB in waste-water processing is critical in the design and operation of waste treatment systems.For this reason,a better under-standing of the ecology and microbiology of AOB in waste-water treatment systems is necessary to enhance treatment performance.Recently,several developed techniques have served as valuable tools for the characterization of microbial diversity in biological wastewater treatment systems(Li et al., 2008;Yin and Xu,2009).Currently,the application of molec-ular biotechniques can provide clarification of the ammonia-oxidizing community in detail(Haseborg et al.,2010;Tawan et al.,2005;Vlaeminck et al.,2010).In recent years,the aerobic granular sludge process has become an attractive alternative to conventional processes for wastewater treatment mainly due to its cell immobilization strategy(de Bruin et al.,2004;Liu et al.,2009;Schwarzenbeck et al.,2005;Schwarzenbeck et al.,2004a,b;Xavier et al.,2007). Granules have a more tightly compact structure(Li et al.,2008; Liu and Tay,2008;Wang et al.,2004)and rapid settling velocity (Kong et al.,2009;Lemaire et al.,2008).Therefore,granular sludge systems have a higher mixed liquid suspended sludge (MLSS)concentration and longer solid retention times(SRT) than conventional activated sludge systems.Longer SRT can provide enough time for the growth of organisms that require a long generation time(e.g.,AOB).Some studies have indicated that nitrifying granules can be cultivated with ammonia-rich inorganic wastewater and the diameter of granules was small (Shi et al.,2010;Tsuneda et al.,2003).Other researchers reported that larger granules have been developed with the synthetic organic wastewater in sequencing batch reactors(SBRs)(Li et al., 2008;Liu and Tay,2008).The diverse populations of microor-ganisms that coexist in granules remove the chemical oxygen demand(COD),nitrogen and phosphate(de Kreuk et al.,2005). However,for larger granules with a particle diameter greater than0.6mm,an outer aerobic shell and an inner anaerobic zone coexist because of restricted oxygen diffusion to the granule core.These properties of granular sludge suggest that the inner environment of granules is unfavorable to AOB growth.Some research has shown that particle size and density induced the different distribution and dominance of AOB,NOB and anam-mox(Winkler et al.,2011b).Although a number of studies have been conducted to assess the ecology and microbiology of AOB in wastewater treatment systems,the information on the dynamics,distribution,and quantification of AOB communities during sludge granulation is still limited up to now.To address these concerns,the main objective of the present work was to investigate the population dynamics of AOB communities during the development of seedingflocs into granules,and the distribution of AOB and NOB in different size granules from an anaerobic e aerobic SBR.A combination of process studies,molecular biotechniques and microscale techniques were employed to identify and char-acterize these organisms.Based on these approaches,we demonstrate the differences in both AOB community evolu-tion and composition of theflocs and granules co-existing in the SBR and further elucidate the relationship between distribution of nitrifying bacteria and granule size.It is ex-pected that the work would be useful to better understand the mechanisms responsible for the AOB in granules and apply them for optimal control and management strategies of granulation systems.2.Material and methods2.1.Reactor set-up and operationThe granules were cultivated in a lab-scale SBR with an effective volume of4L.The effective diameter and height of the reactor was10cm and51cm,respectively.The hydraulic retention time was set at8h.Activated sludge from a full-scale sewage treat-ment plant(Jizhuangzi Sewage Treatment Works,Tianjin, China)was used as the seed sludge for the reactor at an initial sludge concentration of3876mg LÀ1in MLSS.The reactor was operated on6-h cycles,consisting of2-min influent feeding,90-min anaerobic phase(mixing),240-min aeration phase and5-min effluent discharge periods.The sludge settling time was reduced gradually from10to5min after80SBR cycles in20days, and only particles with a settling velocity higher than4.5m hÀ1 were retained in the reactor.The composition of the influent media were NaAc(450mg LÀ1),NH4Cl(100mg LÀ1),(NH4)2SO4 (10mg LÀ1),KH2PO4(20mg LÀ1),MgSO4$7H2O(50mg LÀ1),KCl (20mg LÀ1),CaCl2(20mg LÀ1),FeSO4$7H2O(1mg LÀ1),pH7.0e7.5, and0.1mL LÀ1trace element solution(Li et al.,2007).Analytical methods-The total organic carbon(TOC),NHþ4e N, NOÀ2e N,NOÀ3e N,total nitrogen(TN),total phosphate(TP) concentration,mixed liquid suspended solids(MLSS) concentration,and sludge volume index at10min(SVI10)were measured regularly according to the standard methods (APHA-AWWA-WEF,2005).Sludge size distribution was determined by the sieving method(Laguna et al.,1999).Screening was performed with four stainless steel sieves of5cm diameter having respective mesh openings of0.9,0.6,0.45,and0.2mm.A100mL volume of sludge from the reactor was sampled with a calibrated cylinder and then deposited on the0.9mm mesh sieve.The sample was subsequently washed with distilled water and particles less than0.9mm in diameter passed through this sieve to the sieves with smaller openings.The washing procedure was repeated several times to separate the gran-ules.The granules collected on the different screens were recovered by backwashing with distilled water.Each fraction was collected in a different beaker andfiltered on quantitative filter paper to determine the total suspended solid(TSS).Once the amount of total suspended solid(TSS)retained on each sieve was acquired,it was reasonable to determine for each class of size(<0.2,[0.2e0.45],[0.45e0.6],[0.6e0.9],>0.9mm) the percentage of the total weight that they represent.w a t e r r e s e a r c h x x x(2011)1e10 22.2.DNA extraction and nested PCR e DGGEThe sludge from approximately8mg of MLSS was transferred into a1.5-mL Eppendorf tube and then centrifuged at14,000g for10min.The supernatant was removed,and the pellet was added to1mL of sodium phosphate buffer solution and aseptically mixed with a sterilized pestle in order to detach granules.Genomic DNA was extracted from the pellets using E.Z.N.A.äSoil DNA kit(D5625-01,Omega Bio-tek Inc.,USA).To amplify ammonia-oxidizer specific16S rRNA for dena-turing gradient gel electrophoresis(DGGE),a nested PCR approach was performed as described previously(Zhang et al., 2010).30m l of nested PCR amplicons(with5m l6Âloading buffer)were loaded and separated by DGGE on polyacrylamide gels(8%,37.5:1acrylamide e bisacrylamide)with a linear gradient of35%e55%denaturant(100%denaturant¼7M urea plus40%formamide).The gel was run for6.5h at140V in 1ÂTAE buffer(40mM Tris-acetate,20mM sodium acetate, 1mM Na2EDTA,pH7.4)maintained at60 C(DCodeäUniversal Mutation Detection System,Bio-Rad,Hercules,CA, USA).After electrophoresis,silver-staining and development of the gels were performed as described by Sanguinetti et al. (1994).These were followed by air-drying and scanning with a gel imaging analysis system(Image Quant350,GE Inc.,USA). The gel images were analyzed with the software Quantity One,version4.31(Bio-rad).Dice index(Cs)of pair wise community similarity was calculated to evaluate the similarity of the AOB community among DGGE lanes(LaPara et al.,2002).This index ranges from0%(no common band)to100%(identical band patterns) with the assistance of Quantity One.The Shannon diversity index(H)was used to measure the microbial diversity that takes into account the richness and proportion of each species in a population.H was calculatedusing the following equation:H¼ÀPn iNlogn iN,where n i/Nis the proportion of community made up by species i(bright-ness of the band i/total brightness of all bands in the lane).Dendrograms relating band pattern similarities were automatically calculated without band weighting(consider-ation of band density)by the unweighted pair group method with arithmetic mean(UPGMA)algorithms in the Quantity One software.Prominent DGGE bands were excised and dissolved in30m L Milli-Q water overnight,at4 C.DNA was recovered from the gel by freeze e thawing thrice.Cloning and sequencing of the target DNA fragments were conducted following the estab-lished method(Zhang et al.,2010).2.3.Distribution of nitrifying bacteriaThree classes of size([0.2e0.45],[0.45e0.6],>0.9mm)were chosen on day180for FISH analysis in order to investigate the spatial distribution characteristics of AOB and NOB in granules.2mg sludge samples werefixed in4%para-formaldehyde solution for16e24h at4 C and then washed twice with sodium phosphate buffer;the samples were dehydrated in50%,80%and100%ethanol for10min each. Ethanol in the granules was then completely replaced by xylene by serial immersion in ethanol-xylene solutions of3:1, 1:1,and1:3by volume andfinally in100%xylene,for10min periods at room temperature.Subsequently,the granules were embedded in paraffin(m.p.56e58 C)by serial immer-sion in1:1xylene-paraffin for30min at60 C,followed by 100%paraffin.After solidification in paraffin,8-m m-thick sections were prepared and placed on gelatin-coated micro-scopic slides.Paraffin was removed by immersing the slide in xylene and ethanol for30min each,followed by air-drying of the slides.The three oligonucleotide probes were used for hybridiza-tion(Downing and Nerenberg,2008):FITC-labeled Nso190, which targets the majority of AOB;TRITC-labeled NIT3,which targets Nitrobacter sp.;TRITC-labeled NSR1156,which targets Nitrospira sp.All probe sequences,their hybridization condi-tions,and washing conditions are given in Table1.Oligonu-cleotides were synthesized andfluorescently labeled with fluorochomes by Takara,Inc.(Dalian,China).Hybridizations were performed at46 C for2h with a hybridization buffer(0.9M NaCl,formamide at the percentage shown in Table1,20mM Tris/HCl,pH8.0,0.01% SDS)containing each labeled probe(5ng m LÀ1).After hybrid-ization,unbound oligonucleotides were removed by a strin-gent washing step at48 C for15min in washing buffer containing the same components as the hybridization buffer except for the probes.For detection of all DNA,4,6-diamidino-2-phenylindole (DAPI)was diluted with methanol to afinal concentration of1ng m LÀ1.Cover the slides with DAPI e methanol and incubate for15min at37 C.The slides were subsequently washed once with methanol,rinsed briefly with ddH2O and immediately air-dried.Vectashield(Vector Laboratories)was used to prevent photo bleaching.The hybridization images were captured using a confocal laser scanning microscope (CLSM,Zeiss710).A total of10images were captured for each probe at each class of size.The representative images were selected andfinal image evaluation was done in Adobe PhotoShop.w a t e r r e s e a r c h x x x(2011)1e1033.Results3.1.SBR performance and granule characteristicsDuring the startup period,the reactor removed TOC and NH 4þ-N efficiently.98%of NH 4þ-N and 100%of TOC were removed from the influent by day 3and day 5respectively (Figs.S2,S3,Supporting information ).Removal of TN and TP were lower during this period (Figs.S3,S4,Supporting information ),though the removal of TP gradually improved to 100%removal by day 33(Fig.S4,Supporting information ).To determine the sludge volume index of granular sludge,a settling time of 10min was chosen instead of 30min,because granular sludge has a similar SVI after 60min and after 5min of settling (Schwarzenbeck et al.,2004b ).The SVI 10of the inoculating sludge was 108.2mL g À1.The changing patterns of MLSS and SVI 10in the continuous operation of the SBR are illustrated in Fig.1.The sludge settleability increased markedly during the set-up period.Fig.2reflects the slow andgradual process of sludge granulation,i.e.,from flocculentsludge to granules.3.2.DGGE analysis:AOB communities structure changes during sludge granulationThe results of nested PCR were shown in Fig.S1.The well-resolved DGGE bands were obtained at the representative points throughout the GSBR operation and the patterns revealed that the structure of the AOB communities was dynamic during sludge granulation and stabilization (Fig.3).The community structure at the end of experiment was different from that of the initial pattern of the seed sludge.The AOB communities on day 1showed 40%similarity only to that at the end of the GSBR operation (Table S1,Supporting information ),indicating the considerable difference of AOB communities structures between inoculated sludge and granular sludge.Biodiversity based on the DGGE patterns was analyzed by calculating the Shannon diversity index H as204060801001201401254159738494104115125135147160172188Time (d)S V I 10 (m L .g -1)10002000300040005000600070008000900010000M L S S (m g .L -1)Fig.1e Change in biomass content and SVI 10during whole operation.SVI,sludge volume index;MLSS,mixed liquid suspendedsolids.Fig.2e Variation in granule size distribution in the sludge during operation.d,particle diameter;TSS,total suspended solids.w a t e r r e s e a r c h x x x (2011)1e 104shown in Fig.S5.In the phase of sludge inoculation (before day 38),H decreased remarkably (from 0.94to 0.75)due to the absence of some species in the reactor.Though several dominant species (bands2,7,10,11)in the inoculating sludge were preserved,many bands disappeared or weakened (bands 3,4,6,8,13,14,15).After day 45,the diversity index tended to be stable and showed small fluctuation (from 0.72to 0.82).Banding pattern similarity was analyzed by applying UPGMA (Fig.4)algorithms.The UPGMA analysis showed three groups with intragroup similarity at approximately 67%e 78%and intergroup similarity at 44e 62%.Generally,the clustering followed the time course;and the algorithms showed a closer clustering of groups II and III.In the analysis,group I was associated with sludge inoculation and washout,group IIwithFig.3e DGGE profile of the AOB communities in the SBR during the sludge granulation process (lane labels along the top show the sampling time (days)from startup of the bioreactor).The major bands were labeled with the numbers (bands 1e15).Fig.4e UPGMA analysis dendrograms of AOB community DGGE banding patterns,showing schematics of banding patterns.Roman numerals indicate major clusters.w a t e r r e s e a r c h x x x (2011)1e 105startup sludge granulation and decreasing SVI 10,and group III with a stable system and excellent biomass settleability.In Fig.3,the locations of the predominant bands were excised from the gel.DNA in these bands were reamplified,cloned and sequenced.The comparative analysis of these partial 16S rRNA sequences (Table 2and Fig.S6)revealed the phylogenetic affiliation of 13sequences retrieved.The majority of the bacteria in seed sludge grouped with members of Nitrosomonas and Nitrosospira .Along with sludge granula-tion,most of Nitrosomonas (Bands 2,5,7,9,10,11)were remained or eventually became dominant in GSBR;however,all of Nitrosospira (Bands 6,13,15)were gradually eliminated from the reactor.3.3.Distribution of AOB and NOB in different sized granulesFISH was performed on the granule sections mainly to deter-mine the location of AOB and NOB within the different size classes of granules,and the images were not further analyzed for quantification of cell counts.As shown in Fig.6,in small granules (0.2mm <d <0.45mm),AOB located mainly in the outer part of granular space,whereas NOB were detected only in the core of granules.In medium granules (0.45mm <d <0.6mm),AOB distributed evenly throughout the whole granular space,whereas NOB still existed in the inner part.In the larger granules (d >0.9mm),AOB and NOB were mostly located in the surface area of the granules,and moreover,NOB became rare.4.Discussion4.1.Relationship between granule formation and reactor performanceAfter day 32,the SVI 10stabilized at 20e 35mL g À1,which is very low compared to the values measured for activated sludge (100e 150mL g À1).However,the size distribution of the granules measured on day 32(Fig.2)indicated that only 22%of the biomass was made of granular sludge with diameter largerthan 0.2mm.These results suggest that sludge settleability increased prior to granule formation and was not affected by different particle sizes in the sludge during the GSBR operation.It was observed,however,that the diameter of the granules fluctuated over longer durations.The large granules tended to destabilize due to endogenous respiration,and broke into smaller granules that could seed the formation of large granules again.Pochana and Keller reported that physically broken sludge flocs contribute to lower denitrification rates,due to their reduced anoxic zone (Pochana and Keller,1999).Therefore,TN removal efficiency raises fluctuantly throughout the experiment.Some previous research had demonstrated that bigger,more dense granules favored the enrichment of PAO (Winkler et al.,2011a ).Hence,after day 77,removal efficiency of TP was higher and relatively stable because the granules mass fraction was over 90%and more larger granules formed.4.2.Relationship between AOB communities dynamic and sludge granulationFor granule formation,a short settling time was set,and only particles with a settling velocity higher than 4.5m h À1were retained in the reactor.Moreover,as shown in Fig.1,the variation in SVI 10was greater before day 41(from 108.2mL g À1e 34.1mL g À1).During this phase,large amounts of biomass could not survive in the reactor.A clear shift in pop-ulations was evident,with 58%similarity between days 8and 18(Table S1).In the SBR system fed with acetate-based synthetic wastewater,heterotrophic bacteria can produce much larger amounts of extracellular polysaccharides than autotrophic bacteria (Tsuneda et al.,2003).Some researchers found that microorganisms in high shear environments adhered by extracellular polymeric substances (EPS)to resist the damage of suspended cells by environmental forces (Trinet et al.,1991).Additionally,it had been proved that the dominant heterotrophic species in the inoculating sludge were preserved throughout the process in our previous research (Zhang et al.,2011).It is well known that AOB are chemoau-totrophic and slow-growing;accordingly,numerous AOBw a t e r r e s e a r c h x x x (2011)1e 106populations that cannot become big and dense enough to settle fast were washed out from the system.As a result,the variation in AOB was remarkable in the period of sludge inoculation,and the diversity index of population decreased rapidly.After day 45,AOB communities’structure became stable due to the improvement of sludge settleability and the retention of more biomass.These results suggest that the short settling time (selection pressure)apparently stressed the biomass,leading to a violent dynamic of AOB communities.Further,these results suggest that certain populations may have been responsible for the operational success of the GSBR and were able to persist despite the large fluctuations in pop-ulation similarity.This bacterial population instability,coupled with a generally acceptable bioreactor performance,is congruent with the results obtained from a membrane biore-actor (MBR)for graywater treatment (Stamper et al.,2003).Nitrosomonas e like and Nitrosospira e like populations are the dominant AOB populations in wastewater treatment systems (Kowalchuk and Stephen,2001).A few previous studies revealed that the predominant populations in AOB communities are different in various wastewater treatment processes (Tawan et al.,2005;Thomas et al.,2010).Some researchers found that the community was dominated by AOB from the genus Nitrosospira in MBRs (Zhang et al.,2010),whereas Nitrosomonas sp.is the predominant population in biofilter sludge (Yin and Xu,2009).In the currentstudy,Fig.5e DGGE profile of the AOB communities in different size of granules (lane labels along the top show the range of particle diameter (d,mm)).Values along the bottom indicate the Shannon diversity index (H ).Bands labeled with the numbers were consistent with the bands in Fig.3.w a t e r r e s e a r c h x x x (2011)1e 107sequence analysis revealed that selection pressure evidently effect on the survival of Nitrosospira in granular sludge.Almost all of Nitrosospira were washed out initially and had no chance to evolve with the environmental changes.However,some members of Nitrosomonas sp.have been shown to produce more amounts of EPS than Nitrosospira ,especially under limited ammonia conditions (Stehr et al.,1995);and this feature has also been observed for other members of the same lineage.Accordingly,these EPS are helpful to communicate cells with each other and granulate sludge (Adav et al.,2008).Therefore,most of Nitrosomonas could adapt to this challenge (to become big and dense enough to settle fast)and were retained in the reactor.At the end of reactor operation (day 180),granules with different particle size were sieved.The effects of variation in granules size on the composition of the AOBcommunitiesFig.6e Micrographs of FISH performed on three size classes of granule sections.DAPI stain micrographs (A,D,G);AOB appear as green fluorescence (B,E,H),and NOB appear as red fluorescence (C,F,I).Bar [100m m in (A)e (C)and (G)e (I).d,particle diameter.(For interpretation of the references to colour in this figure legend,the reader is referred to the web version of this article.)w a t e r r e s e a r c h x x x (2011)1e 108were investigated.As shown in Fig.5,AOB communities structures in different size of granules were varied.Although several predominant bands(bands2,5,11)were present in all samples,only bands3and6appeared in the granules with diameters larger than0.6mm.Additionally,bands7and10 were intense in the granules larger than0.45mm.According to Table2,it can be clearly indicated that Nitrosospira could be retained merely in the granules larger than0.6mm.Therefore, Nitrosospira was not present at a high level in Fig.3due to the lower proportion of larger granules(d>0.6mm)in TSS along with reactor operation.DGGE analysis also revealed that larger granules had a greater microbial diversity than smaller ones. This result also demonstrates that more organisms can survive in larger granules as a result of more space,which can provide the suitable environment for the growth of microbes(Fig.6).4.3.Effect of variance in particle size on the distribution of AOB and NOB in granulesAlthough an influence of granule size has been observed in experiments and simulations for simultaneous N-and P-removal(de Kreuk et al.,2007),the effect of granule size on the distribution of different biomass species need be revealed further with the assistance of visible experimental results, especially in the same granular sludge reactors.Related studies on the diversity of bacterial communities in granular sludge often focus on the distribution of important functional bacteria populations in single-size granules(Matsumoto et al., 2010).In the present study,different size granules were sieved,and the distribution patterns of AOB and NOB were explored.In the nitrification processes considered,AOB and NOB compete for space and oxygen in the granules(Volcke et al.,2010).Since ammonium oxidizers have a higheroxygen affinity(K AOBO2<K NOBO2)and accumulate more rapidly inthe reactor than nitrite oxidizers(Volcke et al.,2010),NOB are located just below the layer of AOB,where still some oxygen is present and allows ready access to the nitrite produced.In smaller granules,the location boundaries of the both biomass species were distinct due to the limited existence space provided by granules for both microorganism’s growth.AOB exist outside of the granules where oxygen and ammonia are present.Medium granules can provide broader space for microbe multiplying;accordingly,AOB spread out in the whole granules.This result also confirms that oxygen could penetrate deep into the granule’s core without restriction when particle diameter is less than0.6mm.Some mathematic model also supposed that NOBs are favored to grow in smaller granules because of the higher fractional aerobic volume (Volcke et al.,2010).As shown in the results of the batch experiments(Zhang et al.,2011),nitrite accumulation temporarily occurred,accompanied by the more large gran-ules(d>0.9mm)forming.This phenomenon can be attrib-uted to the increased ammonium surface load associated with larger granules and smaller aerobic volume fraction,resulting in outcompetes of NOB.It also suggests that the core areas of large granules(d>0.9mm)could provide anoxic environment for the growth of anaerobic denitrificans(such as Tb.deni-trificans or Tb.thioparus in Fig.S7,Supporting information).As shown in Fig.2and Fig.S3,the removal efficiency of total nitrogen increased with formation of larger granules.5.ConclusionsThe variation in AOB communities’structure was remarkable during sludge inoculation,and the diversity index of pop-ulation decreased rapidly.Most of Nitrosomonas in the inocu-lating sludge were retained because of their capability to rapidly adapt to the settling e washing out action.DGGE anal-ysis also revealed that larger granules had greater AOB diversity than that of smaller ones.Oxygen penetration was not restricted in the granules of less than0.6mm particle diameter.However,the larger granules(d>0.9mm)can result in the smaller aerobic volume fraction and inhibition of NOB growth.Henceforth,further studies on controlling and opti-mizing distribution of granule size could be beneficial to the nitrogen removal and expansive application of granular sludge technology.AcknowledgmentsThis work was supported by grants from the National Natural Science Foundation of China(No.51108456,50908227)and the National High Technology Research and Development Program of China(No.2009AA06Z312).Appendix.Supplementary dataSupplementary data associated with this article can be found in online version at doi:10.1016/j.watres.2011.09.026.r e f e r e n c e sAdav,S.S.,Lee, D.J.,Show,K.Y.,2008.Aerobic granular sludge:recent advances.Biotechnology Advances26,411e423.APHA-AWWA-WEF,2005.Standard Methods for the Examination of Water and Wastewater,first ed.American Public Health Association/American Water Works Association/WaterEnvironment Federation,Washington,DC.de Bruin,L.M.,de Kreuk,M.,van der Roest,H.F.,Uijterlinde,C., van Loosdrecht,M.C.M.,2004.Aerobic granular sludgetechnology:an alternative to activated sludge?Water Science and Technology49,1e7.de Kreuk,M.,Heijnen,J.J.,van Loosdrecht,M.C.M.,2005.Simultaneous COD,nitrogen,and phosphate removal byaerobic granular sludge.Biotechnology and Bioengineering90, 761e769.de Kreuk,M.,Picioreanu,C.,Hosseini,M.,Xavier,J.B.,van Loosdrecht,M.C.M.,2007.Kinetic model of a granular sludge SBR:influences on nutrient removal.Biotechnology andBioengineering97,801e815.Downing,L.S.,Nerenberg,R.,2008.Total nitrogen removal ina hybrid,membrane-aerated activated sludge process.WaterResearch42,3697e3708.Erguder,T.H.,Boon,N.,Vlaeminck,S.E.,Verstraete,W.,2008.Partial nitrification achieved by pulse sulfide doses ina sequential batch reactor.Environmental Science andTechnology42,8715e8720.w a t e r r e s e a r c h x x x(2011)1e109。
基于核酸适配体和阳离子聚合物PAH高效聚集纳米金比色法检测牛奶中四环素

基于核酸适配体和阳离子聚合物PAH高效聚集纳米金比色法检测牛奶中四环素罗艳芳;贺兰;詹深山;刘乐;支月娥;周培【摘要】为满足乳制品中四环素快速检测要求,开发了基于核酸适配体(aptamer)和阳离子聚合物PAH高效聚集纳米金比色检测牛奶中四环素(TET)的新方法.本文优化了PAH和适配体的浓度.最优实验条件下,四环素浓度在一定范围内与A520/A650呈现良好的线性关系,最低检测限(LOD)为95 nmol/L,对四环素具有良好的选择性.该方法已成功用于牛奶中四环素的检测,回收率为108%~117%,相对标准偏差为2.9%~3.6%.【期刊名称】《上海交通大学学报(农业科学版)》【年(卷),期】2014(032)006【总页数】6页(P66-70,91)【关键词】四环素;核酸适配体;PAH;纳米金;比色【作者】罗艳芳;贺兰;詹深山;刘乐;支月娥;周培【作者单位】上海交通大学农业与生物学院,上海200240;上海交通大学农业与生物学院,上海200240;上海交通大学农业与生物学院,上海200240;上海交通大学农业与生物学院,上海200240;上海交通大学农业与生物学院,上海200240;上海交通大学农业与生物学院,上海200240【正文语种】中文【中图分类】X83四环素是一种常见的广谱抗生素类药物,被广泛运用于人类细菌感染治疗及添加于畜禽饲料中[1]。
据报道,每年有5 000 t四环素被人类和动物消耗[2]。
随着四环素使用量的增加,其在食品和环境中的残留带来了一系列的问题,如:微生物抗药性增强、超级细菌的产生,食用具有抗生素残留肉制品后导致的过敏现象及某些器官的病变等等[3-4]。
为了保障消费者食品安全,欧盟规定牛奶中四环素最大残留为225 nmol/L[5],美国食品药品监督管理局规定牛奶中四环素最大残留为900 nmol/L[6]。
2002年,我国农业部修订的《动物性食品中兽药最高残留限量》中规定,牛羊奶以及所有动物性食品中四环素类药物残留的最高残留量为225 nmol/L。
Antimony in the environment a review focused on natural waters Occurrence
0012-8252r02r$ - see front matter q 2002 Elsevier Science B.V. All rights reserved. PII: S 0 0 1 2 - 8 2 5 2 Ž 0 1 . 0 0 0 7 0 - 8
Table 1 Antimony abundance
Material
Cosmic abundance Chondrites
Earth-Science Reviews 57 Ž2002. 125–176
rlocaterearscirev
Antimony in the environment: a review focused on natural waters I. Occurrence
Montserrat Filella a,), Nelson Belzile b, Yu-Wei Chen b
126
M. Filella et al.r Earth-Science ReÕiews 57 (2002) 125–176Βιβλιοθήκη 1. Introduction
A good deal of research on geochemical and biogeochemical processes in natural waters has been, and continues to be, devoted to trace elements, particularly transition metals. Rather less attention has been focused on the so-called metalloid elements. Among them, antimony is the one that has received the scantiest attention.
柠檬酸改性球形活性炭对氨气吸附性能的影响

化工进展Chemical Industry and Engineering Progress2024 年第 43 卷第 2 期柠檬酸改性球形活性炭对氨气吸附性能的影响郭迎春,梁晓怿(华东理工大学化工学院,上海 200237)摘要:以沥青基球形活性炭为载体,采用等体积浸渍法将不同浓度的柠檬酸负载到活性炭孔隙内。
通过固定床动态吸附装置评价柠檬酸改性活性炭对氨气吸附性能的影响。
采用扫描电子显微镜、X 射线衍射仪、傅里叶变换红外光谱和氮气吸脱附对改性前后活性炭的理化特性进行表征分析。
结果表明,当柠檬酸负载量为60%(质量分数)时,改性活性炭对氨气的吸附性能最佳,氨气防护时间为194min ,单位活性炭的氨气吸附容量为42.8mg/mL (66.8mg/g ),是未改性活性炭吸附容量的24倍;吸附剂的总比表面积和孔体积以及pH 都随着柠檬酸负载量的增加不断减小,其中微孔的比表面积和孔体积与柠檬酸负载量的相关系数R 2分别为0.9944和0.9842;柠檬酸的利用率随着负载量的增加不断减少,氨气与柠檬酸反应生成柠檬酸铵,产物主要沉积在微孔内,微孔对氨气吸附至关重要。
关键词:活性炭;柠檬酸;复合材料;固定床;吸附;氨气中图分类号:X511 文献标志码:A 文章编号:1000-6613(2024)02-1082-07Effect of citric acid modification on the spherical activated carbon ’sammonia adsorption performanceGUO Yingchun ,LIANG Xiaoyi(School of Chemical Engineering, East China University of Science and Technology, Shanghai 200237, China)Abstract: The pitch-based spherical activated carbon was used as support to load different amounts of citric acid into its pores by equivalent-volume impregnation method. The effect of citric acid modification on the activated carbon ’s ammonia adsorption was evaluated by a fixed bed dynamic adsorption device. The physicochemical properties of activated carbon before and after modification were characterized by SEM, XRD, FTIR, nitrogen adsorption and desorption. The results showed that the modified activated carbon had the best ammonia adsorption performance when the load of citric acid was 60%. The ammonia protection time was 194min, and the ammonia adsorption capacity was 42.8mg/mL (66.8mg/g), which was 24 times that of unmodified activated carbon. The total specific surface area, pore volume and pH of the adsorbent decreased with the increase of citric acid loading, and the correlation coefficients R 2 between the specific surface area and pore volume of the adsorbent, and citric acid loading were 0.9944 and 0.9842, respectively. As the loading capacity increased, the utilization rate of citric acid decreased. Ammonia reacted with citric acid to produce ammonium citrate. The products were mainly deposited in micropores, which were crucial for ammonia adsorption.Keywords: activated carbon; citric acid; composites; fixed-bed; adsorption; ammonia研究开发DOI :10.16085/j.issn.1000-6613.2023-0290收稿日期:2023-02-28;修改稿日期:2023-05-08。
硫代硫酸盐驱动自养反硝化耦合厌氧氨氧化强化总氮去除
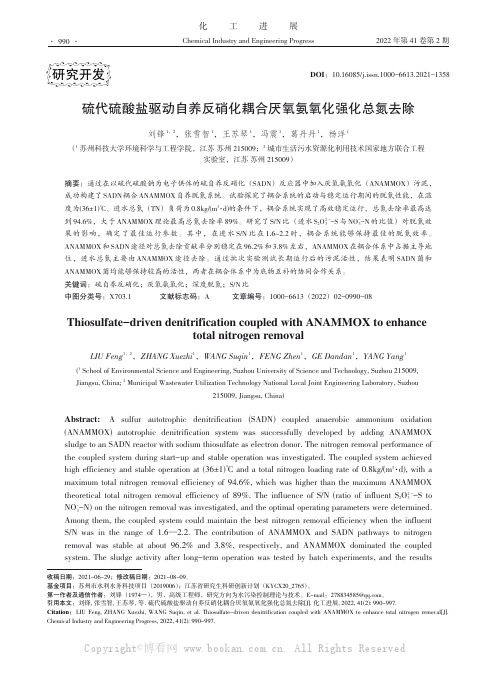
化工进展Chemical Industry and Engineering Progress2022年第41卷第2期硫代硫酸盐驱动自养反硝化耦合厌氧氨氧化强化总氮去除刘锋1,2,张雪智1,王苏琴1,冯震1,葛丹丹1,杨洋1(1苏州科技大学环境科学与工程学院,江苏苏州215009;2城市生活污水资源化利用技术国家地方联合工程实验室,江苏苏州215009)摘要:通过在以硫代硫酸钠为电子供体的硫自养反硝化(SADN )反应器中加入厌氧氨氧化(ANAMMOX )污泥,成功构建了SADN 耦合ANAMMOX 自养脱氮系统。
试验探究了耦合系统的启动与稳定运行期间的脱氮性能,在温度为(36±1)℃、进水总氮(TN )负荷为0.8kg/(m 3·d)的条件下,耦合系统实现了高效稳定运行,总氮去除率最高达到94.6%,大于ANAMMOX 理论最高总氮去除率89%。
研究了S/N 比(进水S 2O 2-3-S 与NO -3-N 的比值)对脱氮效果的影响,确定了最佳运行参数。
其中,在进水S/N 比在1.6~2.2时,耦合系统能够保持最佳的脱氮效率。
ANAMMOX 和SADN 途径对总氮去除贡献率分别稳定在96.2%和3.8%左右,ANAMMOX 在耦合体系中占据主导地位,进水总氮主要由ANAMMOX 途径去除。
通过批次实验测试长期运行后的污泥活性,结果表明SADN 菌和ANAMMOX 菌均能够保持较高的活性,两者在耦合体系中为底物互补的协同合作关系。
关键词:硫自养反硝化;厌氧氨氧化;深度脱氮;S/N 比中图分类号:X703.1文献标志码:A文章编号:1000-6613(2022)02-0990-08Thiosulfate-driven denitrification coupled with ANAMMOX to enhancetotal nitrogen removalLIU Feng 1,2,ZHANG Xuezhi 1,WANG Suqin 1,FENG Zhen 1,GE Dandan 1,YANG Yang 1(1School of Environmental Science and Engineering,Suzhou University of Science and Technology,Suzhou 215009,Jiangsu,China;2Municipal Wastewater Utilization Technology National Local Joint Engineering Laboratory,Suzhou215009,Jiangsu,China)Abstract:A sulfur autotrophic denitrification (SADN)coupled anaerobic ammonium oxidation (ANAMMOX)autotrophic denitrification system was successfully developed by adding ANAMMOX sludge to an SADN reactor with sodium thiosulfate as electron donor.The nitrogen removal performance of the coupled system during start-up and stable operation was investigated.The coupled system achieved high efficiency and stable operation at (36±1)℃and a total nitrogen loading rate of 0.8kg/(m 3·d),with a maximum total nitrogen removal efficiency of 94.6%,which was higher than the maximum ANAMMOXtheoretical total nitrogen removal efficiency of 89%.The influence of S/N (ratio of influent S 2O 2-3-S to NO -3-N)on the nitrogen removal was investigated,and the optimal operating parameters were determined.Among them,the coupled system could maintain the best nitrogen removal efficiency when the influent S/N was in the range of 1.6—2.2.The contribution of ANAMMOX and SADN pathways to nitrogen removal was stable at about 96.2%and 3.8%,respectively,and ANAMMOX dominated the coupled system.The sludge activity after long-term operation was tested by batch experiments,and the results研究开发DOI :10.16085/j.issn.1000-6613.2021-1358收稿日期:2021-06-29;修改稿日期:2021-08-09。
黑色素微粒修饰阿霉素对甲状腺未分化癌细胞耐药性的影响

黑色素微粒修饰阿霉素对甲状腺未分化癌细胞耐药性的影响目的探究黑色素微粒修饰阿霉素(DOX-MNPs)对甲状腺未分化癌细胞(ATC)耐药性的影响。
方法合成多巴胺黑色素纳米粒(MNPs)并加载阿霉素(DOX),紫外-可见光谱法测定不同质量比下MNPs的载药效率和容量,透射电子显微镜(TEM)和Brookhaven Zeta PALS分析仪分析纳米颗粒的特性。
不同浓度的游离DOX和DOX-MNPs(0、10、20、40、80、160 mg/L)作用于ATC 药物敏感细胞株HTh74和耐药细胞株HTh74R,MTT法检测细胞活力,流式细胞术检测细胞对DOX的摄取能力。
结果DOX-MNPs的负载效率随DOX和MNPs质量比的增加而降低,当质量比为0.167∶1时,加载效果达到峰值93.45%,该质量比下得到的DOX-MNPs具有与MNPs相似的形态,动作电位和粒径分布分别为13.79 mV和(241.1±4.8)nm。
在HTh74R细胞中,DOX-MNPs浓度高于20 mg/L时,细胞活力显著低于同等药物浓度游离DOX(P 20 mg/L时产生的治疗效果显著高于同等浓度的游离DOX(P < 0.05)。
最高测试浓度下(160 mg/L),游离DOX孵育的HTh74R细胞的存活率为(72.3±6.5)%,而DOX-MNPs孵育的HTh74R细胞存活率减少至(34.6±5.4)%。
2.5 游离DOX/DOX-MNPs培养下ATC细胞对DOX的摄取能力比较荧光激活细胞分选(fluorescence-activated cell sorting,FACS)结果显示,HTh74细胞中游离DOX与DOX-MNPs的摄取程度相似(图7a)。
当其与HTh74R 细胞孵育时,游离DOX的摄取率低于与HTh74细胞孵育时的摄取率,而DOX-MNPs的摄取程度与其在HTh74细胞的摄取程度相似(图7b),HEK293细胞中游离DOX和DOX-MNPs的摄取程度相似(图8)。
常压室温等离子体诱变粘红酵母筛选高产油脂菌株及发酵条件优化
常压室温等离子体诱变粘红酵母筛选高产油脂菌株及发酵条件优化刘雅婷;刘宏娟;王艳萍;张建安【摘要】The Rhodotorula glutinis was mutagenized by atmospheric and room temperature plasma ( ARTP) . The optimal mutation condition was 60 s at 120 W,under this condition the lethality rate was 90%. The strain LA1 with high lipid production was screened from mutagenized Rhodotorula glutinis by Sudan black B staining method. The lipid productivity and lipid content of LA1 increased by 17. 59%and 46. 08% respectively comparing with Rhodotorula glutinis. The fermentation conditions of LA1 were optimized as follows:initial mass concentration of glucose 70 g/L, with (NH4 )2 SO4 as nitrogen source and C/N 53. Under these conditions, the lipid productivity, biomass, lipid content and lipid yield of LA1 in-creased by 123. 9%,56. 6%,43. 0% and 43. 5% respectively, and the fatty acid composition of the lipid of LA1 was similar to that of vegetable oil.%以粘红酵母( Rhodotorula glutinis)为出发菌株,采用常压室温等离子体对其进行诱变。
anammox 反应方程式
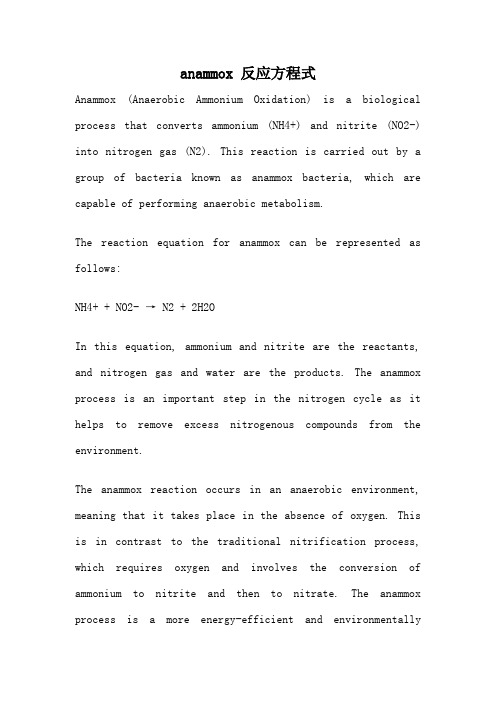
anammox 反应方程式Anammox (Anaerobic Ammonium Oxidation) is a biological process that converts ammonium (NH4+) and nitrite (NO2-) into nitrogen gas (N2). This reaction is carried out by a group of bacteria known as anammox bacteria, which are capable of performing anaerobic metabolism.The reaction equation for anammox can be represented as follows:NH4+ + NO2- → N2 + 2H2OIn this equation, ammonium and nitrite are the reactants, and nitrogen gas and water are the products. The anammox process is an important step in the nitrogen cycle as it helps to remove excess nitrogenous compounds from the environment.The anammox reaction occurs in an anaerobic environment, meaning that it takes place in the absence of oxygen. This is in contrast to the traditional nitrification process, which requires oxygen and involves the conversion of ammonium to nitrite and then to nitrate. The anammox process is a more energy-efficient and environmentallyfriendly alternative to nitrification for the removal of nitrogen from wastewater and other nitrogen-rich sources.The anammox reaction is carried out by two groups of bacteria: anammox bacteria and nitrite-oxidizing bacteria (NOB). The anammox bacteria, such as Candidatus Brocadia, Candidatus Kuenenia, and Candidatus Scalindua, are responsible for the conversion of ammonium and nitrite to nitrogen gas. These bacteria use a specialized enzyme called hydrazine synthase to catalyze the reaction.The nitrite-oxidizing bacteria, on the other hand, are responsible for the production of nitrite, which is the substrate for the anammox reaction. These bacteria convert ammonia to nitrite through the process of aerobic nitrification. The nitrite produced by the NOB is then used by the anammox bacteria as a substrate for the anammox reaction.The anammox reaction is an important process in wastewater treatment plants, where it is used to remove nitrogen from the wastewater before it is discharged into the environment. This helps to prevent eutrophication, a process in which excessive nutrients in the water lead to the overgrowth ofalgae and other aquatic plants. Eutrophication can result in the depletion of oxygen in the water, leading to the death of aquatic organisms.In addition to its application in wastewater treatment, the anammox process has also been studied for its potential in other fields, such as bioenergy production and the treatment of nitrogen-rich industrial effluents. The process has shown promise in terms of its energy efficiency and its ability to reduce greenhouse gas emissions compared to traditional nitrogen removal methods.In summary, the anammox reaction is a biological process carried out by anammox bacteria that converts ammonium and nitrite into nitrogen gas. This reaction occurs in an anaerobic environment and is an important step in the nitrogen cycle. The anammox process has applications in wastewater treatment and other fields and offers a more energy-efficient and environmentally friendly alternative to traditional nitrogen removal methods.。
- 1、下载文档前请自行甄别文档内容的完整性,平台不提供额外的编辑、内容补充、找答案等附加服务。
- 2、"仅部分预览"的文档,不可在线预览部分如存在完整性等问题,可反馈申请退款(可完整预览的文档不适用该条件!)。
- 3、如文档侵犯您的权益,请联系客服反馈,我们会尽快为您处理(人工客服工作时间:9:00-18:30)。
Generation of Anammox-optimal nitrite:ammonium ratiowith SHARON process: usefulness of process control?Eveline I.P. Volcke*, Stijn W.H. Van Hulle*, Mark C.M. van Loosdrecht** and Peter A.Vanrolleghem** BIOMATH, Department of Applied Mathematics, Biometrics and Process Control,Ghent University, Coupure Links 653, B-9000 Gent, Belgium(E-mail: eveline.volcke@biomath.ugent.be)** Department of Biochemical Engineering,Delft University of Technology, Julianalaan 67, NL-2628 BC Delft, The NetherlandsAbstractThe combined SHARON-Anammox process for treating wastewater streams with highammonia load, is discussed. Partial nitrification in the SHARON reactor should beperformed to such an extent that an Anammox-optimal nitrite:ammonium ratio is generated.A simulation study for realistic influent conditions (sludge digestion reject water) revealsthat the nitrite:ammonium ratio obtained in a SHARON process operated without controlmight deviate significantly from the ideal ratio and might endanger operation of thesubsequent Anammox reactor. It is further examined how this ratio might be optimizedthrough cascade feedback control by adding acid or base to the SHARON reactor. Theresults are quantified by means of an operating cost index.KeywordsAnammox, operating cost index (OCI), partial nitrification, process control, SHARON,simulationINTRODUCTIONIn the SHARON process, partial nitrification of ammonium to nitrite is achieved by working at high temperature (30-40°C) and neutral pH (about 7.5). An appropriate sludge retention time (SRT) is maintained, in order to wash-out the nitrite oxidizing biomass, realizing significant aeration cost savings in comparison with conventional nitrification to nitrate. The SHARON process is applied to treat sludge digestion reject water in order to relieve the main wastewater treatment plant (WWTP) to which this stream is subsequently recycled. A full-scale SHARON process is operational since January 1999 at the Rotterdam Sluisjesdijk sludge treatment plant. In the last few years, the coupling of the SHARON process with a so-called Anammox process, in which ammonium and nitrite are converted to nitrogen gas under anaerobic conditions by autotrophic micro-organisms, has gained a lot of interest (van Dongen et al., 2001). With the combined SHARON-Anammox process, low nitrogen effluent concentrations can be obtained, while aeration costs are further reduced, no additional carbon source is needed and sludge production is very low.Figure 1 Simplified scheme of the SHARON-Anammox processTheoretically, in case the SHARON influent contains equimolar amounts of ammonium andbicarbonate, which can be reasonably assumed for sludge digestion reject water, its effluent will contain the required nitrite:ammonium ratio of 1:1 that is needed to feed the Anammox reactor. This simplified reasoning, neglecting among others biomass growth, is represented in Figure 1.In practice, the actual nitrite:ammonium ratio needed by the Anammox process will depend on the biomass yield and is typically somewhat higher. The nitrite:ammonium ratio produced by the SHARON process depends upon a number of factors, e.g. influent alkalinity. In this contribution, the nitrite:ammonium ratio produced by the SHARON process, as well as its effect on the subsequent Anammox process, in particular with respect to nitrite inhibition of the latter, is examined for realistic influent conditions by means of a simulation study. Cascade feedback control by adding acid or base to the SHARON reactor is proposed to optimize this ratio and is evaluated through an operating cost index (OCI).THE SHARON AND ANAMMOX MODELSThe SHARON reactor model, implemented in Matlab-Simulink, has been described by Volcke et al. (2002b). The model takes into account the pH effects that occur during nitrification of highly concentrated streams. pH dependency of the biomass growth rate is taken up explicitly by pH dependency of µmax as well as implicitly through the concentrations of the uncharged ammonia and nitrous acid, that are pH dependent. The Anammox reactor model, implemented in WEST® (Hemmis N.V., Kortrijk, Belgium), consists of a continuously stirred tank reactor with almost complete (99.5%) biomass retention. Anammox kinetics are based on the model proposed by Dapena et al. (2003). Inhibition of Anammox growth by nitrite was incorporated by a Haldane dependency, with an inhibition coefficient of 1 mole/m3, in accordance with Strous et al. (1999).SIMULATION RESULTSThe behaviour of the SHARON reactor is simulated over a period of a year under realistic influent conditions. An operating mode without process control is compared to one with cascade feedback control of the nitrite:ammonium ratio produced in the SHARON process. Influent conditionsIn order to obtain a realistic influent file, daily averaged on-line measurements for flow rate and ammonium concentrations, as well as weekly lab analyses for bicarbonate alkalinity and pH from the full-scale SHARON process in Rotterdam were used. Figure 2 gives the resulting load profiles for ammonium and bicarbonate. The influent flow rate varies between 0 and 921 m3/day (mean 422), the influent bicarbonate:ammonium molar ratio varies between 0.16 and 3.59 (mean 1.1), the influent pH varies between 7.6 and 8.3 (mean 8.0). The simulation study has been performed for a continuously aerated SHARON reactor with a constant volume of 528 m3, corresponding with a mean aerobic retention time of 1.25 days. The volume of the3Operation mode 1: continuously aerated SHARON reactor, no controlFigure 3 (top) shows the simulation results for the SHARON reactor operated without process control. For the assumed value of the nitrite inhibition constant, the Anammox reaction is strongly inhibited because of the unfavourable nitrite:ammonium ratio produced in the SHARON reactor. It seems strongly recommendable to control the nitrite:ammonium ratio(bottom). Concentration profiles of ammonium (left), nitrite (middle) in SHARON reactor and in subsequentAnammox reactor, pH in SHARON reactor (right).Operation mode 2: continuously aerated SHARON reactor, cascade feedback control of produced nitrite:ammonium by acid/base additionThe proposed cascade feedback controller (Figure 3) consists of a primary controller,maintaining the desired nitrite:ammonium setpoint by adjusting the desired pH-value that has to be set by the secondary controller by means of acid or base addition. The Anammox-optimal nitrite:ammonium ratio (R sp ) is set to 1.32, according to the stoichiometry determined by Strous et al. (1998).Figure 4: Structure of the proposed cascade feedback controllerFigure 3 (bottom) gives the simulation results. Although individual nitrite and ammonium concentrations in the SHARON reactor still vary, the produced nitrite:ammonium ratio remains quite constant with a slight stoichiometric excess of ammonium. As a result, the Anammox reactor performs very well.EVALUATION PROCEDURE:USE OF AN OPERATING COST INDEX (OCI)An operating cost index (OCI) is defined, that includes the operating cost factors that are different for the two operating modes under study:base base acid acid 1EQ OCI Φ⋅α+Φ⋅α+⋅γ=[€/year]The effluent quality term EQ (in kg Pollution Units/day) is calculated as in the COST benchmark approach (Volcke et al. 2002a), and in this study covers ammonium in the Anammox effluent, that is recycled to the main WWTP and ends up in the effluent stream for plants with a lack of aeration capacity, as can be reasonably assumed here. The OCI further takes into account the cost of acid and base addition for the operation mode with control. The cost coefficients for the pollution units and acid and base additions are reported in Table 1 and are found in Volcke et al. (2002a) and /costchem.html respectively. Table 1. Cost multiplication factors.Table 2. OCI economic evaluation cost factor (€/year)economic weightvalueunit cost factor (€/year)no control cascade FB control effluent fines γ150€/EQ/year (EQ in kgPU/d)effluent fines 2220327794acid additionαacid 0.00318€/molar equivalent chemical addition 039993base addition αbase 0.00747€/molar equivalent OCI – aeration limitation (€/year)22203247787Table 2 summarizes the results. The OCI indicates possible cost savings of 174245€/year by implementing the cascade feedback control strategy. This value is equivalent to the yearly investment costs that can be supported and certainly warrants the investment costs for the nitrite and amonium measuring system (assumed to cost 2x25.000 Euro).CONCLUSIONSControl of the nitrite:ammonium ratio produced by the SHARON reactor is crucial to avoid toxic nitrite concentrations, that inhibit the Anammox conversion. The authors also want to stress the importance for research on the nitrite inhibition of the Anammox reaction.ACKNOWLEDGEMENTThe authors wish to thank J.W. Mulder of ZHEW, for the data of the full-scale SHARON reactor in Rotterdam, and the EU for their financial support through the IcoN project, no.EVK1-CT2000-054.REFERENCESDapena-Mora A., Van Hulle S.W.H., Campos J.L., Mendez R., Vanrolleghem P.A. & Jetten M.S.M.(2003). Enrichment of anammox biomass from municipal activated sludge: experimental and modelling results. Submitted to Water Research.Strous M., Heijnen J.J., Kuenen J.G. and Jetten M.S.M. (1998). The sequencing batch reactor as apowerful tool for the study of slowly growing anaerobic ammonium-oxidizing microorganisms.Appl. Microbiol. Biotechnol., 50, 589-596.Strous M., Kuenen J.G. and Jetten M.S.M. (1999). Key physiology of anaerobic ammonium oxidation.Appl. Environ. Microbiol., 65, 3248-50.van Dongen U., Jetten M.S.M. and van Loosdrecht M.C.M. (2001). The SHARON-Anammox processfor treatment of ammonium rich wastewater. Wat. Sci. Tech., 44(1), 153-160.Volcke, E.I.P., S. Gillot and Vanrolleghem P.A. (2002a). Multi-criteria evaluation of control strategiesfor wastewater treatment processes. Proceedings of the 15th triennial world congress of the international federation of automatic control (b'02), 21-26 July 2002, Barcelona, Spain.Volcke E.I.P., Hellinga C., Van Den Broeck S., van Loosdrecht M.C.M. and Vanrolleghem P.A.(2002b). Modelling the SHARON process in view of coupling with Anammox . Proceedings 1st IFAC TiASWiK Conference. Gdansk-Sobieszewo, Poland, June 19-21 2002, 65-72.。