A Max-Flow Min-Cut Algorithm for Linear Deterministic Relay Networks
基于改进RRT_算法的六自由度机械臂路径规划

文章编号:1671-7872(2024)02-0173-09基于改进RRT 算法的六自由度机械臂路径规划朱永浩 ,李 丹 ,龚 旭 ,金仁才(安徽工业大学 电气与信息工程学院, 安徽 马鞍山 243032)摘要:针对快速扩展随机树(RRT)算法路径代价大、采样过程慢的问题,提出1种改进的RRT 算法对六自由度机械臂进行路径规划。
结合RRT*和RRT-connect 算法的优点,应用目标采样的思想加强算法向目标点搜索的趋向性,引入贪婪思想提高算法效率,结合五次B 样条插值对路径进行平滑优化,缩短规划路径的时间及长度;利用Python 中的matplotlib 功能包统计RRT 与改进的RRT 算法规划所需时长、采样点数与路径长度,且在ROS 平台中利用动态规划库进行算法配置,验证改进算法的路径规划效果。
结果表明:相比传统RRT 算法,采用所提改进算法对六自由度机械臂进行路径规划,在平均路径长度上缩短了29.5%、在规划路径时间上缩短了8.5%,路径规划成功率提高至96.7%,验证了该算法在实际应用中的可行性。
关键词:六自由度机械臂;路径规划;RRT ;目标采样中图分类号:TP 241.3 文献标志码:A doi :10.12415/j.issn.1671−7872.23113Path Planning of 6-DOF Manipulator Based on Improved RRT AlgorithmZHU Yonghao, LI Dan, GONG Xu, JIN Rencai(School of Electrical & Information Engineering, Anhui University of Technology, Maanshan 243032, China)Abstract :An improved rapidly-expanding random tree (RRT) algorithm was proposed to plan the path of a six degree of freedom (DOF) robotic arm in response to the problem of high path cost and slow sampling process in the RRT algorithm. Combining the advantages of RRT * and RRT-connect algorithms, the target sampling was applied to enhance the tendency of the algorithm to search for target points, the greedy thinking was introduced to improve the efficiency of the algorithm, and the quintic B-spline interpolation was combined to optimize the path smoothness,shorten the path planning time and length. The matplotlib function pack in Python was used to calculate the time,number of sampling points, and path length required for RRT and improved algorithm planning, as well as the dynamic planning library for algorithm configuration on the ROS platform was used to verify the path planning effect of the improved algorithm. The results show that compared with the traditional RRT algorithm, the path planning of the six DOF robotic arm by the proposed improved algorithm shortens the average path length by 29.5%,the planning path time is shortened by 8.5%, and the success rate of path planning is increased to 96.7%,which verifies the feasibility of the algorithm in practice.Keywords :six degree of freedom robotic arm; path planning; RRT; target sampling随着机器人技术的发展,机械臂具有工作空间大、操作简便、灵活性和自由度高等优点[1],在焊缝焊接、制造加工、拆卸装配、喷漆和码垛等领域得到越来越广泛的应用[2−4]。
stoerwagner-mincut.[Stoer-Wagner,Prim,连通性,无向图,最小边割集]
![stoerwagner-mincut.[Stoer-Wagner,Prim,连通性,无向图,最小边割集]](https://img.taocdn.com/s3/m/072209d5360cba1aa811da51.png)
A Simple Min-Cut AlgorithmMECHTHILD STOERTeleverkets Forskningsinstitutt,Kjeller,NorwayANDFRANK WAGNERFreie Universita¨t Berlin,Berlin-Dahlem,GermanyAbstract.We present an algorithm for finding the minimum cut of an undirected edge-weighted graph.It is simple in every respect.It has a short and compact description,is easy to implement,and has a surprisingly simple proof of correctness.Its runtime matches that of the fastest algorithm known.The runtime analysis is straightforward.In contrast to nearly all approaches so far,the algorithm uses no flow techniques.Roughly speaking,the algorithm consists of about͉V͉nearly identical phases each of which is a maximum adjacency search.Categories and Subject Descriptors:G.L.2[Discrete Mathematics]:Graph Theory—graph algorithms General Terms:AlgorithmsAdditional Key Words and Phrases:Min-Cut1.IntroductionGraph connectivity is one of the classical subjects in graph theory,and has many practical applications,for example,in chip and circuit design,reliability of communication networks,transportation planning,and cluster analysis.Finding the minimum cut of an undirected edge-weighted graph is a fundamental algorithmical problem.Precisely,it consists in finding a nontrivial partition of the graphs vertex set V into two parts such that the cut weight,the sum of the weights of the edges connecting the two parts,is minimum.A preliminary version of this paper appeared in Proceedings of the2nd Annual European Symposium on Algorithms.Lecture Notes in Computer Science,vol.855,1994,pp.141–147.This work was supported by the ESPRIT BRA Project ALCOM II.Authors’addresses:M.Stoer,Televerkets Forskningsinstitutt,Postboks83,2007Kjeller,Norway; e-mail:mechthild.stoer@nta.no.;F.Wagner,Institut fu¨r Informatik,Fachbereich Mathematik und Informatik,Freie Universita¨t Berlin,Takustraße9,Berlin-Dahlem,Germany;e-mail:wagner@inf.fu-berlin.de.Permission to make digital/hard copy of part or all of this work for personal or classroom use is granted without fee provided that the copies are not made or distributed for profit or commercial advantage,the copyright notice,the title of the publication,and its date appear,and notice is given that copying is by permission of the Association for Computing Machinery(ACM),Inc.To copy otherwise,to republish,to post on servers,or to redistribute to lists,requires prior specific permission and/or a fee.᭧1997ACM0004-5411/97/0700-0585$03.50Journal of the ACM,Vol.44,No.4,July1997,pp.585–591.586M.STOER AND F.WAGNER The usual approach to solve this problem is to use its close relationship to the maximum flow problem.The famous Max-Flow-Min-Cut-Theorem by Ford and Fulkerson[1956]showed the duality of the maximum flow and the so-called minimum s-t-cut.There,s and t are two vertices that are the source and the sink in the flow problem and have to be separated by the cut,that is,they have to lie in different parts of the partition.Until recently all cut algorithms were essentially flow algorithms using this duality.Finding a minimum cut without specified vertices to be separated can be done by finding minimum s-t-cuts for a fixed vertex s and all͉V͉Ϫ1possible choices of tʦVگ{s}and then selecting the lightest one.Recently Hao and Orlin[1992]showed how to use the maximum flow algorithm by Goldberg and Tarjan[1988]in order to solve the minimum cut problem in timeᏻ(͉VʈE͉log(͉V͉2/͉E͉),which is nearly as fast as the fastest maximum flow algorithms so far[Alon1990;Ahuja et al.1989;Cheriyan et al. 1990].Nagamochi and Ibaraki[1992a]published the first deterministic minimum cut algorithm that is not based on a flow algorithm,has the slightly better running time ofᏻ(͉VʈE͉ϩ͉V͉2log͉V͉),but is still rather complicated.In the unweighted case,they use a fast-search technique to decompose a graph’s edge set E into subsets E1,...,Esuch that the union of the first k E i’s is a k-edge-connected spanning subgraph of the given graph and has at most k͉V͉edges.They simulate this approach in the weighted case.Their work is one of a small number of papers treating questions of graph connectivity by non-flow-based methods [Nishizeki and Poljak1989;Nagamochi and Ibaraki1992a;Matula1992].Karger and Stein[1993]suggest a randomized algorithm that with high probability finds a minimum cut in timeᏻ(͉V͉2log͉V͉).In this context,we present in this paper a remarkably simple deterministic minimum cut algorithm with the fastest running time so far,established in Nagamochi and Ibaraki[1992b].We reduce the complexity of the algorithm of Nagamochi and Ibaraki by avoiding the unnecessary simulated decomposition of the edge set.This enables us to give a comparably straightforward proof of correctness avoiding,for example,the distinction between the unweighted, integer-,rational-,and real-weighted case.This algorithm was found independently by Frank[1994].Queyranne[1995]generalizes our simple approach to the minimization of submodular functions.The algorithm described in this paper was implemented by Kurt Mehlhorn from the Max-Planck-Institut,Saarbru¨cken and is part of the algorithms library LEDA[Mehlhorn and Na¨her1995].2.The AlgorithmThroughout the paper,we deal with an ordinary undirected graph G with vertex set V and edge set E.Every edge e has nonnegative real weight w(e).The simple key observation is that,if we know how to find two vertices s and t, and the weight of a minimum s-t-cut,we are nearly done:T HEOREM2.1.Let s and t be two vertices of a graph G.Let G/{s,t}be the graph obtained by merging s and t.Then a minimum cut of G can be obtained by taking the smaller of a minimum s-t-cut of G and a minimum cut of G/{s,t}.The theorem holds since either there is a minimum cut of G that separates s and t ,then a minimum s -t -cut of G is a minimum cut of G ;or there is none,then a minimum cut of G /{s ,t }does the job.So a procedure finding an arbitrary minimum s -t -cut can be used to construct a recursive algorithm to find a minimum cut of a graph.The following algorithm,known in the literature as maximum adjacency search or maximum cardinality search ,yields the desired s -t -cut.M INIMUM C UT P HASE (G ,w ,a )A 4{a }while A Vadd to A the most tightly connected vertexstore the cut-of-the-phase and shrink G by merging the two vertices added lastA subset A of the graphs vertices grows starting with an arbitrary single vertex until A is equal to V .In each step,the vertex outside of A most tightly connected with A is added.Formally,we add a vertexz ʦ͞A such that w ͑A ,z ͒ϭmax ͕w ͑A ,y ͉͒y ʦ͞A ͖,where w (A ,y )is the sum of the weights of all the edges between A and y .At the end of each such phase,the two vertices added last are merged ,that is,the two vertices are replaced by a new vertex,and any edges from the two vertices to a remaining vertex are replaced by an edge weighted by the sum of the weights of the previous two edges.Edges joining the merged nodes are removed.The cut of V that separates the vertex added last from the rest of the graph is called the cut-of-the-phase .The lightest of these cuts-of-the-phase is the result of the algorithm,the desired minimum cut:M INIMUM C UT (G ,w ,a )while ͉V ͉Ͼ1M INIMUM C UT P HASE (G ,w ,a )if the cut-of-the-phase is lighter than the current minimum cutthen store the cut-of-the-phase as the current minimum cutNotice that the starting vertex a stays the same throughout the whole algorithm.It can be selected arbitrarily in each phase instead.3.CorrectnessIn order to proof the correctness of our algorithms,we need to show the following somewhat surprising lemma.L EMMA 3.1.Each cut -of -the -phase is a minimum s -t -cut in the current graph ,where s and t are the two vertices added last in the phase .P ROOF .The run of a M INIMUM C UT P HASE orders the vertices of the current graph linearly,starting with a and ending with s and t ,according to their order of addition to A .Now we look at an arbitrary s -t -cut C of the current graph and show,that it is at least as heavy as the cut-of-the-phase.587A Simple Min-Cut Algorithm588M.STOER AND F.WAGNER We call a vertex v a active(with respect to C)when v and the vertex added just before v are in the two different parts of C.Let w(C)be the weight of C,A v the set of all vertices added before v(excluding v),C v the cut of A vഫ{v} induced by C,and w(C v)the weight of the induced cut.We show that for every active vertex vw͑A v,v͒Յw͑C v͒by induction on the set of active vertices:For the first active vertex,the inequality is satisfied with equality.Let the inequality be true for all active vertices added up to the active vertex v,and let u be the next active vertex that is added.Then we havew͑A u,u͒ϭw͑A v,u͒ϩw͑A uگA v,u͒ϭ:␣Now,w(A v,u)Յw(A v,v)as v was chosen as the vertex most tightly connected with A v.By induction w(A v,v)Յw(C v).All edges between A uگA v and u connect the different parts of C.Thus they contribute to w(C u)but not to w(C v).So␣Յw͑C v͒ϩw͑A uگA v,u͒Յw͑C u͒As t is always an active vertex with respect to C we can conclude that w(A t,t)Յw(C t)which says exactly that the cut-of-the-phase is at most as heavy as C.4.Running TimeAs the running time of the algorithm M INIMUM C UT is essentially equal to the added running time of the͉V͉Ϫ1runs of M INIMUM C UT P HASE,which is called on graphs with decreasing number of vertices and edges,it suffices to show that a single M INIMUM C UT P HASE needs at mostᏻ(͉E͉ϩ͉V͉log͉V͉)time yielding an overall running time ofᏻ(͉VʈE͉ϩ͉V͉2log͉V͉).The key to implementing a phase efficiently is to make it easy to select the next vertex to be added to the set A,the most tightly connected vertex.During execution of a phase,all vertices that are not in A reside in a priority queue based on a key field.The key of a vertex v is the sum of the weights of the edges connecting it to the current A,that is,w(A,v).Whenever a vertex v is added to A we have to perform an update of the queue.v has to be deleted from the queue,and the key of every vertex w not in A,connected to v has to be increased by the weight of the edge v w,if it exists.As this is done exactly once for every edge,overall we have to perform͉V͉E XTRACT M AX and͉E͉I NCREASE K EY ing Fibonacci heaps[Fredman and Tarjun1987],we can perform an E XTRACT M AX operation inᏻ(log͉V͉)amortized time and an I NCREASE K EY operation inᏻ(1)amortized time.Thus,the time we need for this key step that dominates the rest of the phase, isᏻ(͉E͉ϩ͉V͉log͉V͉).5.AnExample F IG .1.A graph G ϭ(V ,E )withedge-weights.F IG .2.The graph after the first M INIMUM C UT P HASE (G ,w ,a ),a ϭ2,and the induced ordering a ,b ,c ,d ,e ,f ,s ,t of the vertices.The first cut-of-the-phase corresponds to the partition {1},{2,3,4,5,6,7,8}of V with weight w ϭ5.F IG .3.The graph after the second M INIMUM C UT P HASE (G ,w ,a ),and the induced ordering a ,b ,c ,d ,e ,s ,t of the vertices.The second cut-of-the-phase corresponds to the partition {8},{1,2,3,4,5,6,7}of V with weight w ϭ5.F IG .4.After the third M INIMUM C UT P HASE (G ,w ,a ).The third cut-of-the-phase corresponds to the partition {7,8},{1,2,3,4,5,6}of V with weight w ϭ7.589A Simple Min-Cut AlgorithmACKNOWLEDGMENT .The authors thank Dorothea Wagner for her helpful re-marks.REFERENCESA HUJA ,R.K.,O RLIN ,J.B.,AND T ARJAN ,R.E.1989.Improved time bounds for the maximum flow problem.SIAM put.18,939–954.A LON ,N.1990.Generating pseudo-random permutations and maximum flow algorithms.Inf.Proc.Lett.35,201–204.C HERIYAN ,J.,H AGERUP ,T.,AND M EHLHORN ,K.1990.Can a maximum flow be computed in o (nm )time?In Proceedings of the 17th International Colloquium on Automata,Languages and Programming .pp.235–248.F ORD ,L.R.,AND F ULKERSON ,D.R.1956.Maximal flow through a network.Can.J.Math.8,399–404.F RANK , A.1994.On the Edge-Connectivity Algorithm of Nagamochi and Ibaraki .Laboratoire Artemis,IMAG,Universite ´J.Fourier,Grenoble,Switzerland.F REDMAN ,M.L.,AND T ARJAN ,R.E.1987.Fibonacci heaps and their uses in improved network optimization algorithms.J.ACM 34,3(July),596–615.G OLDBERG ,A.V.,AND T ARJAN ,R.E.1988.A new approach to the maximum-flow problem.J.ACM 35,4(Oct.),921–940.H AO ,J.,AND O RLIN ,J.B.1992.A faster algorithm for finding the minimum cut in a graph.In Proceedings of the 3rd ACM-SIAM Symposium on Discrete Algorithms (Orlando,Fla.,Jan.27–29).ACM,New York,pp.165–174.K ARGER ,D.,AND S TEIN ,C.1993.An O˜(n 2)algorithm for minimum cuts.In Proceedings of the 25th ACM Symposium on the Theory of Computing (San Diego,Calif.,May 16–18).ACM,New York,pp.757–765.F IG .5.After the fourth and fifth M INIMUM C UT P HASE (G ,w ,a ),respectively.The fourth cut-of-the-phase corresponds to the partition {4,7,8},{1,2,3,5,6}.The fifth cut-of-the-phase corresponds to the partition {3,4,7,8},{1,2,5,6}with weight w ϭ4.F IG .6.After the sixth and seventh M INIMUM C UT P HASE (G ,w ,a ),respectively.The sixth cut-of-the-phase corresponds to the partition {1,5},{2,3,4,6,7,8}with weight w ϭ7.The last cut-of-the-phase corresponds to the partition {2},V گ{2};its weight is w ϭ9.The minimum cut of the graph G is the fifth cut-of-the-phase and the weight is w ϭ4.590M.STOER AND F.WAGNERM ATULA ,D.W.1993.A linear time 2ϩ⑀approximation algorithm for edge connectivity.In Proceedings of the 4th ACM–SIAM Symposium on Discrete Mathematics ACM,New York,pp.500–504.M EHLHORN ,K.,AND N ¨AHER ,S.1995.LEDA:a platform for combinatorial and geometric mun.ACM 38,96–102.N AGAMOCHI ,H.,AND I BARAKI ,T.1992a.Linear time algorithms for finding a sparse k -connected spanning subgraph of a k -connected graph.Algorithmica 7,583–596.N AGAMOCHI ,H.,AND I BARAKI ,puting edge-connectivity in multigraphs and capaci-tated graphs.SIAM J.Disc.Math.5,54–66.N ISHIZEKI ,T.,AND P OLJAK ,S.1989.Highly connected factors with a small number of edges.Preprint.Q UEYRANNE ,M.1995.A combinatorial algorithm for minimizing symmetric submodular functions.In Proceedings of the 6th ACM–SIAM Symposium on Discrete Mathematics ACM,New York,pp.98–101.RECEIVED APRIL 1995;REVISED FEBRUARY 1997;ACCEPTED JUNE 1997Journal of the ACM,Vol.44,No.4,July 1997.591A Simple Min-Cut Algorithm。
SLMC 数显流量开关集成型说明书 - PF2M7##系列

Instruction ManualPF2M7## seriesThe intended use of the digital flow switch is to monitor and display flow information.These safety instructions are intended to prevent hazardous situations and/or equipment damage. These instructions indicate the level of potential hazard with the labels of “Caution,” “Warning” or “Danger.”They are all important notes for safety and must be followed in addition to International Standards (ISO/IEC) *1), and other safety regulations. *1)ISO 4414: Pneumatic fluid power - General rules relating to systems. ISO 4413: Hydraulic fluid power - General rules relating to systems.IEC 60204-1: Safety of machinery - Electrical equipment of machines. (Part 1: General requirements)ISO 10218-1: Manipulating industrial robots -Safety. etc.∙ Refer to product catalogue, Operation Manual and Handling Precautions for SMC Products for additional information. ∙ Keep this manual in a safe place for future reference.∙ This product is class A equipment intended for use in an industrial environment. There may be potential difficulties in ensuring electromagnetic compatibility in other environments due to conducted or radiated disturbances.CautionCaution indicates a hazard with a low level of risk which, ifnot avoided, could result in minor or moderate injury.WarningWarning indicates a hazard with a medium level of riskwhich, if not avoided, could result in death or serious injury.DangerDanger indicates a hazard with a high level of risk which, ifnot avoided, will result in death or serious injury.Warning∙ Always ensure compliance with relevant safety laws and standards.∙ All work must be carried out in a safe manner by a qualified person in compliance with applicable national regulations.∙ Do not disassemble, modify (including changing the printed circuit board) or repair. An injury or failure can result.∙ Do not operate the product outside of the specifications. Fire, malfunction or damage to the product can result.∙ Do not operate in an atmosphere containing flammable, explosive or corrosive gas.Fire or an explosion can result.∙ Do not use the product for flammable fluids. Fire, explosion, damage or corrosion can result. ∙ If using the product in an interlocking circuit:Provide a double interlocking system, for example a mechanical system.∙ Check the product for correct operation.Otherwise malfunction can result, causing an accident.∙ Do not use the product in a place where static electricity is a problem.Product failure or system malfunction may result.Otherwise electric shock, malfunction or product damage can result. ∙ Refer to the operation manual on the SMC website (URL: https:// ) for more safety instructions.2 SpecificationsWarningSpecial products (-X) might have specifications different from those shown in this section. Contact SMC for specific drawings.3.1 PF2M7## (with flow adjustment valve)ItemDescriptionSocket Socket for electrical connections.Piping port Connected to the fluid inlet IN side and to the fluid outlet OUT side.Flow adjustment valve Orifice mechanism to adjust the flow. Lock ring Used to lock the flow adjustment valve.Mounting hole Used to mount the product on a DIN rail or directly to a panel.BodyThe body of the product.Lead wire and connector Lead wire to supply power and output signals.3.2 DisplayItem DescriptionUP buttonSelects the mode or increases the ON/OFF set value. Press this button to change to the peak display mode.DOWN button Selects the mode or decreases the ON/OFF set value.Press this button to change to the bottom displaymode.Main displayDisplays the flow value, setting mode, and error indication.Four display modes can be selected: display always in red or green, or display changing from green to red, or red to green, according to the output status (OUT1). SET button Press this button to change to another mode and to set a value.Output display (Operation LED) Displays the output status of OUT1 and OUT2. OUT1: LED is ON (Orange) when the output is ON. OUT2: LED is ON (Orange) when the output is ON. When the accumulated pulse output mode is selected, the output display is OFF.Units display Arbitrary units are ON based on the flow display setting (instantaneous or accumulated flow)IO-Link status indicator light LED is ON when OUT1 is used in IO-Link mode. (LED is OFF in SIO mode)ORIGINAL INSTRUCTIONSModel 701 702 705 710 725 750 711 721 F l u i dApplicable fluidDry air, N 2, Ar, CO 2(ISO8573-1 1.1.2 to 1.6.2)Fluid temperature range 0 to 50 o CF l o w r a t e Detection method Thermal(main flow) Thermal (branch flow) R a t e d f l o w r a n g e [L /m i n ] Dry air,N 2,Ar 0.01 to 1 0.02 to 2 0.05 to 5 0.1 to 10 0.3 to 25 0.5 to 50 1 to 100 2 to200CO 20.01 to 0.5 0.02 to 1 0.05 to 2.5 0.1 to 5 0.3 to 12.5 0.5 to 25 1 to 50 2 to100S e t f l o w r a n g e Instantaneous flow [L/min]-0.05 to 1.05 -0.1 to 2.1 -0.25 to 5.25 -0.5 to 10.5 -1.3 to 26.3 -2.5 to 52.5 -5 to 105 -10 to 210Accumulated flow [L] 0.00 to 9999999.99 0.0 to 99999999.9 0 to 999999999 M i n . s e t t i n g u n i t Instantaneous flow [L/min] 0.001 0.01 0.1 1Accumulatedflow [L]0.01 0.1 1 Accumulatedvolume [L/pulse]0.01 0.1 1 Accumulated value hold Select from 2 and 5 minutesP r e s s u r eOperating pressure range-0.1 to 0.75 MPa Rated pressurerange-0.07 to 0.75 MPaProof pressure 1.0 MPa Pressure loss Refer to the pressure loss graph. Pressure characteristics ±5%F.S. ±1 digit (0.35 MPa standard)E l e c t r i c a l P o w e r s u p p l y v o l t a g e Switch output device 12 to 24 VDC ±10% IO-Link device18 to 30 VDC ±10% Currentconsumption 35 mA or less ProtectionPolarity protection A c c u r a c yDisplay accuracy ±3% F.S. ±1 digitAnalogue output accuracy ±3% F.S.Repeatability ±1%F.S. ±1 digit(±2% F.S. ±1 digit when digital filter is set to 0.05 s) Temperature characteristics ±3%F.S. ±1 digit (15 to 35 oC: 25 oC standard) ±5%F.S. ±1 digit (0 to 50 o C: 25 o C standard) S w i t c h o u t p u tOutput type NPN or PNP open collectorOutput mode Select from hysteresis mode, window comparator mode, accumulated output mode, accumulated pulse output mode, error outputand switch output OFFSwitch operation Select from normal output and reversed outputMaximum load current80 mA Maximum applied voltage 28 VDC (NPN only)I n t e r n a l v o l t a g e d r o pStandard valueNPN: 1 V or less (Load current 80 mA) PNP: 1.5 V or less (Load current 80 mA) IO-Link compatible product 1.5 V or less (Load current 80 mA) Response time 50 ms or lessDelay time 0 to 0.10 s (0.01 s increment), 0.1 to 1.0 s (0.1 s increment), 1 to 10 s (1 s increment)Select from 20 s, 30 s, 40 s, 50 s, 60 sHysteresis VariableProtectionShort circuit protectionModel 701 702 705 710 725 750 711 721 A n a l o g u e o u t p u tOutput type Voltage output: 1 to 5 V (or 0 to 10 V),Current output 4 to 20 mAI m p e d a n c e Voltage outputOutput impedance approx.1 kΩ CurrentoutputMax. load impedance Power supply voltage 24 V: 600 Ω Power supply voltage 12 V: 300 Ω Response time 50 ms ±40% D i s p l a yReference conditionSelect from normal condition (NOR) andstandard condition (STD) Display mode Select from instantaneous flow andaccumulated flow U n i t InstantaneousflowL/min, cfm Accumulated flowL, ft 3 D i s p l a y a b l e r a n g e Instantaneous flow [L/min]-0.05 to 1.05 -0.1 to 2.1 -0.25 to 5.25 -0.5 to 10.5 -1.3 to 26.3 -2.5 to 52.5 -5 to 105 -10 to 210 Zero cut-off range 0 to ±10%F.S. (selected for every 1%F.S. of max. rated flow rate) Accumulated flow [L] 0.00 to 9999999.99 0.0 to99999999.9 0 to 999999999Display Display type: LCD, Display colour: Red, green,Display digit: 7-segment, 4 digits Operation LED LED is ON when switch output is ON,OUT1/OUT2: Orange Digital filterSelect from 0.05 s, 0.1 s, 0.5 s, 1 s, 2 s and 5 s E n v i r o n m e n t a l r e s i s t a n c eEnclosure IP40 Withstand voltage 1000 VAC, 1 min. between terminals andhousing Insulation resistance 50 MΩ or longer (with 500 VDC) between terminals and housing Operatingtemperature rangeOperation: 0 to 50 o C, Storage: -10 to 60 o C(no freezing or condensation)Operating humidity range Operation, Storage: 35 to 85%R.H. (no freezing or condensation) P i p i n gP i p i n g s p e c i f i c a t i o n One-touch fitting C4 (ϕ4) / C6 (ϕ6)C6 (ϕ6) / N7 (ϕ1/4”) C8 (ϕ8) / N7 (ϕ1/4”)Screw fitting (Rc/NPT/G) 01 (Rc1/8) N1 (NPT1/8) F1 (G1/8)02 (Rc1/4) N2 (NPT1/4) F2 (G1/4)Port direction Straight, RearMaterial fluid contact parts PPS, PBT, FKM, SUS304, brass (electrolessnickel plating), Si, Au, GE4FW e i g h tB o d y One-touch fitting Straight: 40 g Rear: 55 g 48 g 63 g Screw fittingStraight: 60 g Rear: 75 g 72 g 87 gFlow adjustment valve -+34 g Lead wire +35 g Bracket +20 g Panel mount adapter +15 g DIN rail mounting bracket +65 gThe product code is displayed for approximately 3 seconds afterpower is supplied.Then measurement mode will be displayed and the switchoperation will start.4.1 InstallationWarning∙Do not install the product unless the safety instructions have been readand understood.∙Use the product within the specified operating pressure andtemperature range.∙Proof pressure could vary according to the fluid temperature. Checkthe characteristics data for operating pressure and proof pressure.4.2 EnvironmentWarning∙Do not use in an environment where corrosive gases, chemicals, saltwater or steam are present.∙Do not use in an explosive atmosphere.∙Do not expose to direct sunlight. Use a suitable protective cover.∙Do not install in a location subject to vibration or impact in excess ofthe product’s specifications.∙Do not mount in a location exposed to radiant heat that would result intemperatures in excess of the product’s specifications.∙Refer to the flow direction of the fluid indicated on the product forinstallation and piping.∙Do not mount the body with the bottom facing upwards.Retention of air can cause inability to measure accurately.∙Do not insert metal wires or other foreign matter into the piping port.This can damage the sensor causing failure or malfunction.∙Never mount a product in a location that will be used as a foothold.The product may be damaged if excessive force is applied by steppingor climbing onto it.∙If there is a risk of foreign matter entering the fluid, install and pipe afilter or mist separator at the inlet to avoid failure and malfunction.Otherwise damage or malfunction can result.4.3 Panel mounting∙Insert panel mount adapter B (supplied as an accessory) into sectionA of the panel mount adapter.Push panel mount adapter B from behind until the display is fixed ontothe panel.The bracket pin engages the notched part of panel adapter section Cto fix the display.∙The switch can be mounted on a panel with a thickness of 1 to 3.2 mm.4.4 Bracket mounting∙Mount the bracket using the mounting screws supplied.∙The required tightening torque is 0.42 ±0.04 N•m.∙Install the product (with bracket) using the M3 screws (4 pcs.).∙Bracket thickness is approximately 1.2 mm.4.5 DIN rail mounting (using ZS-33-R#)∙Mount the DIN rail mounting parts using the mounting screws and jointscrews supplied.∙The required tightening torque of the DIN rail mounting screws and∙Refer to the operation manual on the SMC website(URL: https://) for all mounting dimensions.4.6 PipingCaution∙Before connecting piping make sure to clean up chips, cutting oil, dust etc.∙Ensure there is no leakage after piping.∙Any dust left in the piping should be flushed out by air blow beforeconnecting piping to the product.Otherwise damage or malfunction can result.∙For piping of the product, hold the piping with a wrench on the metalpart of the product.Holding other parts of the product with a wrench may damage the product.4.7 WiringCaution∙Do not perform wiring while the power is on.∙Confirm proper insulation of wiring.∙Do not route wires and cables together with power or high voltage cables.Otherwise the product can malfunction due to interference of noise andsurge voltage from power and high voltage cables to the signal line.∙Keep wiring as short as possible to prevent interference fromelectromagnetic noise and surge voltage. Do not use a cable longerthan 30 m. When using it as an IO-Link device, do not use a cablelonger than 20 m.∙Ensure that the FG terminal is connected to ground when using acommercially available switch-mode power supply.∙When the analogue output is used, install a noise filter (line noise filter,ferrite element, etc.) between the switch-mode power supply and thisproduct.Connecting / Disconnecting∙When mounting the connector, insert it straight into the socket, holdingthe lever and connector body, and push the connector until the leverhooks into the housing, and locks.∙When removing the connector, press down the lever to release thehook from the housing and pull the connector straight out.Connector pin numbers (on the lead wire)•Lead wire and connector (ZS-33-D)No. Signal name Lead wire colour1 DC(+) Brown2 OUT2 White3 OUT1 Black4 DC(-) Blue•M12 conversion lead wire (ZS-33-DM)Used as switch output deviceNo. Signal name Lead wire colour1 DC(+) Brown2 N.C./OUT2 White3 DC(-) Blue4 OUT1 BlackUsed as IO-Link deviceNo. Signal name Lead wire colour1 L+Brown2 N.C./OUT2 White3 L-Blue4 C/Q BlackPower is supplied*: The outputs will continue to operate during setting.*: Simple setting mode and function selection mode settings arereflected each other.6 Flow Setting6.1 Switch operationWhen the flow exceeds the set value, the switch will be turned ON.When the flow falls below the set value by the amount of hysteresis ormore, the switch will be turned OFF.The default setting is to turn on the flow switch when the flow reaches thecentre of the upper limit of the rated flow range.If the operation shown below is acceptable, keep this setting.*: For hysteresis refer to [F 1] Setting of OUT1 and [F 2] Setting of OUT2.Without flow adjustmentvalve (using ZS-33-M)With flow adjustment valve(using ZS-33-MS)Press the SETbutton for 5seconds or longerPress the SETbutton between2 to 5 secondsPress the SETbutton onceFlow Setting andHysteresis(Simple settingmode)Function Setting(Functionselection mode)Other Settings∙Snap shot∙Key-lock∙Zero clear[Simple setting mode (Hysteresis mode)]In the Simple setting mode, the set value and hysteresis can be changed. (1) Press the SET button once in measurement mode.[P_1] or [n_1] and the [current set value] are displayed alternately.(2) Change the set value using the UP or DOWN button and press theSET button to set the value. Then, the setting moves to hysteresis setting (The snap shot function can be used). ∙ Press the UP button continuously to keep increasing the set value.∙ Press the DOWN button continuously to keep decreasing the set value.(3) [H_1] and the current set value are displayed in turn.(4) Change the hysteresis by pressing the UP or DOWN button and press the SET button. Setting is completed and the product returns to measurement mode (The snap shot function can be used).* For models with switch outputs for both OUT1 and OUT2, [P_2] or [n_2] will be displayed. These are set simultaneously.* After enabling the setting by pressing the SET button, it is possible to return to measurement mode by pressing the SET button for 2 seconds or longer.* When hysteresis mode is not used, "Input set value” is displayed. * The set value and hysteresis settings limit each other.* For more detailed setting, set each function in function selection mode.8.1 Function selection modeIn measurement mode, press the SET button for 2 to 5 seconds to display [F 0] on the display.Select to display the function to be change [F ].Press the SET button for 2 seconds or longer in function selection mode to return to measurement mode. *: Some products do not have all the functions. If a function is not available or selected due to configuration of other functions, [- - -] is displayed.8.2 Default settings*: Setting is only possible for models with the units selection function. *: Only available for models with switch outputs for both OUT1 and OUT2.*: This function is available for models with analogue output. Analogue free span function can be selected.*: This function is available in IO-Link compatible products. *: This function is available for models with external input.9 Other Settings∙ Snap shot function∙ Peak/bottom value indication ∙ Reset∙ Key-lock function ∙Zero clear functionRefer to the operation manual on the SMC website(URL: https:// ) for setting these functions.10.1 General MaintenanceCaution∙ Not following proper maintenance procedures could cause the product to malfunction and lead to equipment damage.∙ If handled improperly, compressed air can be dangerous.∙ Maintenance of pneumatic systems should be performed only by qualified personnel.∙ Before performing maintenance, turn off the power supply and be sure to cut off the supply pressure. Confirm that the air is released to atmosphere.∙ After installation and maintenance, apply operating pressure and power to the equipment and perform appropriate functional and leakage tests to make sure the equipment is installed correctly.∙ If any electrical connections are disturbed during maintenance, ensure they are reconnected correctly and safety checks are carried out as required to ensure continued compliance with applicable national regulations.∙ Do not make any modification to the product.∙ Do not disassemble the product, unless required by installation or maintenance instructions.∙ How to reset the product after a power cut or when the power has been unexpectedly removedThe settings of the product are retained from before the power cut or de-energizing.The output condition also recovers to that before the power cut or de-energizing, but may change depending on the operating environment. Therefore, check the safety of the whole system before operating the product.11 How to OrderRefer to drawings/catalogue on the SMC website (URL: https:// ) for ‘How to Order’ information.12 Outline Dimensions (mm)Refer to the operation manual on the SMC website(URL: https:// ) for outline dimensions.ItemDefault setting[F 0] [FLU] [FLU] Select the flow rate[Air] Dry air, N 2[rEF] Setting the unitscriteria [Std] Standard condition [Unit] Measurement unitsetting [ L] L/min (L) [norP] Switch output PNP/NPN setting [PnP] PNP output [i_o] SW / external input setting[oUt] SW output [F 1] [oUt1][oUt1] Setting of OUT1[HYS] Hysteresis mode[1ot] OUT1 outputconfiguration setting [1_P] Normal output[P_1] Set value [ ] 50% of maximum rated flow PF2M701: 0.5 L/min, PF2M702: 1.0 L/minPF2M705: 2.5 L/min, PF2M710: 5 L/minPF2M725: 12.5 L/min, PF2M750: 25 L/minPF2M711: 50 L/min PF2M721: 100 L/min[H_1] Hysteresis [ ] 5% of maximum rated flow PF2M701: 0.05 L/min,PF2M702: 0.1 L/minPF2M705: 0.25 L/min,PF2M710: 0.5 L/min PF2M725: 1.3 L/min, PF2M750: 2.5 L/minPF2M711: 5 L/min PF2M721: 10 L/min[dt1] Delay time setting [0.00] 0.00 s [CoL] Display colour setting [1SoG] ON: Green OFF: Red[F 2][oUt2][oUt2] Setting of OUT2[HYS] Hysteresis mode[2ot] OUT2 outputconfiguration setting [2_P] Normal output[P_2] Set value [ ] 50% of maximum rated flow PF2M701: 0.5 L/min,PF2M702: 1.0 L/min PF2M705: 2.5 L/min,PF2M710: 5 L/min PF2M725: 12.5 L/min,PF2M750: 25 L/minPF2M711: 50 L/minPF2M721: 100 L/min [H_2] Hysteresis [ ] 5% of maximum rated flow PF2M701: 0.05 L/min,PF2M702: 0.1 L/min PF2M705: 0.25 L/min,PF2M710: 0.5 L/min PF2M725: 1.3 L/min,PF2M750: 2.5 L/minPF2M711: 5 L/minPF2M721: 10 L/min [dt2] Delay time setting [0.00] 0.00 s [CoL] Display colour setting[1SoG] ON: Green OFF: Red[F 3] [FiL] [FiL] Digital filter setting [1.0] 1.0 s [F 4] [PrS] [PrS] Auto-preset function setting [oFF] Manual Item Default setting[F10] [FLo] [FLo] Display mode [inS] Instantaneous flow [F11] [drE] [drE] Display resolutionsetting [1000] 1000-split [F13] [rEv] [rEv] Reverse display[oFF] Not reverse[F14] [CUt] [CUt] Zero cut-off setting[1.0] 1% of maximum rated flow PF2M701: 0.01 L/min, PF2M702: 0.02 L/min PF2M705: 0.05 L/min, PF2M710: 0.1 L/min PF2M725: 0.3 L/min, PF2M750: 0.5 L/min PF2M711: 1 L/min PF2M721: 2 L/min[F20] [inP] [inP] External input setting [rAC] Accumulated value reset[F22] [AoUt] [AoUt] Analogue output setting [1-5] 1 to 5 V Voltage output(when voltage is output) [---] Analogue output is notselectable(for current type output)[F30] [SAvE] [SAvE] Accumulated flowvalue hold setting[oFF] Not held [F80] [diSP] [diSP] Display OFF modesetting[ on] Normal display [F81][Pin] [Pin] Security code [oFF] Unused[F90] [ALL][ALL] Setting of allfunctions[oFF] Unused[F96] [S_in][S_in] External input signalcheck No setting due to input signal setting[F98][tESt] [tESt] Output checking[ n] Normal output [F99] [ini][ini] Reset to the defaultsettings[oFF] Not recover13.1 Error indicationIf the error cannot be reset after the above measures are taken, or errors other than above are displayed, please contact SMC.Refer to the operation manual on the SMC website (URL: https://) for more detailed information about troubleshooting. 14.1 Limited warranty and Disclaimer/Compliance RequirementsRefer to Handling Precautions for SMC Products.15 Product disposalThis product should not be disposed of as municipal waste. Check yourlocal regulations and guidelines to dispose this product correctly, in orderto reduce the impact on human health and the environment.16 ContactsRefer to or www.smc.eu for contacts.URL: https:// (Global) https://www.smc.eu (Europe)SMC Corporation, 4-14-1, Sotokanda, Chiyoda-ku, Tokyo 101-0021, JapanSpecifications are subject to change without prior notice from the manufacturer.© 2021SMC Corporation All Rights Reserved.Template DKP50047-F-085M。
max-flow min-cut定理

max-flow min-cut定理用特定的网络流算法将任意的有向图G转化成一个网络流图,然后对其进行计算,就有可能得到网络流的最大流量和最小割集。
当最大流量和最小割集相等的时候,就称这个最小割集为最大流量。
Max-Flow Min-Cut定理在计算网络流时经常使用。
其实,Max-Flow Min-Cut定理也就是将图中的所有路径都用边替代,转化为一个网络流问题。
在这个流问题中,求解的是一个最大流量。
与此同时,我们还可以将一个网络流问题转化为一个割问题,求出一个最小割。
最大流量就等于最小割。
该定理使得我们可以将一个复杂的最大流量问题转化为一个简单的最小割问题。
因此,该定理是网络流问题中最重要的结论之一。
Max-Flow和Min-Cut的概念Max-Flow (最大流量):在一个有向图里,从源节点s到汇节点t的最大流量。
Min-Cut (最小割): 在一个有向图里,通过几条边,将源节点s和汇节点t分开的最小边的数量之和。
对于任何一个有向图,其最大流量的值等于其最小割的值。
这是一个非常重要的定理,因为它将求解网络流的难度降低了。
证明该定理的证明从两个方向进行:方向1: Max-Flow <= Min-Cut由于一个最小割是一组将源节点s和汇节点t分开的最少的边的数量,因此,在网络中所有的流量从源节点s到汇节点t的路径中,最小的一条路径的流量就是最小割的值。
这样一来,我们就证明了Max-Flow <= Min-Cut。
方向2: Max-Flow >= Min-Cut在一个有向图里,我们可以使用一个带权有向边将源节点s和汇节点t相连。
因此,我们可以考虑在这个图中最大流量和最小割集的关系。
我们首先定义S为节点的集合,它包含源节点s。
我们定义T为节点的集合,它包含汇节点t,那么就可以表示:(1) S = { s }接着,我们可以将每条边的流量设为以下任意两个节点之间的最大容量。
(4) E(i,j) = c(i,j)这样一来,我们就可以得到一个最小割集的表示式:其中i∈S,j∈T的边的容量和。
A Tutorial on Spectral Clustering
Ulrike von Luxburg Max Planck Institute for Biological Cybernetics Spemannstr. 38, 72076 T¨ ubingen, Germany ulrike.luxburg@tuebingen.mpg.de
2
Similarity graphs
Given a set of data points x1 , . . . xn and some notion of similarity sij ≥ 0 between all pairs of data points xi and xj , the intuitive goal of clustering is to divide the data points into several groups such that points in the same group are similar and points in different groups are dissimilar to each other. If we do not have more information than similarities between data points, a nice way of representing the data is in form of the similarity graph G = (V, E ). Each vertex vi in this graph represents a data point xi . Two vertices are connected if the similarity sij between the corresponding data points xi and xj is positive or larger than a certain threshold, and the edge is weighted by sij . The problem of clustering can now be reformulated using the similarity graph: we want to find a partition of the graph such that the edges between different groups have very low weights (which means that points in different clusters are dissimilar from each other) and the edges within a group have high weights (which means that points within the same cluster are similar to each other). To be able to formalize this intuition we first want to introduce some basic graph notation and briefly discuss the kind of graphs we are going to study.
气泡混合轻质土使用规程

目次1总则 (3)2术语和符号 (4)2.1 术语 (4)2.2 符号 (5)3材料及性能 (6)3.1 原材料 (6)3.2 性能 (6)4设计 (8)4.1 一般规定 (8)4.2 性能设计 (8)4.3 结构设计 (9)4.4 附属工程设计 (10)4.5 设计计算 (10)5配合比 (13)5.1 一般规定 (13)5.2 配合比计算 (13)5.3 配合比试配 (14)5.4 配合比调整 (14)6工程施工 (15)6.1 浇筑准备 (15)6.2 浇筑 (15)6.3 附属工程施工 (15)6.4 养护 (16)7质量检验与验收 (17)7.1 一般规定 (17)7.2 质量检验 (17)7.3 质量验收 (18)附录A 发泡剂性能试验 (20)附录B 湿容重试验 (22)附录C 适应性试验 (22)附录D 流动度试验 (24)附录E 干容重、饱水容重试验 (25)附录F 抗压强度、饱水抗压强度试验 (27)附录G 工程质量检验验收用表 (28)本规程用词说明 (35)引用标准名录 (36)条文说明 (37)Contents1.General provisions (3)2.Terms and symbols (4)2.1 Terms (4)2.2 Symbols (5)3. Materials and properties (6)3.1 Materials (6)3.2 properties (6)4. Design (8)4.1 General provisions (8)4.2 Performance design (8)4.3 Structure design (9)4.4 Subsidiary engineering design (9)4.5 Design calculation (10)5. Mix proportion (13)5.1 General provisions (13)5.2 Mix proportion calculation (13)5.3 Mix proportion trial mix (14)5.4 Mix proportion adjustment (14)6. Engineering construction (15)6.1 Construction preparation (15)6.2 Pouring .............................................................. .. (15)6.3 Subsidiary engineering construction (16)6.4 Maintenance (17)7 Quality inspection and acceptance (18)7.1 General provisions (18)7.2 Quality evaluate (18)7.3 Quality acceptance (19)Appendix A Test of foaming agent performance (20)Appendix B Wet density test (22)Appendix C Adaptability test (23)Appendix D Flow value test.................................................................................. .. (24)Appendix E Air-dry density and saturated density test (25)Appendix F Compressive strength and saturated compressive strength test (27)Appendix G Table of evaluate and acceptance for quality (28)Explanation of Wording in this code (35)Normative standard (36)Descriptive provision (37)1总则1.0.1为规范气泡混合轻质土的设计、施工,统一质量检验标准,保证气泡混合轻质土填筑工程安全适用、技术先进、经济合理,制订本规程。
03算法最大流问题maxflow

Cut capacity = 30
2 9
Flow value 30
5
10
4
15
15
10
s A
5
3
8
6
10
t
15
4
6
15
10
4
30
7
Capacity = 30
15
Flows and Cuts
Weak duality. Let f be any flow. Then, for any s-t cut (A, B) we have v(f) cap(A, B). Pf.
Value of flow = 28 Cut capacity = 28
9 2 10 10 4 s 5 3 4 0 9 1 15 8 8 4 6 5 9
Flow value 28
15
0
10 9 10 10 10 t
A
15 14
4 0
6 14
15 0
4
30
7
17
Towards a Max Flow Algorithm
15 11
4 0
6 11
15 0
4
30
7
Value = 24
9
Maximum Flow Problem
Max flow problem. Find s-t flow of maximum value.
Minimax极大极小算法、Alpha-BetaPruning剪枝算法
Minimax极⼤极⼩算法、Alpha-BetaPruning剪枝算法这篇博客分为两部分。
⾸先我会先讲极⼤极⼩算法,然后在此基础上进⾏改进给出进阶版的Alpha-Beta剪枝算法以及代码实现。
⽂中配备b站讲解的视频,感兴趣的可以看⼀下视频讲解,然后复习的时候拿着⽂章当作参考。
Minimax算法(极⼤极⼩算法)概念是⼀种找出最⼩失败的可能的算法。
意思就是两个⼈下棋,A和B下棋,A想要⾃⼰的利益最⼤化(失败的可能性最⼩),B想要A的利益最⼩化(B想要A输)。
这个算法以及接下来的Alpha-Beta剪枝都是⼀种对抗性搜索算法(两个⼈互相对抗着下棋,俩⼈都想赢),是⼀种⼈⼯智能搜索的算法。
掌握此算法后可以⽤来写井字棋、五⼦棋等⼈⼯智能⼈机对抗下棋程序。
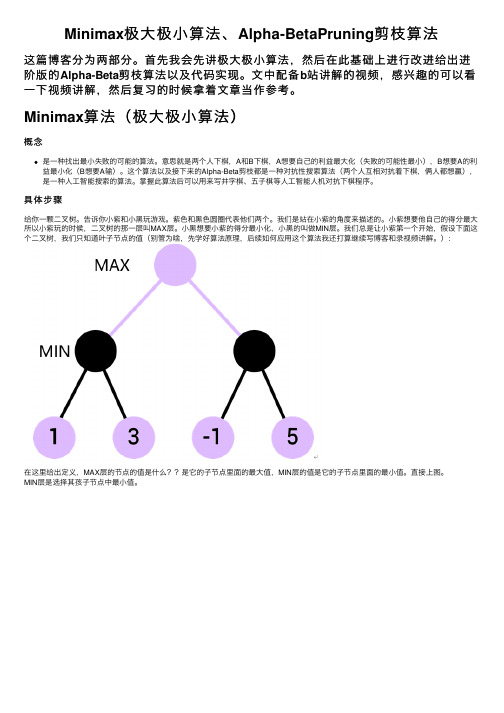
具体步骤给你⼀颗⼆叉树。
告诉你⼩紫和⼩⿊玩游戏。
紫⾊和⿊⾊圆圈代表他们两个。
我们是站在⼩紫的⾓度来描述的。
⼩紫想要他⾃⼰的得分最⼤所以⼩紫玩的时候,⼆叉树的那⼀层叫MAX层。
⼩⿊想要⼩紫的得分最⼩化,⼩⿊的叫做MIN层。
我们总是让⼩紫第⼀个开始,假设下⾯这个⼆叉树,我们只知道叶⼦节点的值(别管为啥,先学好算法原理,后续如何应⽤这个算法我还打算继续写博客和录视频讲解。
):在这⾥给出定义,MAX层的节点的值是什么??是它的⼦节点⾥⾯的最⼤值,MIN层的值是它的⼦节点⾥⾯的最⼩值。
直接上图。
MIN层是选择其孩⼦节点中最⼩值。
MAX层选择其孩⼦节点中的最⼤值。
算法概念就是这个样⼦。
算法的输⼊是构造的这⼀棵满⼆叉树,输出是最上层MAX节点的值。
代码实现class Node{ //结点类public:const int value;Node *left;Node *right;Node(int v,Node* l,Node* r):value(v),left(l),right(r) {};};为了遍历这棵树,⾸先我们得创建出来这棵树对吧?但是你的代码⾥没有创建⼆叉树这⼀部分啊。
纹理物体缺陷的视觉检测算法研究--优秀毕业论文

摘 要
在竞争激烈的工业自动化生产过程中,机器视觉对产品质量的把关起着举足 轻重的作用,机器视觉在缺陷检测技术方面的应用也逐渐普遍起来。与常规的检 测技术相比,自动化的视觉检测系统更加经济、快捷、高效与 安全。纹理物体在 工业生产中广泛存在,像用于半导体装配和封装底板和发光二极管,现代 化电子 系统中的印制电路板,以及纺织行业中的布匹和织物等都可认为是含有纹理特征 的物体。本论文主要致力于纹理物体的缺陷检测技术研究,为纹理物体的自动化 检测提供高效而可靠的检测算法。 纹理是描述图像内容的重要特征,纹理分析也已经被成功的应用与纹理分割 和纹理分类当中。本研究提出了一种基于纹理分析技术和参考比较方式的缺陷检 测算法。这种算法能容忍物体变形引起的图像配准误差,对纹理的影响也具有鲁 棒性。本算法旨在为检测出的缺陷区域提供丰富而重要的物理意义,如缺陷区域 的大小、形状、亮度对比度及空间分布等。同时,在参考图像可行的情况下,本 算法可用于同质纹理物体和非同质纹理物体的检测,对非纹理物体 的检测也可取 得不错的效果。 在整个检测过程中,我们采用了可调控金字塔的纹理分析和重构技术。与传 统的小波纹理分析技术不同,我们在小波域中加入处理物体变形和纹理影响的容 忍度控制算法,来实现容忍物体变形和对纹理影响鲁棒的目的。最后可调控金字 塔的重构保证了缺陷区域物理意义恢复的准确性。实验阶段,我们检测了一系列 具有实际应用价值的图像。实验结果表明 本文提出的纹理物体缺陷检测算法具有 高效性和易于实现性。 关键字: 缺陷检测;纹理;物体变形;可调控金字塔;重构
Keywords: defect detection, texture, object distortion, steerable pyramid, reconstruction
II
国家集训队2007论文集7.胡伯涛《最小割模型

[Key Words]
Network Flow, Maximum Flow, Minimum Cut, Maximum Weight Closure of a Graph, Finding
a Maximum Density Sub Graph, Minimum Weight Vertex Covering Set and Maximum Weight
第 2 页 共 45 页
[][Library]Thesis
最小割模型在信息学竞赛中的应用
Amber
3.1. 引入 Introduction...........................................................................................................16 3.2. 构造 Construction of Algorithm ....................................................................................17 3.3. 证明 Proof......................................................................................................................17 3.4. 应用 Application............................................................................................................19
knowledge of minimum cut model. The thesis sets focus on researching that is in four aspects: 1. the application based on the
优化建模与LINGO第07章1

7.2
最短路问题和最大流问题 本节内容导航
7.2.1 7.2.2 7.2.3
本节概述 最短路问题 最大流问题 最小费与最大流问题
优化建模
本节内容概述
返 回 导 航
最短路问题(Shortest Path Problems)和最大流 最短路问题 和最大流 问题(Maxiumum Flow Problems)是图论另一类与优 问题 是图论另一类与优 化有关的问题,对于这两在问题,实际上, 化有关的问题,对于这两在问题,实际上,图论中已 有解决的方法,如最短路问题的求解方法有Dijkstra 有解决的方法,如最短路问题的求解方法有 算法,最大流问题的求解方法有标号算法.这里主要 算法,最大流问题的求解方法有标号算法 这里主要 讨论的是如何用LINGO软件来求解最短路和最大流 讨论的是如何用 软件来求解最短路和最大流 问题,对于LINDO软件的求解方法,作者可以根据 软件的求解方法, 问题,对于 软件的求解方法 模型自己设计相应的程序,作为LINDO软件的训练 模型自己设计相应的程序,作为 软件的训练 和问题的练习. 和问题的练习
即最短路是 A →
B1 → C 1 → D
, 最短路长为 个单位 最短路长为6个单位 个单位.
优化建模
例7.9 (设备更新问题 张先生打算购买一辆 设备更新问题) 设备更新问题 新轿车,轿车的售价是12万元人民币 轿车购买后, 万元人民币.轿车购买后 新轿车,轿车的售价是 万元人民币 轿车购买后, 每年的各种保险费养护费等费用由表7-5所示 所示.如果 每年的各种保险费养护费等费用由表 所示 如果 年之内, 在5年之内,张先生将轿车售出,并再购买新年 年之内 张先生将轿车售出,并再购买新年.5 年之内的二手车销售价由表7-6所示 所示.请你帮助张先 年之内的二手车销售价由表 所示 请你帮助张先 生设计一种购买轿车的方案,使5年内用车的总费 生设计一种购买轿车的方案, 年内用车的总费 用最少. 用最少
卡梅伦液压数据手册(第 20 版)说明书

iv
⌂
CONTENTS OF SECTION 1
☰ Hydraulics
⌂ Cameron Hydraulic Data ☰
Introduction. . . . . . . . . . . . . ................................................................ 1-3 Liquids. . . . . . . . . . . . . . . . . . . ...................................... .......................... 1-3
4
Viscosity etc.
Steam data....................................................................................................................................................................................... 6
1 Liquid Flow.............................................................................. 1-4
Viscosity. . . . . . . . . . . . . . . . . ...................................... .......................... 1-5 Pumping. . . . . . . . . . . . . . . . . ...................................... .......................... 1-6 Volume-System Head Calculations-Suction Head. ........................... 1-6, 1-7 Suction Lift-Total Discharge Head-Velocity Head............................. 1-7, 1-8 Total Sys. Head-Pump Head-Pressure-Spec. Gravity. ...................... 1-9, 1-10 Net Positive Suction Head. .......................................................... 1-11 NPSH-Suction Head-Life; Examples:....................... ............... 1-11 to 1-16 NPSH-Hydrocarbon Corrections.................................................... 1-16 NPSH-Reciprocating Pumps. ....................................................... 1-17 Acceleration Head-Reciprocating Pumps. ........................................ 1-18 Entrance Losses-Specific Speed. .................................................. 1-19 Specific Speed-Impeller. .................................... ........................ 1-19 Specific Speed-Suction...................................... ................. 1-20, 1-21 Submergence.. . . . . . . . . ....................................... ................. 1-21, 1-22 Intake Design-Vertical Wet Pit Pumps....................................... 1-22, 1-27 Work Performed in Pumping. ............................... ........................ 1-27 Temperature Rise. . . . . . . ...................................... ........................ 1-28 Characteristic Curves. . ...................................... ........................ 1-29 Affinity Laws-Stepping Curves. ..................................................... 1-30 System Curves.. . . . . . . . ....................................... ........................ 1-31 Parallel and Series Operation. .............................. ................. 1-32, 1-33 Water Hammer. . . . . . . . . . ...................................... ........................ 1-34 Reciprocating Pumps-Performance. ............................................... 1-35 Recip. Pumps-Pulsation Analysis & System Piping...................... 1-36 to 1-45 Pump Drivers-Speed Torque Curves. ....................................... 1-45, 1-46 Engine Drivers-Impeller Profiles. ................................................... 1-47 Hydraulic Institute Charts.................................... ............... 1-48 to 1-52 Bibliography.. . . . . . . . . . . . ...................................... ........................ 1-53
基于循环减法加速的多像素Bresenham直线绘制算法

基于循环减法加速的多像素Bresenham直线绘制算法李向【摘要】Line drawing algorithm is very important in the computer graphics. It is the most famous algorithm that Bresenham Algorithm uses to draw a straightness line in a smooth fashion. The advantage of classic Bresenham Algorithm is that the operations are all integer numeric without division and decimal fraction. Meanwhile, the disadvantage of the algorithm is that it can just generate one pixel in a computation time and its low in efficiency. In this paper, an accelerated algorithm was proposed, which give full attention to the initiative relation between generation model of line and its linear slope, and it does generate more than one pixel of a line through row of raster display device.The core principle of the improved algorithm is utilizing the coordinate position of both ends of line and the symmetry characteristic for segments. After discussing theory and structure of the improved algorithm, the algorithm implementation and simulation are given at last. And finally, the hardware acceleration in the use of circular subtraction technology based on shift register was briefly described.%直线生成算法是图形的基本元素,也是计算机图形学基础理论的重要内容.Bresenham算法是直线生成算法中最经典的算法,但是它一次计算只能生成一个像素点,效率低下.为了提高直线生成效率,充分利用待生成线段的起点和终点坐标及线段自身的对称性,对Bresenham 算法进行改进,一次计算生成一个像素行.讨论硬件实现该算法的加速方法.【期刊名称】《计算机系统应用》【年(卷),期】2011(020)004【总页数】4页(P245-247,230)【关键词】直线;Bresenham;计算机图形学;多像素;算法【作者】李向【作者单位】郑州航空工业管理学院,计算机科学与应用系,郑州,450015【正文语种】中文直线是图形中最基本的元素之一,直线生成算法是其他各类图形算法的基础,直线绘制算法的好坏对图形应用系统的效率和质量有直接而又重要的关系。
改进蚂蚁算法在组合优化中的应用-置换FlowShop问题求解

改进蚂蚁算法在组合优化中的应用-置换FlowShop问题求解张新华;赵国杰
【期刊名称】《天津理工大学学报》
【年(卷),期】2005(021)002
【摘要】置换FlowShop问题是生产调度问题中的一种,具有广泛的工程应用背景.有效的调度能够提高企业的生产效率和设备利用率,增强企业竞争能力.然而多机器的置换FlowShop问题属于NP-hard问题,很难得到问题的最优解.文章简单介绍了蚂蚁算法,并提出退火蚂蚁算法-将max-min ant system与模拟退火算法相结合.通过与max-min ant system运算结果进行比较最后得出结论:退火蚂蚁算法性能得到显著提高.
【总页数】4页(P53-56)
【作者】张新华;赵国杰
【作者单位】天津大学,管理学院,天津,300072;天津大学,管理学院,天津,300072【正文语种】中文
【中图分类】O122
【相关文献】
1.NSGA-II算法的改进及其在风火机组多目标动态组合优化中的应用 [J], 王进;周宇轩;戴伟;李亚峰;宋翼颉
2.蚂蚁算法在组合优化中的应用 [J], 马良;项培军
3.改进蚁群算法及其在云服务组合优化中的应用研究 [J], 李东星;陈喆;钱双洋;焦扬
4.蚂蚁算法在TSP问题求解的应用 [J], 崔之熠;王茂芝;刘国涛;朱怀朝
5.基于信息熵的改进狮群算法及其在组合优化中的应用 [J], 李彦苍;巩翔宇
因版权原因,仅展示原文概要,查看原文内容请购买。
Power Virtual Agent 企业版用户指南说明书

Do What MattersDo What Matters with Virtual AgentsNine considerations for Power Virtual Agent successPower Virtual Agents for the enterpriseBusinesses are accelerating their use of Power Virtual Agents, spurred by their increasing need to cut costs, the growing acceptance of self-service by customers – and by one thing more: the recognition that Power Virtual Agents are a core component of a customer experience (CX) that builds customer satisfaction, loyalty and generates higher revenues.According to the Gartner Customer Experience Innovation Survey 2019, respondents indicated that they expect virtual customer assistants/chatbots to have the second biggest impact on their organizations customer experience (CX) improvement projects in the next three years, after Artificial Intelligence.1 So far, much of the shift in contact centers has been from live chat to Power Virtual Agents. The bigger shift will be from live call agents to Power Virtual Agents. That shift may bring with it opex reductions of about 30%. Power Virtual Agents will respond to customers without long wait times, or any wait times at all.The human agents freed from handling typical calls will be available for exception handling of the more unusual and difficult calls. The bottom line for customers will be better, faster issue resolution and higher satisfaction.The shift to Power Virtual Agents could cut contact center opex by 30%.1Gartner: “Market Guide for Digital Customer Service and Support Technologies,” Brian Manusama, Nadine LeBlanc, March 19, 2020 (Gartner subscription required)Another reason for the accelerating use of Power Virtual Agents is demographics: Millennials and, now, centennials, are more apt than previous generations to welcome self-service channels as long as those channels are of high quality.The impact of COVID-19 on business is afurther accelerant. Many health care providers, government entities and corporations have had their contact centers swamped with patient,constituent and customer calls relating directly to COVID-19, or have seen surges as the pandemic leads many people to choose remote channelsover in-person service. Many of the business model changes – in health care and elsewhere – spurred by COVID-19 may well remain in place after the pandemic. So Power Virtual Agents have to work as long-term, not temporary, solutions.Power Virtual Agents Fast, easy – and enterprise-gradeMicrosoft Power Virtual Agents (PVA) empowers business teams to easily create powerful, scalable AI-driven Power Virtual Agents using a guided, low-code, no-code interface without the need for data scientists or developers.This eliminates the traditional gap between subject matter expertsand development teams in building Power Virtual Agents. It reduces, if not eliminates, the delay between recognizing an issueand updating the Power Virtual Agent to address it. It removes the complexity of exposing teams to the nuances of conversational AIand the need to write complex code.Additionally, it minimizes the IT effort required to deploy and maintain a custom conversational solution and frees them upfor higher-value work for the business. For example, manyhealth care providers during the COVID-19 pandemic, made it a priority to address patients’ questions regarding rapidly changing information on tests and treatment.Case StudyRegional European government detects COVID-19 cases with Power Virtual AgentThe government’s health department needed to help citizens track symptoms and get treatment recommendations for COVID-19. In just five days, Avanade created a trilingual chatbot based on a client-supplied algorithm.In its first three hours and 4,000 conversations, the Power Virtual Agent detected more than 100 new, severe cases. The Power Virtual Agent enables tracking of viral spread through persistent storage of the information it gathers.PVA is ready for prime time.While PVA is an easier and faster way to create Power Virtual Agents, it’s also an enterprise-grade way to do so. PVA places no cap or limit on the numberof intents – that is, the reasons why your customers contact you – that you can address. Your Power Virtual Agents can be better prepared for the intents that customers present today, and you can add to them at any time so you’re just as prepared tomorrow. PVA is connected.PVA’s integration functionality is another enterprise-ready capability, one that enables personalized CX that delivers both answers and actions. PVA is the latest member of Microsoft’s Power Platform, which also includes Power BI, Power Automate (formerly Flow) and Power Apps.It shares the same Common Data Service (CDS) foundation and connectivity options – including hundreds of connectors – with its Power Platform siblings. That enables you to create Power Virtual Agents that not only chat with customers, but also use the Power Platform and other apps to act on their behalf – for example, offering upgrades to the last purchases they made, or rescheduling deliveries in response to changing customer availabilities. Integrate PVA with Microsoft Dynamics 365 Sales Insights to sense changes in buyer needs and trends, and with Customer Insights to get a single view of customers’ questions and pattern behaviors in real time. PVA is smart.Imbued with Microsoft’s powerful conversational AI out of the box, PVA enables your customers to have rich, multi-turn conversations that guide them to the right answers, right away. Customer conversations with PVA are more like talking to a human agent; they’re “scriptless conversations” in which PVA can understand the connections among several rapid-fire questions and provide an answer that covers them all or ask its own follow-up question, as appropriate. AI algorithms in PVA identify these more effective responses, so you can reduce escalation rates and lower cost while increasing customer satisfaction.A feedback loop to R&D helps product designers understand how customers use the company’s products and services, so they can design them better. And there’s no need to retrain AI models; just provide some examples and build the conversation with PVA’s graphical editor. PVA automates intent discovery, scrubbing and scanning any structured or unstructured data and using it to suggest customer intents and answers that human agents or managers can accept, reject or edit – and building thousands of intents from a few trigger phrases in mere months. PVA’s intelligence also extends to monitoringand improving its performance. With AI-driven dashboards you can track crucial metrics, easily see which topics are doing well and which should improve, and quickly make adjustments to make your Power Virtual Agent more effective with every iteration.Case StudyLinea Directa cuts costs by automating 30% of its contact centerThe company, one of the biggest insurance companies in Spain, wanted to boost operational efficiencies and enhance customer service across digital channels. Avanade created a Power Virtual Agent that maximized the effectiveness of front-line staff. The solution automates key processes and frees people to focus on strategic decision-making. Seventy percent of callers choose the chatbot, which handles 7,000 calls per day.9 considerations for Power Virtual Agent success As companies continue to adopt and expand their use of Power Virtual Agents, they need toensure that what they build will be a vital contributor to successful CX. The foundations for that success should take the following into account:1. Higher customer expectations.Power Virtual Agents that are simply sophisticated search engine interfaces won’t do, because customer expectations continue to grow. Today’s Power Virtual Agents, let alone tomorrow’s, need to take better advantage of AI to understand customer intent, sentiment and discovery – and then to take action based on what they know, such as changing an address or implementing a customer’s request to transfer funds.2. New operational challenges.Physical contact centers may be a thing of the past, certainly for some organizations and certainly for now. Others operate or will operate in a hybrid mode. Power Virtual Agent solutions need to operate seamlessly in this environment, including informationally completing hand-offs to human agents.3. Fast, low-code, no-codedevelopment solutions.Time-consuming development cycles aren’tacceptable anywhere, but certainly not in today’s CX.Emergency or urgent situations require organizationsto create or recast Power Virtual Agents quickly toaddress new customer questions and needs. Thinklocal organizations and weather disasters, health careproviders and COVID-19, and financial institutionsand the U.S. Paycheck Protection Program’s loanapplication process.4. Fast adoption technology.It’s not just the development of each Power VirtualAgent that needs to be expedited. So does theadoption of the technology to create them. That’sneeded to keep costs low and to speed time to benefit.Organizations should look for Power Virtual Agent-building technology that builds on the technologiesand skills they already have. As well, they should lookfor technology that provides an open, viable roadmapto new capabilities as they become available.5. Actionable insight into CX.Managers need to know which questions theircustomers are asking, which ones go unanswered, andwhich answers leave customers confused rather thansatisfied – and then they need to use those insights toimprove their CX.6. Regulatory and ethics concerns.Other issues arise as organizations have deeper, morepersonal digital conversations with their externalaudiences, collect more information from them, andanalyze that information more fully.Health care organizations need to focus on meetingregulations such as HIPAA or new governmentalstandards for hygiene in COVID-19 times.All organizations need to address digital ethicsconcerns, including what information and insights theycollect, and how they solicit, use and store it.Additional considerations before you proceedGetting the most out of PVA depends in part on what you put into it. There’s a lot to think about. Now is a good time to begin. Here are some additional points to consider:7. Business-led approach.PVA helps you solve a business problem, so start your adoption with a business assessment and use case to understand what you’re trying to do and how you will evaluate the results. Automate 40% of your inbound contacts? Reduce escalations to human agents by 20%? And what will the impact of these changes be on customer satisfaction and costs?8. Your agent may be your customer’s first brand interaction.Maximizing the value of PVA solutions means adopting principles such as human-centered design and processes such as design thinking. A key goal is to identify the optimal persona and conversational tone for your Power Virtual Agent – based on factors including your brand, industry, customer base and geographic markets.9. Governance.Empowering subject matter experts and othernon-technical citizen developers to createtheir own Power Virtual Agents is potentiallychaotic. You could end up with redundant andorphaned agents, agents that draw on conflictingor incomplete data, agents that inadvertentlyviolate data privacy and security protocols,and agents that aren’t integrated with relevantsystems or that don’t enable seamless handoffswith appropriate information to human agents.While business users may be in the driver’sseat, IT has to provide the ”guardrails” – in theform of appropriate guidance, standards andgovernance – to ensure the business stays ontrack, uses standard models to build successfulconversations and has the support it needs as itrepurposes jobs or upskills agents.Only the startPVA is only the start of the broaderAvanade, Accenture and Microsoftsolution for digital CX, calledMicrosoft Advanced CustomerEngagement+ (MSACE+). While PVAis a fast, lightweight SaaS tool forweb and text-based chat, MSACE+is a comprehensive, omnichannel,intelligent contact center solution.Its AI-powered functionality includesinteractive voice response (IVR)along with web, SMS and socialmedia channel capability. It caninclude PVA as a component – givingorganizations a roadmap to expandfrom one to the other.of PVA –Perhaps no entity has had a greater potential challenge with Power Virtual Agent scalability than the government of India, which needed its Power Virtual Agent for COVID-19 informationMyGov Saathi. It’s a PVA solution that supports 300,000 users per day and up to 20,000 concurrent users per minute. Hosted on the government’s website, it reaches Indian citizens where they are, rather thanWays to move forwardLooking to begin your PVA journey? Here are ways Accenture and Avanade can help you move forward.The skills and scale to make PVA a reality for your businessAccenture and Avanade bring an array of strengths to your PVA adoption:• 4,000+ global data engineering and AI consultants • 1,000+ AI/machine learning solutions delivered • Digital Innovation Studios with multidisciplinary teams worldwide• Unprecedented 15 awards as Microsoft Global Alliance SI Partner of the Y ear• 2020 Microsoft Power Platform and Power Automate Partner of the Y ear Finalist• 2020 Microsoft Global AI and Machine Learning Partner of the Y ear• Unmatched relationship with our founding companies, Microsoft and Accenture•2,000+ trained Power Platform professionals•Let’s chat. A practical discussion (virtual or in-person) to explore your vision and goals. We can discuss how we’ve approached PowerVirtual Agents with other use cases, and how we might help.•PVA-in-a-Day workshop. A facilitated design thinking workshop (virtual or in person) is a great way to generate ideas and goals. But we don’t just leave you thinking; in the one-day workshop, you’ll also create a PVA prototype.•Design-led hackathons. Get diverse groups throughout your organization to work together to identify the most important areas for optimal Power Virtual Agents and use PVA to quickly prototype.•Governance and Center of Excellence. We’ll help you establish and evolve key measurability standards to help ensure your Power Virtual Agents deliver on the promise of PVA while you continue to meet enterprise standards and goals.11About Avanade Avanade is the leading provider of innovative digital, cloud and advisory services, industry solutions and design-led experiences across the Microsoft ecosystem. Every day, our 56,000 professionals in 26 countries make a genuine human impact for our clients, their employees and their customers. Avanade was founded in 2000 by Accenture LLP and Microsoft Corporation. Learn more at .About AccentureAccenture is a leading global professional services company, providing a broad range of services in strategy and consulting, interactive, technology and operations, with digital capabilities across all these services. We combine unmatched experience and specialized capabilities across more than 40 industries—powered by the world’s largest network of Advanced T echnology and Intelligent Operations centers. With 505,000 people serving clients in more than 120 countries, Accenture brings continuous innovation to help clients improve their performance and create lasting value across their enterprises. Learn more at .© 2022 Avanade Inc. All rights reserved. The Avanade name and logo are registered trademarks in the U.S. and other countries. Other brand and product names are trademarks of their respective owners.North America Seattle Phone +1 206 239 5600 *******************South America Sao Paulo *************************Asia-Pacific Australia Phone +61 2 9005 5900 *******************Europe London Phone +44 0 20 7025 1000 ******************From PVA-in-a-Day workshops to hackathons and more, we can help you kickstart your PVA journey.Contact us todayAre you ready?Nine considerations for Power Virtual Agent success。
一种基于去均值的加速收敛的分形压缩算法

一种基于去均值的加速收敛的分形压缩算法
张颖;余英林
【期刊名称】《中国图象图形学报:A辑》
【年(卷),期】1998(3)4
【摘要】通过研究传统分形压缩算法中解码迭代过程的收敛性问题,提出了一种
新的基于去均值的加速收敛的分形压缩算法,理论分析和实验证明新算法的解码迭代次数要大大少于传统分形压缩算法,并且具有运算复杂度相对降低,恢复图象的PSNR提高等优点。
进一步地,我们将新算法结合到自适应四叉树分割的结构中,在压缩比和图象质量之间取得较好的折衷,实验结果优于相同条件下的传统分形压缩算法。
【总页数】5页(P285-289)
【关键词】图象压缩;分形压缩;四叉树分割;收敛;图象恢复
【作者】张颖;余英林
【作者单位】广东省邮电管理局拓展办;广州华南理工大学电子与通信工程
【正文语种】中文
【中图分类】TN919.8;TP391.4
【相关文献】
1.一种基于K-均值聚类优化的快速分形图像压缩算法 [J], 姜政;江铭炎
2.一种基于新型四叉树的快速分形图像压缩算法 [J], 郑运平;陈传波
3.一种新型的基于熵值的分形图像压缩算法 [J], 王伟;崔荣一;金王;金璟璇
4.基于去滑动均值趋势多重分形的糖尿病风险预测 [J], 赖佳境
5.一种基于小波分解的无搜索分形图像压缩算法 [J], 庄琳;姜政;江铭炎
因版权原因,仅展示原文概要,查看原文内容请购买。
一种基于遗传算法的Normalized Cut准则图像分割方法

一种基于遗传算法的Normalized Cut准则图像分割方法李果
【期刊名称】《齐齐哈尔大学学报(自然科学版)》
【年(卷),期】2016(032)003
【摘要】Normalized Cut准则图像分割是基于图论的方法,是一种比较典型的规范化分割,但由于其运算量较大、收敛条件难以控制等缺陷,使得图像二值化分割不均匀.本文从Normalized Cut缺陷研究入手,利用遗传算法全局快速检索特性,改进Normalized Cut优化函数,获得精度理想的图像分割效果.
【总页数】4页(P25-28)
【作者】李果
【作者单位】安徽新闻出版职业技术学院,合肥230601
【正文语种】中文
【中图分类】TP391.4
【相关文献】
1.基于形态学分水岭的Normalized Cut图像分割方法 [J], 刘贺鹏;吕建平
2.基于图论的Normalized Cut图像分割方法研究 [J], 杨宇鹏;赵卫东;王志成;陈刚
3.基于鱼群算法优化normalized cut的彩色图像分割方法 [J], 周逊;郭敏;马苗
4.基于标准割(Normalized cut)算法图像分割方法 [J], 安文波
5.结合图论Normalized Cut方法的彩色图像分割研究 [J], 任爱红;白婷婷
因版权原因,仅展示原文概要,查看原文内容请购买。
- 1、下载文档前请自行甄别文档内容的完整性,平台不提供额外的编辑、内容补充、找答案等附加服务。
- 2、"仅部分预览"的文档,不可在线预览部分如存在完整性等问题,可反馈申请退款(可完整预览的文档不适用该条件!)。
- 3、如文档侵犯您的权益,请联系客服反馈,我们会尽快为您处理(人工客服工作时间:9:00-18:30)。
The authors are with the Department of Electrical and Computer Engineering, Texas A&M University, College Station, TX 77843 USA (e-mail: sadegh@neo. ; savari@).
Abstract—The linear deterministic model of relay networks (LDRN) is a generalization of the traditional directed network model which has become popular in the study of the flow of information over wireless communication networks. The max-flow/min-cut theorem for a multicast session over a directed network has been extended to this wireless relay model. The result was first proved by a random coding scheme over large blocks of transmitted signals. In this paper, in the special case of a unicast session, a simple capacity-achieving transmission scheme for LDRN which codes over one symbol of information at each use of the network is obtained by a connection to the submodular flow problem and through the application of tools from matroid theory and submodular optimization theory. Polynomial-time algorithms for calculating the capacity of the network and the optimal coding scheme are implied by our analysis.
Our focus in this paper is on illustrating some connections between the flow of information in LDRNs and the submodular flow problem. Submodular flow was first introduced by Edmonds and Giles [11]. It generalizes the classical model of network flow and includes several combinatorial optimization problems as special cases. In the classical model of flow, each edge has a capacity that constrains the flow through that edge. The submodular flow model replaces these edge constraints with constraints on the total flow passing through each subset of nodes. These constraints satisfy a certain submodularity property. Frank [15] proved a max-flow/min-cut theorem for the submodular flow model and polynomial-time algorithms [16] exist for finding the maximum flow.
IEEE TRANSACTIONS ON INFORMATION THEORY, VOL. 57, NO. 5, MAY 2011
3005
A Max-Flow/Min-Cut Algorithm for Linear Deterministic Relay Networks
S. M. Sadegh Tabatabaei Yazdi and Serap A. Savari, Member, IEEE
In Section II we review the LDRN model and some basic results from [4] and [5]. The network model is a layered graph with the first layer consisting of the source node, the last layer consisting of the destination node, and each intermediate layer consisting of one or more relay nodes. The channel model from one layer to the next layer of the network is described by a transfer function which is a linear function described by matrix multiplication in some fixed finite field. We will begin our development in Section III by introducing a notion of flow from one layer to the next layer. Our flow corresponds to a nonsingular submatrix of the transfer function between two consecutive layers, and it preserves the information sent from one layer to the next layer. In order to analyze our transmission scheme between two consecutive layers and to find the set of achievable flows from one layer to the next layer, we apply the Rado–Hall theorem [29], [39, Ch. 7] from transversal theory [21], [25], [28], [39, Ch. 7]. Transversal theory studies independent structures in matroids. In Section IV, we extend our notion of flow from one layer to the next layer of a network to the flow over the whole network. This corresponds to a transmission scheme from the source to the destination of an LDRN. In this section we prove that our flow is a special case of submodular flow and demonstrate that it is capacity-achieving by using the max–flow/min–cut theorem for submodular flow.
Digital Object Identifier 10.1109/TIT.2011.2120250
with Gaussian noise and to devise coding scheme for them [6]. Recent work [13], [26] respectively connects the linear deterministic model and the algorithm of [4] and [5] to the capacity of other types of communication channels and to the design of near-optimal coding schemes for them.
Communicated by H. El Gamal, Associate Editor for the special issue on "Interference Networks".
Color versions of one or more of the figures in this paper are available online at .