CACTI流量合并
Cacti使用手册

Cacti使用手册目录界面与功能介绍 (3)界面 (3)菜单栏介绍 (3)状态栏介绍 (4)工作页面介绍 (4)C ONSOLE介绍 (4)GRAPHS使用介绍 (7)插件的应用 (8)M ONITOR介绍 (8)Monitor界面介绍 (8)将一台主机应用到monitor (9)T HOLD介绍 (10)Thold Console界面介绍 (10)Thold配置参数具体介绍 (11)Thold的基本运维 (13)S YSLOG介绍 (15)过滤选项 (16)主机选择 (16)输出选择 (16)其它 (16)添加一台主机监控 (16)客户端的准备 (16)添加主机 (17)主机基本信息填写 (17)可用性信息 (18)SNMP操作 (18)主机整理与验证 (19)SNMP信息验证 (19)创建监控图 (20)应用插件 (20)thresholds应用 (20)树与Moninor的树调整 (20)界面与功能介绍Cacti安装好后,直接建入服务器IP即可以访问Cacti,系统帐号在Cacti的第一次配置中已经强行要求客户修改密码。
所以,请记住你的帐号,登录。
界面菜单栏介绍界面最上方是Cacti与Cacti插件的菜单栏,下面我们就分别的介绍一下:Console-控制菜单,负责Cacti及Cacti所有插件的配置、添加、管理工作Graphs-图像显示菜单,负责Cacti所有数据图像显示工作Monitor-Cactiuser组织开发的监控插件的显示菜单,Monitor菜单使用图标的方式显示被监控端的状态工作Thold-Thresholds简称,Cactiuser组织开发的门槛报警插件。
Thold菜单为Thresholds (以下简称Thold)显示界面Syslogs-Cactiuser组织开发的系统日志插件,Syslogs菜单负责显示系统日志每个菜单以红色显示,即为当前栏目。
Console与Graphs属于Cacti基本的功能菜单,而如Monitor,Thold,syslogs等,则是安装好插件后功能菜单选项。
cacti

CactiEZ简介一.Cacti部署下载cacti镜像刻录成启动光盘,准备一个linux系统的机器,最好是单独硬盘,光盘引导,直接安装,从开始到结束,都不需要你动一下,直接自动安装。
分区、格式化、系统、软件。
出现下图的时候,点reboot,重启电脑,在bios里面改成硬盘引导。
期间会有个设定ip的步骤,设定好ip地址就重启网卡基本上就OK了,ip地址设好,并开始启用,就在另一台windows机器的ie上面打221.212.91.160便可以登录Cacti了。
二.Cacti添加主机在添加主机之前,我们还需要做些前序工作,Win2003中的snmp服务并不是默认安装的,在以上工作之前我们还需要给想要添加的服务器安装snmp服务,这样才能够安装成功。
我们在添加或删除程序中选择添加或删除windows组件再选中管理和监视工具如图勾选WMI SNMP提供程序和简单网络管理协议(snmp)放入系统盘安装,之后我们在服务中找到snmp service服务双击选择属性>安全>添加接受团体的名称northeast@dbw,再选择接受来自这些主机的snmp数据包写入cacti的地址221.212.91.160确认。
这之后我们还需要在网络防火墙中设置例外,添加名为snmp的端口,端口号为161和162 UPD在完成了服务器端的配置之后,我们就可以添加主机了登录cacti之后我们能看到一个类似向导的页面点击为网络添加主机出现如下图的界面点击添加出现下图的界面其中描述填写便于识别主机的名字方便查询,主机名就是填写主机的ip地址,主机模板是指该主机所用的操作系统,之后勾选监视主机,宕机消息就是当主机出现问题时在监视页面所显示的应急信息。
在可靠性/可达性选项后基本上就采用默认值就可以了。
(snmp社区填写northeast@dbw)以上填写完毕,在右下角选择create完成以后会在提示上方显示该主机的有关信息:之后就是添加主机监控图,选择为这个主机添加图形,勾选相应的主机添加模板在右下角选择create添加完成后,会有完成提示,然后自动添加阈值完成后回到控制台会有新添加的主机提示之后估计等待5分钟在graphs中就可以查看主机创建的监控图了。
Cacti Aggregate(端口流量叠加)

The Cacti GroupCactiAggregate Plugin Version 0.75Usage GuideBrought to you byReinhard Scheckgandalf@Usage GuideTable of Contents Features (3)Installing the Plugin (4)Basic Installation Procedure (4)Providing Permissions to Users (6)Basic Usage (7)Aggregate Options Explained (8)Modifying the Default Traffic Graph Templates (13)Finding Aggregated Graphs (16)Color Templates (17)Create a new Color Template (17)Aggregate Cookbook (19)A Variation of Traffic Templates (19)Interface – Traffic (bits/sec) ( default) (20)Interface – Traffic (bits/sec) (AREA/STACK) (20)Interface – Traffic (bits/sec) (peak) (21)Interface – Traffic (bits/sec) (pos/neg) (21)Interface – Traffic (bits/sec) (pure LINE) (22)Examples (23)Using “Interface – Traffic (bits/sec) ( default)” (23)Keep graph types, print all legend items, total similar data sources, reorder (23)Using “Interface – Traffic (bits/sec) (AREA/STACK)” (23)Convert to AREA/STACK Graph, No Totals, No Reordering (23)Using “Interface – Traffic (bits/sec) (peak)” (25)Using “Interface – Traffic (bits/sec) (pos/neg)” (25)Using “Interface – Traffic (bits/sec) (pure LINE)” (26)Convert to AREA/STACK Graph, No Totals, No Reordering (26)Convert to AREA/STACK Graph, Print totaling Legend Items Only, Total Similar DataSources, No Reordering (27)Caveats (29)A Word on CDEFs (30)Totaling CDEFs (31)Make 0 CDEF (32)Caveat when using different Graph Templates (33)Usage GuideF EATURESThe AGGREGATE plugin was developed based on a HowTo from user Linegod (J.P.Pasnak). The main purpose is to reduce the amount of manual tasks required to create anew graph based on two or more already existing graphs: an aggregated graph.So, basically, it does nothing magic; you can't do it all on your own. In fact, all graphscreated by AGGREGATE are by all means normal Cacti graphs. You may place theminto any tree, you can modify them, add new items, rename title or items.Here's a brief list of all supported features:●Suggest a new title based on the basic graph template, removing unwanted |query_*|and |host_*| stuff (|query_*| supported for data query type graphs only)●Allow for |host_*| and |query_*| variables in AGGREGATE graph item text field(|query_*| supported for data query type graphs only)●Graph item prefix defaults to |host_hostname| to distinguish graph items of differenthosts●optionally convert to AREA/STACK type graphs using sophisticated graph itemtype conversion●optionally convert to all available LINEx graph item types(as Cacti does not yet support stacked LINEx, this is not supported byAGGREGATE as well. Cacti 0.8.8 will support all available RRDTool LINExtypes)●Support for Color Templates, e.g. all green “traffic_in” colors can be changed fromlight to dark green to make them visually distinguishable●Color rotation: in case a color template holds less items than the aggregate, the colortemplate will be applied multiple times●programmatically add <HR> (line breaks) to avoid unwanted “concatenation” ofgraph items●Support a “sort order”, especially required if base graph is AREA/STACK type togroup similar graph items (e.g. all “traffic_in” first, all “traffic_out” next)●Support for Totalling, either for “similar” or “all” data sourcesthis feature auto-creates new CDEFs when necessary●custom prefix on total GPRINTs●Support “total only” aggregates, not printing the “elementary” graph itemsUsage GuideI NSTALLING THE P LUGINBasic Installation ProcedureThe current manual is based on Cacti version 0.8.7g and Plugin Architecture (PIA) version 2.8. This plugin has been verified to work with this version. There has been no intention to drop support for older versions, use them at your own risk.As a prerequisite, installing of the Plugin Architecture (PIA) is required, please see / for help regarding this topic. Furthermore, it is assumed, that you already provided authorization to use “Plugin Management”.Please download this plugin to the <path_cacti>/plugin directory and unpack the *.tgz file. All files will now reside in the <path_cacti>/plugin/aggregate directory.Activating this plugin depends on the Plugin Architecture (PIA) used., please go to that menu item, install and enable the new plugin.Select the “Install” knob, then then …Enable“. It should now look likeIllustration 1: Install AGGREGATEUsage GuideIllustration 2: AGGREGATE installation finishedUsage GuideProviding Permissions to UsersEverybody who has Console access is now allowed to create new aggregate graphs.But there's a second section, that comes with AGGREGATE, the Color Templates. Toprovide access to create, delete or modify color templates and items, please go to UserManagement and select the correct userid. Now, check the AGGREGATE checkboxesas shown below.Illustration 3: Providing Permissions to UsersUsage GuideB ASIC U SAGENow, turn to Graph Management. It makes sense to apply a search filter and/or a graph template filter. Then, you will have to select the graphs you want to aggregate.Now, please hit “Create Aggregate Graph”.Illustration 4: Select Graphs from Graph ManagementUsage GuideAggregate Options ExplainedThere are a multitude of options available to tailor your aggregated graphs to your needs. Not all of them can be freely chosen and not all of them make sense, whenapplied to different types of graphs. But before digging deeper into use cases, let's first explain all those options.Clicking for help opens this pdf file. Let me have some words on the quite complex data on that screen. On the upper left, you'll see the list of graphs selected previously. Please verify, that all needed graphs are included.On the upper right, please notice the list of related data sources . The sequence may deviate from the graph list. Don't bother to see the same IP in this example, both graphs relate to my laptop's traffic.The Title is pre-filled. The prefix always is …Aggregate“. Next comes the title taken from the first graph in raw format, but having all |host_*| or |query_*| removed asneither host nor query related variables make much sense for an aggregate . That is e.g. …|host_description| - Traffic - |query_ifDescr|“ turns to “ - Traffic” only. Of course, you will want to make it more meaningful to you.Illustration 5: Default Prompt for Aggregating Graphs (upper half)Usage GuidePrefix allows you to distinguish graph items on the aggregate. Imagine aggregatingtraffic, like this example does, without it you won't be able to distinguish between allthose aggregated graph items. You may discard the prefix, though. It is allowed, to useall available |host_*| variables here and/or any plain text you like. When using a dataquery, |query_*| type variables are allowed, too. Pay attention not to spend too manycharacters in order to avoid line wrap of the legend.Graph Type is quite important to use. You may wonder why it is defaulted to createAREA/STACK graphs. Here's the reason why: Assume, you're aggregating an AREAgraph. Without STACKing the second, third, ... graph item, all of them will overlap.Thus, only the last one will be seen (and perhaps parts of previous ones, if their valuesare higher).●“Keep Graph Types” does not change any graph type at all●“Convert to AREA/STACK Graph” keeps type of first graph as is. But for the nextgraphs, the graph type will be changed to AREA/STACK if it has been AREA orLINEx.●“Convert to LINEx Graph”: Sometimes, it is recommended to have LINEx graphsinstead. This will convert all graph types (AREA, STACK, LINEx) to the chosenLINEx (x=1,2,3).Totaling knows three options.●The obvious first one is “No Totals”.●Then, there is “Print all Legend Items”.This one will show all legend entries (GPRINT, Comment) as usual but add somemore lines for totals. The items that shall be totaled must be selected from the“Total” column (see below).Graph Type is always LINE1, even when “Convert to AREA/STACK Graph” isused as it makes no sense to STACK totals on top of existing items.Color is taken from Color Template of associated data source item.●Last, there is “Print totaling Legend Items Only”.This option will NOT print the normal legend items; it will print the totaling itemsonly.Usage GuideGraph Type is governed by the Graph Type chosen.Color is taken from Color Template of associated data source item.Total Type has two different options:●…Total Similar Data Sources“ totals all e.g. “traffic_in” separated from “traffic_out”.●…Total All Data Sources“ totals all data sources. Please see examples below on howto use them.Prefix for GPRINT Totals allows you to define a prefix to be printed in front of thetotaling line of the legend. The field is editable only if any “Totaling” option has beenchosen. Of course, you may change that prefix.●for “Total Similar Data Sources”, the default is “Total”,●for “Total All Data Sources” it is “All Items”.Reorder Type allows you to reorder graph items of the aggregate.●“No Reordering”This means, that the selected graph items of each graph, graph by graph, will beused for the aggregate. E.g. for a traffic graph, this will lead to a sequence of“Traffic In – Traffic Out – Traffic In – Traffic Out ...”.Totaled items will not be reordered; they will be placed at the end of the legend.●“Data Source, Graph”This will first order by data source, then by graph. E.g. for a traffic graph, this willlead to a sequence of “Traffic In – Traffic In ... – Traffic Out – Traffic Out ...”.For STACKed graphs, totaled items will not be reordered; they will be placed at theend of the legend.For non-STACKed graphs, totaled items will be reordered as well, e.g. totaled“Traffic In” will be placed after all “Traffic In” items and before “Traffic Out”items.Usage GuideGraph Templates Items is build based on the first graph selected, showing up in the lower part of the aggregate screen.. Please pay attention to this section to make the most of your new aggregate.There are three columns to pay attention to.Color Template governs the coloring of the aggregated graph items. Why's this? Using a single graph template will usually result in graph items like e.g. …Traffic In“ having same color on all graphs. On an aggregate, you would thus not be able to distinguish between them. That's where color templates come in. They simply define a sequence of colors, each of them assigned to an aggregated graph item in turn. And if the aggregate has more items than the Color Template, we will wrap the Color Templateautomatically.Creating a color template like a …rainbow“ of colors allows you now to assign a set of colors in a single run! Do not forget to assign different color templates to different graph items!As totaling will add a new line that was not yet present, the color for that item will be taken from the associated data source item or the related color template, if chosen.Skip allows you to skip the checked item in the aggregate. There's a new, automatic <HR> mechanism to cope with <hard_returns> that will be dropped now. A skipped <HR> will percolate up the list to the previous item to keep line feeds in place. The mechanism will even introduce new <HR>'s at end of a graph template.Else, concatenating two graphs without <HR> in between will create ugly legends. This is required as well to make automatic legend adjustment work (but be aware, that thisIllustration 6: Aggregate Graphs, showing List of Graph Items (lower half)Usage Guiderequires always a fixed sized font for legends).Total governs the magic of totaling graph items. I did not make up my mind to create analgorithm for it. So you are required to check exactly those lines you want to see on thetotal legend.Totaling Similar Data Sources creates e.g. a total of each different data source referredto in the graph. E.g. In this example, there are two: …Traffic In“ and …Traffic Out“. Soyou want to check at least the AREA/LINEx graph items and all additional GPRINTitems.But when using e.g. 95th percentile graphs or bandwidth COMMENTs, you will want toskip them on the total.Please see examples below for more.Usage GuideModifying the Default Traffic Graph TemplatesThe default Cacti Graph Templates are mimicked after some very famous templates like those used by MRTG. “traffic_in” and “traffic_out” are both plotted to the positive y-axis, the latter as a LINE1.For use with AGGREGATE, this is not the best choice. And people often want to plot outbound traffic to the negative y-axis for a better understanding.You may either copy the graph templates you're going to change to preserve standard templates or change the standard to apply changes to all existing graphs with a simple swish of your magic wand called knowledge.As a first step, a CDEF is required to “Turn Bytes into Bits, make negative”:Please apply this CDEF to the outbound traffic item and make it an AREA as well:Illustration 7:Turn Bytes into Bits, make negativeUsage GuideNow, one more tweaks is required for the template itself. The default auto-scaling option does not allow for negative numbers to be plotted on the graph. That's why we now switch to –alt-autoscale (ignore given limits). SeeIllustration 8: Apply CDEF to Outbound Traffic ItemUsage GuideYou may want to apply those changes to all traffic graph templates using bits. That makes●Interface - Traffic (bits/sec) ●Interface - Traffic (bits/sec, 95th Percentile) ●Interface - Traffic (bits/sec, Total Bandwidth)Illustration 9: Use --alt-autoscaleUsage GuideF INDING A GGREGATED G RAPHSDue to the aggregated nature of the graphs, they are in general not associated to a single host. When searching an aggregate, you will therefor not find in when searching for a specific host. In fact, you'll find them when filtering for Host “None”; in other words: filter for all non-host related graphs:The same applies to the “template” filter. You may argue, that all aggregated graphs stem from the same basic graph template, expecting the aggregated graph to be related to that very graph template as well.But hold on: The new aggregate will have many more graph items, and, if you want, even totaling items that have not been present at all. That's why it is not possible to associate it with any existing graph template.In fact, if you want to search by template, you will again have to set the template filter to “None”:Illustration 10: Find Aggregated Graphs by Host FilterIllustration 11: Find Aggregated Graphs by Graph Template FilterUsage GuideC OLOR T EMPLATESWhen adding some graph items of same type, e.g. “traffic_in” and “traffic_out” to a single aggregated graph, it makes sense not to use a single color for all graph items of same type.E.g. instead of using green (RGB x'00FF00) for “traffic_in”, you may want to associate colors from light green to dark green. That's what a Color Template is used for.Create a new Color TemplateNow let's see how to create them. Make sure, that your userid was provided the realm to access “Color Templates”. Then, move to that menu option:Add a new Color Template by clicking “Add”:Hit “Create” and “Add” new “Color Template Items”, one by one:Illustration 12: Color TemplatesIllustration 13: Add a new Color TemplateUsage GuideIllustration 14: Add Items to Color TemplateUsage GuideA GGREGATE C OOKBOOKA Variation of Traffic TemplatesThe cookbook is based on variations of the default “Interface Traffic” Graph Template.I've chosen this one because almost everyone should be able to reproduce the examples.To show the different use cases, I've copied this graph template multiple times; varyingdifferent items of the template. Here's an overview:Illustration 15: Predefined Traffic Graph TemplatesUsage GuideInterface – Traffic (bits/sec) ( default)This is the default Traffic Graph Template. It shows “traffic_in” as an AREA and “traffic_out” as a LINE1.Interface – Traffic (bits/sec) (AREA/STACK)It shows “traffic_in” as an AREA and “traffic_out” as a n AREA/STACK. This does not make much sense as a traffic template; but keep in mind that this is used as an example.Illustration 16: Interface – Traffic (bits/sec) ( default)Illustration 17: Interface – Traffic (bits/sec) (AREA/STACK)Usage GuideInterface – Traffic (bits/sec) (peak)This is much like the template below, but an additional LINE1 item is added for“traffic_in” and “traffic_out”, showing the MAX consolidation function.Interface – Traffic (bits/sec) (pos/neg)It shows “traffic_in” as an AREA on the positive y-axis and “traffic_out” as an AREAon the negative y-axis.Illustration 18: Interface – Traffic (bits/sec) (peak)Illustration 19: Interface – Traffic (bits/sec) (pos/neg)Usage GuideInterface – Traffic (bits/sec) (pure LINE)This one looks very much like the default traffic graph template. But in this case, both“traffic_in” and “traffic_out” are drawn as LINE1 on the positive y-axis.Illustration 20: Interface – Traffic (bits/sec) (pure LINE)Usage GuideExamplesUsing “Interface – Traffic (bits/sec) ( default)”Keep graph types, print all legend items, total similar data sources, reorderBase graph is Interface – Traffic (bits/sec) ( default) on page 20. The aggregate showsthe same host twice, once named “gandalf-wlan” and once “localhost (127.0.0.1)”.This examples shows two features:●Totaling “Similar Data Sources”, printing all legend items ●Reordering by data sourcesFirst, all items are added to the new aggregate graph. In this example, the graph typesare kept (AREA and LINE1, respectively)Then, the total is build; in this case “Total Similar Data Sources”, both for inbound andoutbound traffic. The total is drawn as a line (hard to notice on this graph).At last, the reordering takes place. So all inbound items are grouped and all outbound aswell.Using “Interface – Traffic (bits/sec) (AREA/STACK)”Convert to AREA/STACK Graph, No Totals, No ReorderingBase graph is Interface – Traffic (bits/sec) (AREA/STACK) on page 20. The aggregateIllustration 21: Total similar data sources and reorderUsage Guideshows the same host twice, once named “gandalf-wlan” and once “localhost(127.0.0.1)”.When using a base graph of type Interface – Traffic (bits/sec) (AREA/STACK) withoutconversion (“Keep Graph Types”), the result isIn fact, that graph consists of AREA and STACK only. But as explained in Caveats onpage 29, both AREAs do overlap. It is very likely that this won't make you happy.You will get a different result, when using “Convert to AREA/STACK graph”, even ifthis sounds weird. This conversion option will sweep the resulting graph, keeping asingle AREA only and converting the rest to STACK.The result may look better than the first oneIllustration 22: Keep Graph Types, No Totals, No ReorderingUsage GuideUsing “Interface – Traffic (bits/sec) (peak)”Base graph is Interface – Traffic (bits/sec) (peak) on page 21. The aggregate shows thesame host twice, once named “gandalf-wlan” and once “localhost (127.0.0.1)”.This is a quite difficult beast. At the first glance, it makes sense to “Keep Graph Types”.But then, the AREAs overlap.Then, you may want to “Convert to AREA/STACK”. This will handle the AREAs well,but will convert the “Peak” LINE1 to STACK as well. That makes no sense at all. If youwant to choose this conversion, it is best to skip the “Peak” items. If you want to keepthem, some kind of post-processing is required to change the “Peak STACKs” to “PeakLINE1” again. That's my favorite for this type of graphs.So, at last, there's “Convert to LINE1”. Nothing bad will happen here, but you willreceive a lot of LINEs. Looks ugly.Using “Interface – Traffic (bits/sec) (pos/neg)”Base graph is Interface – Traffic (bits/sec) (pos/neg) on page 21. The aggregate showsthe same host twice, once named “gandalf-wlan” and once “localhost (127.0.0.1)”.This graph looks quite the same as Interface – Traffic (bits/sec) (peak) on page 21,except for the missing peaks. Referring to the discussion above, this eases the “Convertto AREA/STACK” solution.We will use quite the same parameter set as in Using “Interface – Traffic (bits/sec)Illustration 23: Convert to AREA/STACK Graph, No Totals, No ReorderingUsage Guide( default)” on page 23. You will expect a quite similar result. And yes, the onlydifference is that the output related data is drawn on the negative y-axis. Even thetotaled output LINEx is automagically printed on the lower half.Using “Interface – Traffic (bits/sec) (pure LINE)”Base graph is Interface – Traffic (bits/sec) (pure LINE) on page 22. The aggregateshows the same host twice, once named “gandalf-wlan” and once “localhost(127.0.0.1)”.Convert to AREA/STACK Graph, No Totals, No ReorderingThis serves as an example how to convert a plain LINEx graph to AREA/STACK. Thisresults inIllustration 24: Convert to AREA/STACK Graph, Print all Legend Items, Total Similar Data Sources, ReorderUsage GuideConvert to AREA/STACK Graph, Print totaling Legend Items Only, Total Similar DataSources, No ReorderingThis example shows a “totaling only” aggregate. Especially when aggregating manyitems, the legend may rise and the graph area may look confusing.The option to use is “Print Totaling Legend Items Only”. This will not draw the basicitems used for the aggregate.This graph seems to include too many items. You are expecting to find totaling itemsonly, do you?But this won't work. “Total Similar Data Sources Nodups” requires, that the items to beIllustration 25: Convert to AREA/STACK Graph, No Totals, No ReorderingIllustration 26: Convert to AREA/STACK Graph, Print totaling Legend Items Only, Total Similar Data Sources, No ReorderingUsage Guidetotaled are present! AGGREGATE therefor does not skip them. It uses the “MAKE 0”CDEF to suppress the data that would else be printed on the graph area.As a conversion too AREA/STACK is requested, the totals are printed as STACKs.Those STACKs are based on the first AREA, that has been CDEFed to 0. All in all youget what you want.CaveatsHere's a small compilation of selectable parameters that won't make sense due to various reasons mentioned below.No.Graph Type Conversion Totaling TotalTypeReordering Remarks1AREA + LINE Keep GraphTypesAny Any Any AREAs overlap; e.g. only last AREA may be visible2Any Any Print totalingLegend ItemsOnly Any Any Reordering has no visible effect when totaling entries are theonly one printed.3AREA + STACK Keep GraphTypes Any Any by data source Two or more AREAs will appear; they again will overlap. TheSTACKed items will be stacked onto the last AREA, not ontothe “related” AREA. This is how RRDTool works.4AREA + STACK Keep GraphTypes Print allLegend ItemsAny by data source At least one totaling LINE1 will drawn in between normalentries. All STACKed entries shwoing up after this totalingLINE1 will be stacked onto that very LINE1, not onto the“related” AREA.5AREA, STACK + LINEx Convert toAREA/STACKPrint totalingLegend ItemsOnlyAny No This type of graph is e.g. used when graphing A VERAGE andMAX in one template. The conversion will change the LINExto STACK which may not be what you want. Consider usingconversion type “Keep Graph Types”6AREA (pos) +AREA (neg)Keep GraphTypesAny but “PrinttotalingLegend ItemsOnly”Any Any AREA is drawn on positive and negative y-axis. Withoutconversion of graph type, the AREAs will overlap; see item 3.When “Print totaling Legend Items Only” is chosen, this maystill make sense.The Cacti GroupAggregate Plugin Version 0.75Usage GuideA Word on CDEFsWell, until now everything seems to be quite straightforward. CDEFs were alreadymentioned in Chapter “Modifying the Default Traffic Graph Templates“. What's wrongwith them?When aggregating graph items, this is more or less beading them one after another,mostly just as they are in the selected graphs. Then, there is some color magic, skippingcode, prefixing text and <HR> stuff.But totaling is worse, much worse. The graph items themselves do not require anychange. But the totaling line requires a CDEF that holds something like“TOTAL_ALL_DATA_SOURCES_NODUPS” or“SIMILAR_DATA_SOURCES_NODUPS” where currently“CURRENT_DATA_SOURCE” is listed.So this plugin generates new CDEFs. It fetches the CDEF from the original graph itemand resolves it to plain text. Then, depending on the totaling action selected,“CURRENT_DATA_SOURCE” is replaced by the totaling magic required.Now we have a new CDEF. To avoid storing duplicate CDEFs, all existing CDEFs noware scanned and compared to the new CDEF. On match, the existing CDEF is used. Ifno match is found, the new CDEF is stored.The title of the new CDEF is taken from the original CDEF, but a string is prepended.Either “_AGGREGATE ALL “ or “_AGGREGATE SIMILAR” is used to distinguish.The underscore is used for sake of sorting them to the bottom of the CDEF list.This is a list of all CDEFs on my system after quite a lot of aggregation:Usage GuideTotaling CDEFsCDEF Title CDEF_AGGREGATE ALL Turn Bytes into Bits ALL_DATA_SOURCES_NODUPS,8,_AGGREGATE ALL Turn Bytes into bits,make negativeALL_DATA_SOURCES_NODUPS,8,*,-1,*_AGGREGATE SIMILAR Multiply by -1024SIMILAR_DATA_SOURCES_NODUPS,-1024,*_AGGREGATE SIMILAR Multiply by 1024SIMILAR_DATA_SOURCES_NODUPS,1024,*_AGGREGATE SIMILAR Turn Bytes into Bits SIMILAR_DATA_SOURCES_NODUPS,8,_AGGREGATE SIMILAR Turn Bytes into bits, make negative SIMILAR_DATA_SOURCES_NODUPS,8,*,-1,*Illustration 27: Complete list of CDEFsUsage GuideMake 0 CDEFAnother special CDEF is the “Make 0” CDEF. When you want totals only, we need aspecial treatment of “original data source” that you don't want to see.For the totaling magic, you will need the “DEF” statements created by cacti when usingthe “original data source”. But you don't want to have them printed. This sounds like aninconsistency. Butt it can be resolved by applying a CDEF that renders all data to 0.This can be achieved byCDEF Title CDEF_MAKE 0CURRENT_DATA_SOURCE,0,*Usage GuideCaveat when using different Graph TemplatesIn previous version of AGGREGATE, there was no verification of graph templates used. This may lead to buggy graphs, because always the first graph is used as a model for all other graphs. Thus, if the first graph as eight items (default traffic graph template) and the second one has eleven (95th percentile traffic template), funny things will happen.To prevent this, AGGREGATE now checks the templates used for the graphs. See example below.In this example, I purposely made a mistake. The result screen will be as followsIllustration 28: Erraneously selected graphs using different templatesIllustration 29: Error response when choosing wrong graphs。
Cacti端口流量合并图

技术员工职责2014年12月25日15:24运维工作:1.服务器上下架。
服务器上架:●记录上架服务器信息:记录客户服务器型号、SN、IP、所在机柜、所在机柜U位、客户名称、客户服务器对应我方交换设备端口。
●服务器上架通知发送邮件到经营数据中心:包含内容:客户名称、客户上架服务器信息、客户服务器上架时间、是否加电、是否开通网络。
●更新设备管表。
服务器下架:●服务器下架要有销售人员的书面流程单通知。
●记录下架人员的信息及下架服务器的信息,并发下架通知给相关的负责人员。
●更新设备管理表。
对于客户资源有变更的,要填写资源变更表,每周五的下午发邮件给经营数据中心。
2.服务器系统安装。
●服务器系统安装要有客户的确认。
注:windows系统必须由客户提供(版权问题)●客户需要提供服务器所安装系统信息,系统版本、系统盘、服务器分区信息。
●系统安装完成后需和客户进行确认:服务器是否可以远程连接,服务器的系统安装是否符合要求。
3.系统密码恢复●需要客户发邮件进行确认才可以进行相关的系统层面的操作。
操作要按客户要求来做,客户发送的邮件中需注明免除我方操作人员的责任。
4.进出机房工单处理。
●客户公司的授权人可以直接申请进入机房维护,可以给其办理相应的进出机房手续,非授权人进出机房需要进行邮件确认或授权的人通知。
●服务器上下架工单需要进行书面流程单的确认。
5.机房设备定期清点。
●技术部门实行对设备的定期清点,清点周期为每月一次,月末提交清点情况。
6.机房设备定期巡检。
●对北京机房的设备进行定期的巡检,并形成报告,提交给相应的客户经理。
主要记录服务器硬件报警信息。
巡检报告详见附件7.资产登记。
●对公司内部资产进行登记管理。
8.布线。
●按客户要求进行布线,网线两端要有必要的标示:标示由机柜编号、设备编号、设备端口号组成。
9.设备迁移。
●按客户要求,将服务器迁移至客户指定地点,中间运输环节要同客户进行确认。
如需快递-需同客户确认快递的基本信息(收件人,收件地址,保价多少,是否打木架……)后续确认快递信息表,请后客户填写,并盖章后,传真或扫描邮件给销售。
Cacti修改采集精度为1分钟
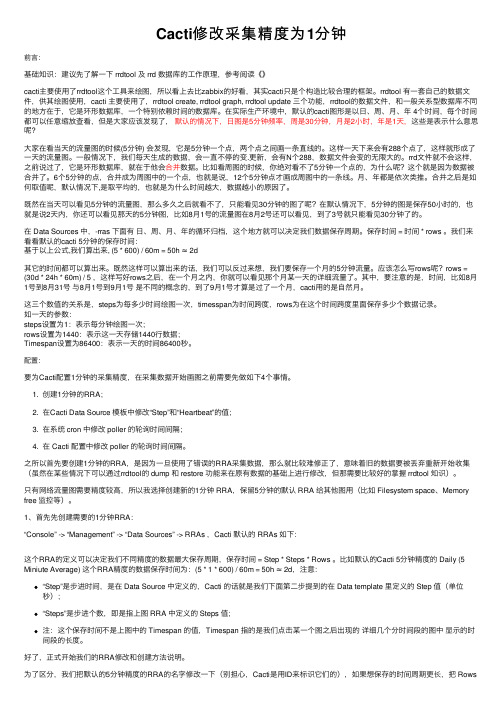
Cacti修改采集精度为1分钟前⾔:基础知识:建议先了解⼀下 rrdtool 及 rrd 数据库的⼯作原理,参考阅读《》cacti主要使⽤了rrdtool这个⼯具来绘图,所以看上去⽐zabbix的好看,其实cacti只是个构造⽐较合理的框架。
rrdtool 有⼀套⾃⼰的数据⽂件,供其绘图使⽤,cacti 主要使⽤了,rrdtool create, rrdtool graph, rrdtool update 三个功能,rrdtool的数据⽂件,和⼀般关系型数据库不同的地⽅在于,它是环形数据库,⼀个特别依赖时间的数据库。
在实际⽣产环境中,默认的cacti图形是以⽇、周、⽉、年 4个时间,每个时间都可以任意缩放查看,但是⼤家应该发现了,默认的情况下,⽇图是5分钟频率,周是30分钟,⽉是2⼩时,年是1天,这些是表⽰什么意思呢?⼤家在看当天的流量图的时候(5分钟) 会发现,它是5分钟⼀个点,两个点之间画⼀条直线的。
这样⼀天下来会有288个点了,这样就形成了⼀天的流量图。
⼀般情况下,我们每天⽣成的数据,会⼀直不停的变.更新,会有N个288,数据⽂件会变的⽆限⼤的。
rrd⽂件就不会这样,之前说过了,它是环形数据库,就在于他会合并数据。
⽐如看周图的时候,你绝对看不了5分钟⼀个点的,为什么呢?这个就是因为数据被合并了。
6个5分钟的点,合并成为周图中的⼀个点,也就是说,12个5分钟点才画成周图中的⼀条线。
⽉、年都是依次类推。
合并之后是如何取值呢,默认情况下,是取平均的,也就是为什么时间越⼤,数据越⼩的原因了。
既然在当天可以看见5分钟的流量图,那么多久之后就看不了,只能看见30分钟的图了呢?在默认情况下,5分钟的图是保存50⼩时的,也就是说2天内,你还可以看见那天的5分钟图,⽐如8⽉1号的流量图在8⽉2号还可以看见,到了3号就只能看见30分钟了的。
在 Data Sources 中,-rras 下⾯有⽇、周、⽉、年的循环归档,这个地⽅就可以决定我们数据保存周期。
基于Cacti的校园网络流量监控平台的实现
旦 出现配线 间内设备故障 ,将直接影 响
M o io , S so n t r y l g,W e t e ma ah r p, Re h me ai ,
r i e Mo i A gea o ma e e pc e 户人数越 来越多 ,目前学校校 园网上 网用 网络运行状态 。这 就需要对 网络配线 问内 E rr g , bl, grgt以及 A ah ,
设备共计 1 0 台 , 2余 其中 Cso6 0 核心交 i 5 9 c
本监 控平 台根据校 园网络 的实 际环境
换机一 台 ,汇聚交换机 2 台 ,接入 交换 机 和应 用 特 点 ,运用 开 源 的 网络监 测 软件 1
主机” 选项 , 进入 主机列表 窗 口, 选择 “ 添 17 , 0 台 如何保障 网络 的畅通无误 , 实时了 C ci 台 自行建立 了一套实用 的网络监控 “ at 平
远离 网络管理 中心 , 配线 问内 CACTI MYS 经过几年信息 化建 设 ,天津音乐学 院 间的配线问 , 、 QL、APACHE、PHP、 网络规模 的发 展越 来越快速 ,I P网络结构 设 备运行 参数 常年处 于无人 查看 的状态 , RRD OOL、N T S T E — NMP 集 成 T od, 。 hl 体 系也更加庞大 ,网络设备及 网络使用 用
4小 户数 达到 近 4 0 0 0人 ,上 网信息点 数达 到 设 备 实 施 7X 2 时 监 测 。 4 2 个 ,校 园 网覆 盖 教 学 区 、办公 楼 、琴 50
S ud F , gn , S L q i, 5 N ix MY Q 等模板 。 支持 多
4 对 网络设备历史运行状态信息 、历 种硬盘控制器和 阵列卡 , . 基于 C n S , e t 6 启 O
cacti流量监控原理

cacti流量监控原理
Cacti是一种用于监控网络设备和服务器流量的开源图形管理
工具。
它的原理如下:
1. 数据采集:Cacti通过SNMP(简单网络管理协议)从网络
设备和服务器中获取数据。
SNMP是一种用于监控和管理网络设备的标准协议,它允许Cacti获取关于设备的各种信息,包
括流量数据。
2. 数据存储:Cacti使用RRDtool(Round-Robin Database Tool)进行数据存储。
RRDtool是一种用于存储和绘制时间序列数据
的工具,它可以按照固定大小的间隔存储数据,并自动绘制图形。
Cacti将从网络设备和服务器收集到的流量数据存储到
RRD数据库中。
3. 图形绘制:Cacti使用RRDtool将存储在RRD数据库中的流
量数据绘制成图形。
这些图形可以帮助管理员了解设备和服务器的流量使用情况,并根据需要进行调整和优化。
4. 趋势分析:Cacti可以对历史流量数据进行分析,识别出潜
在的问题和趋势。
管理员可以通过观察这些趋势来做出合理的决策,例如增加带宽、优化网络设备配置等。
总的来说,Cacti的流量监控原理是通过使用SNMP获取流量
数据,使用RRDtool进行数据存储和图形绘制,以及通过趋
势分析来帮助管理员了解和优化网络设备和服务器的流量使用情况。
cacti监视华为防火墙的性能指标

防火墙的3大性能指标如何用cacti监控呢,现在给出例子1)会话数2)会话新建速率3)吞吐量如华为E8000的总会话数查询先用snmpwalk遍历测试。
1。
3。
6。
1。
4。
1。
2011。
6.122.15。
1.2.1.4 的返回值发现实际的OID值是:。
1。
3。
6。
1。
4.1。
2011。
6.122。
15。
1.2。
1.4.0注意:因为cacti用snmpget取值,所以最后要用snmpget测试。
1。
3。
6。
1.4。
1.2011.6。
122.15.1。
2。
1。
4.0会话数和新建会话速率绘图步骤如下:一、新建数据模板所以在数据模板里新建一个数据输入:1)名称:随意2)数据源内部名称:随意3)选择数据类型是GAUGE填写OID是真实返回值,一定要完整.如华为文档是.1。
3。
6。
1.4.1。
2011。
6。
122。
15.1。
2。
1.4,但实际返回值是。
1。
3。
6。
1。
4.1。
2011.6.122.15.1。
2.1。
4.0 , 这个".0”千万不能漏.注意:因为cacti用snmpget取值,所以最后要用snmpget测试.1。
3。
6.1.4。
1.2011。
6。
122.15。
1。
2.1。
4。
0 是否能正常取值。
华为防火墙常用的性能指标的OID如下:华为(HW)防火墙的mib 库参考1)HUAWEI 防火墙Eudemon8000E 防火墙V300R001 MIB参考:2)HUAWEI 防火墙Eudemon200E Eudemon1000E-X V300R001 MIB参考二、新建图形模板目标:在一个图里显示总会话数,TCP会话数,UDP会话数3个会话数指标先按照步骤一建立3个数据模板来取总会话数、TCP会话数,UDP会话数。
各个分解步骤如下1、新建图形模板名称填:HW-FW—Session 自己随意取得标题填:|host_description|—防火墙会话数,这里|host_description| 相当于1个变量,是主机的名字。
网络监控工具Cacti安装配置指南

安装步骤 - 配置IIS支持PHP
安装步骤 - 配置IIS支持PHP
对于Windows 2003,需要额外配置。
打开php ISAPI支持。 cmd.exe的执行权限赋给IUSR_<机器名>。
安装RRDTool和Net-SNMP
将下载的RRDTool解压缩到c:\rrdtool文件夹。 如果是源码版,请将c:\rrdtool\src\tool_release下 的rrdtool.exe复制到c:\rrdtool文件夹。
网络监控工具Cacti 安装配置指南
EAS产品支持部 陈钧 金蝶软件(中国)有限公司
导读
摘要
Cacti是一个免费开源的系统监控工具,能够持续监控服 务器、网络设备、以及其他支持SNMP等管理协议的设 备,采集包括CPU、内存、存储、操作系统等信息,并 以图表方式直观展现。便于管理员掌握系统的整体运行 情况,及时发现异常并做出处理。
Cacti 参考
/ / / / /
谢 谢!
谢谢!
特别声明
Cacti功能介绍 - 工具间关系
站点展示
数 据
调度 本 HP 脚 据 P 通过 集数 收
计 图 形
Cacti
存储Cacti配置信息
收
集 的 储
绘 制
存
统
Cacti功能介绍
Cacti安装步骤 - 需要的软件
RRDTool 1.0.48 Php5.0 MySQL 4.0 Net-SNMP 5.2 Cacti 0.8.6g
$database_default = "cacti"; $database_hபைடு நூலகம்stname = "localhost"; $database_username = "cactiuser"; $database_password = "cacti";
Cacti FAQ
/article/cacti/cactifaq/我的Cacit的FAQ(非官方的FAQ)。
以后有CACTI的问题请先参考本FAQ。
一、全局:1、什么是CACTI?它有什么用?2、cacti的官方网站在哪里?3、在哪里下载?4、怎么安装它呢?5、使用cacti需要什么知识?6、找不到snmpwalk和snmpget命令?二、使用:1、为什么图像不能显示?2、为什么rra目录下什么都没有?3、为什么能取到流量的数据但取不到CPU和内存的数据?4、可以取到本机(linux)的数据,但却不能取到远程主机的数据?5、我以前用MRTG进行流量的监测,是否可以将MRTG中的数据导入到Cacti中呢?6、为什么我的流量达到100M以上图像就不准呢?7、09/02/2005 02:59:58 PM - POLLER: Poller[0] Maximum runtime of 296 seconds exceeded. Exiting,什么意思?8、怎么备份Cacti和它的数据呀?9、如何将数据合并?如何自定义脚本?10、使用monitor、threshld插件11、为什么月、年的流量图下面的字母乱码?12、cacti是否支持中文?13、新建的device的Data Query里面的状态总是“ Success [0 Items, 0 Rows]”?一、全局:1、什么是CACTI?它有什么用?cacti是一套PHP程序,它运用snmpget采集数据,使用rrdtool绘图。
使用Cacti 能统计网络设备的流量、CPU、系统负载等参数,也可以自定义监测的指标。
2、cacti的官方网站在哪里?3、在哪里下载?/download_cacti.php4、怎么安装它呢?官方的安装文档:/documentation.php我写的安装文档:/cacti/installcacti/或者:/viewthread.php?tid=5940195、使用cacti需要什么知识?需要具有一定的使用net-snmp和rrdtool的知识。
CACTI交换机端口流量监控

一.引言随着网络规模的不断扩大,作为校园网络管理和维护人员,已经不能用传统的方式对网络进行管理。
以前网络规模小,故障少,处理简单,现在网络日益复杂化,问题层出不穷。
要做到更好地管理网络,需要借助一些管理软件对网络进行实时的监控。
通过查看监控数据,做到预先了解情况,掌握情况,当出现问题时,在监控数据的指导下可以很快地解决问题。
二.关键字Cacti,网络监测,网络管理,流量分析,流量监控,数据采集。
三.摘要随着网络的广泛应用,作为维护网络安全的网络监测系统在其中发挥着重要作用。
它不仅能够帮助网络管理人员及时了解网络状态,还能监测网络故障,维护网络正常稳定运行。
但是,信息技术的飞速发展,使网络规模不断扩大,结构日趋复杂,安全形势日益严峻。
这些因素的存在增加了开发网络监测系统的成本。
开源网络监测软件以其源码开放、资源丰富的优势,越来越受到网络管理人员的青睐。
本文立足于园区网络,以开源网络监测软件Cacti为基础,搭建园区网络监测系统。
通过对开源网络监测软件Cacti的二次开发,实现可以满足自身园区需求的网络监测系统。
在详细分析了Cacti的架构原理、工作流程和扩展方式的同时,也丰富了Cacti的报警方式,增加了短信报警、声音报警功能;进而完善了Cacti的数据存储方式,以及利用关系型数据库对采集到的性能数据进行持久性保存;更进一步提出了楼宇间配线间环境参数的采集方案,绘制出全网网络气象图,并对全网流量状态进行更直观的监测。
在系统实现的过程中,使用SNMP协议进行网络状态数据的采集,利用Cacti的插件架构扩展(Cacti-Plugin-Arc),实现了网络气象图功能、邮件报警功能;通过NET-SNMP 开发包实现基于AgentX协议的代理功能,对不支持SNMP协议的网络设备实施有效监测;通过编写Shell脚本调用短信发送工具Fetion Robot,实现短信报警功能。
综上所述,本系统基于开源网络监测软件Cacti实现了对园区网络的有效监测,即节约了开发成本,又缩短了软件开发周期,为开发园区网络监测系统的实际应用提供了基于开源软件的解决方案。
Cacti如何解决图形显示不能超过30G的问题
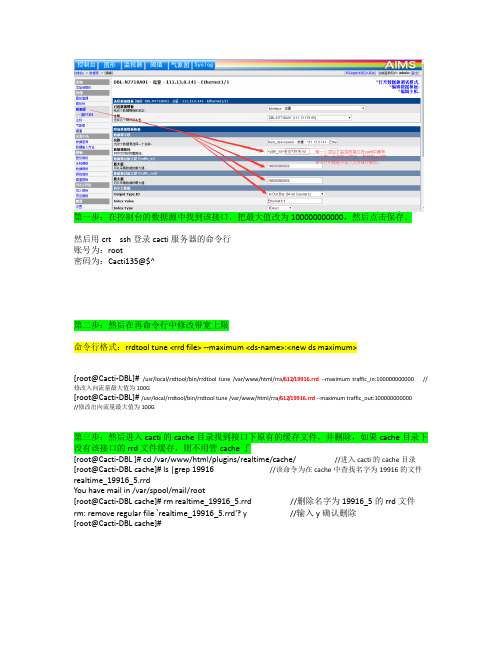
第一步:在控制台的数据源中找到该接口,把最大值改为100000000000,然后点击保存。
然后用crt ssh登录cacti服务器的命令行账号为:root密码为:Cacti135@$^第二步:然后在再命令行中修改带宽上限命令行格式:rrdtool tune <rrd file> --maximum <ds-name>:<new ds maximum>[root@Cacti-DBL]# /usr/local/rrdtool/bin/rrdtool tune /var/www/html/rra/612/19916.rrd--maximum traffic_in:100000000000 //修改入向流量最大值为100G[root@Cacti-DBL]# /usr/local/rrdtool/bin/rrdtool tune /var/www/html/rra/612/19916.rrd --maximum traffic_out:100000000000//修改出向流量最大值为100G第三步:然后进入cacti的cache目录找到接口下原有的缓存文件,并删除,如果cache目录下没有该接口的rrd文件缓存,则不用管cache了[root@Cacti-DBL ]# cd /var/www/html/plugins/realtime/cache/ //进入cacti的cache目录[root@Cacti-DBL cache]# ls |grep 19916 //该命令为在cache中查找名字为19916的文件realtime_19916_5.rrdYou have mail in /var/spool/mail/root[root@Cacti-DBL cache]# rm realtime_19916_5.rrd //删除名字为19916_5的rrd文件rm: remove regular file `realtime_19916_5.rrd'? y //输入y确认删除[root@Cacti-DBL cache]#。
基于cacti+ntop的网络流量监控系统
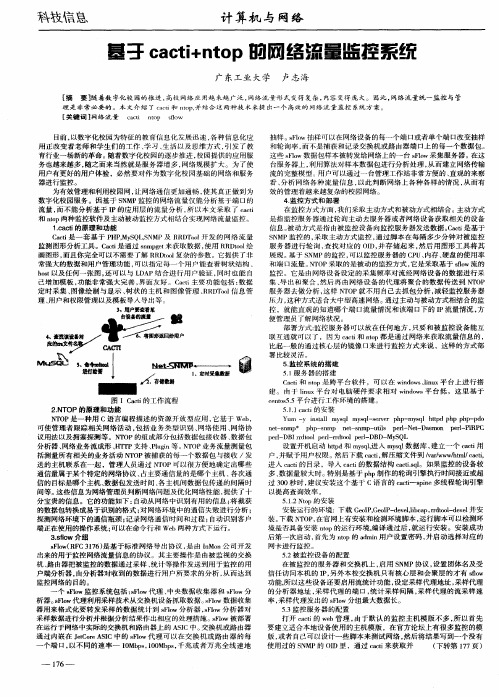
抽样。slw抽样可 以在 网络设备的每一个端 口或者单个端 口改变抽样 Fo 和轮询率 , 而不是捕获 和记 录交换机或路 由器端 口上 的每一个数据包 。 这 些 sl Fo w数 据 包 样 本 被 转 发 给 网络 上 的一 台 sl Fo w采 集 服 务 器 。在 这 台服务器上 , 利用算法对样本数据包进行分析处理 , 从而建立 网络传输 流 的 完 整模 型 。 户 可 以通 过 一 台 管理 工作 站 非 常 方 便 的 、 观 的来 察 用 直 看、 分析 网络各种流量信息 , 以此判断网络上各种各样 的情 况 , 从而有
科技信息
计 算机 与 网络
基 孑 c c in o a t t p的 网 络 流 量监 控 系 统 +
广 东工 业 大学 卢志海
[ 摘 要] 随着数字化校 园的推进 , 高校网络 应用越 来越广泛 , 网络 流量形 式变得复杂 , 内容变得 庞大。因此 , 网络流量统一监控与管
cci no so at tp f w l 理 是 非 常 必要 的 。本 文介 绍 了 cc ’ d和 no , 结 合 这 两种 技 术 来提 出一 个 高 效 的 网络 流量 监 控 系统 方 案 。 a tp并 [ 键词 ] 关 网络 流 量
5监控 系统 的 搭 建 . 51服 务 图 1 C c 的工 作 流 程 at i 2N OP 的原 理 和 功 能 .T N0 T P是 一 种 用 C语 言 编 程 描 述 的 资 源 开 放 型 应 用 , 基 于 We , 它 b
C c 和 no at i t p是跨平 台软件 ,可 以在 wn o sl u 台上进 行搭 idw 、n x平 i 建 。 由 于 l u 平 台 对 电脑 硬 件 要 求 相 对 wn o s 台 低 ,这 里 基 于 ix n idw 平 cno55平 台 进行 工 作 环 境 的 搭 建 。 ets. 511 at的 安 装 ..cci
基于Cacti实现广电多业务网络流量监控的成功探索

I mpl e me nt at i o n o f Ra d i o a nd Te l e v i s i o n Mu l t i Se r v i c e Ne t wo r k Tr a ic f Mo ni t o r i ng b a s e d o n Ca c t i 口 XI A Re n — h u i
电行业 自身物理 网络 实际 的新业 务 。多种新 业务 的推 进, 促进 了广 电 自身从 传 统 有 线 电视 网络 运 维 向多 业 务 网络运 营 商 的角 色 转 变 ¨ 。初 为 网 络 运 营 商 的广 电部 门 , 必 然有许 多 先天 的不足 , 但是 我们可 以向在市 场上 立足 多年 的 国内优 秀 的 网 络运 营 商学 习 , 借鉴 他
《 中国有线 电视} 2 0 1 3 ( 1 1 )
CHI NA DI GI TAL CABLE T V
Cacti端口流量合并
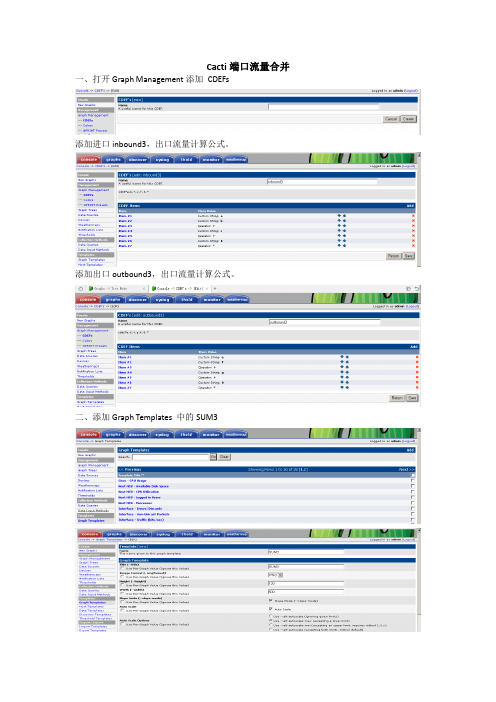
Cacti端口流量合并一、打开Graph Management添加CDEFs
添加进口inbound3,出口流量计算公式。
添加出口outbound3,出口流量计算公式。
二、添加Graph Templates 中的SUM3
三、添加Graph Template Items,按照如下操作,添加三个Item用来添加3个物理端口
添加进口的第四个Item是前三个端口流量的总量(SUM3),添加进口的第五个设置Graph Item Type为LEGEND.
同上添加出口的3相同个Item
添加出口第四个Item是前三个端口流量的总量(SUM3),添加出口的第五个设置Graph Item Type为LEGEND.
添加Graph Iitem Inputs
Filed Type中每个Iitem将会添加一个物理口的in方向或者out方向,所以需要添加6个Item 执行3个物理端口的流量合并。
如上添加6个Input,其中Item加重色的第四个为进口SUM,最后一个为出口SUM,后三个out_bound,添加如下:
添加完成:
四、展开Graph Templates Selection添加Graph Templates Selection
修改:CDEFs中没有字d报错,将G去掉更改为d。
如上,SUM3中添加3个物理端口的两个方向,SUM3端口合并完成之后。
Cacti流量图汇聚制作方法说明
Cacti流量图汇聚制作方法说明
为了统计流量方便,我们经常需要做流量图汇聚图形,从2个口子到多个口子汇聚不等,下面介绍一下汇聚图的制作方法:
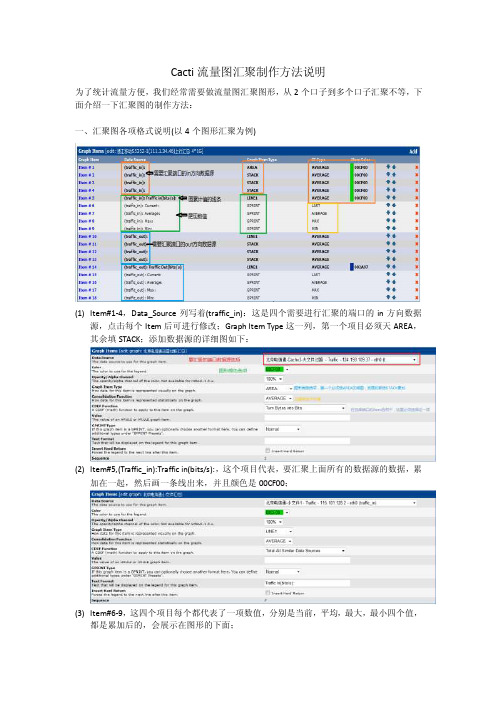
一、汇聚图各项格式说明(以4个图形汇聚为例)
(1)Item#1-4,Data_Source列写着(traffic_in):这是四个需要进行汇聚的端口的in方向数据
源,点击每个Item后可进行修改;Graph Item Type这一列,第一个项目必须天AREA,其余填STACK;添加数据源的详细图如下:
(2)Item#5,(Traffic_in):Traffic in(bits/s):,这个项目代表,要汇聚上面所有的数据源的数据,累
加在一起,然后画一条线出来,并且颜色是00CF00;
(3)Item#6-9,这四个项目每个都代表了一项数值,分别是当前,平均,最大,最小四个值,
都是累加后的,会展示在图形的下面;
二、使用模板创建流量汇总图
(1)先在cacti的Import Templates中倒入汇聚图模板,我做了2端口到6端口的汇聚模
板,如果需要更多端口的,请自行制作;(导入一次就可以了)
(2)点击Console界面中的Graph Management选项,右上角Add后出现如下界面:
(3)不用修改任何选项,两个都是None,然后点击Create;
(4)选择你所需要的汇总图模板,是几个端口汇总就选哪个;
(5)选择好后,在Title里面写上这个图的名字,然后点击右下角的Create:
(6)上一步完成后,将出现如下界面,在这个界面中,再把模板选择改回None,然后
点击Save;
(7)保存后,就会出现一个4GE的汇总图模板,再根据你想汇聚的端口,修改相应的Item
项就可以了;。
cacti流量监控的安装和设置
Cacti的安装1.安装环境:RedHat AS 42.安装Apache、MySQL、PHP(1).安装MySQL下载地址:/downloads/mysql/5.0.html//查看系统中是否已经安装了MySQL,如果是卸载所有以mysql开头的包。
# rpm –qa | grep mysql# rpm –e mysql-*//查找/etc/f(MySQL的选项配置文件),如果有请删除它,以免影响新安装版本的启动。
# rm –f /etc/f# tar –zxvf mysql-standard-5.0.27-linux-i686-glibc23.tar.gz# cp –rf mysql-standard-5.0.27-linux-i686-glibc23 /usr/local///建立符号链接,如果以后有新版本的MySQL的话,你可以仅仅将源码解压到新的路径,然后重新做一个符号链接就可以了。
这样非常方便,数据也更加安全。
# ln –s mysql-standard-5.0.27-linux-i686-glibc23 /usr/local/mysql//添加用于启动MySQL的用户及用户组(如果以前安装过MySQl,用户及用户组可能已存在)。
# useradd mysql# groupadd mysql//初始化授权表# cd /usr/local/mysql# scripts/mysql_install_db//修改MySQl目录的所有权# cd /usr/local# chgrp –R mysql mysql-standard-5.0.27-linux-i686-glibc23# chgrp –R mysql mysql# chown –R mysql mysql-standard-5.0.27-linux-i686-glibc23/data# chown –R mysql mysql/data# ln –s /usr/local/mysql/bin/* /usr/local/bin///启动Mysql# bin/safe_mysqld --user=mysql &//配置系统启动时自动启动MySQl# cp support-files/mysql.server /etc/rc.d/init.d/mysqld# chkconfig --add mysqld//修改MySQL的最大连接数# vi /etc/f//添加以下行set-variable=max_connections=1000set-variable=max_user_connections=500set-variable=wait_timeout=200//max_connections设置最大连接数为1000//max_user_connections设置每用户最大连接数为500//wait_timeout表示200秒后将关闭空闲(IDLE)的连接,但是对正在工作的连接不影响。
Cacti做出入方向的流量汇总图(超详细)

Cacti做出⼊⽅向的流量汇总图(超详细)Cacti做出⼊⽅向的流量汇聚图步骤:1.新建CDEF,添加汇总相似数据源功能2.新建图像,添加各数据源Traffic out :Datasource-out1 + Line1 + Turn Bytes into Bits + Color:NoneDatasource-out2 + Line1 + Turn Bytes into Bits + Color:None……Datasource-out(n) + LINE1 + Total All Similar Data Sources,Turn Bytes Into Bits + Color:0000FFDatasource-out(n) + LEGEND+ Total All Similar Data Sources,Turn Bytes Into BitsTraffic in :Datasource-in1 + STACK + Turn Bytes into Bits + Color:NoneDatasource-in2 + STACK + Turn Bytes into Bits + Color:None...Datasource-In(n) + STACK + Total All Similar Data Sources,Turn Bytes Into Bits + Color:00FF00Datasource-in(n) + LEGEND + Total All Similar Data Sources,Turn Bytes Into Bits 详细操作:(⼀)新建CDEF:Total All Similar Data Sources,Turn Bytes Into Bits我的Cacti是中⽂版的,需要先添加CDEFs函数,进⼊⽬录如下图。
我的Cacti原来⾥⾯已经建有了⼀个Total All Data Sources的函数,中⽂名称是“汇总所有数据源,转换字节⾄位”。
- 1、下载文档前请自行甄别文档内容的完整性,平台不提供额外的编辑、内容补充、找答案等附加服务。
- 2、"仅部分预览"的文档,不可在线预览部分如存在完整性等问题,可反馈申请退款(可完整预览的文档不适用该条件!)。
- 3、如文档侵犯您的权益,请联系客服反馈,我们会尽快为您处理(人工客服工作时间:9:00-18:30)。
CACTI流量合并
一.创建一个计算公式(CDEF),主要用于计算两台机器的流量图合并后数据:
1.点击 "Management"——"Graph Management"——"CDEFs" 一栏
2.点击右边窗口中"CDEF's"栏最右边的"Add",增加一个新的CDEF项名为:Turn All
Data into Bits,名称可以随你喜欢
3.然后add三个item,作用就是把统计出来的数据乘上8,然后显示出来:
保存后结果如下:
二.合并流量图:
创建空白图:打开 "Management"——"Graph Management" 一栏,点击右边的“add”
出现下面的图,不用选择模板和主机,直接create:
Title写合并项目名:erp
合建:
添加多台机器的网卡流量图:
点击add,选择要添加的HOST机,data template:选择网卡流量interface-traffic,graph item type 这个选项,第一台添加要先area,CDEF Function这个选项,选more network data:
接着添加第二台:添加graph item type要选stack,意思是叠加上去
汇总流量:
添加图形下面的统计数据
继续添加,添加统计数据graph item type都是应用GPRINT,CDEF都是应用我们创建的新算法
三.
四.。
