商务统计学Ch01
商务统计知识点总结

商务统计知识点总结一、数据的搜集和整理商务统计的第一步是对数据进行搜集和整理。
数据可以分为定量数据和定性数据。
定量数据是指可以用数字来表示的数据,比如销售额、利润等。
定性数据是指无法用数字来表示的数据,比如产品质量、客户满意度等。
在搜集和整理数据时,需要注意数据的来源、准确性和完整性等问题。
为了保证数据的准确性,可以采用抽样调查的方法,通过对部分样本进行调查,来推断整体的情况。
二、数据的分析和解释数据的分析和解释是商务统计的核心内容。
在数据分析中,需要使用一些统计方法,比如平均值、标准差、相关系数等,来对数据进行量化描述。
此外,还可以使用图表来对数据进行可视化呈现,比如柱状图、折线图等。
通过数据的分析和解释,可以得出一些结论,帮助商务决策者做出正确的决策。
三、市场分析市场分析是商务统计中的一个重要内容。
通过对市场规模、市场结构、市场需求等方面的数据进行统计分析,可以帮助企业了解市场的潜在机会和威胁,从而做出正确的市场分析和预测。
四、产品分析产品分析是商务统计中的另一个重要内容。
通过对产品销售额、销售成本、产品质量等方面的数据进行统计分析,可以帮助企业了解产品的市场表现和竞争力,从而做出正确的产品决策。
五、客户分析客户分析是商务统计中的一个重要内容。
通过对客户购买习惯、购买偏好、客户满意度等方面的数据进行统计分析,可以帮助企业了解客户的需求和反馈,从而做出正确的市场营销决策。
六、风险分析风险分析是商务统计中的一个重要内容。
通过对市场风险、产品风险、经营风险等方面的数据进行统计分析,可以帮助企业了解风险的大小和影响,从而做出正确的风险管理决策。
七、决策分析决策分析是商务统计中的最终目的。
通过对上述各种数据进行统计分析,可以帮助企业决策者做出正确的商务决策,比如产品定价、市场拓展、营销策略等。
总之,商务统计是一门非常重要的学科,它通过对数据的搜集、整理和分析,帮助企业了解市场、产品和客户等方面的情况,从而做出正确的商务决策。
教学课件 商务统计学(第5版)

样本 数据 (Xi) : 10 12 14 15 17 18 18 24
n=8
平均数 = X = 16
S (10 X)2 (12 X)2 (14 X)2 (24 X)2 n 1
(10 16)2 (12 16)2 (14 16)2 (者个人已经发布的数据。 • 可以设计一个实验来获得必要的数据。 • 可以进行调查。 • 可以通过观察研究的方式。
Chap 1-14
数据的类型
▪ 属性变量(categorical variables)(也称为 定性变量(qualitative variables))给出定 性的回答,比如是或者不是。
全距 = 120 - 1 = 119
Chap 3-34
变异程度的度量:方差
• 观察值相对其算术平均数的离差平方和
– 样本方差:
n
(Xi X)2
S2 i1 n-1
其中
X= 算术平均数
n = 样本容量 Xi = 变量X 的第i个观测值
Chap 3-35
变异程度的度量:标准差
• 变异程度最常用的度量 • 显示与平均数的变异程度 • 方差的平方根 • 与原始数据有相同的单位
Chap 1-16
连续的
例子: 重量 电压
(衡量特征)
统计学使用的电脑程序
• Minitab
– 进行统计分析的统计包 – 用来进行尽可能精确的统计分析
• Microsoft Excel
– 多种功能的数据分析工具 – 有多种功能,但是每一种都没有其他程序那样专注
• Minitab和Excel都用工作表来存储收集来分析的数据
统计学的类型
• 统计学
• 将数字转化为对决策者有用信息的数学的分支。
商务统计章节知识点总结

商务统计章节知识点总结第一章:统计学基础概念1.1 统计学的概念和作用统计学是一门研究数据收集、整理、分析和解释的学科,通过统计学的方法可以对数据进行分析和推断,以便做出科学决策。
在商务领域,统计学可以帮助企业分析市场、预测销售和制定营销策略。
1.2 统计学的基本原理统计学的基本原理包括总体和样本、变量、数据类型、测度尺度等内容。
理解这些基本原理对于进行商务统计分析非常重要。
1.3 统计学的应用范围统计学在商务领域有广泛的应用,包括市场调研、销售预测、风险评估、财务分析等方面。
第二章:数据类型和数据收集2.1 数据的类型数据可以分为定量数据和定性数据,定量数据可以进一步分为禺式数据和顺序数据,定性数据可以进一步分为名义数据和区间数据。
理解不同类型的数据对于选择合适的统计分析方法非常重要。
2.2 数据的收集方法数据的收集方法包括问卷调查、访谈、实地观察、记录和外部数据收集等。
在商务统计分析中,选择合适的数据收集方法对于数据的质量至关重要。
第三章:统计描述与概率分布3.1 描述统计描述统计是对数据进行整理、描述、总结和展示的过程,包括中心位置测度、离散程度测度、分布形态测度等内容。
在商务统计分析中,描述统计可以帮助我们了解数据的特征和规律。
3.2 概率分布概率分布描述了随机变量的取值及其对应的概率,包括离散型概率分布和连续型概率分布。
在商务统计分析中,概率分布可以帮助我们理解不同变量之间的关系和规律。
第四章:抽样与估计4.1 抽样方法抽样是指从总体中选取样本的过程,常用的抽样方法包括简单随机抽样、分层抽样、整群抽样和多阶段抽样等。
在商务统计分析中,选择合适的抽样方法对于大规模数据的分析非常重要。
4.2 估计估计是根据样本数据对总体参数进行估计的过程,包括点估计和区间估计两种方法。
在商务统计分析中,通过估计可以得到总体参数的近似值,用于制定决策和预测。
第五章:假设检验与单因素方差分析5.1 假设检验假设检验是用来检验统计结论的正确性的方法,包括参数假设检验和非参数假设检验两种方法。
商务统计学

二、分布中心测度指标
用来测度随机变量次数分布中心的 指标可以有多种,其中在统计分析推断 中常用的主要有算术平均数、中位数和 众数等几种。
(一)算术平均数
1、定义——算术平均数又称算术均值,是 随机变量的所有观测值总和与观测值个 数的比值。
(一)两点分布
假设总体中有两类共N个个体,其中取 值为“是”的有N1个,取值为“非”的有N0 个,则有:
P x 1 N 1 p
N
Px 0 N 0 q
N
(二)二项分布
假设在0-1分布总体中,取“是”值的 个体比例为p,取“非”值的比例为q,现 从中有放回地随机抽取n个个体,记X为取 “是”值的个体数目,则其中恰有n1个个 体取“是”值、且有n0=n-n1个个体取“非” 值的概率为:
第一章 绪论
➢一、统计学的性质 ➢二、统计学的作用 ➢三、统计学的基本概念 ➢四、统计指标体系的设计
一、统计学的性质
• (一)统计活动的内容与阶段 • 对各种数据资料的搜集、整理、分析和推断的
活动过程称为统计活动,一项完整的统计活动过程 可分为统计资料的搜集整理和统计资料的分析推断 两大阶段。 • (二)统计学的定义与分科 • 统计学就是关于数据资料的搜集、整理、分析 和推断的科学。关于统计资料的搜集整理和分析推 断的理论与方法构成了统计学的全部内容。 • (1)理论统计学与应用统计学 • (2)描述统计学与推断统计学
P x n 1 C n n 1p n 1 q n 0
(三)超几何分布
假设0-1总体中共有N个个体,其中取
“是”值的个体有N1个,取“非”值的 个体有N0个。现从不放回地随机抽取n个 个体,记x为取“是”值的个体数目,则
第一章 商务统计学样本
e.g., Tables and graphs 分析图表
Characterize data(刻画数据的特征)
e.g., Sample mean =
X
n
i
(样本均值)
Chap 1-7
Business Statistics: A First Course, 5e © 2009 Prentice-Hall, Inc.
The types of data used in business 商业活动中使用数据 的类型 The basics of Microsoft Excel Excel基础 The basics of Minitab 统计软件Minitab基础
Cha Statistics: A First Course, 5e © 2009 Prentice-Hall, Inc.
Present and describe business data and information properly 正确的展示和描述商业数据的和信息(描述性统计) Draw conclusions about large groups of individuals or items, using information collected from subsets of the individuals or items. 利用收集到的个体或者商品的子集数据来推断有关更广范围内个体 或者商品的结论(推断统计) Make reliable forecasts about a business activity 为商业活动提供可靠的预测(推断统计) Improve business processes 改善商业活动的过程
Business Statistics: A First Course, 5e © 2009 Prentice-Hall, Inc.
商务统计学第一章

xx年xx月xx日
contents
目录
• 引言 • 商务统计学基本概念 • 数据类型与数据收集 • 数据的整理与可视化 • 概率论基础
contents
目录
• 统计推断基础 • 相关分析与回归分析 • 时间序列分析与预测 • 统计决策理论
01
引言
课程简介
商务统计学是统计学在商业和经济领域的应用,旨在培养学 生在商业和经济领域运用统计学方法解决实际问题的能力。
统计学的发展经历了描述性统计学、推断性 统计学和现代统计学三个阶段。
描述性统计学主要是对数据进行描述性统计 指标的计算和数据的可视化,推断性统计学 主要是通过样本信息对总体进行推断和分析 ,现代统计学则涉及到数据挖掘、机器学习
、时间序列分析等多个方面。
02
商务统计学基本概念
统计学的定义
统计学是一门收集、整理、分析和 解释数据的科学。
基于一组变量预测另一个变量的值。
选择变量、收集数据、建立模型、检 验模型、应用模型。
03
回归分析的基本假设
线性关系、误差项独立同分布、误差 项无序列相关性、解释变量与误差项 无多重共线性。
线性回归模型
线性回归模型的定义
一种用于预测的模型,将解释变 量与响应变量之间的关系建模为 线性关系。
线性回归模型的参数 估计
数据收集的方法
调查问卷
通过邮寄、网络或现场发放问卷, 收集相关数据
观察法
记录现场观察到的数据,如销售额 、客流量等
实验法
通过实验来测试不同因素对变量的 影响,如A/B测试
现有统计数据
从政府、企业或第三方机构获取相 关统计数据
数据收集的步骤
01
商务与经济统计01

• 还有一些公司专门从事通过Internet出售数据的业务。
数据来源
统计研究
• 统计研究可以分为实验性统计研究和观察性统计研
究。
• 在实验性统计研究中,首先确定要研究的变量,然
后通过控制其它一个或多个因素,观察这些因素的 改变对变量产生的影响。例如对药物效果的实验性 研究。
• 在观察性研究(或称为非实验性研究)中,不对要
海珠保险公司的总经理希望了解上个月每份保单 的金额分布情况。他随机抽查了50份保单,每份保单 的金额如下(单位:百元):
91 78 93 57 75 52 99 80 97 62 71 69 72 89 66 75 79 75 72 76 104 74 62 68 97 105 77 65 80 109 85 97 88 68 83 68 71 69 67 74 62 82 98 101 79 105 79 69 62 73
测度量表
间隔量表
• 间隔量表与系数量表相类似,但间隔量表的每个数
据项之间的间隔相等。
• 间隔量表的数据只能用数字表示。
测度量表
间隔量表
• 举例:
小强考TOEFL考了580分,旺财考TOEFL考了 620分。旺财比小强多考了40分。
您认为您所在公司的信息技术支持人员对您的工作有多大帮助?
一点帮助都没有
Chapter 1
数据与统计学
本章主要内容
统计学在商务和经济中的应用 数据 数据来源 描述性统计 统计推断
统计学在商务与经济中的应用
会计 会计师事务所在进行审计的时候需要利用抽样技术进 行选择性审计。 金融 金融分析师利用一系列的统计数据,例如市赢率、每 股收益等,来进行投资分析。 市场营销 在新产品上市前,利用对消费者的抽样调查了解市场 前景;利用POS机上的销售数据,进行产品的市场分 析与研究。
商务统计课程认识
对商务统计学课程的认识商务统计学是一门应用性统计学课程,是全面系统的论述商务与经济统计活动全过程中所用到的统计方法。
在我个人认为商务统计与统计学没有太大差别,统计学注重讲理论,商务统计注重实践分析案例,可以说是在学了统计学时隔一年后对统计学来了次全面的复习,以及理论的实践。
在商务统计学中,又学了一遍统计学的理论知识:介绍了统计学的性质、统计学的作用、统计学的基本概念、统计学指标体系的设计,还有实用的数据的采集、参数估计、统计推断和假设检验、方差分析、回归分析、时间序列的预测、统计决策分析、统计指数及最终的综合评价。
统计学就是关于数据资料的搜集、整理、分析和推断的科学。
关于统计资料的搜集整理和分析推断的理论与方法构成了统计学的全部内容。
以下是我对本学期所学的商务统计学知识的回顾及梳理:1. 统计总体是组成统计活动研究对象的全部事物的全体集合,就称为统计总体,简称总体或母体;而总体中的各个事物则称为个体,总体中个体的数量称为总体容量。
2. 指标的测度计量尺度有(1)定类尺度(2)定序尺度(3)定距尺度(4)定比尺度 。
3. 统计推断指根据样本观测资料来对总体的分布状况和分布特征进行推断。
4. 样本数据的分类(1)横截面数据(2)时间序列数据。
5. 统计指标体系的定义:反映总体及其所含个体的各个方面特征数量的一系列相互联系、相互补充的统计指标所形成的体系,称为统计指标体系。
指标体系设计的原则为(1)目的性原则(2)科学性原则 (3)可行性原则 (4)联系性原则。
6. 调查的取样方式a 、随机抽样调查(1)简单随机抽样(2)系统抽样(3)分层抽样(4)整群抽样。
b 、非随机抽样调查(1)任意抽样(2)立意抽样(3)配额抽样。
7. 在统计分析推断中,常用的连续随机变量概率分布模型主要有均匀分布、正态分布、卡方分布、t 分布和F 分布等几种。
8. 区间估计的方法a 、(1)均值的区间估计 (2)比例的区间估计 (3)方差的区间估计 (4)单侧置信区间 9. 所谓统计假设,就是关于总体分布特征的某种论断。
统计学(中英文)_ch01

Business Statistics, A First Course (4e) © 2006 Prentice-Hall, Inc.
Chap 1-12
∑X
n
i
Business Statistics, A First Course (4e) © 2006 Prentice-Hall, Inc.
Chap 1-8
Inferential Statistics 推断统计
Estimation 估计 e.g., Estimate the population mean weight using the sample mean weight 例如:利用采样的平均重量估计人口的平均体 重 Hypothesis testing 假设检验 e.g., Test the claim that the population mean weight is 120 pounds 例如:根据测试的要求,人口平均体重是120 磅
英文翻译乃自己所做, 英文翻译乃自己所做,有错误 之处请自行查证。 之处请自行查证。
Business Statistics, A First Course (4e) © 2006 Prentice-Hall, Inc.
Chap 1-1
Business Statistics, A First Course
Defined descriptive vs. inferential statistics 描述性统计和推理统计 Reviewed data types 回顾数据类型
♦ ♦ ♦ ♦
Categorical vs. Numerical data 绝对的和数值的数据 Discrete vs. Continuous data 离散的和连续的数据
商务统计学第一章

总体与样本
例如,研究全国服务业企业的利润情况时,全国所有的服务业企业 形成了一个总体。成千上万不同的服务业企业可以结合在一起构成总体, 这是因为每个服务业企业的经济职能是相同的,都是从事生产和销售服 务产品的基本单位,在经营过程中都需要投入一定的成本以获取相应的 收益。同质性是确定总体的基本标准,它是根据研究目的而确定的。研 究目的不同,则所确定的总体也不同,其同质性的意义也随之变化。
工作等有什么特别意义呢?
数据
统计学研究的基础是数据。数据,就其词义而言, 指进行各种统计、计算、科学研究和技术设计等所依据 的数值。
英语里data作为datum一词的复数形式,具有如下 涵义:①论据,作为论据的事实;②材料,资料; ③历史上的、计算或实验得到的数据。
数据
数据本身没有意义,数据只有对实体行为产生影响 时才成为信息,其反映的是一定社会现象或自然现象在 特定的时间、空间条件下表现出的特征,故商务活动领 域分析研究的数据需要具备时间与空间要素,并非数学 学科中纯粹的、抽象的数字。
只能归于某一类别的非数值型数据 对事物进行分类的结果,数据表现为类别,用文字、代码和其
他符号来表述 例如,人口按性别分为男、女两类
定序标志与数据
1. 定序标志:说明事物有序类别的名称
受教育程度、产业、等级等
2. 定序数据:
只能归于某一有序类别的非数字型数据 对事物类别顺序的测度,数据表现为类别,用文字来表述 例如,产品分为一等品、二等品、三等品、次品等
1. 标志是指统计总体各单位所具有的共同 特征的名称。
2. 数据是标志特征在各单位的具体表现
Variale and Data
标志与数据
定类标志 定序标志 定距标志 定比标志 定类数据 定序数据 定距数据 定比数据
商务统计学_教学的实践(3篇)

第1篇一、引言随着我国经济的快速发展,统计学在商务领域的应用越来越广泛。
商务统计学作为一门重要的学科,旨在培养学生的统计学思维和分析能力,使其能够运用统计学的方法解决实际问题。
本文将从以下几个方面探讨商务统计学教学的实践。
二、教学目标1. 理解商务统计学的基本概念、原理和方法。
2. 掌握商务统计数据的收集、整理和分析方法。
3. 能够运用统计学方法对商务问题进行定量分析和预测。
4. 培养学生的统计学思维和分析能力,提高解决实际问题的能力。
三、教学内容1. 商务统计学基本概念:包括数据、变量、总体、样本、概率、分布等。
2. 商务统计数据的收集:介绍数据来源、数据类型、数据收集方法等。
3. 商务统计数据的整理:介绍数据的整理方法,如分组、排序、计算等。
4. 商务统计数据的分析:介绍描述性统计、推断性统计、时间序列分析等。
5. 商务统计应用:结合实际案例,分析商务问题,运用统计学方法进行定量分析和预测。
四、教学实践1. 案例教学:选取具有代表性的商务案例,让学生分析案例中的统计学问题,引导学生运用所学知识解决实际问题。
2. 实践操作:组织学生进行商务统计数据收集、整理和分析的实践活动,让学生亲身体验统计学在实际工作中的应用。
3. 讨论与交流:组织学生进行课堂讨论,分享各自的学习心得和经验,提高学生的合作意识和沟通能力。
4. 考核评价:采用多种考核方式,如课堂表现、作业、实践报告、期末考试等,全面评价学生的学习成果。
五、教学手段1. 课堂教学:运用多媒体技术,展示丰富的教学资源,提高学生的学习兴趣。
2. 网络教学:利用网络平台,为学生提供在线学习资源,方便学生随时随地进行学习。
3. 实践基地:与企业合作,建立商务统计学实践教学基地,为学生提供实际操作机会。
4. 专家讲座:邀请统计学专家进行讲座,为学生提供专业指导。
六、教学效果1. 学生对商务统计学的基本概念、原理和方法有了深入的理解。
2. 学生的商务统计数据收集、整理和分析能力得到提高。
戴维商务统计学第7版英文版教学指南CH01_Levine7e_ISM
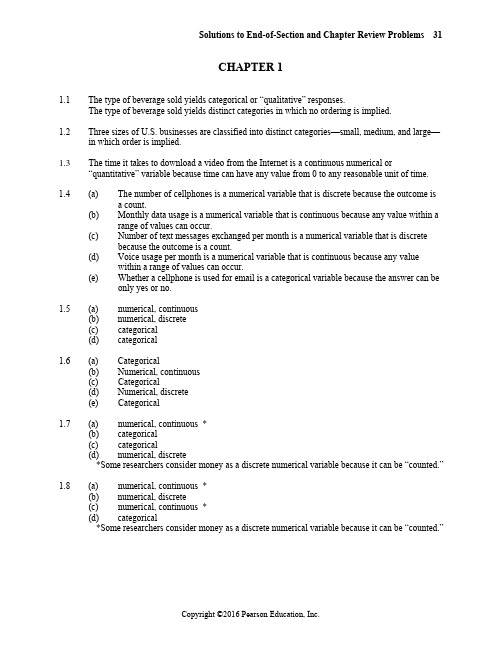
Solutions to End-of-Section and Chapter Review Problems 31CHAPTER 11.1 The type of beverage sold yields categorical or “qualitative” responses.The type of beverage sold yields distinct categories in which no ordering is implied.1.2 Three sizes of U.S. businesses are classified into distinct categories—small, medium, and large—in which order is implied.1.3 The time it takes to download a video from the Internet is a continuous numerical or“quantitative” variable because time can have any value from 0 to any reasonable unit of time.1.4 (a) The number of cellphones is a numerical variable that is discrete because the outcome isa count.(b) Monthly data usage is a numerical variable that is continuous because any value within arange of values can occur.(c) Number of text messages exchanged per month is a numerical variable that is discretebecause the outcome is a count.(d) Voice usage per month is a numerical variable that is continuous because any valuewithin a range of values can occur.(e) Whether a cellphone is used for email is a categorical variable because the answer can beonly yes or no.1.5 (a) numerical, continuous(b) numerical, discrete(c) categorical(d) categorical1.6 (a) Categorical(b) Numerical, continuous(c) Categorical(d) Numerical, discrete(e) Categorical1.7 (a) numerical, continuous *(b) categorical(c) categorical(d) numerical, discrete*Some researchers consider money as a discrete numerical variable because it can be “counted.”1.8 (a) numerical, continuous *(b) numerical, discrete(c) numerical, continuous *(d) categorical*Some researchers consider money as a discrete numerical variable because it can be “counted.”32 Chapter 1: Defining and Collecting Data1.9 (a) Income may be considered discrete if we “count” our money. It may be consideredcontinuous if we “measure” our money; we are only limited by the way a country'smonetary system treats its currency.(b) The first format is preferred because the responses represent data measured on a higherscale.1.10 The underlying variable, ability of the students, may be continuous, but the measuring device, thetest, does not have enough precision to distinguish between the two students.1.11 (a) The population is “all working women from the metropolitan area.” A systematic or randomsample could be taken of women from the metropolitan area. The director might wish tocollect both numerical and categorical data.(b) Three categorical questions might be occupation, marital status, type of clothing.Numerical questions might be age, average monthly hours shopping for clothing, income.1.12 The answer depends on the chosen data set.1.13 The answer depends on the specific story.1.14 The answer depends on the specific story.1.15 The transportation engineers and planners should use primary data collected through anobservational study of the driving characteristics of drivers over the course of a month.1.16 The information presented there is based mainly on a mixture of data distributed by anorganization and data collected by ongoing business activities.1.17 (a) 001 (b) 040 (c) 9021.18 Sample without replacement: Read from left to right in 3-digit sequences and continue unfinishedsequences from end of row to beginning of next row.Row 05: 338 505 855 551 438 855 077 186 579 488 767 833 170Rows 05-06: 897Row 06: 340 033 648 847 204 334 639 193 639 411 095 924Rows 06-07: 707Row 07: 054 329 776 100 871 007 255 980 646 886 823 920 461Row 08: 893 829 380 900 796 959 453 410 181 277 660 908 887Rows 08-09: 237Row 09: 818 721 426 714 050 785 223 801 670 353 362 449Rows 09-10: 406Note: All sequences above 902 and duplicates are discarded.1.19 (a) Row 29: 12 47 83 76 22 99 65 93 10 65 83 61 36 98 89 58 86 92 71Note: All sequences above 93 and all repeating sequences are discarded.(b) Row 29: 12 47 83 76 22 99 65 93 10 65 83 61 36 98 89 58 86Note: All sequences above 93 are discarded. Elements 65 and 83 are repeated.Solutions to End-of-Section and Chapter Review Problems 33 1.20 A simple random sample would be less practical for personal interviews because of travel costs(unless interviewees are paid to attend a central interviewing location).1.21 This is a probability sample because the selection is based on chance. It is not a simple randomsample because A is more likely to be selected than B or C.1.22 Here all members of the population are equally likely to be selected and the sample selectionmechanism is based on chance. But not every sample of size 2 has the same chance ofbeing selected. For example the sample “B and C” is impossible.1.23 (a) Since a complete roster of full-time students exists, a simple random sample of 200students could be taken. If student satisfaction with the quality of campus life randomlyfluctuates across the student body, a systematic 1-in-20 sample could also be taken fromthe population frame. If student satisfaction with the quality of life may differ by genderand by experience/class level, a stratified sample using eight strata, female freshmenthrough female seniors and male freshmen through male seniors, could be selected. Ifstudent satisfaction with the quality of life is thought to fluctuate as much within clustersas between them, a cluster sample could be taken.(b) A simple random sample is one of the simplest to select. The population frame is theregistrar’s file of 4,000 student names.(c) A systematic sample is easier to select by hand from the registrar’s records than asimple random sample, since an initial person at random is selected and then every 20thperson thereafter would be sampled. The systematic sample would have the additionalbenefit that the alphabetic distribution of sampled students’ names would be morecomparable to the alphabetic distribution of student names in the campus population.(d) If rosters by gender and class designations are readily available, a stratified sampleshould be taken. Since student satisfaction with the quality of life may indeed differ bygender and class level, the use of a stratified sampling design will not only ensure allstrata are represented in the sample, it will also generate a more representative sampleand produce estimates of the population parameter that have greater precision.(e) If all 4,000 full-time students reside in one of 10 on-campus residence halls which fullyintegrate students by gender and by class, a cluster sample should be taken. A clustercould be defined as an entire residence hall, and the students of a single randomlyselected residence hall could be sampled. Since each dormitory has 400 students, asystematic sample of 200 students can then be selected from the chosen cluster of 400students. Alternately, a cluster could be defined as a floor of one of the 10 dormitories.Suppose there are four floors in each dormitory with 100 students on each floor. Twofloors could be randomly sampled to produce the required 200 student sample. Selectionof an entire dormitory may make distribution and collection of the survey easier toaccomplish. In contrast, if there is some variable other than gender or class that differsacross dormitories, sampling by floor may produce a more representative sample.34 Chapter 1: Defining and Collecting Data1.24 (a) Row 16: 2323 6737 5131 8888 1718 0654 6832 4647 6510 4877Row 17: 4579 4269 2615 1308 2455 7830 5550 5852 5514 7182Row 18: 0989 3205 0514 2256 8514 4642 7567 8896 2977 8822Row 19: 5438 2745 9891 4991 4523 6847 9276 8646 1628 3554Row 20: 9475 0899 2337 0892 0048 8033 6945 9826 9403 6858Row 21: 7029 7341 3553 1403 3340 4205 0823 4144 1048 2949Row 22: 8515 7479 5432 9792 6575 5760 0408 8112 2507 3742Row 23: 1110 0023 4012 8607 4697 9664 4894 3928 7072 5815Row 24: 3687 1507 7530 5925 7143 1738 1688 5625 8533 5041Row 25: 2391 3483 5763 3081 6090 5169 0546Note: All sequences above 5000 are discarded. There were no repeating sequences.(b) 089 189 289 389 489 589 689 789 889 9891089 1189 1289 1389 1489 1589 1689 1789 1889 19892089 2189 2289 2389 2489 2589 2689 2789 2889 29893089 3189 3289 3389 3489 3589 3689 3789 3889 39894089 4189 4289 4389 4489 4589 4689 4789 4889 4989(c) With the single exception of invoice #0989, the invoices selected in the simplerandom sample are not the same as those selected in the systematic sample. It would behighly unlikely that a random process would select the same units as a systematicprocess.1.25 (a) A stratified sample should be taken so that each of the three strata will be proportionatelyrepresented.(b) The number of observations in each of the three strata out of the total of 1,000 shouldreflect the proportion of the three categories in the customer database. For example,3,500/10,000 = 35% so 35% of 1,000 = 350 customers should be selected from theprospective buyers; similarly 4,500/10,000 = 45% so 450 customers should be selectedfrom the first time buyers, and 2,000/10,000 = 20% so 200 customers from the repeatbuyers.(c) It is not simple random sampling because, unlike the simple random sampling, it ensuresproportionate representation across the entire population.1.26 Before accepting the results of a survey of college students, you might want to know, forexample:Who funded the survey? Why was it conducted? What was the population from which the sample was selected? What sampling design was used? What mode of response was used: a personalinterview, a telephone interview, or a mail survey? Were interviewers trained? Were surveyquestions field-tested? What questions were asked? Were they clear, accurate, unbiased, valid?What operational definition of “vast majority” was used? What was the response rate? What was the sample size?1.27 (a) Possible coverage error: Only employees in a specific division of the company weresampled.(b) Possible nonresponse error: No attempt is made to contact nonrespondents to urge themto complete the evaluation of job satisfaction.(c) Possible sampling error: The sample statistics obtained from the sample will not be equalto the parameters of interest in the population.(d) Possible measurement error: Ambiguous wording in questions asked on thequestionnaire.Solutions to End-of-Section and Chapter Review Problems 35 1.28 The results are based on an online survey. If the frame is supposed to be small business owners,how is the population defined? This is a self-selecting sample of people who responded online, so there is an undefined nonresponse error. Sampling error cannot be determined since this is not a random sample.1.29 Before accepting the results of the survey, you might want to know, for example:Who funded the study? Why was it conducted? What was the population from which the sample was selected? What was the frame being used? What sampling design was used?What mode of response was used: a personal interview, a telephone interview, or a mail survey?Were interviewers trained? Were survey questions field-tested? What other questions wereasked? Were they clear, accurate, unbiased, and valid? What was the response rate? What was the margin of error? What was the sample size?1.30 Before accepting the results of the survey, you might want to know, for example: Who funded thestudy? Why was it conducted? What was the population from which the sample was selected?What sampling design was used? What mode of response was used: a personal interview, atelephone interview, or a mail survey? Were interviewers trained? Were survey questions field-tested? What other questions were asked? Were the questions clear, accurate, unbiased, andvalid? What was the response rate? What was the margin of error? What was the sample size?What frame was used?1.31 A population contains all the items of interest whereas a sample contains only a portion of theitems in the population.1.32 A statistic is a summary measure describing a sample whereas a parameter is a summary measuredescribing an entire population.1.33 Categorical random variables yield categorical responses such as yes or no answers. Numericalrandom variables yield numerical responses such as your height in inches.1.34 Discrete random variables produce numerical responses that arise from a counting process.Continuous random variables produce numerical responses that arise from a measuring process.1.35 Items or individuals in a probability sampling are selected based on known probabilities whileitems or individuals in a nonprobability samplings are selected without knowing theirprobabilities of selection.1.36 Microsoft Excel could be used to perform various statistical computations that were possible onlywith a slide-rule or hand-held calculator in the old days.1.37 (a) The population of interest was 18-54 year olds who currently own a smartphone and/ortablet, and who use and do not use these devices to shop.(b) The sample was the 1,003 18-54 year olds who currently own a smartphone and/or tablet,who use and do not use these devices to shop, and who responded to the study.(c) A parameter of interest is the proportion of all tablet users in the population who use theirdevice to purchase product and services.(d) A statistic used to estimate the parameter of interest in (c) is the proportion of tablet usersin the sample who use their device to purchase product and services.36 Chapter 1: Defining and Collecting Data1.38 The answers to this question depend on which article and its corresponding data set is beingselected.1.39 (a) The population of interest was supply chain executives in a wide range of industriesrepresenting a mix of company sizes from across three global regions: Asia, Europe, andthe Americas.(b) The sample was the 503 supply chain executives in a wide range of industriesrepresenting a mix of company sizes from across three global regions: Asia, Europe, andthe Americas surveyed by PwC from May to July 2012.(c) A parameter of interest is the proportion of supply chain executives in the populationwho acknowledge that supply chain is seen as a strategic asset in their company.(d) A statistic used to estimate the parameter of interest in (c) is the proportion of supplychain executives in the sample who acknowledge that supply chain is seen as a strategicasset in their company.1.40 The answers to this question depend on which data set is being selected.1.41 (a) Categorical variable: Which of the following best describes this firm’s primary business?(b) Numerical variable: On average, what percent of total monthly revenues are e-commercerevenues?1.42 (a) The population of interest was the collection of all the 10,000 benefitted employees at theUniversity of Utah when the study was conducted.(b) The sample consisted of the 3,095 benefitted employees participated in the study.(c) gender: categorical; age: numerical; education level: numerical; marital status:categorical; household income: numerical; employment category: categorical1.43 (a) (i)categorical (iii) numerical, discrete(ii)categorical (iv) categorical(b) The answers will vary.(c) The answers will vary.。
英文商务统计学ppt课件第一章_Ch01
A marketing research analyst needs to assess the effectiveness of a new television advertisement. A pharmaceutical manufacturer needs to determine whether a new drug is more effective than those currently in use. An operations manager wants to monitor a manufacturing process to find out whether the quality of the product being manufactured is conforming to company standards. An auditor wants to review the financial transactions of a company in order to determine whether the company is in compliance with generally accepted accounting principles.
e.g., Estimate the population mean weight using the sample mean weight e.g., Test the claim that the population mean weight is 120 pounds
Hypothesis testing
Business Statistics: A First Course, 5e © 2009 Prentice-Hall, Inc.
商务统计-C11

Chapter 11 Two-sample Tests of HypothesisGOALSpaired dependent observationsGOALSdependent independent samplesComparing two populations – Some ExamplesComparing two populations – Some ExamplesComparing two populations – Some Examples (continued)Comparing Two Population Means of Independent Samples22212121n n X X z σσ+-=Comparing Two Population Means of Independent SamplesComparing Two Population Means of Independent Samples – Examplemean checkout timeis longerComparing Two Population Means of Independent Samples – ExampleExample continued Step 1:1Step 2:Step 3:Example continued Step 4:Step 5: Compute the value of z and make a decisionExample continued 13.3064.02.010030.05040.03.55.52222==+-=+-=uu s s us n n X X z σσExample continued Step 5:Two-Sample Tests about ProportionsTwo-Sample Tests about ProportionsTwo-Sample Tests about ProportionsTwo Sample Tests of ProportionsTwo-Sample Tests of Proportions continuedTwo Sample Tests of Proportions - Examplethere is a difference in the proportions of younger and olderTwo Sample Tests of Proportions - ExampleTwo Sample Tests of Proportions - Example Step 1:01 2112difference12Two Sample Tests of Proportions - Example Step 2:Two Sample Tests of Proportions - Example Step 3:Step 4:Two Sample Tests of Proportions - Example Step 5:Two Sample Tests of Proportions - ExampleTwo Sample Tests of Proportions – Example (Minitab Solution)Comparing Population Means with Unknown Population Standard Deviations (the Pooled t-test)Small sample test of means continued2)1()1(212222112-+-+-=n n s n s n s p ⎪⎪⎭⎫ ⎝⎛+-=2122111n n s X X t pComparing Population Means with Unknown Population Standard Deviations (the Pooled t-test)Comparing Population Means with Unknown Population Standard Deviations (the Pooled t-test)Comparing Population Means with Unknown Population Standard Deviations (the Pooled t-test)Comparing Population Means with Unknown Population Standard Deviations (the Pooled t-test) - Example Step 1:01 2112Step 2:Step 3:Step 4:012-2 12-2Comparing Population Means with Unknown Population Standard Deviations (the Pooled t-test) - ExampleComparing Population Means with Unknown Population Standard Deviations (the Pooled t-test) - Example Step 5:(a) Calculate the sample standard deviationsStep 5:Comparing Population Means with Unknown Population Standard Deviations (the Pooled t-test) - Example -0.662Comparing Population Means with Unknown Population Standard Deviations (the Pooled t-test) - Example Step 5:not to reject the nullhypothesis-0.662 falls in the regionbetween -1.833 and 1.833no differenceComparing Population Means with Unknown Population Standard Deviations (the Pooled t-test) - ExampleTwo-Sample Tests of Hypothesis: Dependent SamplesDependent samples paired related in some fashionHypothesis Testing Involving Paired Observationstd s nd/dependentHypothesis Testing Involving Paired Observations - ExampleHypothesis Testing Involving Paired Observations - ExampleHypothesis Testing Involving Paired Observations - ExampleStep 1:1Step 2:Step 3:Step 4:Hypothesis Testing Involving PairedObservations - ExampleStep 5:Hypothesis Testing Involving PairedObservations - ExampleThe computed value of t isgreater than the highercritical value, so ourdecision is to reject thethat there is a difference inthe homes.Hypothesis Testing Involving Paired Observations – Excel Example。
商务统计学课件第1章(ISEC)

Business Statistics, A First Course (4e) © 2006 Prentice-Hall, Inc.
Hale Waihona Puke Chap 1-4附注在商业世界中,统计学有4种重要的应用。
· 总结商业数据 · 根据数据得出结论 · 作出商业行动的可靠预测 · 改进运营过程
Business Statistics, A First Course (4e) © 2006 Prentice-Hall, Inc.
Chap 1-10
为什么要收集数据?
市场调研者需要了解一个新的旅游产品的效果; 消费者的消费行为方面的信息数据,如:消费者购买产 品的花费、选择的产品渠道、偏好产品的类型、产品使 用周期、购买产品的目的、消费者家庭背景、工作和生 活环境、个人消费观和价值观等。如果企业收集到了这 些数据,建立消费者大数据库,便可通过统计和分析来 掌握消费者的消费行为、兴趣偏好和产品的市场口碑现 状,再根据这些总结出来的行为、兴趣爱好和产品口碑 现状制定有针对性的营销方案和营销战略,投消费者所 好,那么其带来的营销效应是可想而知的。
Business Statistics, A First Course (4e) © 2006 Prentice-Hall, Inc.
Chap 1-16
Types of Data(数据类型)
Data
(属性) Categorical
Examples:
Numerical (数值)
gender belief (Defined categories) 定义属性类别
Probability Theory & Mathematical Statistics 概率论与数理统计
ch1商务研究方法概述

定量研究(Quantitative Research)
商务学院
精确性与可信度
如何提高员工对组织 的承诺
管理研究以总体中抽出的样本为依据,因此存在测量误差 (measurement errors)或其他问题也会导致结果的偏差或错 误,希望尽可能地设计出一种研究方法,可使最后的结果 更贴近事实,也更值得信赖。 精确性(precision)是指根据样本得到的结果与真实情况相 当接近。
商务学院
纵向研究的特殊类型
趋势研究: 对一般总体随时间推移而发生的变化的研究。 特征组研究: 对某一特殊研究对象随时间推移而发生的变 化的研究。最典型的是人群的年龄组 定组研究: 定组研究与趋势研究和特征组研究相似,区 别在于每次研究都用同一样本。
商务学院
根据研究的内容分类
基础研究
为了取得有关现象和可观察事实的基本原理的新知识所进行的实验性或 理论性工作,它不以任何专门的或具体的应用或使用为目的。例:预测 理论与方法、评价方法、优化理论与技术、决策理论与方法、运筹与运 作管理、风险评价与管理、信息与知识管理、互联网管理理论与技术、 组织理论、质量与可靠性管理、企业管理、公共管理、区域可持续发展 与管理
商务学院
可验证性
如何提高员工对组织 的承诺
科学研究有助于检验经过逻辑推理后所形成的假设, 以检验资料是否支持在认真研究问题所处的情况后 所得出的推理或假设。
若管理者或研究人员能事先对组织中随机选出的员 工进行访谈,并且在研读组织承诺领域的相关性研 究后,才得出关于如何提升员工承诺的假设,则这 些假设就可以应用某些统计检验方法来验证。
商务学院
2.为什么要学习研究方法? 有必要学吗?
- 1、下载文档前请自行甄别文档内容的完整性,平台不提供额外的编辑、内容补充、找答案等附加服务。
- 2、"仅部分预览"的文档,不可在线预览部分如存在完整性等问题,可反馈申请退款(可完整预览的文档不适用该条件!)。
- 3、如文档侵犯您的权益,请联系客服反馈,我们会尽快为您处理(人工客服工作时间:9:00-18:30)。
第1章 概述与数据收集
Business Statistics: A First Course, 5e © 2009 Prentice-Hall, Inc.
Chap 1-1
学习目标
在本章中你将学到:
商业中是如何使用统计学的 讨论数据的来源 讨论数据的类型
Microsoft Excel的基本使用
Chap 1-4
为什么学习统计学?
在商业世界中,统计学有4种重要的应用。
· 总结商业数据 · 根据数据得出结论 · 作出商业行动的可靠预测 · 改进运营过程
Business Statistics: A First Course, 5e © 2009 Prentice-Hall, Inc.
Chap 1-5
统计学的基本术语
总体 总体(population)就是所考虑的全部元素。 样本 样本(sample)就是从总体中挑选出来用于分析的一部分。 参数 参数(parameter)就是描述总体特征的概括性度量。 统计量 统计量(statistic)就是根据样本数据计算出来用于描述或估 计总体特征的概括性度量。
Chap 1-3
Business Statistics: A First Course, 5e © 2009 Prentice-Hall, Inc.
什么是统计学?
将数字转化为对决策者有用信息的数学的分支。
处理和分析数字的方法 帮助减少决策时固有的不确定性的方法
Business Statistics: A First Course, 5e © 2009 Prentice-Hall, Inc.
Business Statistics: A First Course, 5e © 2009 Prentice-Hall, Inc.
Chap 1-15
数据的类型
数据
属性数据
例子:
数值数据
婚姻状况
政治党派 眼睛的颜色 (定义的类别) 例子:
离散的
孩子数
连续的
例子:
重量
每小时缺陷数 (计数项目)
为什么收集数据?
市场调研者需要了解一个新电视广告的效果。
某个研制药物的人员想要知道某种新药是否比当前正 在使用的药物更加有效。 某公司的运营经理要改进一个生产或服务过程。 某个审计人员要了解公司的财务活动,确认这些活动 是否符合大家普遍接ຫໍສະໝຸດ 的会计准则。
Business Statistics: A First Course, 5e © 2009 Prentice-Hall, Inc.
电压 (衡量特征)
Chap 1-16
Business Statistics: A First Course, 5e © 2009 Prentice-Hall, Inc.
统计学使用的电脑程序
Minitab
进行统计分析的统计包 用来进行尽可能精确的统计分析
Microsoft Excel
Minitab的基本使用
Business Statistics: A First Course, 5e © 2009 Prentice-Hall, Inc.
Chap 1-2
为什么学习统计学?
你能更好地理解普遍使用的数字:
商业备忘录 商业研究 技术报告 技术期刊 报刊文章 杂志文章
Business Statistics: A First Course, 5e © 2009 Prentice-Hall, Inc.
Chap 1-18
当正确使用程序时,你应能够:
理解潜在的统计概念
理解如何组织和表示信息 理解如何操作你程序的用户界面
知道如何评论结果中的错误
定和保护清晰命名的工作备份
多种功能的数据分析工具 有多种功能,但是每一种都没有其他程序那样专注
Minitab和Excel都用工作表来存储收集来分析的数据
Business Statistics: A First Course, 5e © 2009 Prentice-Hall, Inc.
Chap 1-17
Minitab和Microsoft Excel事项
Chap 1-13
四个主要的数据来源
组织或者个人已经发布的数据。
可以设计一个实验来获得必要的数据。 可以进行调查。 可以通过观察研究的方式。
Business Statistics: A First Course, 5e © 2009 Prentice-Hall, Inc.
Chap 1-14
假设检验
利用从一个小组收集的数据而得出有关更大组的结论
Business Statistics: A First Course, 5e © 2009 Prentice-Hall, Inc.
Chap 1-8
统计学的基本术语
变量 变量(variable)是项目或者个人的一个特征。
数据 数据(data)就是与变量相联不同的值. 通用的定义
Business Statistics: A First Course, 5e © 2009 Prentice-Hall, Inc.
Chap 1-10
总体与样本
总体 样本
参数是描述总体特征的概括性 度量。
统计量是根据样本数据计算出 来用于描述总体特征概括性度 量。
Chap 1-11
Business Statistics: A First Course, 5e © 2009 Prentice-Hall, Inc.
Chap 1-12
数据的来源
原始来源:数据收集者就是使用数据分析的人
政治调查的数据 实验收集的数据 观察的数据
二手来源:进行统计分析的人不是数据收集者
分析人口普查数据。 从期刊或在互联网上获得数据。.
Business Statistics: A First Course, 5e © 2009 Prentice-Hall, Inc.
统计描述
数据的收集
例如, 调查
数据的演示
例如, 表格和图形
数据的分析
例如, 样本均值 =
n
X
i
Business Statistics: A First Course, 5e © 2009 Prentice-Hall, Inc.
Chap 1-7
统计推断
估计
例如, 使用样本的平均体重估计 总体的平均体重 例如,检验总体的平均体重是120 磅的说法
Business Statistics: A First Course, 5e © 2009 Prentice-Hall, Inc.
Chap 1-20
数据的类型
属性变量(categorical variables)(也称为定性 变量(qualitative variables))给出定性的回答, 比如是或者不是。
数值变量(numberical variables)(也称为定量 变量(quantitative variables))给出定量的回 答。
数据的值是无意义的,除非他们的变量有通用的定义(operational definitions)。这些定义对所有与该分析相关的人而言是普遍被接受的 含义。
Business Statistics: A First Course, 5e © 2009 Prentice-Hall, Inc.
Chap 1-9
Business Statistics: A First Course, 5e © 2009 Prentice-Hall, Inc.
Chap 1-19
小结
我们在本章中:
回顾了为啥经理人需要学习统计学 介绍了核心概念:
总体与样本
原始与二手数据类型 属性与数值数据
统计描述与统计推断 回顾了数据类型 讨论了Minitab和Microsoft Excel事项
统计学的类型
统计学
将数字转化为对决策者有用信息的数学的分支。
统计描述
注重数据的收集、总结、演 示和分析
统计推断
利用从一个小组收集的数据而 得出有关更大组的结论
Business Statistics: A First Course, 5e © 2009 Prentice-Hall, Inc.
Chap 1-6
当使用Minitab或Microsoft Excel时,用工作表(worksheets)来存 储收集来分析的数据。 工作表是列表排列的数据,行和列的相交形成单元(cells)。
当想要引用一组形成连续的矩形区域的数据是,可以使用单元范围 (cell range)。
Excel中工作表存在于工作簿(workbooks)中,Minitab中则在工程 (projects)中。 工作簿(workbooks)和工程(projects)都可以容纳数据、总结, 和图表。