matlab绘图和坐标操作
Matlab常用操作、绘图等小知识
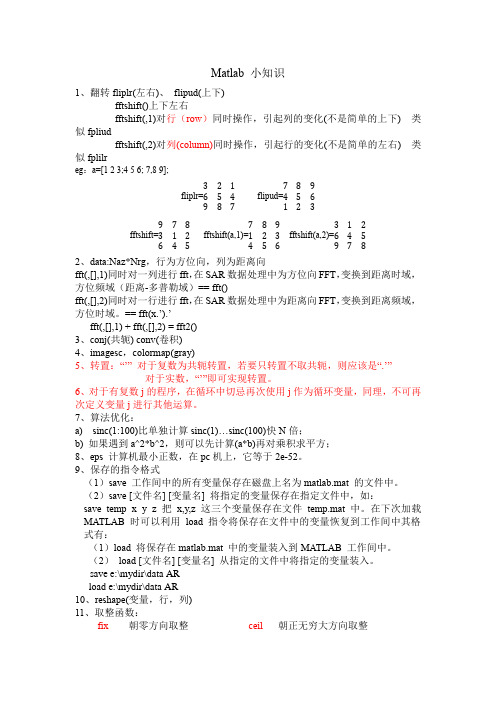
Matlab 小知识1、翻转fliplr(左右)、flipud(上下)fftshift()上下左右fftshift(,1)对行(row)同时操作,引起列的变化(不是简单的上下) 类似fpliudfftshift(,2)对列(column)同时操作,引起行的变化(不是简单的左右) 类似fplilreg:a=[1 2 3;4 5 6; 7,8 9];fliplr=321654987flipud=789456123fftshift=978312645fftshift(a,1)=789123456fftshift(a,2)=3126459782、data:Naz*Nrg,行为方位向,列为距离向fft(,[],1)同时对一列进行fft,在SAR数据处理中为方位向FFT,变换到距离时域,方位频域(距离-多普勒域)== fft()fft(,[],2)同时对一行进行fft,在SAR数据处理中为距离向FFT,变换到距离频域,方位时域。
== fft(x.’).’fft(,[],1) + fft(,[],2) = fft2()3、conj(共轭) conv(卷积)4、imagesc,colormap(gray)5、转置:“’” 对于复数为共轭转置,若要只转置不取共轭,则应该是“.’”对于实数,“’”即可实现转置。
6、对于有复数j的程序,在循环中切忌再次使用j作为循环变量,同理,不可再次定义变量j进行其他运算。
7、算法优化:a) sinc(1:100)比单独计算sinc(1)…sinc(100)快N倍;b) 如果遇到a^2*b^2,则可以先计算(a*b)再对乘积求平方;8、eps 计算机最小正数,在pc机上,它等于2e-52。
9、保存的指令格式(1)save 工作间中的所有变量保存在磁盘上名为matlab.mat 的文件中。
(2)save [文件名] [变量名] 将指定的变量保存在指定文件中,如:save temp x y z 把x,y,z 这三个变量保存在文件temp.mat 中。
matlab绘图的坐标轴数字、范围、间隔控制.
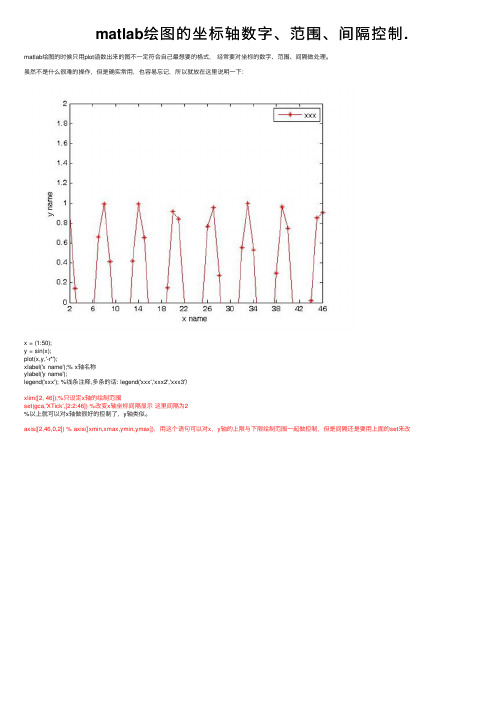
matlab绘图的坐标轴数字、范围、间隔控制. matlab绘图的时候只⽤plot函数出来的图不⼀定符合⾃⼰最想要的格式,经常要对坐标的数字、范围、间隔做处理。
虽然不是什么很难的操作,但是确实常⽤,也容易忘记,所以就放在这⾥说明⼀下:
x = (1:50);
y = sin(x);
plot(x,y,'-r*');
xlabel('x name');% x轴名称
ylabel('y name');
legend('xxx'); %线条注释,多条的话: legend('xxx','xxx2','xxx3')
xlim([2, 46]);%只设定x轴的绘制范围
set(gca,'XTick',[2:2:46]) %改变x轴坐标间隔显⽰这⾥间隔为2
%以上就可以对x轴做很好的控制了,y轴类似。
axis([2,46,0,2]) % axis([xmin,xmax,ymin,ymax]),⽤这个语句可以对x,y轴的上限与下限绘制范围⼀起做控制,但是间隔还是要⽤上⾯的set来改。
matlab绘图注释命令
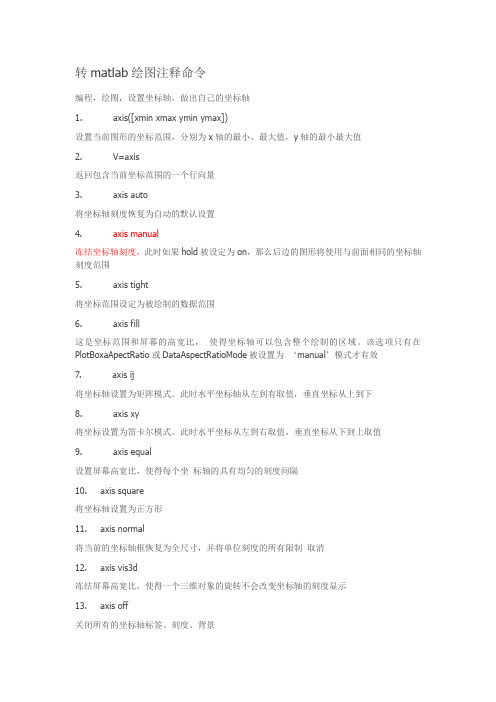
转matlab绘图注释命令编程,绘图,设置坐标轴,做出自己的坐标轴1. axis([xmin xmax ymin ymax])设置当前图形的坐标范围,分别为x轴的最小、最大值,y轴的最小最大值2. V=axis返回包含当前坐标范围的一个行向量3. axis auto将坐标轴刻度恢复为自动的默认设置4. axis manual冻结坐标轴刻度,此时如果hold被设定为on,那么后边的图形将使用与前面相同的坐标轴刻度范围5. axis tight将坐标范围设定为被绘制的数据范围6. axis fill这是坐标范围和屏幕的高宽比,使得坐标轴可以包含整个绘制的区域。
该选项只有在PlotBoxaApectRatio或DataAspectRatioMode被设置为‘manual’模式才有效7. axis ij将坐标轴设置为矩阵模式。
此时水平坐标轴从左到有取值,垂直坐标从上到下8. axis xy将坐标设置为笛卡尔模式。
此时水平坐标从左到右取值,垂直坐标从下到上取值9. axis equal设置屏幕高宽比,使得每个坐标轴的具有均匀的刻度间隔10. axis square将坐标轴设置为正方形11. axis normal将当前的坐标轴框恢复为全尺寸,并将单位刻度的所有限制取消12. axis vis3d冻结屏幕高宽比,使得一个三维对象的旋转不会改变坐标轴的刻度显示13. axis off关闭所有的坐标轴标签、刻度、背景14. axis on打开所有的坐标轴标签、刻度、背景本章主要内容:4.1 二维图形4.2 三维图形4.3 图形处理的基本技术4.4 图形处理的高级技术4.5 图形窗口4.1 二维图形二维图形的绘制是MATLAB图形处理的基础,在数值计算的过程中,用户可通过MATLAB函数将计算结果图形化,以实现对结果数据的深层次理解。
4.1.1 基本绘图指令绘制函数——plot函数函数能够将向量或者矩阵中的数据绘制在图形窗体中,并且可以指定不同的线型和色彩基本格式绘制一条曲线plot(xdata,ydata,’color_linestyle_marker’)绘制多条曲线plot(xdata1,ydata1,’clm1’,xdata2,ydata2,’clm2’,……)设置曲线线型、颜色以及标识的控制符Plot绘图相关命令4.1.2 二维特殊函数图4.2 三维图形4.2.1 基本绘图命令plot3、网图函数、着色图1.plot32.网图函数特殊的三维图形函数4.3 图形处理的基本技术图形控制、图形标注、图形保持、子图的绘制4.3.1图形控制1.坐标轴控制axis2.坐标轴缩放zoomZoom的控制符:当zoom处于on时,可通过鼠标进行图形缩放3. 图形的标注(1) 坐标轴标注:title为图形添加标题、xlablel,ylabel为坐标轴添加标注标注时指数或分母应放在大括号内{}(2)文本标注Text(x,y,’标注文本及控制字符串’)(3)交互文本标注gtext:用户可通过鼠标来选择文本输入点(4)图例标注legend4.图形保持与子图(1)图形保持Hold on 启动图形保持Hold off 关闭图形保持Hold 切换(2)子图Subplot(m,n,p)分割图形窗口成m*n个子绘图区,并从左至右编号注:对一个子图进行图形设置不影响其它子图4.4 图形处理的高级技术1. 颜色映像:默认状态为64*3的颜色矩阵,每个颜色映像均描述了64种颜色的RGB 属性。
MATLAB的基本使用教程
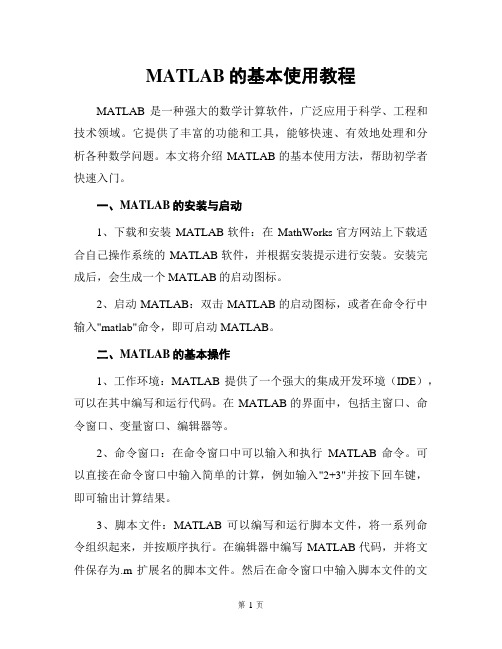
MATLAB的基本使用教程MATLAB是一种强大的数学计算软件,广泛应用于科学、工程和技术领域。
它提供了丰富的功能和工具,能够快速、有效地处理和分析各种数学问题。
本文将介绍MATLAB的基本使用方法,帮助初学者快速入门。
一、MATLAB的安装与启动1、下载和安装MATLAB软件:在MathWorks官方网站上下载适合自己操作系统的MATLAB软件,并根据安装提示进行安装。
安装完成后,会生成一个MATLAB的启动图标。
2、启动MATLAB:双击MATLAB的启动图标,或者在命令行中输入"matlab"命令,即可启动MATLAB。
二、MATLAB的基本操作1、工作环境:MATLAB提供了一个强大的集成开发环境(IDE),可以在其中编写和运行代码。
在MATLAB的界面中,包括主窗口、命令窗口、变量窗口、编辑器等。
2、命令窗口:在命令窗口中可以输入和执行MATLAB命令。
可以直接在命令窗口中输入简单的计算,例如输入"2+3"并按下回车键,即可输出计算结果。
3、脚本文件:MATLAB可以编写和运行脚本文件,将一系列命令组织起来,并按顺序执行。
在编辑器中编写MATLAB代码,并将文件保存为.m扩展名的脚本文件。
然后在命令窗口中输入脚本文件的文件名(不带扩展名),按下回车键即可执行脚本文件中的代码。
4、变量和赋值:在MATLAB中,可以创建和操作各种类型的变量。
例如,可以使用"="符号将一个值赋给一个变量,例如"A=5"。
在后续的计算和分析中,可以使用这个变量,例如输入"B=A+3",结果B 将被赋值为8。
5、矩阵和向量:MATLAB中的基本数据结构是矩阵和向量。
可以使用方括号[]来创建矩阵和向量,并使用逗号或空格来分隔不同的元素。
例如,"[1,2,3]"表示一个包含3个元素的行向量。
6、矩阵运算:MATLAB提供了丰富的矩阵运算符和函数,可以对矩阵进行各种运算。
使用matlab绘制三维图形的方法

使用matlab绘制三维图形的方法要使用MATLAB绘制三维图形,首先需要了解MATLAB中的三维绘图函数和绘图选项。
下面将介绍一些常用的绘制三维图形的方法。
1.绘制基本的三维图形要绘制基本的三维图形,可以使用以下函数:- plot3(函数:用于在三维坐标系中绘制线条。
- scatter3(函数:用于在三维坐标系中绘制散点图。
- surf(函数:用于绘制三维曲面图。
- mesh(函数:用于绘制三维网格图。
- bar3(函数:用于绘制三维条形图。
- contour3(函数:用于绘制三维等高线图。
例如,下面的代码演示了如何使用plot3(函数绘制一个三维线条图:```x = linspace(0, 2*pi, 100);y = sin(x);z = cos(x);plot3(x, y, z, 'LineWidth', 2);xlabel('X');ylabel('Y');zlabel('Z');title('3D Line Plot');```2.添加颜色和纹理在绘制三维图形时,可以使用颜色和纹理来增加图形的信息。
MATLAB 提供了一系列函数来处理颜色和纹理,如:- colormap(函数:用于设置颜色映射。
- caxis(函数:用于设置坐标轴范围。
- shading(函数:用于设置颜色插值方法。
- texturemap(函数:用于设置纹理映射方法。
例如,下面的代码展示了如何使用纹理映射来绘制一个球体:```[X, Y, Z] = sphere(50);C = colormap('jet');surface(X, Y, Z, 'FaceColor', 'texturemap', 'CData', C);axis equal;```3.绘制多个数据集要在同一张图中绘制多个数据集,可以使用hold on和hold off命令。
matlab中plot3函数的用法

MATLAB是一种强大的科学计算软件,它提供了丰富的绘图函数,其中包括plot3函数,该函数能够绘制三维曲线图。
在本文中,我们将详细介绍plot3函数的用法,包括参数的设置和实际应用。
1. plot3函数的基本用法plot3函数是MATLAB中用于绘制三维曲线图的函数,其基本语法为:plot3(X,Y,Z)其中,X、Y和Z分别是包含曲线上点的x、y和z坐标的向量。
当调用plot3函数时,MATLAB会将这些点连成曲线,并绘制在三维坐标系中。
2. 参数设置plot3函数可以接受多达四个输入参数,使用不同的参数可以实现不同的效果。
常用的参数包括线型、线宽和颜色等。
以下是plot3函数中常用的参数设置方法:- 指定线型:plot3(X,Y,Z,'LineStyle'),其中LineStyle可以是实线('-')、虚线('--')、点线(':')等。
- 指定线宽:plot3(X,Y,Z,'LineWidth',width),其中width为线的宽度。
- 指定颜色:plot3(X,Y,Z,'Color',color),其中color可以是预定义的颜色('r'表示红色)或RGB值。
3. 点和线的样式设置除了基本的参数设置外,plot3函数还可以根据需要设置点和线的样式。
可以使用plot3(X,Y,Z,'o')来绘制原点,使用plot3(X,Y,Z,'*')来绘制星号等。
这些样式设置可以使曲线图更加美观和易于理解。
4. 多个曲线的绘制在实际应用中,可能需要在同一张图中绘制多条曲线,这时可以多次调用plot3函数来实现。
例如:plot3(X1,Y1,Z1)hold onplot3(X2,Y2,Z2)hold off这样就可以在同一张图中绘制出两条曲线。
需要注意的是,为了在同一张图中绘制多条曲线,需要使用hold on和hold off命令来控制绘图区的保持和释放。
matlab极坐标绘图函数
matlab极坐标绘图函数Matlab是一款功能强大的数值计算软件,其中的极坐标绘图功能可以用于绘制各种复杂的极坐标图。
极坐标图是一种特殊的坐标系,它的坐标系原点不是原点,而是圆心。
在Matlab中,有一组特殊的函数,可以实现极坐标绘图的功能。
下面介绍一些Matlab中的极坐标绘图函数。
1. polar:这个函数用于绘制一个极坐标图,并用极轴来绘制线条。
它接受两个参数,分别代表极坐标图中的极轴和线条参数。
它可以用来绘制一些复杂的多边形和折线曲线等。
2. polarplot:这个函数用于绘制极坐标图,并绘制线条,点和曲线等。
它接受三个参数,分别代表极坐标图中的极轴和线条及点参数。
它可以用来绘制一些复杂的曲线和图形,也可以用来比较不同数据点之间的关系。
3. pcolor:这个函数用于绘制一个彩色极坐标图。
它接受两个参数,分别代表极坐标图中的极轴和彩色图。
它可以用来表示复杂彩色图形,并可以将数据与极坐标图联系起来。
4. polarhist:这个函数用于绘制极坐标图上的直方图,接受两个参数,分别代表极坐标图中的极轴和直方图参数。
它可以用来绘制一些统计比较相关的图形,并与极坐标图联系起来。
以上就是Matlab中的极坐标绘图函数,它们能够提供极大的帮助,以绘制出各种复杂的极坐标图形,使用者可以根据需要,选择合适的函数进行绘图。
极坐标图在一定程度上比普通坐标图更容易解决数学统计问题。
例如,极坐标图可以用来识别曲线或函数中的极大值和极小值点,以及相关统计信息。
另外,由于极坐标图可以创建出多边形图形,因此它们也可以用来绘制一些特殊的几何图形,使得数学几何模型更加清晰明了。
此外,Matlab中的极坐标绘图函数还可以与其他绘图函数结合使用,例如,可以使用polarplot函数绘制极坐标图,然后使用Matlab 自带的函数实现曲线拟合。
这样,用户可以通过Matlab自己的函数,将极坐标图转换为普通坐标图,从而更加灵活的探索数据和发现更多的统计规律。
MATLAB第3讲 MATLAB基本绘图

3.3 基本三维绘图
[X,Y]=meshgrid(-8:0.5:8,-8:0.5,8);
3.3 基本三维绘图
2、格式2:mesh(x,y,z) 功能:x,y,z 为三个矩阵, 以各元素值为三维坐标点绘图, 并连成网格。
3.3 基本三维绘图
例题 7 画一个球体 [xx,yy,zz]=sphere(30);
0
n
3.3 基本三维绘图
形成了33*33网 格矩阵
3.3 基本三维绘图
可以使用meshgrid()函数产生网格坐标:
格式:[X,Y]=meshgrid(x,y) x,y为同维向量,
X的行为x的拷贝,Y的列是y的拷贝,X,Y同维 例如:[xx,yy]=meshgrid([ 1 2 3 4],[1 2 3 4])
3.3 基本三维绘图
3、格式3:plot3(x,y,z,’s’) plot3(x1,y1,z1,’s1’,x2,y2,z2,’s2’) 功能:用于设置绘图颜色和线型 字符串意义同plot。
例如:plot3(x,y,z,’*r’,x,z,y,’:b’)
3.3 基本三维绘图
例题 2
3.3 基本三维绘图
3、hidden on(off) ----隐藏或透视被遮挡的地方
视角变换与三视图
三维图形绘制中的视角定义
z轴
视点
y轴
仰角
方位角
x轴
3.3 基本三维绘图
3. 4 特殊三维绘图 特殊图形库(specgraph)
1、stem3(x,y,z) ----- 三维火柴杆图: 例如:stem3(x,y,z) 2、bar3(z) ------ 三维条形图(同二维) 例如:bar3([1 2 3 2 1]) 3、pie3 (x,p)------ 三维饼图(同二维): 例如:pie3([1 2 3 2 1 1 ],[0 0 1 0 0 0]) 还有其它特殊函数。。。
MATLAB第三节 绘图

2,0.5],[0,2]上画隐函数 的图. 【例】 在[-2,0.5],[0,2]上画隐函数 e x + sin( xy ) = 0 的图 ezplot('exp(x)+sin(x*y)',[ezplot('exp(x)+sin(x*y)',[-2,0.5,0,2])
ezplot(‘x(t) , y(t) ezplot( x(t)’,’y(t) ,[tmin,tmax]) x(t) y(t)’,[tmin,tmax])
上画y=cos x 的图形 的图形. 【例】 在[0,π ]上画 上画
ezplot('sin(x)',[0,pi])
ezplot(‘f(x,y) ,[xmin,xmax,ymin,ymax]) ezplot( f(x,y)’,[xmin,xmax,ymin,ymax]) f(x,y)
note:表示在区间xmin<x<xmax和 ymin<y<ymax绘制隐 函数f(x,y)=0的函数图.
4.2特殊坐标图形 特殊坐标图形
semilogx(x,y)—单对数X semilogx(x,y) 单对数X轴绘图命令 semilogy(x,y)—单对数Y轴绘图命令 semilogy(x,y) 单对数Y
【例】以X轴为对数重新绘制上述曲线; 轴为对数重新绘制上述曲线; x=[0:0.01:2*pi] y=abs(1000*sin(4*x))+1 单对数X semilogx(x,y) %单对数X轴绘图 【例】以Y轴为对数重新绘制上述曲线; 轴为对数重新绘制上述曲线; x=[0:0.01:2*pi] y=abs(1000*sin(4*x))+1 单对数Y semilogy(x,y) %单对数Y轴绘图
matlab绘图常见命令
例:x(1,:)=0:pi/50:2*pi;
x(2,:)=pi/4:pi/50:2*pi+pi/4;
x(3,:)=pi/2:pi/50:2*pi+pi/2;
y(1,:)=sin(x(1,:));
y(2,:)=0.6*sin(x(2,:));
y2=cos(t);
y3=sin(t).*cos(t);
plot(t,y1, '-r',t,y2, ':g',t,y3, '*b')
该程序还可以按下面的方式写:
t=0:0.1:2*pi;
y1=sin(t);
y2=cos(t);
y3=sin(t).*cos(t);
plot(t,y1, '-r')
3.每个坐标系都有唯一的标识符,即句柄值;
4.当前坐标系句柄可以由MATLAB函数gca获得;
5.使某个句柄标识的坐标系成为当前坐标系,可用如下函数:axes(h) h为指定坐标系句柄值.
6.一些有关坐标轴的函数:
1)定义坐标范围:一般MATLAB自动定义坐标范围,如用户认为设定的不合适,可用:axis([Xmin, Xmax, Ymin, Ymax]) 来重新设定;
例:设置绘图线的线型,颜色,宽度,标记点的颜色及大小.
t=0:pi/20:pi;
y=sin(4*t).*sin(t)/2;
plot(t,y,'-bs','LineWidth',2,... %设置线的宽度为2
'MarkerEdgeColor','k',... %设置标记点边缘颜色为黑色
教你如何用MATLAB绘图(全面)
强大的绘图功能是Matlab的特点之一,Matlab提供了一系列的绘图函数,用户不需要过多的考虑绘图的细节,只需要给出一些基本参数就能得到所需图形,这类函数称为高层绘图函数。
此外,Matlab还提供了直接对图形句柄进行操作的低层绘图操作。
这类操作将图形的每个图形元素(如坐标轴、曲线、文字等)看做一个独立的对象,系统给每个对象分配一个句柄,可以通过句柄对该图形元素进行操作,而不影响其他部分。
本章介绍绘制二维和三维图形的高层绘图函数以及其他图形控制函数的使用方法,在此基础上,再介绍可以操作和控制各种图形对象的低层绘图操作。
一.二维绘图二维图形是将平面坐标上的数据点连接起来的平面图形。
可以采用不同的坐标系,如直角坐标、对数坐标、极坐标等。
二维图形的绘制是其他绘图操作的基础。
一.绘制二维曲线的基本函数在Matlab中,最基本而且应用最为广泛的绘图函数为plot,利用它可以在二维平面上绘制出不同的曲线。
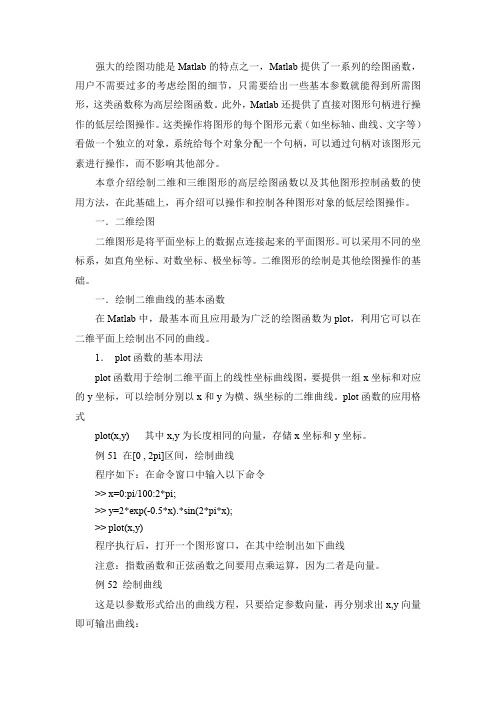
1.plot函数的基本用法plot函数用于绘制二维平面上的线性坐标曲线图,要提供一组x坐标和对应的y坐标,可以绘制分别以x和y为横、纵坐标的二维曲线。
plot函数的应用格式plot(x,y)其中x,y为长度相同的向量,存储x坐标和y坐标。
例51在[0,2pi]区间,绘制曲线程序如下:在命令窗口中输入以下命令>>x=0:pi/100:2*pi;>>y=2*exp(-0.5*x).*sin(2*pi*x);>>plot(x,y)程序执行后,打开一个图形窗口,在其中绘制出如下曲线注意:指数函数和正弦函数之间要用点乘运算,因为二者是向量。
例52绘制曲线这是以参数形式给出的曲线方程,只要给定参数向量,再分别求出x,y向量即可输出曲线:>>t=-pi:pi/100:pi;>>x=t.*cos(3*t);>>y=t.*sin(t).*sin(t);>>plot(x,y)程序执行后,打开一个图形窗口,在其中绘制出如下曲线以上提到plot函数的自变量x,y为长度相同的向量,这是最常见、最基本的用法。
MATLAB绘图的指令
绘图的指令1、plot函数MATLAB中最常用的绘图函数是plot( )。
其基本调用格式为:plot(x, y ),其中x, y均为向量,该函数表示以x向量作为X轴,以y向量作为Y轴。
示例3:绘制从0 ~ 4范围的正弦函数曲线。
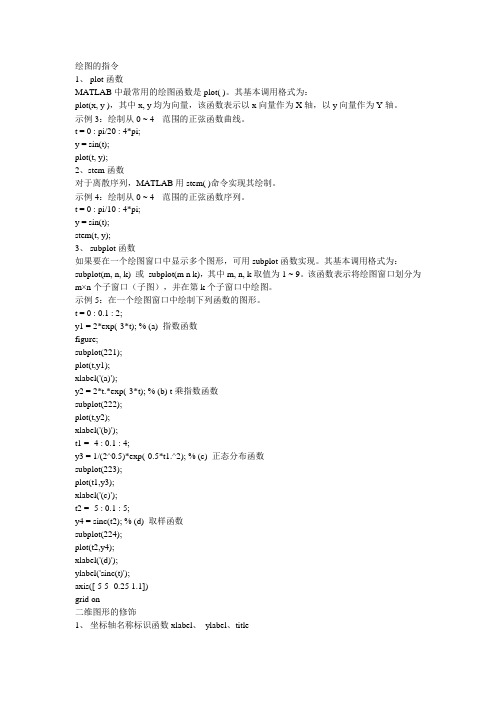
t = 0 : pi/20 : 4*pi;y = sin(t);plot(t, y);2、stem函数对于离散序列,MATLAB用stem( )命令实现其绘制。
示例4:绘制从0 ~ 4范围的正弦函数序列。
t = 0 : pi/10 : 4*pi;y = sin(t);stem(t, y);3、subplot函数如果要在一个绘图窗口中显示多个图形,可用subplot函数实现。
其基本调用格式为:subplot(m, n, k) 或subplot(m n k),其中m, n, k取值为1 ~ 9。
该函数表示将绘图窗口划分为m×n个子窗口(子图),并在第k个子窗口中绘图。
示例5:在一个绘图窗口中绘制下列函数的图形。
t = 0 : 0.1 : 2;y1 = 2*exp(-3*t); % (a) 指数函数figure;subplot(221);plot(t,y1);xlabel('(a)');y2 = 2*t.*exp(-3*t); % (b) t乘指数函数subplot(222);plot(t,y2);xlabel('(b)');t1 = -4 : 0.1 : 4;y3 = 1/(2^0.5)*exp(-0.5*t1.^2); % (c) 正态分布函数subplot(223);plot(t1,y3);xlabel('(c)');t2 = -5 : 0.1 : 5;y4 = sinc(t2); % (d) 取样函数subplot(224);plot(t2,y4);xlabel('(d)');ylabel('sinc(t)');axis([-5 5 -0.25 1.1])grid on二维图形的修饰1、坐标轴名称标识函数xlabel、ylabel、title绘制 的nyquist 图和bode 图102.110)(2++=s s s G解MATLAB编程如下:»num=[10];»den=[1,1.2,10];»w=logspace(-2,2,1000); » nyquist(num,den,w)»grid»bode(num,den,w)»grid极小化»fx='10*exp(-x)*cos(x)';»fplot(fx,[2,5])»xmin=fmin(fx,2,5)xmin =2.35619746669214求零点»xzero=fzero(fx,5)xzero =4.71238898038469»xzero=fzero(fx,2)xzero =1.57079632679490曲线拟合»x=0:0.1:1;»y=[-.447 1.978 3.28 6.16 7.08 7.34 7.66 9.56 9.48 9.30 11.2];»p=polyfit(x,y,2);»xi=0:0.01:1;»yi=polyval(p,xi);»plot(x,y,xi,yi) 三维图形»x=-4:0.1:4;»y=x;»[x,y]=meshgrid(x,y);»z = 3*(1-x).^2.*exp(-(x.^2) - (y+1).^2) ...- 10*(x/5 - x.^3 - y.^5).*exp(-x.^2-y.^2) ...- 1/3*exp(-(x+1).^2 - y.^2);»mesh(x,y,z)二维图形»x=0:0.01:pi*3;»y=sin(x);»plot(x,y)»title('First Figure Example')»xlabel('Time(s)')»ylabel('Value(v)')»grid on»gtext(‘sinx’)»legend(‘sinx’)管理命令和函数help 在线帮助文件doc 装入超文本说明what M、MA T、MEX文件的目录列表 type 列出M文件lookfor 通过help条目搜索关键字which 定位函数和文件Demo 运行演示程序Path 控制MATLAB的搜索路径管理变量和工作空间Who 列出当前变量Whos 列出当前变量(长表) Load 从磁盘文件中恢复变量 Save 保存工作空间变量Clear 从内存中清除变量和函数Pack 整理工作空间内存Size 矩阵的尺寸Length 向量的长度disp 显示矩阵或与文件和*作系统有关的命令cd 改变当前工作目录Dir 目录列表Delete 删除文件Getenv 获取环境变量值! 执行DOS*作系统命令Unix 执行UNIX*作系统命令并返回结果Diary 保存MA TLAB任务控制命令窗口Cedit 设置命令行编辑 Clc 清命令窗口Home 光标置左上角Format 设置输出格式Echo 底稿文件内使用的回显命令more 在命令窗口中控制分页输出启动和退出MA TLABQuit 退出MATLABStartup 引用MA TLAB时所执行的M文件Matlabrc 主启动M文件*作符和特殊字符+ 加—减* 矩阵乘法.* 数组乘法^ 矩阵幂.^ 数组幂\ 左除或反斜杠/ 右除或斜杠./ 数组除Kron Kronecker张量积: 冒号( ) 圆括号[ ] 方括号. 小数点.. 父目录…继续, 逗号; 分号% 注释! 感叹号‘转置或引用= 赋值= = 相等< > 关系*作符& 逻辑与| 逻辑或~ 逻辑非xor 逻辑异或逻辑函数Exist 检查变量或函数是否存在Any 向量的任一元为真,则其值为真All 向量的所有元为真,则其值为真Find 找出非零元素的索引号三角函数Sin 正弦Sinh 双曲正弦Asin 反正弦Asinh 反双曲正弦Cos 余弦Cosh 双曲余弦Acos 反余弦Acosh 反双曲余弦Tan 正切Tanh 双曲正切Atan 反正切Atan2 四象限反正切Atanh 反双曲正切Sec 正割Sech 双曲正割Asech 反双曲正割Csc 余割Csch 双曲余割Acsc 反余割Acsch 反双曲余割Cot 余切Coth 双曲余切Acot 反余切Acoth 反双曲余切指数函数Exp 指数Log 自然对数Log10 常用对数Sqrt 平方根复数函数Abs 绝对值Argle 相角Conj 复共轭Image 复数虚部Real 复数实部特殊变量和常数Ans 当前的答案Eps 相对浮点精度Realmax 最大浮点数Realmin 最小浮点数Pi 圆周率I,j 虚数单位Inf 无穷大Nan 非数值Flops 浮点运算次数Nargin 函数输入变量数Nargout 函数输出变量数基本X—Y图形Plot 线性图形Loglog 对数坐标图形Semilogx半对数坐标图形(X轴为对数坐标) Semilogy 半对数坐标图形(Y轴为对数坐标) Fill 绘制二维多边形填充图特殊X—Y图形Polar 极坐标图Bar 条形图Stem 离散序列图或杆图Stairs 阶梯图Errorbar 误差条图Hist 直方图Rose 角度直方图Compass 区域图Feather 箭头图Fplot 绘图函数Comet 星点图图形注释Title 图形标题Xlabel X轴标记Ylabel Y轴标记Text 文本注释Gtext 用鼠标放置文本Grid 网格线MATLAB不但擅长於矩阵相关的数值运算,也适合用在各种科学目视表示(Scientific visualization)。
matlab画直角坐标图

Matlab画直角坐标图直角坐标图(又称笛卡尔坐标图)是用来表示平面上点的坐标的一种图形表示方法。
Matlab是一个强大的数值计算和数据可视化工具,它提供了丰富的绘图函数和工具箱,使得绘制直角坐标图变得非常简便。
下面将介绍如何使用Matlab画出直角坐标图的步骤。
步骤一:准备数据在绘制直角坐标图之前,我们首先需要准备要绘制的数据。
假设我们要绘制以下函数的图像:y = sin(x)这里可以选择任意的x值范围,以及步长。
为了简化,我们选择绘制x从0到2π的函数曲线。
步骤二:创建坐标系在Matlab中,我们可以使用figure函数创建一个新的绘图窗口。
然后使用plot函数绘制函数曲线,同时可以使用xlabel和ylabel函数为坐标轴添加标签,使用title函数为图像添加标题。
figure; % 创建新的绘图窗口x = 0:0.01:2*pi; % 定义x的取值范围,步长为0.01y = sin(x); % 计算对应的y值plot(x, y); % 绘制函数曲线xlabel('x'); % 添加x轴标签ylabel('y'); % 添加y轴标签title('y = sin(x)'); % 添加标题步骤三:设置坐标轴范围通过axis函数可以设置坐标轴的范围。
对于直角坐标图,一般设置x轴和y轴的范围相同,以保证图像是按比例绘制的。
axis([02*pi -11]); % 设置x轴范围为0到2π,y轴范围为-1到1步骤四:添加图例如果在同一张图上绘制了多个函数曲线,可以使用legend函数添加图例,以区分不同的曲线。
legend('y = sin(x)'); % 添加图例,标注函数曲线的名称步骤五:美化图像Matlab提供了丰富的绘图样式设置,可以通过修改绘图参数来美化图像。
例如,可以使用grid函数添加背景网格线,使用linewidth设置曲线的线宽等。
Matlab绘图坐标轴的设置
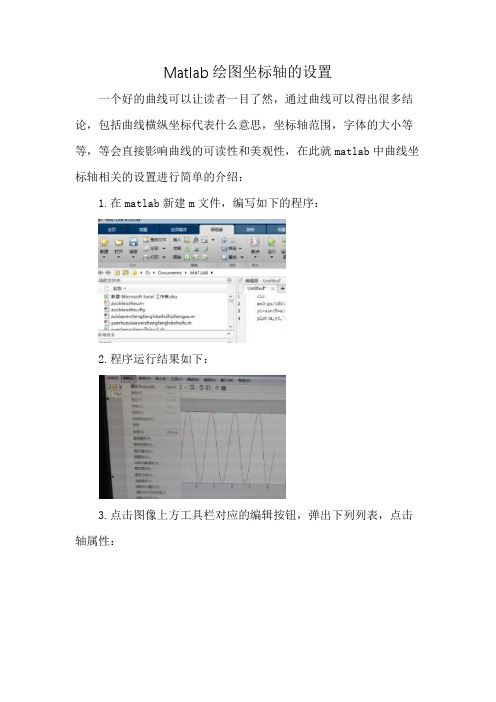
Matlab绘图坐标轴的设置
一个好的曲线可以让读者一目了然,通过曲线可以得出很多结论,包括曲线横纵坐标代表什么意思,坐标轴范围,字体的大小等等,等会直接影响曲线的可读性和美观性,在此就matlab中曲线坐标轴相关的设置进行简单的介绍:
1.在matlab新建m文件,编写如下的程序:
2.程序运行结果如下:
3.点击图像上方工具栏对应的编辑按钮,弹出下列列表,点击轴属性:
4.出现轴属性相关的各种操作,左侧有标题控制栏,可以对曲线添加标题,设置图像的背景颜色,给图像添加网格等操作,操作之后如下图所示:
5.在右侧有坐标轴控制相关的操作,X轴,Y轴,Z轴,字体等操作,标签用于显示坐标轴对应的名称,X范围用于设置坐标轴范围,X刻度可以选择线性或者对数的:
6.右侧有一个更多属性选择按钮,点击可以对曲线进行更多的
操作:包括背景颜色,字体大小,字体颜色,摄像机位置等等
7.设置完成后,最终曲线的结果如下图所示:。
matlab绘图教学课件

坐标轴范围
使用xlim和ylim命令控制坐标轴的范围。
坐标轴比例
使用axis命令设置坐标轴的比例,如axis equal确保x轴和y轴比例 一致。
坐标轴标签字体和颜色
使用set命令设置坐标轴标签的字体和颜色等属性。
CHAPTER
02
绘制二维图形
绘制线形图
总结词
展示数据变化趋势
详细描述
线形图用于展示数据随时间或其他变量的变化趋势,通过连接数据点形成线条 ,可以直观地展示数据的走势。
绘制三维柱状图
总结词
三维柱状图是一种展示三维空间中数据分布的图表类型,可以清晰地展示各个数据点在 三个维度上的差异。
详细描述
在Matlab中,可以使用bar3函数绘制三维柱状图。该函数可以接受三个维度的数据, 并按照指定的样式绘制三维柱状图。可以通过调整柱子的颜色、透明度、大小等属性,
来增强三维柱状图的视觉效果。
CHAPTER
05
Matlab绘图应用实例
绘制股票价格走势图
总结词
展示股票价格随时间变化的趋势
详细描述
使用Matlab绘制股票价格走势图,可以清晰地展示股票 价格随时间的变化趋势。通过将股价数据导入Matlab中 ,并使用绘图函数进行绘制,可以方便地观察股票价格 的波动情况。
绘制雷达图
总结词
展示多维数据的综合表现
Matlab绘图教学课件
CONTENTS
目录
• Matlab绘图基础 • 绘制二维图形 • 绘制三维图形 • 图形的高级处理 • Matlab绘图应用实例
CHAPTER
01
Matlab绘图基础
基础绘图函数
01 plot函数:用于绘制二维线图,是最常用 的绘图函数。
matlab绘图知识点总结
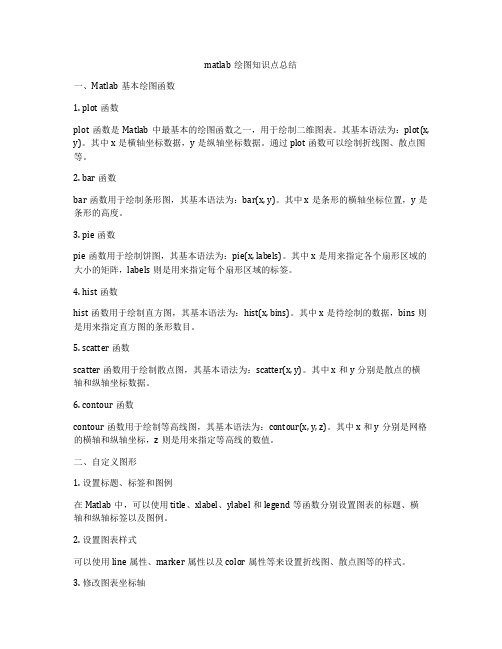
matlab绘图知识点总结一、Matlab基本绘图函数1. plot函数plot函数是Matlab中最基本的绘图函数之一,用于绘制二维图表。
其基本语法为:plot(x, y)。
其中x是横轴坐标数据,y是纵轴坐标数据。
通过plot函数可以绘制折线图、散点图等。
2. bar函数bar函数用于绘制条形图,其基本语法为:bar(x, y)。
其中x是条形的横轴坐标位置,y是条形的高度。
3. pie函数pie函数用于绘制饼图,其基本语法为:pie(x, labels)。
其中x是用来指定各个扇形区域的大小的矩阵,labels则是用来指定每个扇形区域的标签。
4. hist函数hist函数用于绘制直方图,其基本语法为:hist(x, bins)。
其中x是待绘制的数据,bins则是用来指定直方图的条形数目。
5. scatter函数scatter函数用于绘制散点图,其基本语法为:scatter(x, y)。
其中x和y分别是散点的横轴和纵轴坐标数据。
6. contour函数contour函数用于绘制等高线图,其基本语法为:contour(x, y, z)。
其中x和y分别是网格的横轴和纵轴坐标,z则是用来指定等高线的数值。
二、自定义图形1. 设置标题、标签和图例在Matlab中,可以使用title、xlabel、ylabel和legend等函数分别设置图表的标题、横轴和纵轴标签以及图例。
2. 设置图表样式可以使用line属性、marker属性以及color属性等来设置折线图、散点图等的样式。
3. 修改图表坐标轴可以使用xlim、ylim函数来设置图表的横轴和纵轴范围,并使用xticks和yticks函数来设置坐标刻度。
4. 绘制多个数据集可以使用hold on函数来绘制多个数据集,并使用hold off函数来结束绘制多个图表。
5. 设置图表背景可以使用grid、box、axis equal等函数来设置图表的背景。
三、子图表绘制1. subplot函数subplot函数用于在一个图形窗口中绘制多个子图表,其基本语法为:subplot(m,n,p)。
Matlab绘图和坐标操作
Matlab绘图和坐标操作a=linspace(1,2,10)plot(a,'--pr','linewidth',1.5,'MarkerEdgeColor','r','MarkerFaceColor','m','MarkerSize',10)legend('a','Location','best')title('a','FontName','Times New Roman','FontWeight','Bold','FontSize',16)xlabel('T','FontName','Times New Roman','FontSize',14)ylabel('a','FontName','Times New Roman','FontSize',14,'Rotation',0)axis auto equalset(gca,'FontName','Times New Roman','FontSize',14)1.曲线线型、颜色和标记点类型plot(X1,Y1,LineSpec, …) 通过字符串LineSpec指定曲线的线型、颜色及数据点的标记类型。
线型颜色数据点标记类型标识符意义标识符意义标识符意义- 实线r 红色+ 加号-. 点划线g 绿色o 圆圈-- 虚线b 蓝色* 星号: 点线c 蓝绿色. 点m 洋红色x 交叉符号y 黄色square(或s) 方格k 黑色diamond(或d) 菱形w 白色^ 向上的三角形v 向下的三角形> 向左的三角形< 向右的三角形pentagram(或p) 五边形hexagram(或h) 六边形2.设置曲线线宽、标记点大小,标记点边框颜色和标记点填充颜色等。
Matlab---绘图中坐标系显示设置
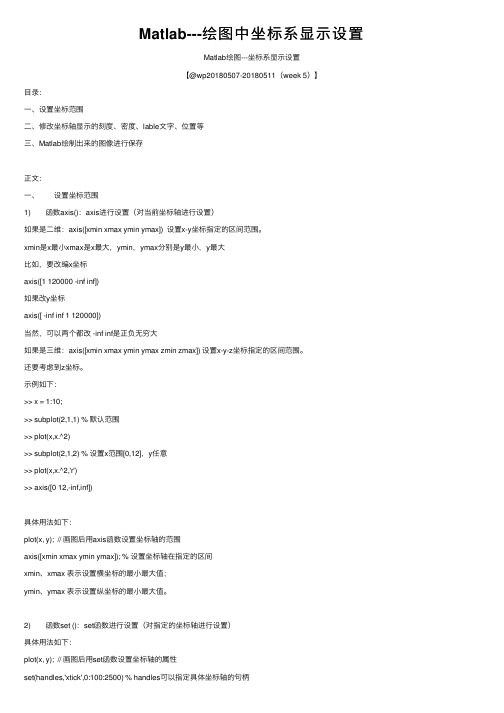
Matlab---绘图中坐标系显⽰设置Matlab绘图---坐标系显⽰设置【@wp20180507-20180511(week 5)】⽬录:⼀、设置坐标范围⼆、修改坐标轴显⽰的刻度、密度、lable⽂字、位置等三、Matlab绘制出来的图像进⾏保存正⽂:⼀、设置坐标范围1) 函数axis():axis进⾏设置(对当前坐标轴进⾏设置)如果是⼆维:axis([xmin xmax ymin ymax]) 设置x-y坐标指定的区间范围。
xmin是x最⼩xmax是x最⼤,ymin,ymax分别是y最⼩,y最⼤⽐如,要改编x坐标axis([1 120000 -inf inf])如果改y坐标axis([ -inf inf 1 120000])当然,可以两个都改 -inf inf是正负⽆穷⼤如果是三维:axis([xmin xmax ymin ymax zmin zmax]) 设置x-y-z坐标指定的区间范围。
还要考虑到z坐标。
⽰例如下:>> x = 1:10;>> subplot(2,1,1) % 默认范围>> plot(x,x.^2)>> subplot(2,1,2) % 设置x范围[0,12],y任意>> plot(x,x.^2,'r')>> axis([0 12,-inf,inf])具体⽤法如下:plot(x, y); // 画图后⽤axis函数设置坐标轴的范围axis([xmin xmax ymin ymax]); % 设置坐标轴在指定的区间xmin、xmax 表⽰设置横坐标的最⼩最⼤值;ymin、ymax 表⽰设置纵坐标的最⼩最⼤值。
2) 函数set ():set函数进⾏设置(对指定的坐标轴进⾏设置)具体⽤法如下:plot(x, y); // 画图后⽤set函数设置坐标轴的属性set(handles,'xtick',0:100:2500) % handles可以指定具体坐标轴的句柄功能:设置X轴坐标范围0到2500,显⽰间隔是100;set(handles,'ytick',0:100:2500) % handles可以指定具体坐标轴的句柄功能:设置X轴坐标范围0到2500,显⽰间隔是100;3) 函数xlim( )/ ylim ( )使⽤⽅法: xlim([XMIN XMAX]) % sets the x limitsx轴上下限设定xlim([a,b]);y轴上下限设定ylim([a,b])% set(gca,'xlim',[-20 20],'ylim',[-20 20]); 表⽰:设置当前图的横轴和纵轴的范围,lim就是limite的意思。
- 1、下载文档前请自行甄别文档内容的完整性,平台不提供额外的编辑、内容补充、找答案等附加服务。
- 2、"仅部分预览"的文档,不可在线预览部分如存在完整性等问题,可反馈申请退款(可完整预览的文档不适用该条件!)。
- 3、如文档侵犯您的权益,请联系客服反馈,我们会尽快为您处理(人工客服工作时间:9:00-18:30)。
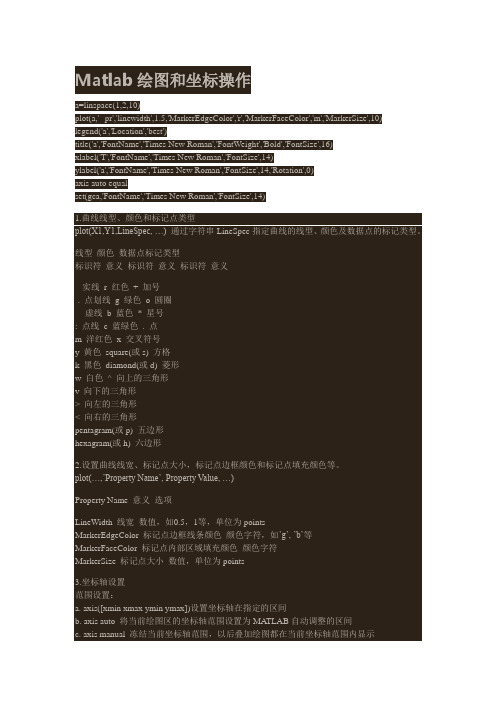
Matlab绘图和坐标操作引自:/blog-360646-465373.html1. 曲线线型、颜色和标记点类型plot(X1,Y1,LineSpec, …) 通过字符串LineSpec指定曲线的线型、颜色及数据点的标记类型。
线型颜色 数据点标记类型- 实线 r 红色 + 加号-. 点化线 g 绿色 o 圆圈-- 虚线 b 蓝色 * 星号: 点线 c 蓝绿色 . 点m 洋红色 x 交叉符号y 黄色 square(或s) 方格k 黑色 diamond(或d) 菱形w 白色 ^ 向上的三角形v 向下的三角形> 向左的三角形< 向右的三角形pentagram(或p) 五边形hexagram(或h) 六边形2. 设置曲线线宽、标记点大小,标记点边框颜色和标记点填充颜色等。
plot(…,’Property Name’, Property Value, …)Property Name 意义选项LineWidth 线宽数值,如0.5,1等,单位为pointsMarkerEdgeColor 标记点边框线条颜色颜色字符,如’g’,’b’等MarkerFaceColor 标记点内部区域填充颜色颜色字符MarkerSize 标记点大小数值,单位为points3. 坐标轴设置范围设置:a. axis([xmin xmax ymin ymax])设置坐标轴在指定的区间b. axis auto 将当前绘图区的坐标轴范围设置为MATLAB自动调整的区间c. axis manual 冻结当前坐标轴范围,以后叠加绘图都在当前坐标轴范围内显示d. axis tight 采用紧密模式设置当前坐标轴范围,即一用户数据范围为坐标轴范围比例:a. axis equal 等比例坐标轴b. axis square 以当前坐标轴范围为基础,将坐标轴区域调整为方格形c. axis normal 自动调整纵横轴比例,使当前坐标轴范围内的图形显示达到最佳效果范围选项和比例设置可以联合使用,默认的设置为axis auto normal4. 坐标轴刻度设置set(gca, ‘XTick’, [0 1 2]) X坐标轴刻度数据点位置set(gca,'XTickLabel',{'a','b','c'}) X坐标轴刻度处显示的字符set(gca,'FontName','Times New Roman','FontSize',14) 设置坐标轴刻度字体名称,大小‘FontWeight’,’bold’ 加粗‘FontAngle’,’italic’ 斜体对字体的设置也可以用在title, xlabel, ylabel等中5.图例legend函数的基本用法是LEGEND(string1,string2,string3, ...)分别将字符串1、字符串2、字符串3……标注到图中,每个字符串对应的图标为画图时的图标。
例如:plot(x,sin(x),'.b',x,cos(x),'+r')legend('sin','cos')这样可以把"."标识为'sin',把"+"标识为"cos"还可以用LEGEND(...,'Location',LOC) 来指定图例标识框的位置这些是Matlab help文件。
后面一段是对应的翻译和说明'North' inside plot box near top'South' inside bottom'East' inside right'West' inside left'NorthEast' inside top right (default)'NorthWest inside top left'SouthEast' inside bottom right'SouthWest' inside bottom left'NorthOutside' outside plot box near top'SouthOutside' outside bottom'EastOutside' outside right'WestOutside' outside left'NorthEastOutside' outside top right'NorthWestOutside' outside top left'SouthEastOutside' outside bottom right'SouthWestOutside' outside bottom left'Best' least conflict with data in plot'BestOutside' least unused space outside plot'North' 图例标识放在图顶端'South' 图例标识放在图底端'East' 图例标识放在图右方'West' 图例标识放在图左方'NorthEast' 图例标识放在图右上方(默认)'NorthWest 图例标识放在图左上方'SouthEast' 图例标识放在图右下角'SouthWest' 图例标识放在图左下角(以上几个都是将图例标识放在框图内)'NorthOutside' 图例标识放在图框外侧上方'SouthOutside' 图例标识放在图框外侧下方'EastOutside' 图例标识放在图框外侧右方'WestOutside' 图例标识放在图框外侧左方'NorthEastOutside' 图例标识放在图框外侧右上方'NorthWestOutside' 图例标识放在图框外侧左上方'SouthEastOutside' 图例标识放在图框外侧右下方'SouthWestOutside' 图例标识放在图框外侧左下方(以上几个将图例标识放在框图外)'Best' 图标标识放在图框内不与图冲突的最佳位置'BestOutside' 图标标识放在图框外使用最小空间的最佳位置6. 更多的设置可以在绘图窗口中打开绘图工具,Inspector…中查找/monkeyking_fu/blog/item/5e9c65160654b956f2de325a.html例1:a=linspace(1,2,10);plot(a,'--pr','linewidth',1.5,'MarkerEdgeColor','r','MarkerFaceColor','m','MarkerSize',10);l egend('a','Location','best');title('a','FontName','Times New Roman','FontWeight','Bold','FontSize',16);xlabel('T','FontName','Times New Roman','FontSize',14);ylabel('a','FontName','Times New Roman','FontSize',14,'Rotation',0);axis auto equal;set(gca,'FontName','Times New Roman','FontSize',14);结果图为:例2:x = -pi:pi/10:pi;y = tan(sin(x)) - sin(tan(x));plot(x,y,'--rs','LineWidth',2,...'MarkerEdgeColor','k',...'MarkerFaceColor','g',...'MarkerSize',10)xlabel('x');ylabel('y');结果图为:例3:x = 0:.2:12;plot(x,bessel(1,x),x,bessel(2,x),x,bessel(3,x));legend('First','Second','Third');legend('First','Second','Third','Location','NorthEastOutside') 结果图为:例4:b = bar(rand(10,5),'stacked'); colormap(summer); hold onx = plot(1:10,5*rand(10,1),'marker','square','markersize',12,...'markeredgecolor','y','markerfacecolor',[.6 0 .6],...'linestyle','-','color','r','linewidth',2); hold offlegend([b,x],'Carrots','Peas','Peppers','Green Beans',...'Cucumbers','Eggplant')结果图为:——yuyiycl学习整理。