Probabilistic Slope Stability Analysis by Finite Elements 概率的有限元法边坡稳定性分析
基于边坡单元的公路沿线滑坡危险度概率分析
DOI:10.16285/j.rsm.2005.11.008第 26 卷第 11 期 2005 年 11 月文章编号:1000-7598-(2005) 11―1731―06岩 土 力 学 Rock and Soil MechanicsVol.26 No.11 Nov. 2005基于边坡单元的公路沿线滑坡危险度概率分析邱 骋,王纯祥,江崎哲郎,谢漠文(九州大学 环境系统研究中心,日本福冈 812-8581)摘要:公路沿线发生的滑坡、泥石流等自然灾害是造成交通停滞的主要原因。
对公路沿线边坡进行稳定性评价及滑坡灾害分析对于公路管理和灾害防治具有重要意义。
为了能对大范围边坡应用三维力学模型进行稳定性评价,研究中将较大研究区 域划分为多个边坡单元(slope unit) ,并介绍了边坡单元划分方法。
对每个边坡单元,采用随机生成许多假想滑动面并通过 一个基于 GIS 的边坡稳定性三维分析模型计算其安全系数的方法, 找出具有最小安全系数的危险滑动面, 同时求出在试算过 程中安全系数小于某临界值(通常设为 1.0)的结果出现的比率,作为该边坡单元的滑坡发生概率,以此作为指标对研究区 域进行危险度评价。
通过对日本 49 号国道沿线边坡中的应用对该方法的实用性进行了验证。
关 键 词:边坡单元;滑坡灾害;边坡稳定性三维分析;概率分析 文献标识码:A 中图分类号:TU 457Slope unit based probabilistic analysis of slope stability along highway routes in JapanQIU Cheng, WANG Chun-xiang, ESAKI Tetsuro, XIE Mo-wen(Institute of Environmental Systems, Kyushu University, Hakozaki 6-10-1, Higashi Ku, Fukuoka, 812-8581, Japan )Abstract: Landslides, that occurred on steep slopes along highway routes, always cause traffic stagnation, even endanger property and human life. For doing maintenance work effectively and avoiding disaster,it is essential to assess stability of road slopes. In this study, the large research area is firstly divided into slope units, which are used as the objectives of the three-dimensional deterministic model. Then a random searching method is used to locate the critical slip surface of each slope unit. The critical slip surface with the minimum safety factor is calculated by a GIS-based 3D slope stability model. The failure probability of each slope unit is calculated and landslide hazard degree of the studied area is zoned quantitatively. The methodology is illustrated by a probabilistic slope analysis of the 49th national road in Gouto area of Japan. Key words: slope unit; landslide hazard; 3D analysis of slope stability; probabilistic analysis1 引 言公路在当今社会的经济发展中起着极其重要的 作用,但公路沿线山坡发生的滑坡、泥石流等自然 灾害经常造成交通停滞,更严重的甚至危及生命财 产的安全,为此通常采取对危险区域进行防护施工 或进行监控的措施以避免灾害的发生。
slope stability analysis
slope stability analysisSlope stability analysis is the process of determining the safety factor of a slope or hillside. The safety factoris the ratio of the resisting force to the driving force that is acting on the slope. The resisting force is the shear strength of the soil, rock or other material, while the driving force is the weight of the soil or other material pushing down on the slope.There are a number of methods used to analyze slope stability. These include:1. Limit equilibrium analysis - This is the most commonly used method and involves dividing the slope into slices and calculating the forces acting on each slice. The safety factor is then calculated by comparing the sum of the resisting forces to the sum of the driving forces.2. Finite element analysis - This method uses computer software to simulate the behavior of the slope underdifferent conditions. The results can be used to assess the safety factor of the slope.3. Block analysis - This method involves dividing the slope into blocks and analyzing their stability as individual units. This method is often used for rock slopes and cliffs.Factors that need to be considered when conducting a slope stability analysis include the type of soil or rock, the slope angle, the presence of groundwater, and the presence of any vegetation or man-made features on the slope.The analysis can be used to provide guidance on how to stabilize the slope and avoid slope failures or landslides.。
采矿专业英语大全

filling multiple ratio pipe length-to-column in filling filling material rate of fill settlement pipelining of filling material permeability coefficient or fill filling material preparation mining method employing fill stowing machine fill tightenning filling shaft general layout for filling shaft area automation of filling material preparation function of fill mass filling system percussive drilling exhaust ventilation dust remover vibrating auto loader tripping to reserve ratio collaidal mud drilling train hoisting series flow network perpendicular slot fill stoping block open-stoping with vertical longhole shaft for speedening development excavation ventilation after large blasting boulder continental shelf placer mining extraction of water-contained ore body belt conveyor automation of belt conveyor conveyor hoistingengineering geolgy of side slope
平坝山大型石灰岩露天矿边坡稳定性分析
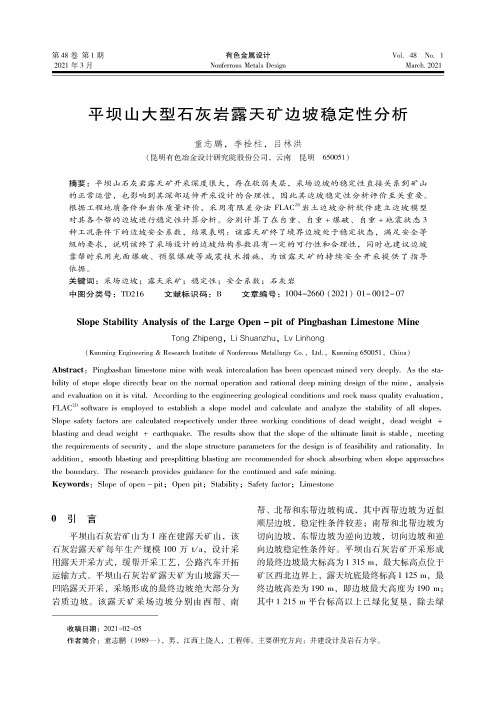
第4"卷第1期2021年3月有色金属设计Nonferrous Metals DesignVol.48No.1March.2021平坝山大型石灰岩露天矿边坡稳定性分析童志鹏,李栓柱,吕林洪(昆明有色冶金设计研究院股份公司,云南昆明650051)摘要:平坝山石灰岩露天矿开采深度很大,存在软弱夹层,采场边坡的稳定性直接关系到矿山的正常运营,也影响到其深部延伸开采设计的合理性,因此其边坡稳定性分析评价至关重―。
根据工程地质条件和岩体质量评价,采用有限差分法FLAC26岩土边坡分析软件建立边坡模型对其各个帮的边坡进行稳定性计算分析。
分别计算了在自重、自重+爆破、自重+地震状态3种工况条件下的边坡安全系数,结果表明:该露天矿终了境界边坡处于稳定状态,满足安全等级的—求,说明该终了采场设计的边坡结构参数具有一定的可行性和合理性,同时也建议边坡靠帮时采用光面爆破、预裂爆破等减震技术措施,为该露天矿的持续安全开采提供了指导依据。
关键词:采场边坡;露天采矿;稳定性;安全系数;石灰岩中图分类号:TD216文献标识码:B文章编号:1004-2660(2021)01-0012-07Slope Stability Analysis of the Large Open-pit of Pingbashan Limestone MineTong Zhipeng,Li Shuanzhu,Lv Linhong(Kunming Engineering&Research Institute oO Nonferrous Metallurgy Co.,Ltd.,Kunming650051,China) Abstrach:Pingbashan limestone mine with weak intercalation has been opencast mined verg deeply.As the stability of stope slope directly beao on the normal operation and rational deep mining design of the mine,analysis and evvluation on it is vital.According to the engineering geological conditions and rock mass quality evvluation, FLAC2D software is employed i establish a slope model and calculate and analyze the stability of all slopes. Slope safety factors arc calculated respectively u ndec three working conditions of dead weighi,dead weighi+ blasting and dead weighi+earthquake.The resulis show thai the slope of the ultimate Umil is stable,meeting the requirements of security,and the slope stnucture9801X1000for the design is of feasibility and rationality.In addition,smooth blasting and presplitting blasting are recommended for shock absorbing when s lope approaches the boundary.The research provides guiganca for the cantinued and safe mining.Keywords:Slope of open一pit;Open pit;Stability;Safety factoa;□1X101-0o引言平坝山石灰岩矿山为1座在建露天矿山,该石灰岩露天矿每年生产规模100万t/a,设计采用露天开采方式,缓帮开采工艺,公路汽车开拓运输方式。
probabilistic sensitivity analysis -回复

probabilistic sensitivity analysis -回复什么是概率敏感性分析(probabilistic sensitivity analysis)?概率敏感性分析是一种分析模型参数的不确定性对模型结果的影响的方法。
在经济评估、流行病学研究以及医疗决策制定中,模型参数往往伴随着一定的不确定性。
概率敏感性分析的目的是通过模拟模型的输入参数的分布来评估模型结果的不确定性,并研究参数不确定性对结果的影响。
概率敏感性分析是基于概率分布的一种方法。
我们通常会为模型参数选择一个概率分布,常见的分布包括正态分布、均匀分布等。
通过设定参数的分布,我们可以模拟参数不确定性,并生成一组满足这些分布的随机值。
对于每一组参数,我们都可以运行模型,并得到一个结果。
为了获得更加可靠的结果,我们可以重复这个过程多次,从而得到多组结果。
这些结果可以给我们提供大量的信息,例如结果的平均值、置信区间等。
通过分析不同参数值的分布,我们可以获得参数之间的相关性,以及确定哪些参数的不确定性对结果的影响最大。
概率敏感性分析的结果通常以散点图、直方图或箱线图的形式展示。
散点图可以直观地表示参数之间的相关性、线性和非线性关系等。
直方图可以显示模拟结果的分布情况,有助于我们了解结果的中心趋势以及不确定性范围。
箱线图可以展示不同参数值的分布情况,可以帮助我们识别不同参数对结果的贡献程度。
概率敏感性分析的一个重要应用是利用结果的分布进行决策分析。
通过模拟不同的策略或干预措施,我们可以比较它们在不同的不确定性条件下的效果。
例如,在估计一个新药物的经济效益时,我们可以利用概率敏感性分析来评估不同的药物价格、疗效、市场需求等参数对结果的影响。
这可以帮助决策者根据不同的风险偏好进行决策,从而制定更加合理和可靠的政策。
总结起来,概率敏感性分析是一种通过模拟模型参数的分布来评估模型结果的不确定性的方法。
它可以帮助我们了解参数不确定性对结果的影响,并为决策提供更可靠的依据。
外文翻译--垂直防波堤的概率统计方法

中文1300字Maritime Engineering 159December 2006 lssue MA4Pages 137-140Specifying seawall crest levels using a probabilistic method Probabilistic methods provise a powerful frame word for the design of coastal defenses. However, present knowledge of the behavior of these structures is insufficient to assess their safety against specific types of failure, such as excessive overtopping by wave action. However, the choice of overtopping model used to describe the failure is crucial to the outcome of the assessment. The paper illustrates the different results obtained from two models used to describe wave overtopping. The models are implemented in a software package known as PARASODE-BALI which employs the Level ⅡFirst Order Reliability Method(FORM)for the design and safety assessment of coastal structures. For the two overtopping models provide similar results. However, the differences are much greater for the small discharges commonly respired to ensure the safety, the two overtopping models provide similar results. However, the differences are much grater for the small discharges commonly repaired to ensure the safety of people and property in urban areas.1. INTRODUCTIONIn the design lf seawalls, it is important to strike the correct balancebetween satisfying the structural and functional requirement of the project, avoiding unnecessary expense, and having undesirable impacts on the surrounding environment. one important element in such considerations is the choice of the seawall crest level(CL)which is necessary to limit to permissible valves the mean wave overtopping discharge per unit length of seawall (Q).Basic variable which are relevant to the choice of CL are(Fig.1):the angle of the seawall front slope measured from horizontal(α),the still-water level(SWL) and the characteristics of the incident waves, such as the significant wave height(Hs) and the peak wave periled (Tp). Probability and consequences f failure, while coping to some degree, with such factors as the incident wave conditions.Besides listing many of the wide range of consequences and potential effects of wave overtopping in urban areas, this paper provides an example of the use of a probabilistic method in determining the crest level of a seawall subject to the action of a combination of wind-sea and swell (bimodal wave conditions).The purpose is to illustrate the importance in probabilistic design of the choice of model rest to describe failure. The degree of confidence in the determined crest level will vary depending upon the confidence that can be assigned to the overtopping model and to the statistical distributions adopted for the random variables which are employed in the model.2. SINGLE FAILURE MODE PROBABILITY ANALYSISIn probabilistic methods, theoretical expressions or empirical formulae describing single failure modes may be used to define a failure function ,Z=Z(X1,...,XN),where Xi ,i=1,...,N are the N basic variables of the problem (e.g. water level, wave conditions, structure dimensions and material properties).positive values of Z imply the absence of failure and zero or negative values represent failure in the mode being considered, the surface defined by Z=0 is Calles the failure surface. Variables whose increase leads to an increase in Zaire designated as resistance variableswhereas those in Z are designated as resistance variables whereas those whose increase leads to a decrease in Z are called load variables.Since some of the resistance or load variables are random (and may even be correlated), the value of the failure function is also a random variable, and the probability of failure (Pf),during a specified reference period, can be expressed as()⎰⎰⎰≤=≤=0110Z N X X f dX dX f Z P P N (1)In which fx1....xn is the joint probability density function of the basic variable X1... Xn.Expiration (10forms the mathematical basis of probabilistic analysis, with the exception of simple failure functions of just a few random variables, the multiple integrations cannot be performed analytically abed have to be approximated in some way. This is the aim of the various probabilistic methods; these methods are often classified according to the types of calculations performed and the approximations made. Three levels are commonly distinguished. They are listed here in order of decreasing accuracy and complexity.(a )Level Ⅲ :the full distribution approach. This method provides an ‘exact ’ probabilistic analysis, using full joint probability density functions including the correlations among the variable. Use is made of numerical integration or, more commonly, sampling techniques.(b ) Level Ⅱ:the limit state approach. Approximation methods are applied in which the generally non-normal and/or correlated variables are transformed into Normal independent variables. Reliability indices are used as measures of the reliability.(c )Level Ⅰ:the limit state approach. This level involves calculations uncharacteristic values and partial load and resistance factors. The factors represent, for example, the ratio of load at failure to a permissible working load.3. PARASODE-BALIPARASODE-BALI (Probabilistic Assessment of Risks Associated with Seawall Overtopping, Dune Erosion and Breakwater Aroour Layer Instability)is an extended version of PQRASODE, which uses the Level ⅡFirst Order Reliability Method ( FORM).As the name suggests, the program concentrates on three failure mechanisms, but the majority of the code is generic and can be applied with minor adjustments to other types of failure.PARASODE-BALI operates in two ways:(a)the ‘analysis mode’ in which the failure probability is calculated or a given value of the design parameter (e.g. the crest level of a seawall).(b)the ‘design mode’ in which the value of a specific design parameter is calculated for a target probability of failure.The program incorporates routines for transforming the correlated variables to a set of independent variables and for mapping non-Normal distributions to equivalent Normal distributions. The transformation of non-Normal variables into Normal variables is performed following the methodology of Racdwitz and Fiessler. The transformation of correlated variables into independent variables is performed following the methodology of Racdwitz and Fiessler. The transformation of correlated variables into independent variables is done according to the method presented by CIRIA. Note that PARASODE-BALI allows the user to specify a non-zero for the correlation coefficient ensures independence between the two variables.There are ten continuous, pre-defined, statistical distributions programmed in PARASODE-BALI: Normal, logarithmic Normal, umbel, uniform, Gamma, Beta, Freshet, exponential, Rayleigh and We bull. Each distribution may be truncated either on the left or on the fight side by using the method of Beaumont.4 the random variables can also be described by empirical distributions, defined by the user, which are theresult of measurements not easily fitted by a pre-defined distribution.Output from PARASODE-BALI relating to wave overtopping has been validated using the Level [] commercial software package@Risk.s,64. A PROBABILISTIC METHOD APPLIED TO W A VE OVERTOPPING OF SEAWALLS BY BIMODAL SEAS4. I. Wave overtopping modelsThe failure mode of wave overtopping is implemented in PARASODE-BALI using the models of Hedges and Reis, Vander Meer and Janssen and Owen. One of the main contributions to uncertainty in probabilistic seawall design with respect to overtopping is associated with the overtopping model adopted to describe failure. In order to illustrate the importance of the choice of model to the design, the Hedges and Reis and the Van der Meer and Janssen models are used in the case study described in Section 5. The corresponding failure functions are Hedges and Reis111)(3>⎥⎦⎤⎢⎣⎡<⎥⎦⎤⎢⎣⎡≤⎪⎪⎪⎭⎫ ⎝⎛=⎥⎦⎤⎢⎣⎡--=s c s c B C s c s rCH R for rCH R for Q Z rCH R CH g A Q Z b Vander Meer and Janssen⎪⎪⎭⎪⎪⎬⎫⎪⎪⎩⎪⎪⎨⎧>⎥⎦⎤⎢⎣⎡--=≤⎥⎥⎦⎤⎢⎢⎣⎡--=22.02e x p t a n 06.033p s c s p s p c s p for rH R B gH Q Z for H r R A a gH Q Z ξξξξ where Q is the mean permissible wave overtopping discharge per unit length of seawall; A and B are empirical coefficients ; p ξ is the surfsimilarity parameter or Irizarry number for random waves, 22tan p s p gT H παξ=; g is the gravitational acceleration; r is theseawall slope roughness;c R is the seawall freeboard, CL-SWL; r R c is the effective freeboard when the front slope is rough rather than smooth.原文摘自Maritime Engineering (《海洋工程》159期(2006年12月) 第137页至140页)译文:垂直防波堤的概率统计方法在防波堤工程的设计中,概率论方法无疑是一个强有力的方法。
软土地区数值分析中弹性模量的取值方法

E
0.4
tan
1
Es
10 3
C
(1)
(2)粘土
E 0.9 C 3 tan Es
(2)
式中:E—弹性模量; Es —土体压缩模量; —土体密
度;C—土体粘聚力; —土体内摩擦角。
in lope-Reliability Analysis[J].Journal of Geotechnical Engineering,1993,119(12):1910-1928. [2] 严春风,刘东燕,张建辉等.岩土工程可靠度关于强度参 数分布函数概型的敏感度分析[J].岩石力学与工程学报, 1999,18(1):36-39. [3] WenhuiTan,MeifengCai,RudiZhou.Modified fuzzy point estimate method and its application to slope reliability analysis[J].矿物冶金与材料学报,2003,10(6):5-10. [4] Lumb P.The Variability of Natural Soils[J].Canadian Geotechnical Journal,1966,3(2):74-97. [5] Vanmarcke E H.Probabilistic Modeling of Soil Profiles[J].Journal of the Geotechnical Engineering Division, 1977,103(11):1227-1246. [6] Li K S , Lumb P.Probabilistic design of slopes[J].Canadian Geotechnical Journal,1987,24(4):520-535. [7] Elramly H,Morgenstern N R,Cruden D M.Probabilistic slope stability analysis for practice[J].Canadian Geotechnical Journal,2002,39(3):665-683. [8] 吴振君,葛修润,王水林.考虑地质成因的土坡可靠度分 析[J].岩石力学与工程学报,2011,30(9):1904-1911. [9] Vanmarcke E.Random fields : Analysis and synthesis[M]. Cambridge:The MIT Press,1983. [10] 陈虬,戴志敏等.参局部平均随机场和 Neumann 随机有 限元法[J].计算力学学报,1991,8(4):397-402.
Probabilistic_Analysis

Benoît Valley & Damien Duff - CEMI - Center for Excellence in Mining Innovation
"Everything must be made as simple as possible. But not simpler."
Probability density
Design parameter
Fig. 1 Illustration of the uncertainty reduction during the development of a project until the potential for failure is minimised to an acceptable level (after Hoek, 1992)
— Albert Einstein
Introduction
In order to develop a reliable design approach, one must use statistical methods to deal with the variability of the input parameters. However tools usually used in geomechanics, like stress analyses (e.g. Finite Element Analyses, FEM), are in essence deterministic (a single set of input parameters leads to a single answer). Also, these tools are often computing time intensive and are not well-suited for the multiple runs needed for systematic sensitivity analyses or statistical simulations (e.g. Monte-Carlo). That's the reason why the Center for Excellence in Mining Innovation (CEMI) recently contracted RocScience Inc. to introduce an alternate method, the Rosenblueth point-estimate method (PEM, Rosenblueth, 1975), a simple, computing efficient probabilistic method, into their FEM software Phase2 version 8.0. This paper presents the approach and discusses its applicability.
- 1、下载文档前请自行甄别文档内容的完整性,平台不提供额外的编辑、内容补充、找答案等附加服务。
- 2、"仅部分预览"的文档,不可在线预览部分如存在完整性等问题,可反馈申请退款(可完整预览的文档不适用该条件!)。
- 3、如文档侵犯您的权益,请联系客服反馈,我们会尽快为您处理(人工客服工作时间:9:00-18:30)。
专业英语翻译基于有限元法边坡稳定性概率分析摘要:本文同时采用简单和更为先进的概率分析工具,研究了粘质边坡失效概率。
在试验中,详细研究了局部平均对边坡的失效概率的影响。
在简单方法中,将抗剪强度作为一个随机变量,采用经典边坡稳定性分析技术进行分析。
结合弹塑性有限元分析和随机场论的方法进行研究的先进技术,被称为随机有限元方法(RFEM)。
RFEM的结果表明,因为它能通过找出最不稳定结构面,使斜坡破坏过程更为自然的反映,它比传统的边坡稳定概率分析技术具有更多优势。
该项研究中尤其重要的是其结论,在简单概率分析中,完全相关的假设忽略了空间变异性,可能导致失效概率的偏不估计。
这与采用经典斜坡稳定性分析方法的研究者的论述相违背。
数据库主题词:边坡稳定;有限元; 概率方法;失效。
1 引言边坡稳定性分析是岩土工程的分支,适合采用概率分析,并且已在各种文献中得到重视。
最早的文献出现在20世纪70年代(例如Matsuo and Kuroda 1974; Alonso1976; Tang et al. 1976; Vanmarcke 1977),并不断稳步的向前发展(例如D’Andrea and Sangre y 1982; Chowdhury and Tang1987; Li and Lumb 1987; Mostyn and Li 1992; Christian et al. 1994; Lacasse 1994; Christian 1996; Lacasse and Nadim 1996;Wolff 1996; Duncan 2000; Hassan and Wolff 2000; Whitman 2000)。
最近,在El-Ramly 等学者的一文中(2002年),针对这一主题也提出了实用的观点,同时也指出,岩土工程专业开始逐渐采用概率方法进行岩土工程设计,尤其是针对诸如斜坡和基础工程这些传统的工程问题。
对于这个问题,相对现有的工作,主要出现了两种问题。
其一,研究尽管采用了新的较复杂的概率方法,但绝大多数的概率边坡稳定性分析一直采用经典的斜坡稳定性分析方法(例如,Bishop1955),而且几十年来几乎没有任何改变,而且从未使用高应变土体的抗剪强度分布方法。
传统的边坡稳定性的一个明显不足在于,确定破坏面形状(如圆形)的方法往往是固定的,因此破坏机制不能通过土体“找出”斜坡边界。
其二,尽管空间相关性的重要性(或自相关)以及岩土性质的局部平均数据,早已通过一些调查查明(例如,Mostyn and Soo 1992),但其中仍经常省略了许多概率边坡稳定性分析。
近年来,作者一直在努力追求更精确的概率岩土工程分析方法(如Fenton and Griffiths 1993; Paice 1997; Griffiths and Fenton2000),其中一种随机分析理论与有限元方法相结合的产物,在此被称为随机有限元法(RFEM),它很好的解决空间相关性问题,同时也是一种强大的边坡稳定性分析工具,而且不需要先假设斜坡的形状或破坏机理的位置。
为了证明这种方法的好处,并把该方法运用于本文研究,对此本文同时采用简单和更先进的方法,研究了一个带有凝聚力的斜坡稳定性概率分析的特点。
最初,采用简单的古典概率的概念和边坡稳定的技术对斜坡进行调查研究,然后对空间相关和局部平均的作用进行研究。
其后,采用成熟的RFEM方法得出结果。
贯穿该文的失效概率(),是相对于传统安全系数(FS)而言的,它是通过图表或经典的极限平衡方法获得的。
当前考虑的斜坡,如图1所示的斜坡试验问题中,饱和粘土的抗剪强度参数和。
研究中,斜坡坡角和尺寸,以β,H和D表示,饱和土体容重为常量,同时假定不排水抗剪强度为一个随机变量。
一般认为,不排水抗剪强度将以无量纲形式C表示,其中。
图1 凝聚力的斜坡试验问题2概率描述的剪切强度在这项研究中,剪切强度C有对数正态分布的统计特征, 定义μ和标准差σ,图2所示为一典型案例,图2 典型的对数正态分布,均值为100, 标准差Vc=0.5其中和函数包含整个单元区域, 因此,从标准表中很容易找到强度降低到指定现值的概率。
均值和标准差能方便地以无量纲变异系数来确定,定义为其他与对数函数相关的关系如下,以下为标准平均偏差和正态分布的基本定义化简后的公式(3)及(4)互为可逆关系:最后,下式给出中值和对数正态分布模式:在研究中,同时也考虑第三个参数,即空间相关长度。
由于实际不排水抗剪强度域成正态分布,其对数产生一个“潜在的”正常分布(或高斯)场。
空间相关长度是相对于潜在强度场衡量的,也就是说是相对于,空间相关长度指的是距离超过空间随机变量将趋于明显相关的高斯场),因此,较大值代表不同的光滑场,而小的值代表粗糙场。
但在实际过程中,和现实空间的相关长度没有太大的区别,大多数的情况下,考虑在同一地方其固有的不确定性,和是可以互换的。
近来研究表明,空间相关长度已被量化,它以空间相关长度除以边坡高度H表示,公式如下有人认为(例如, lee等1983年,Kulhawy等1991),典型的值的不排水抗剪强度的范围0.1-0.5。
但是, 其不能很好记录空间相关长度, 特别是在水平方向上很可能表现出各向异性。
虽然采用先进的分析工具已经具备在各向异性空间相关领域的建模能力,当考虑空间相关性时,仍将被假定其为各向同性。
3 初步确定性研究为了在本文中引入概率分析,假设在均质土体中进行初步确定性的研究。
对于一个简单的斜坡,如图1所示,在泰勒(1937)图或简单的极限平衡方法给出的数据(如表1)中可以很容易地得到安全系数。
表1 假设均质土体的安全因素这些结果,绘制如3所示,说明C和FS的线性关系。
图3还显示,测试斜坡变得不稳定时,剪切强度参数低于C=0.17。
图3 抗剪强度C和安全系数FS的线性关系C为一个有凝聚力的斜坡抗剪强度,斜坡坡角β= 26.57,深度比D = 24 单一随机变量方法这里给出的的第一个概率分析,基于标准差和平均值上,考察给定剪切强度C 的对数正态分布的概率密度函数的影响,类似于图2所示。
从正态分布中随机挑选C的值,假定斜坡的各处C相同。
预测随机场分析将在本文后面介绍,这种“单一随机变量的方法”意味着空间相关长度,不能适用于局部平均情况下的失效概率,它简易等于抗剪强度参数C低于0.17时的概率。
从数量上看,它等于对应C≤0.17的区域的概率密度函数值。
例如,当=0.25和=0.125(Vc=0.5)时,公式(3)及(4)给出的以下正态分布的均值和标准差参数,分别是及。
因此,失效概率可以表示如下:其中Φ是标准正态分布的累积分布函数对于所考虑的斜坡,为了得到和Vc的取值范围,已经重复使用该法,并形成图4所示的线性关系,图4给出了安全系数和失效概率的直接关系。
图4 单一随机变量法中失效概率与安全系数(基于平均值),平均值=0.25 应该注意的是,只有当斜坡中均质土体的抗剪强度等于图3中的平均值,基于此值时,才能得到图4中的安全系数。
从图4可知,当安全系数降低时,失效概率(pf )明显增加,但同时也表明,当时,失效概率随着Vc增加而增加,当,这种变化的趋势会不同。
图4显示,这些情况中,较高的失效概率是可以理解的。
但是,Vc的特点却相反,Vc值越低会导致失效概率越高。
可以这样解释,处于峰值时的抗剪强度分布在低的Vc值区域,迅速覆盖了临界值C=0.17右边的区域。
图5 pf相对Vc值的不同中值图5显示,中值()对理解该项分析中失效概率是如何变化显得十分关键,当时,增加Vc值会导致pf降低,因此时,增加Vc值会导致pf增加。
虽然本节中介绍的单一随机变量的方法,可以进行简单的定量计算和定性的对失效概率和安全系数进行比较,但是该方法的定量计算特点令人质疑。
图4中显示了一个重要的发现,平均强度=0.25(FS=1.47)的土体失效概率和Vc=0.5土体的失效概率都是pf=0.28。
实践经验表明,安全系数FS=1.47时的土体很少破坏。
这一结果表明,无论是完全相关的单一随机变量方法,是如何预报最坏的失效概率,它都不能采用土体变量中的平均强度估计其安全系数。
现场测试中,对于出现很多的抗剪强度值,岩土工程师们喜欢选择一个“悲观”或“最低可行”的值进行设计,会低于平均强度。
暂时假设单一随机变量的方法是合理的。
图6(a)中,平均强度中的线性强度折减系数f 1, 其中,图6(b)中,平均强度线性强度折减系数f 2 (标准偏差引起),其中,图6 (a)线性因素原因(b)标准偏差原因所有曲线假定安全系数=1.47 (基于=0.25)图6所示的所有结果假定是在积分后产生的,=0.25意味着安全系数FS=1.47,对不积分时的失效概率pf=0.28,f 1=f 2=0 其也在Vc=0.5情况中突出的反映了。
这两种情况下,设想了增加强度折减系数方法以减少破坏的概率,但是两套折减曲线的性质是不同的,尤其是对于更高的Vc值时。
从线性平均强度折减(公式11),f 1=0.6 会导致失效概率近似0.6%。
与之相比,一个标准偏差的平均强度折减(f 2=1 ,公式12)会导致失效概率约为2%。
图6(a)显示的是,对所有的f 1 和Vc值,逐渐变化的失效概率。
但在图6(b)中,标准偏差引起的是失效概率的迅速减少,尤其是对于Vc>2的比较高的数值。
这种特别的结果可以简单的用Vc和pf 之间的函数关系解释,设计抗剪强度可以写为:因此,当,当平均强度无限大于临界值0.17 时,失效概率迅速趋于0.5 空间相关上述在单一随机变量法中论述的空间相关长度是无限的,换言之,仅仅只考虑到均质斜坡,在均质斜坡中,斜坡的性质是从对数正态分布中随机获取的。
更现实的模型将适当考虑到更小的空间相关性,其中斜坡土的强度允许有不同空间的相关性。
由空间相关长度该参数来控制,之前我们已经讨论。
在这项工作中,下列形式用于表示指数衰减(Monrovian)的相关函数:其中,ρ为相关系数,τ表示为随机场中,两点之间的绝对距离。
图7 Monrovian相关函数图7 表述了该函数的意义,例如,它以分开两点的强度,将会产生一个预期。
相关函数仅仅是代表实地观察,近距离的采样与远距离的土样可能更具相同的性质。
同时,它认为各向异性空间相关的观点,考虑沉积历史原因,土壤很可能在水平方向比垂直方向上拥有更长的空间相关长度。
虽然本文描述的方法考虑各向异性,但是这种改进方法将在以后研究。
6 随机有限元法解决空间随机抗剪强度参数和空间相关性的一种强大的方法称为随机有限元方法,它结合弹塑性有限元分析和随机场理论,产生了局部平均细分的方法(例如., Griffiths and Fenton 2001),因此,在此给出一个简短的介绍。