黄土高原土壤侵蚀及其与降雨_植被变化的响应_英文_孙文义
黄土高原土壤侵蚀规律研究方向与途径
黄土高原土壤侵蚀规律研究方向与途径姚文艺;肖培青【摘要】Based on the requirements of soil and water ecological construction in the Loess Plateau and the practices of the Yellow River harnessing, research progress on the study of soil erosion in the Loess Plateau in China is reviewed, and some current issues are also listed. Then some suggestion on research direction and content, method and way of soil erosion in the Loess Plateau is addressed. The further research direction of soil erosion in the Loess Plateau is pointed out, including gravitational erosion law, coupling relationship between erosion and sediment of the hillslope-gullyslope system under different soil and water conservation measures, hydrology effects and runoff mechanisms under different vegetation cover, scale conversion in the process of soil erosion, simulation theory and technology about the soil loss in the Loess Plateau, etc. Approaches to the study of soil erosion are put forward, such as construction of observation system for soil erosion tests, application of inversion technology in soil erosion model.%从黄土高原水土保持生态建设和黄河治理开发重大实践的需求出发,回顾了我国关于黄土高原土壤侵蚀规律研究的主要进展,分析了存在的问题,论述了深化黄土高原土壤侵蚀规律研究的重大需求,就黄土高原土壤侵蚀规律的研究方法与途径、研究方向与内容提出建议,认为应加强以下几方面的研究:重力侵蚀规律、不同治理措施配置下坡面-沟道系统侵蚀产沙耦合关系及泥沙输移规律、植被措施作用下的水文效应和产流机制、土壤侵蚀产沙发生发展过程尺度转换、黄土高原水土流失模拟理论与技术等;研究途径包括建设黄土高原土壤侵蚀试验观测体系、运用土壤侵蚀模型模拟与反演技术等.【期刊名称】《水利水电科技进展》【年(卷),期】2012(032)002【总页数】6页(P73-78)【关键词】土壤侵蚀;水土保持;黄土高原;研究进展【作者】姚文艺;肖培青【作者单位】黄河水利科学研究院,河南郑州450003;黄河水利科学研究院,河南郑州450003【正文语种】中文【中图分类】S157我国黄土高原是世界上水土流失最严重、土壤侵蚀规律最复杂的地区之一。
黄土高原地区水土流失问题
1引言黄河是中华民族的母亲河,位于黄河中上游地区的黄土高原是中华民族的发祥地。
西北黄土区地处我国干旱半干旱区域,以农牧业发展为主,同时也是我国重要的能源与化工基地。
该地区水土流失问题十分严峻,制约着黄土高原地区、黄河流域乃至整个国家的环境生态安全和经济社会的可持续发展。
2自然环境与社会经济特征2.1自然环境条件2.1.1黄土黄土是指以原生堆积未经次生扰动的、无层理的、用于黄色粉沙质、富含碳酸盐并有大孔隙和垂直劈理的土状沉积物,以及经过次生搬运、具有层理和沙砾石层的黄色粉土状沉积物被称之为黄土状土层。
黄土在世界上分布广泛,从全球看,黄土分布区主要位于中纬度干燥和半干燥的大陆性气候环境范围内,即现代的温带森林、森林草原、草原及部分半荒漠地区[1]。
在欧亚大陆上,从大西洋东岸到太平洋西岸成断续带状地分布。
而我国境内的黄土,除长江流域的零星分布外,大都分在昆仑山、秦岭和大别山以北。
根据黄土沉积的特点可分为西北内陆盆地区、中部黄河中游黄土高原区、东部山前丘陵及平原区3大分布区。
2.1.2地形地貌黄土高原横跨我国3大高程阶梯的2个阶梯,从西向东逐级下降。
从日月山到刘家峡,为第一高程阶梯的东缘,属青藏高原的一部分,一般海拔为2300~3000m ,其间有积石山、大阪山、冷龙岭等高山。
黄河干流湟水、大通河形成的谷地与山黄土高原地区水土流失问题Problems of Soil and Water Loss in the Loess Plateau Region李洪清(天津市华淼给排水研究设计院有限公司,天津300190)LI Hong-qing(Tianjin Hua Miao Research &Design Institute of Water and Waste Water Co.Ltd.,Tianjin 300190,China)【摘要】对我国黄土高原地区的水土流失问题进行讨论。
以此地区的自然环境与社会经济特征为基础,分析水土流失的成因,总结其现状及产生的危害,并对黄土高原地区水土流失问题的演变进行预测。
黄土高原草地和农田系统碳动态对降雨、温度和CO2浓度变化响应的模拟
黄土高原草地和农田系统碳动态对降雨 温度和 9"- 浓度变化响应的模拟
郭丁&郭文斐&赵建$特木其勒图I李旭东&傅华&! 骆亦其*
&!草地农业生态系统国家重点实验室农业部草牧业创新重点实验室兰州大学草地农业科技学院甘肃 兰州 (I%%$% $!内蒙古阿拉善盟额济纳旗草原工作站内蒙古 巴彦浩特 (J%I%KI!内蒙古阿拉善盟草原监督管理所内蒙古 巴彦浩特 (J%I%K*!美国北亚利桑那大学工程林业和自然科学学院亚利桑那 弗拉格斯塔夫 'K%&&
业 生 态 系 统 国 家 重 点 实 验 室 开 放 基 金 H\E+GM$%&*%&资 助 作 者 简 介 郭 丁 &R'KT男 江 苏 宿 迁 人 讲 师 博 士 MTA3?8B,-6!8],!76,!:@
E,=1>@)1+8-C38:8?A3;7:23@B7,<,388D?@Z-8Z7<<?A,8;3@7-,<3@6:-@;?@,-,<:23@B7<,@67>6?997>7@;7@Z?>-@T
收 稿 日 期 $%&(T%(T&%改 回 日 期 $%&(T&&T%$ 基 金 项 目 国 家 重 点 研 发 计 划 $%&KY0"%J%%J%J国 家 自 然 科 学 基 金 I&J%$%&%新 疆 维 吾 尔 自 治 区 重 大 科 技 专 项 项 目 $%&KG%I%%K和 草 地 农
第 $( 卷 " 第 $ 期 [-8!$(N-!$
草"业"学"报 G"LG FOGLG"SELSOGMHWNW"G
毕业论文外文翻译——华中农业大学资源与环境学院_农资
本科毕业论文(设计)外文翻译题 目 中国黄土高原植被恢复区降雨量对不同植被覆盖土壤水分的影响姓 名学 号 2011303200615 专 业农业资源与环境 指导教师林丽蓉 职 称 讲师中国·武汉2015 年 04 月中国黄土高原植被恢复区降雨量对不同植被覆盖土壤水分的影响原文来源:Shuai Wang,Bojie Fu,Guangyao Gao,Yu Liu,Ji Zhou. Responses of soil moisture in different land cover types to rainfall events in a re-vegetation catchment area of the Loess Plateau, China. CATENA, V olume 101, 2013, 122 – 128摘要:在过去几十年里,退耕还林政策的实施导致了中国黄土高原植被覆盖面积显著增加,植物群落影响土壤水分的供给和利用,特别是水分进入土壤的过程。
这与在半干旱黄土高原降水转化为土壤有效水分有直接的关系。
一次对典型土地覆盖土壤动态水分与降雨的相关性测量研究在一个植被恢复集中区进行:智能探头分别插在6个不同深度的地表下面,地表植被分别为:草(须芒草)、半灌木(蒿)、灌木(绣线菊)、树(刺槐)、和作物(玉米)。
然后再以10分钟为间隔周期60天记录土壤体积含水量,时间为2011年的生长季节。
土壤湿润锋和累计渗透水提前已经进行测量。
降雨具有较大的不同强度的偶发性,土壤水分主要是通过3-4次七八月期间的强降水补充。
5个植被类型的平均土壤含水量剖面可以排序为:作物>草>半灌木>乔木>灌木,这种关系显示出水分含量在时间上的稳定性。
不同的土地覆盖类型显然影响了水的渗透,和进入植被覆盖区的水分总量。
在研究期间半灌木区域土壤在降水量(227毫米)表现出最高的总渗透量(164毫米)。
黄土高原植被对气候变化的时滞响应及其时变特征

158
西 安 科 技 大 学 学 报 2020年第 40卷
tionCoefficient(PCC)isusedtoanalyzetherelationshipbetweenvegetationandclimateofdifferent soiltypesregioninLParea.Resultsshowthatthelandusehadchanged,andvegetationwasdecreased duetothehumanactivitiesintheRiverImpactPlain.ThevegetationinotherregionsoftheLPshowed asignificantupwardtrend.TheresultsofMKtrendanalysisshowsthatthetemperatureshowedasig nificantupwardtrendfrom1981to2016inLParea,butthetemperaturefrom2000to2016showedno significantupwardtrend.TherisingrateoftemperatureintheLPareahasbeensloweddownandrain fallincreased(especiallyinMarchandMay)afterthepolicyof“GrainforGreenProject”implemented in2000.ThetimelagofNDVIresponsetotheclimateintheLPregionexists,whichhadsignificant differencesindiverseareas.ThenonlagandtheonemonthlagareaofNDVItotemperatureresponse accountedfor37.5% and62.5% oftheLParea,respectively.ThelagresponseofNDVItoprecipitati onwasusually1~3months,accountingfor62.5%,25%,and12.5% oftheLParea,respectively. Theabovefindingshelpunderstandfurtherthetimescaleofvegetationresponsetodifferentsoiltypes inLP,whichisofvitalsignificanceforthedevelopmentofregionalecologicalpoliciesinthefuture. Keywords:LoessPlateau;MannKendall;timelags;timevaryingcharacteristics;NDVI
黄土高原植被净初级生产力时空变化及其影响因素_谢宝妮

基金项目: 863 计划 (2013AA102401-2) ; 博士点基金 (20120204110013) ; 国家自然科学基金(30872073) 作者简介:谢宝妮(1986-) ,女,陕西蓝田人,博士生,主要从事地 理信息系统与遥感应用研究。杨凌 西北农林科技大学资源环境学院, 712100。Email:chenshu0305@ ※通信作者:常庆瑞(1959-) ,男,陕西子洲人,教授,博士生导师, 主要从事资源环境与 3S 技术应用研究。杨凌 西北农林科技大学资源 环境学院,712100。Email:changqr@
(西北农林科技大学资源环境学院,杨凌 712100) 摘 要:为了探明黄土高原地区植被生产力变化的驱动机制,该文基于 MODIS 传感器获得的 MOD17A3 数据, 分析了黄土高原 2000-2010 年间植被净初级生产力 (net primary productivity, NPP) 的时空变化及其主要影响因素, 并借助多元统计分析方法对引起 NPP 变化的自然和人为因素进行量化分析。结果表明:黄土高原植被总 NPP 从 (以 C 计) 。黄 2000 年的 119 Tg(以 C 计)增加到 2010 年的 144 Tg(以 C 计) ,年增速 4.57 g/(m2·a)(P<0.05) 土高原约 91%的区域 NPP 呈增加趋势,37%的区域增加趋势显著,主要分布在陕西、青海大部分地区、甘肃南部 及宁南山区。整个黄土高原近 11 a 间 NPP 变化受自然和人为因素共同影响,其中退耕还林还草累计面积、帕尔默 干旱指数(palmer drought severity index, PDSI) 、耕地面积和人口数量是影响 NPP 变化的主要因素。退耕还林还草 累计面积占四者总贡献率的 43%,PDSI 占 40%,耕地面积和人口数量分别占 13%和 4%。对区域而言,由退耕还 林还草工程引起的土地利用覆被变化是退耕区(陕北、甘肃东南部等)NPP 增加的主要因素,而近年来干旱情况 的缓解(PDSI 呈上升趋势)则是青海、内蒙古等地 NPP 增加的主要因素。该研究对于黄土高原各区域生态资源 管理,以及生态系统的建设具有一定的指导和借鉴意义。 关键词:植被;生态系统;土地利用;净初级生产力;MODIS;黄土高原;时空变化;影响因素 doi:10.3969/j.issn.1002-6819.2014.11.030 中图分类号:TP79 文献标志码:A 文章编号:1002-6819(2014)-11-0244-10 谢宝妮, 秦占飞, 王 洋, 等.黄土高原植被净初级生产力时空变化及其影响因素[J]. 农业工程学报, 2014, 30(11): 244-253. Xie Baoni, Qin Zhanfei, Wang Yang, et al. Spatial and temporal variation in terrestrial net primary productivity on Chinese Loess Plateau and its influential factors[J]. Transactions of the Chinese Society of Agricultural Engineering (Transactions of the CSAE), 2014, 30(11): 244-253. (in Chinese with English abstract)
黄土高原地区土地植被承载力与植被生态恢复建设
西北林学院学报2008,23(1):39~43Journal of N o rthw est Fo restry U niversity黄土高原地区土地植被承载力与植被生态恢复建设①曹军胜1,2, 朱清科13, 薛智德3(1.水土保持与荒漠化教育部重点实验室,北京林业大学水土保持学院,北京100083;2.延安大学生命科学院,陕西延安716000;3.西北农林科技大学资源与环境学院,陕西杨陵712100)摘 要:土地植被承载力是黄土高原地区土壤水分与植物生长关系调控、合理利用水土资源和生态植被建设的核心问题之一。
分析了土地植被承载力对植被结构的影响,认为在大气降雨量为唯一土壤水分输入量的黄土高原,土地植被承载力决定了植物群落密度,直接影响植被结构。
从植被地带和群落适应性原理、缓解土壤干旱、控制植被生产力三个方面探讨了生态恢复与土地植被承载力的相互关系,并提出了黄土高原生态恢复建设必须优先考虑土地植被承载力,根据土地植被承载力进行植被生态恢复建设是黄土高原生态环境得以改善和持续发展的必由之路。
关键词:土地植被承载力;植被结构;植被生态恢复;黄土高原中图分类号:S718.5 文献标识码:A 文章编号:100127461(2008)0120039205V egetati on Carrying Cap acity of L and and V egetati on R esto rati on andCon structi on in the L oess P lateau R egi onCAO Jun-sheng1,2, ZHU Qi ng-ke1, XUE Zh i-de3(1.K ey L abora tory of S oil and W a ter Conserva tion and D esertif ica tion Co m ba ting,M in istry of E d uca tion;Colleg e ofS oil and W a ter Conserva tion,B eij ing F orestry U n iversity,B eij ing100083,Ch ina;2.Colleg e of L if e S cience,Y anθan U n iversity, 716000,S haanx i Y anθan,Ch ina;3.Colleg e of R esou rce and E nv ironm en t,N orthw est A&F U n iversity,Y ang ling,S haanx i712100,Ch ina)Abstract:V egetati on carrying cap acity of land(V CCL)is a key index fo r rati onal u tilizati on of so il w ater and vegetati on resou rce in the L oess P lateau regi on.B ased on the analysis on the relati on sh i p betw een the V CCL and the vegetati on structu re,it w as though t that the den sity of the vegetati on comm un ity w as de2 cided by V CCL,and the vegetati on structu re in th is regi on w as m o stly affected by V CCL.T he relati on sh i p including the betw een V CCL and vegetati on resto rati on and conctructi on w as analyzed from th ree asp ects p rinci p le of vegetati on zone and comm un ity;the li m it of so il arid layer and the p roducti on con tro l of a veg2 etati on comm un ity.It w as pu t fo r w ard that V CCL shou ld be firstly con sidered in vegetati on resto rati on and con structi on in the L oess P lateau.V CCL based on vegetati on resto rati on and con structi on is the on ly w ay to m ain tain eco logical environm en t and su stainab le developm en t in L oess P lateau regi on.Key words:vegetati on carrying capacity of land;vegetati on structu re;vegetati on con structi on;L oess P lateau 针对黄土高原地区植被稀疏、水土流失严重的生态环境状况,我国从上世纪50年代开始在黄土高原开展了大面积的植树种草工作,并取得了重大进展。
黄土丘陵区自然恢复草地土壤呼吸对降雨格局改变的响应
第30卷第5期2023年10月水土保持研究R e s e a r c ho f S o i l a n d W a t e rC o n s e r v a t i o nV o l .30,N o .5O c t .,2023收稿日期:2022-07-15 修回日期:2022-08-28资助项目:国家自然科学基金面上项目 黄土丘陵区土壤斥水性及其对降水入渗机制的影响研究 (41977426) 第一作者:徐婷(1997 ),女,重庆市璧山人,硕士研究生,主要从事黄土丘陵区土壤水分入渗的研究㊂E -m a i l :T i a n a _x u t i n g @163.c o m 通信作者:焦峰(1967 ),男,陕西省三原县人,博士,研究员,主要从事水土保持环境效应评价方面的研究工作㊂E -m a i l :J i a o f @m s .i s w c .a c .c nh t t p :ʊs t b c y j .p a p e r o n c e .o r gD O I :10.13869/j.c n k i .r s w c .2023.05.004.徐婷,马露露,李泽森,等.黄土丘陵区自然恢复草地土壤呼吸对降雨格局改变的响应[J ].水土保持研究,2023,30(5):92-98.X U T i n g ,MAL u l u ,L I Z e s e n ,e t a l .R e s p o n s e o f S o i lR e s p i r a t i o n t oC h a n g e s o fR a i n f a l l P a t t e r n i nN a t u r a l l y R e s t o r e dG r a s s l a n d i nL o e s sH i l l y R e gi o n [J ].R e s e a r c ho f S o i l a n d W a t e rC o n s e r v a t i o n ,2023,30(5):92-98.黄土丘陵区自然恢复草地土壤呼吸对降雨格局改变的响应徐婷1,马露露1,李泽森1,曹家仪2,延楠楠2,焦峰1(1.西北农林科技大学水土保持研究所,陕西杨凌712100;2.西北农林科技大学资源环境学院,陕西杨凌712100)摘 要:[目的]揭示黄土丘陵区自然恢复草地土壤呼吸对长期改变降雨的响应情况,并阐明不同降雨处理土壤呼吸与土壤温度㊁土壤含水量的关系㊂[方法]以黄土丘陵区自然恢复草地群落为对象,进行长期野外人工控制降雨试验,设置增雨20%,40%,60%以及减雨20%,40%,60%和对照处理,测定土壤呼吸㊁土壤温度㊁土壤含水量㊂[结果]不同降雨处理土壤呼吸在生长季呈单峰曲线,7月达最大值,10月达最小值;在整个生长季内,增雨20%㊁增雨60%对土壤呼吸无显著促进作用,增雨40%及减雨20%,40%,60%显著降低土壤呼吸(p <0.05),表现为土壤呼吸随降雨量的增加而降低㊂生长季内,降雨显著影响土壤含水量(p <0.05),土壤含水量随雨量减少而减少;与对照相比除减雨60%处理外,其余降雨处理显著降低了土壤温度(p <0.05)㊂无水分胁迫条件下,不同降雨处理土壤温度与土壤呼吸均呈极显著指数相关(p <0.01);各降雨处理土壤含水量与土壤呼吸均呈显著二次函数相关(p <0.05);土壤温度㊁土壤含水量双因素与土壤呼吸呈极显著的线性㊁幂 指数相关,且双因素幂 指数模型最优㊂[结论]总体上,降雨对黄土丘陵区自然恢复草地群落土壤呼吸的影响受土壤温度与土壤含水量联合调控,其主导程度取决于是否发生水分胁迫㊂关键词:黄土丘陵区;自然恢复草地;土壤呼吸;降雨改变中图分类号:X 171 文献标识码:A 文章编号:1005-3409(2023)05-0092-07R e s p o n s e o f S o i lR e s p i r a t i o n t oC h a n ge s o fR a i nf a l l P a t t e r n i n N a t u r a l l y R e s t o r e dG r a s s l a n d i nL o e s sH i l l y R e gi o n X U T i n g 1,MA L u l u 1,L I Z e s e n 1,C A OJ i a y i 2,Y A N N a n n a n 2,J I A OF e n g1(1.I n s t i t u t e o f S o i l a n d W a t e rC o n s e r v a t i o n ,N o r t h w e s tA&F U n i v e r s i t y ,Y a n g l i n g ,S h a a n x i 712100,C h i n a ;2.C o l l e g e o f N a t u r a lR e s o u r c e s a n dE n v i r o n m e n t ,N o r t h w e s tA&F U n i v e r s i t y ,Y a n g l i n g ,S h a a n x i 712100,C h i n a )A b s t r a c t :[O b j e c t i v e ]T h er e s p o n s eo f s o i l r e s p i r a t i o nt ol o n g -t e r m c h a n g eo f r a i n f a l l i nn a t u r a l l y re s t o r e d g r a s s l a n d i n t h e l o e s s h i l l y r e g i o nw a s r e v e a l e d ,a n d t h e r e l a t i o n s h i p b e t w e e n s o i l r e s p i r a t i o n a n d s o i l t e m pe r -a t u r e a n d s o i l w a t e r c o n t e n t u n d e r d if f e r e n t r a i n f a l l t r e a t m e n t sw a s e x po u n d e d .[M e t h o d s ]T h e n a t u r a l r e s t o -r a t i o no f g r a s s l a n dc o mm u n i t i e s i nt h e l o e s sh i l l y a r e aw a s t a k e na s t h eo b j e c t .L o n g -t e r mf i e l da r t i f i c i a l l y c o n t r o l l e d r a i n f a l l e x p e r i m e n t o n s e t t i n g 20%,40%,60%r a i n i n c r e a s e a n d 20%,40%,60%r a i n r e d u c t i o n a n d c o n t r o l t r e a t m e n t sw a s c o n d u c t e d .S o i l r e s p i r a t i o n ,s o i l t e m p e r a t u r e ,a n d s o i lw a t e r c o n t e n tw e r em e a s -u r e d .[R e s u l t s ](1)S o i l r e s p i r a t i o nu n d e r d i f f e r e n t r a i n f a l l t r e a t m e n t s s h o w e d a u n i m o d a l c u r v e i n t h e g r o w -i n g s e a s o n ,r e a c h i n g am a x i m u mv a l u e i nJ u l y a n dam i n i m u mv a l u e i nO c t o b e r .I n t h ew h o l e g r o w i n g s e a -s o n ,t h e i n c r e a s e o f r a i n f a l l b y 20%a n d t h e i n c r e a s e o f r a i n f a l l b y 60%h a d n o s i g n i f i c a n t e f f e c t o n s o i l r e s pi -r a t i o n .40%i n c r e a s e i n r a i n f a l l a n d 20%,40%a n d 60%d e c r e a s e i n r a i n f a l l s i g n i f i c a n t l y i n h i b i t e d s o i l r e s p i -r a t i o n (p <0.05),w h i c h s h o w e d t h a t s o i l r e s p i r a t i o n d e c r e a s e dw i t h t h e i n c r e a s e o f r a i n f a l l .(2)I n t h e g r o w -Copyright ©博看网. All Rights Reserved.i n g s e a s o n,r a i n f a l l s i g n i f i c a n t l y a f f e c t e d s o i lw a t e r c o n t e n t(p<0.05),w h i c hd e c r e a s e dw i t h t h e d e c r e a s e o f r a i n f a l l.E x c e p t f o r60%d e c r e a s e i nr a i n f a l l t r e a t m e n t,t h eo t h e r r a i n f a l l t r e a t m e n t s s i g n i f i c a n t l y d e c r e a s e d s o i l t e m p e r a t u r e(p<0.05).(3)U n d e r t h e c o n d i t i o n o f n ow a t e r s t r e s s,s o i l t e m p e r a t u r e a n d s o i l r e s p i r a t i o n i nd i f f e r e n t r a i n f a l l t r e a t m e n t ss h o w e de x t r e m e l y s i g n i f i c a n te x p o n e n t i a l c o r r e l a t i o n(p<0.01).S o i lw a t e rc o n t e n t a nd s o i l re s p i r a t i o n i ne a c h r a i nf a l l t r e a t m e n t s h o w e ds ig n i f i c a n t q u a d r a t i c f u n c t i o nc o r r e l a t i o n(p<0.05).T h e t w o f a c t o r s o f s o i l t e m p e r a t u r e a n ds o i lw a t e r c o n t e n t h a d t h ev e r y s i g n i f i c a n t l i n e a r a n d p o w e r-e x p o n e n t i a l c o r r e l a t i o nw i t hs o i l r e s p i r a t i o n,r e p c e c t i v e l y,a n d t h e t w o-f a c t o r p o w e r-e x p o n e n t i a lm o d e lw a s o p t i m a l.[C o n c l u s i o n]I ng e n e r a l,th e e f f e c t o f r ai n f a l l o n t h e s o i l r e s p i r a t i o no f t h e n a t u r a l l y r e s t o r e d g r a s s-l a n d c o mm u n i t y i n t h e l o e s s h i l l y a r e a i sj o i n t l y r e g u l a t e db y s o i l t e m p e r a t u r e a n d s o i lw a t e r c o n t e n t,a n d i t s d o m i n a n t d e g r e ed e p e n d s o nw h e t h e rw a t e r s t r e s s o c c u r s.K e y w o r d s:l o e s s h i l l y a r e a;n a t u r a l r e s t o r a t i o no f g r a s s l a n d;s o i l r e s p i r a t i o n;r a i n f a l l c h a n g e由于人类活动致使大气环境中二氧化碳等温室气体含量急速增长,导致世界气候变暖和水循环明显加剧㊂由于全球气温升高,极端天气在未来将愈发频繁,降雨格局已然发生改变[1]㊂土壤呼吸是陆地生态系统释放二氧化碳最主要的来源之一,具有调控陆地生态系统土壤碳库和碳循环等方面的重要作用,草地是世界上分布最广的陆地生态系统之一,其土壤有机碳储量占世界土壤有机碳储量的15.5%[2]㊂我国草地多集中在西北部地区,其碳储量占我国陆地生态系统的16.7%,占全球草地生态系统碳储量的8.0%[3-4]㊂黄土高原属于干旱半干旱地区,水分便成为限制当地植物生长㊁土壤呼吸的重要环境因子[5]㊂因此,研究黄土高原地区草地土壤呼吸对降雨变化的响应对于进一步预测土壤碳变化具有重要意义㊂已有研究表明不同降雨格局会改变土壤含水量,形成不同的植物群落和结构[6],同时不断变化的降雨格局将显著影响陆地生态系统碳循环[7]㊂李寅龙等[8]研究发现,增雨30%使短花针茅草原的土壤呼吸速率显著增加;陶冬雪等[9]研究发现,减雨50%使呼伦贝尔草甸草原的土壤呼吸速率显著降低,而增雨50%对土壤呼吸速率无显著影响;王兴等[10]研究发现,增雨50%使黄土丘陵区草地的土壤呼吸速率显著增加㊂随着国内外开展控制降雨试验的增加,虽然对降雨影响土壤呼吸变化的机制有一定的了解,但由于降雨的时间㊁空间异质性也使得土壤呼吸对未来降雨格局变化响应的预测具有非常大的不确定性,为比较精确地估算在降雨变化背景下碳循环的响应,很有必要开展降雨变化对草地生态系统碳循环过程中土壤呼吸的响应研究㊂因此,本研究在野外进行长期控制降雨试验,模拟完全改变降雨格局,揭示自然恢复草地群落土壤呼吸对降雨格局改变的响应及其与土壤温度㊁土壤含水量的关系,以期为半干旱区草地群落生态系统碳循环应对未来降雨格局的改变和进一步开展生态环境保护与退化草地治理提供依据㊂1试验材料与方法1.1研究区概况研究区选在延安安塞水土保持综合试验站(108ʎ51'44ᵡ 109ʎ26'18ᵡE,36ʎ30'45ᵡ 37ʎ19'3ᵡN),属黄土高原中部暖温带半湿润气候向半干旱气候过渡区,年均气温8.8ħ,年均降雨量531.4mm年际年内分布不均,多集中在7 9月;土壤类型为黄绵土,土质疏松抗蚀性差,水土流失严重;植被类型处于暖温带落叶阔叶林向草原过渡的森林草原区,草本植物多以菊科㊁豆科㊁禾本科为主,主要有茵陈蒿(A r t e m i s i a c a p i l l a r i s)㊁山苦荬(I x e r i sd e n t i c u l a t a)㊁黄鹌菜(Y o u n g i a j a p o n i c a)㊁苦马豆(S p h a e r o p h y s as a l s u-l a)㊁野豌豆(V i c i as e p i u m L.)㊁沙打旺(A s t r a g a l u s a d s u r g e n s P a l l.)㊁达乌里胡枝子(L e s p e d e z ad a v u r i-c a)㊁草木樨状黄耆(A s t r a g a l u sm e l i l o t o i d e s)㊁狗尾草(S e t a i r a v i r i d i s)㊁早熟禾(P o a p r a t e n s i s L.)㊁白羊草(B o t h r i o c h l o a i s c h a e m u m)等㊂1.2样地布设所选样地2000年撂荒,撂荒前主要种植稀疏的老品种果树(基本不管理)㊂2015年初对老化果树进行清理,在试验样地四周设置铁护栏,并对样地进行除草㊁翻整,样地地形平坦,以达乌里胡枝子㊁茵陈蒿㊁蒙古蒿㊁早熟禾㊁山苦菜㊁铁杆蒿等植被为优势种㊂试验于2015年采用随机区组试验设计,以自然恢复5a草地群落作为样地,设置增雨60%(L1)㊁增雨40%(L2)㊁增雨20%(L3)㊁减雨20%(D1)㊁减雨40% (D2)㊁减雨60%(D3)㊁对照(C K)7个降雨梯度处理㊂在7个降雨梯度处理分别设置5个面积为3mˑ3m 的小样方,彼此间隔2m㊂39第5期徐婷等:黄土丘陵区自然恢复草地土壤呼吸对降雨格局改变的响应Copyright©博看网. All Rights Reserved.减雨处理:在样方南北方向边缘两侧搭建支撑钢架(南低北高),支撑钢架平均高1m,保证近地表的空气自由流通以避免对微气候的影响,样方正上空在支撑钢架上搭建V型透光有机玻璃槽(长1.8m㊁宽0.1m㊁厚2m m,与水平面夹角20ʎ),其透光性大于92%,可消除环境差异影响,分别设置6,12,18个等间距V型槽固定在支撑钢架上,代表D1,D2,D3处理㊂增雨处理:在自然降雨过后,各减雨处理的V型槽承接到的雨水顺着高度差流入与V型槽末端紧密连接的横向集雨U P V C管道,最后流向集雨桶中,人工将集雨桶中的水均匀洒入对应的增雨小区中,对照组不做任何处理㊂1.3土壤呼吸速率㊁土壤温度㊁土壤含水量的测定在2019年5 10月期间完成土壤呼吸速率㊁土壤温度㊁土壤含水量的测定(此时改变降雨处理已长达4a),在每个样方中布设1个呼吸环,直径20c m㊁高10c m,缓慢插入土中,小心避免对植物根系造成损伤,同时避免边际效应,保持呼吸环露出地面约2 3c m㊂在测定前将基座内的地上植被剪去,整个过程避免扰动土壤和枯落物,保证基座与气室紧密对接,根据天气每月选择2d无雨晴朗日,采用E GM-4便携式C O2分析仪测定进行土壤呼吸测定,起测时间为每日6:00,每2h测定一次,到18:00结束所有测定共计6次㊂土壤温度㊁土壤体积含水量(5c m)采用直角地温计和S p e c t r u m T D R100便携式水分测定仪同步测定㊂经统计分析,本文以9:00 11:00所测值代表全天均值将两天所测值作为该月土壤呼吸速率的平均值[11]㊂试验期间的降雨量见图1㊂图12019年黄土丘陵区自然恢复草地生长季降雨量1.4数据处理本研究使用E x c e l2016和O r i g i n2018软件进行数据与图形处理,使用S P S S26进行统计分析㊂通过双因素方差分析(T w o-w a y A N O V A)检验不同降雨处理㊁时间对土壤呼吸速率㊁土壤温度及含水量的影响,对有显著差异的因素再进行L S D多重比较;采用回归分析探究土壤呼吸速率与土壤温度㊁土壤含水量的关系[12-13],其表达式如下:R s=a e b TQ10=e b10R s=a w2+b W+cR s=a+b T+c WR s=a e b T w c式中:R s为土壤呼吸速率 g/(m2㊃h) ;T为5c m 土层温度(ħ);W为5c m土层土壤含水量(%);Q10为土壤呼吸温度敏感性系数;a,b,c为参数㊂2结果与分析2.1土壤呼吸的季节性变化不同降雨处理土壤呼吸速率均存在明显的季节变化(图2),表现为随时间推移先上升后下降的单峰曲线㊂7月达峰值,各处理的峰值变化范围为0.53~ 0.97g/(m2㊃h),大小依次为L1,L3,C K,L2,D1,D2, D3㊂土壤呼吸速率最小值主要出现在10月(除L2, D3的最小值为5月外),谷值变化范围为0.14~0.34 g/(m2㊃h),大小依次为C K,L2,L3,D1,L1,D2,D3㊂在整个植物生长季(5 10月),土壤呼吸速率均值变化范围为0.35~0.61g/(m2㊃h)(表1)㊂L3,L1处理大于C K但无显著差异,L2处理较C K显著降低了10.17%,所有减雨处理均显著低于C K土壤呼吸速率,表现为土壤呼吸随降雨量减少而降低,D1,D2, D3较C K分别降低了15.25%,28.81%,40.68%㊂表1降雨处理对生长季草地土壤呼吸速率及水热因子的影响(平均值ʃ标准差)降雨梯度土壤呼吸速率/(g㊃m-2㊃h-1)土壤温度/ħ土壤体积含水量/%L10.59ʃ0.01a21.62ʃ0.74b c6.61ʃ0.28b L20.53ʃ0.01b20.34ʃ0.42d7.13ʃ0.31a L30.61ʃ0.01a19.93ʃ0.75d7.11ʃ0.11a D10.50ʃ0.02c20.43ʃ0.43c d5.35ʃ0.25d D20.42ʃ0.01d21.00ʃ0.64c d4.73ʃ0.13e D30.35ʃ0.01e22.28ʃ1.00a b4.07ʃ0.26f C K0.59ʃ0.02a23.09ʃ0.19a5.84ʃ0.07c 注:表中含有不同字母表示差异显著(p<0.05);相同字母表示差异不显著(p>0.05)㊂2.2水热因子的季节性变化各降雨处理下土壤温度存在明显的单峰曲线季节变化(图3),均于7月达峰值,10月达谷值㊂土壤温度在月间存在显著差异(p<0.05),月内各处理土壤温度存在一定差异,C K的土壤温度高于增㊁减雨处理㊂各降雨处理土壤含水量在生长季随时间呈先降后升的变化,增雨处理大于降雨处理土壤含水量㊂各降雨处理土壤含水量最大值均出现在10月(图4),最小值多集中于6月,由于D3,D2处理雨量减少较多49水土保持研究第30卷Copyright©博看网. All Rights Reserved.且5月降雨量最少,故二者的最小值出现在5月㊂在整个植物生长季(5 10月),各降雨处理下土壤温度均值变化范围为19.93~23.09ħ,大小依次为C K,D3,L1,D2,L2,D1,L3,且C K和D3土壤温度显著高于其余处理,L3和L2土壤温度显著低于其余处理,较C K分别降低了13.69%,11.91%㊂土壤含水量均值变化范围为4.07%~7.13%,大小依次为L2, L3,L1,C K,D1,D2,D3,且D3土壤含水量显著小于其余处理,比C K小1.77%,L3和L2土壤含水量显著大于其余处理,分别比C K大1.27%,1.29%㊂注:图中含有不同小写字母表示相同月份下不同降雨梯度的土壤呼吸速率差异显著(p<0.05);不同大写字母表示相同降雨梯度下不同月份的土壤呼吸速率差异显著(p<0.05)㊂图2土壤呼吸速率对不同降雨处理的响应注:图中含有不同小写字母表示相同月份下不同降雨梯度的土壤温度差异显著(p<0.05);不同大写字母表示相同降雨梯度下不同月份的土壤温度差异显著(p<0.05)㊂图3土壤温度对不同降雨处理的响应注:图中含有不同小写字母表示相同月份下不同降雨梯度的土壤体积含水量差异显著(p<0.05);不同大写字母表示相同降雨梯度下不同月份的土壤体积含水量差异显著(p<0.05)㊂图4土壤体积含水量对不同降雨处理的响应2.3土壤呼吸与水热因子的关系采用指数㊁二次函数模型对各降雨处理的土壤呼吸速率与土壤温度㊁土壤含水量分别进行回归分析(表2)㊂D3处理土壤呼吸与土壤温度无显著相关性,其余处理土壤呼吸与土壤温度均呈极显著指数相关(p<0.01),土壤温度可以解释68.3%~83.8%的土壤呼吸变化㊂总体上,土壤呼吸的Q10值随降雨量的增加而增大,最大值为L3处理(1.768),最小值为D359第5期徐婷等:黄土丘陵区自然恢复草地土壤呼吸对降雨格局改变的响应Copyright©博看网. All Rights Reserved.处理(1.336)㊂不同降雨处理土壤呼吸与土壤含水量均呈显著二次函数相关(p<0.05)㊂土壤含水量可以解释34.1%~69.4%的土壤呼吸变化㊂采用双因素模型对不同降雨处理的土壤呼吸与土壤温度㊁土壤含水量进行回归分析(表3),土壤温度㊁土壤含水量联合与土壤呼吸存在极显著的线性相关和幂 指数相关(p<0.01),二者联合可共同分别解释土壤呼吸变化的50.4%~86.9%和66.5%~88.6%㊂表2降雨改变下土壤呼吸速率与土壤温度㊁土壤含水量单因素模型拟合关系降雨处理土壤呼吸速率与土壤温度模型R s=a e b ta b R2p Q10土壤呼吸速率与土壤含水量模型R s=a w2+b w+ca b R2p Q10L10.1640.0540.715<0.0011.716-0.0100.1420.1810.3410.017 L20.1770.0490.716<0.0011.632-0.0140.2280.0230.4930.002 L30.1780.0570.838<0.0011.768-0.0100.1530.1680.5080.002 D10.2130.0390.696<0.0011.477-0.0100.1210.2120.3490.016 D20.1950.0350.683<0.0011.419-0.0100.1170.1630.4590.004 D30.1700.0290.1530.0601.336-0.0230.244-0.1460.621<0.001 C K0.2040.0420.694<0.0011.522-0.0050.0230.6510.6940.022表3降雨改变下土壤呼吸速率与土壤温度㊁土壤含水量双因素模型拟合关系降雨处理土壤呼吸速率与土壤温度㊁土壤含水量线性模型R s=a+b T+c Wa b c R2p土壤呼吸速率与土壤温度㊁土壤含水量幂-指模型R s=a e b T W ca b c R2pL1-0.6040.0430.0350.745<0.0010.3770.0450.3190.816<0.001 L2-0.5350.0400.0300.869<0.0010.5060.0370.2250.886<0.001 L3-0.3160.0390.0170.822<0.0010.6240.0390.1490.847<0.001 D1-0.2070.0280.0250.777<0.0010.7170.0270.1680.819<0.001 D20.0440.0160.0090.661<0.0010.9950.0160.0600.679<0.001 D3-0.2890.0200.0460.5040.0020.6900.0200.2220.665<0.001 C K-0.7940.0430.0580.702<0.0010.3480.0420.3700.726<0.0013讨论3.1不同降雨处理土壤呼吸及水热因子变化草地土壤呼吸对降雨响应的普遍规律为增雨促进土壤呼吸,减雨抑制土壤呼吸[14-15],本研究中减雨处理土壤呼吸结果与前人研究结果一致,但增雨处理下土壤呼吸结果有所不同㊂本研究发现在黄土丘陵区自然恢复草地,增雨60%,20%对土壤呼吸无显著促进作用,减雨60%,40%,20%处理和增雨40%处理土壤呼吸速率显著降低㊂减雨主要通过加剧干旱胁迫来抑制土壤呼吸,一方面减雨使土壤微生物呼吸底物的供给减少,进而使微生物活性减弱,导致土壤微生物呼吸降低;另一方面减雨使植株生长发育减缓,进而使植物根际的光合产物分配减少,导致植株根系呼吸降低[16]㊂在相对干旱的生态系统中,增雨使土壤含水量明显提高,进而增强土壤可溶性有机物的有效性和流动性,促使植株根系生长发育㊁凋落物积累,同时有机质的增加又为微生物活动所需底物提供保障,进而大幅促进土壤呼吸[17];但由于增雨幅度不断增加,土壤含水量逐渐超过一定阈值并迅速达到过饱和状态,制约O2进入土壤,从而造成厌氧环境,减弱微生物和植被根系呼吸作用,转而开始抑制土壤呼吸[16]㊂本研究区属暖温带半湿润气候向半干旱气候过渡区,年均降雨量531.4mm,增加降雨可以使土壤含水量较快达到饱和状态,导致增雨对土壤呼吸的促进作用有限㊂本研究增雨处理的土壤含水量明显大于减雨处理,土壤含水量整体上随雨量的增加而增加,但增雨60%处理的土壤含水量却低于增雨40%㊁增雨20%的处理㊂这说明增雨20%处理的土壤含水量已经接近饱和状态,故而增雨40%处理的土壤含水量最高并显著抑制了土壤呼吸,而增雨60%的土壤含水量和土壤呼吸之所以高于对照,一方面可能是由于经过长期的高降雨量处理,最终促进了该降雨量格局下土壤有机质的矿化和地表枯落物的分解,提高69水土保持研究第30卷Copyright©博看网. All Rights Reserved.了呼吸底物的有效性,进而加快了土壤呼吸,使土壤含水量下降[18];另一方面可能是由于经过长期的高降雨量处理,植物长势最好,生物量最大(增雨60%的生物量为336.26g/m2),物质运输和能量流动较为剧烈,加快了土壤呼吸,同时使土壤含水量下降[19]㊂对照土壤温度高于所有增㊁减雨处理,可能是由于研究区内植株已适应了本地气候的土壤含水量,其土壤含水量也适宜该类植株的生长发育,而高于或低于该土壤含水量可能会降低微生物代谢产热,从而影响土壤温度[20],具体影响机制有待进一步探究㊂3.2土壤呼吸与土壤温度㊁含水量的关系土壤温度㊁土壤含水量主要通过改变土壤微生物代谢㊁植物根系生长进程来影响土壤呼吸作用[21]㊂土壤温度通过影响酶的活性从而改变土壤中微生物㊁动物㊁植物根系代谢以及有机质分解进而调控土壤呼吸[22]㊂在一定范围内,土壤温度升高可以通过提高酶活性从而加快土壤微生物代谢㊁植物根系生长以及加速有机质分解来促进土壤呼吸;当土壤温度超出该范围后,抑制土壤呼吸,使土壤呼吸与温度的关系变为高斯型变化趋势[22-23]㊂一般情况下,增加土壤含水量主要通过提高土壤养分利用率㊁激活微生物活性来促进土壤呼吸;但当土壤水分超出一定范围后,过多的土壤水分使O2和C O2在土壤中的扩散受阻,从而抑制土壤呼吸[24]㊂大部分条件下,土壤呼吸受土壤水分和温度的联合调控[25],也有研究表明干旱半干旱区土壤呼吸主要受土壤温度影响,而与土壤含水量无显著相关性[26-27]㊂本研究发现,土壤呼吸与土壤含水量㊁温度存在显著相关性㊂各降雨处理温度单因素指数函数的解释程度均高于水分单因素二次函数的解释程度,故土壤温度是影响该地区土壤呼吸的关键环境因子㊂大多数研究表明,在没有土壤水分胁迫的条件下,土壤呼吸与土壤温度呈指数函数关系[28];反之,发生土壤水分胁迫时,土壤含水量成为影响土壤呼吸的主导因素[29],本研究中减雨60%造成水分胁迫导致温度单因素指数函数的解释程度最低(15.3%),而水分单因素二次函数在减雨60%的解释程度较高㊂往往由单一土壤温度或土壤水分对土壤呼吸变化解释程度不足,便需要采用双因素模型来预测土壤温度和水分对土壤呼吸的共同作用[28]㊂目前多采用幂 指数函数模型模拟土壤呼吸,高宇等[27]研究发现该模型能够解释土壤呼吸变异的35%~58%,本研究双因素幂 指数模型能够解释土壤呼吸变异的66.5%~88.6%㊂温度 水分双因素线性函数和双因素幂 指函数均在减雨60%的解释程度最低,增雨40%的解释程度最高,说明在增雨40%~60%存在阈值,即降雨改变土壤温度和土壤含水量对土壤呼吸的主导程度,进而改变其交互效应程度㊂本研究论证了由于水分胁迫,温度单因素指数函数模型不适用于减雨60%处理,土壤温度和水分的双变量函数能更准确地应用于黄土丘陵区不同降雨量梯度草地的土壤呼吸预测,且双因素幂 指数模型能更好解释土壤呼吸的变异性㊂3.3土壤呼吸的温度敏感性Q10是指温度每升高10ħ,土壤呼吸增加的倍数㊂张鹤等[30]研究得出黄土丘陵区退耕天然草地群落5c m土层Q10范围为1.31~2.01㊂本研究中除D3处理与土壤温度间不存在显著相关性,L3,L2,L1, D1,D2,C K处理Q10分别为1.77,1.63,1.72,1.48, 1.42,1.52㊂陈全胜等[31]经过长时间的监测得出,内蒙古典型温带草原的Q10值随着土壤水分含量增加呈上升趋势㊂本研究也发现增雨增加了土壤呼吸的温度敏感性,减雨降低了土壤呼吸的温度敏感性㊂土壤呼吸的温度敏感性与土壤含水量相关,在一定土壤含水量范围内,土壤温度对土壤呼吸无显著影响;当土壤含水量高于一定程度时,土壤温度和土壤呼吸具有很强的相关性㊂因此,降雨量改变引起土壤含水量变化将进一步影响土壤呼吸的温度敏感性㊂4结论在生长季内,不同降雨处理改变了黄土丘陵区自然恢复草地土壤呼吸速率,土壤呼吸总体上随降雨量的减少而减慢,与增雨处理相比,土壤呼吸对减少降雨更为敏感,减雨60%下土壤呼吸速率最小,降低幅度达40.68%;不同降雨处理没有改变土壤呼吸的季节性变化规律,各降雨处理土壤呼吸速率均呈单峰曲线变化,于7月达峰值;土壤呼吸与土壤温度㊁含水量存在显著相关性,二者是降雨格局改变条件下调控土壤呼吸的重要因子,其双因素幂 指数模型能较好地解释土壤呼吸的变异性㊂参考文献:[1]J e f fT.I P C Cc l i m a t e r e p o r t:E a r t h i sw a r m e r t h a n i t'sb e e n i n125,000y e a r s[J].N a t u r e,2021,596(7871):171-172.[2] D uY,W a n g Y P,S uFL,e t a l.T h e r e s p o n s eo f s o i lr e s p i r a t i o nt o p r e c i p i t a t i o n c h a n g ei sa s y mm e t r i ca n dd i f fe r s b e t w e e n g r a s s l a n d s a n df o r e s t s[J].G l o b a l79第5期徐婷等:黄土丘陵区自然恢复草地土壤呼吸对降雨格局改变的响应Copyright©博看网. All Rights Reserved.C h a n g eB i o l o g y,2020,26(10):6015-6024.[3]於方,朱文泉,曹东,等.青海省因草地生态破坏造成土壤流失的经济损失核算[J].中国环境科学,2009,29(1): 90-94.[4] S c h u m aGE,J a n z e nH H,H e r r i c k JE.S o i l c a r b o n d y-n a m i c s a n d p o t e n t i a l c a r b o n s e q u e s t r a t i o nb y r a n g e l a n d s[J].E n v i r o n m e n t a l P o l l u t i o n,2002,116(3):391-396.[5]王胜,樊军,王建国,等.水蚀风蚀交错区土壤呼吸特征及其对水热因子的响应[J].农业环境科学学报,2014,33(9):1770-1781.[6] C h u r k i n a G,R u n n i n g S W,S c h l o s s A L.C o m p a r i n gg l o b a l m o d e l s o ft e r r e s t r i a ln e t p r i m a r y p r o d u c t i v i t y(N P P):t h e i m p o r t a n c eo fw a t e ra v a i l a b i l i t y[J].G l o b a lC h a n g eB i o l o g y,1999,5(1):46-55.[7] L i uLL,W a n g X,L a j e u n e s s e MJ,e t a l.Ac r o s s-b i o m es y n t h e s i s o f s o i l r e s p i r a t i o na n di t sd e t e r m i n a n t su n d e r s i m u l a t e d p r e c i p i t a t i o nc h a n g e s[J].G l o b a lC h a n g eB i o l o g y, 2016,22(4):1394-1405.[8]李寅龙,红梅,白文明,等.水㊁氮控制对短花针茅草原土壤呼吸的影响[J].生态学报,2015,35(6):1727-1733.[9]陶冬雪,李文瑾,杨恬,等.降水变化和养分添加对呼伦贝尔草甸草原土壤呼吸的影响[J].生态学杂志,2022,41(3):465-472.[10]王兴,钟泽坤,朱玉帆,等.增温和增雨对黄土丘陵区撂荒草地土壤呼吸的影响[J].环境科学,2022,43(3):1657-1667.[11]周俊杰,陈志飞,杨全,等.黄土丘陵区退耕草地土壤呼吸及其组分对氮磷添加的响应[J].环境科学,2020,41(1):479-488.[12] Z h a n g L H,C h e nY N,Z h a oRF,e t a l.S i g n i f i c a n c eo f t e m p e r a t u r e a n ds o i lw a t e r c o n t e n t o ns o i l r e s p i r a t i o n i nt h r e e d e s e r t e c o s y s t e m s i nN o r t h w e s tC h i n a[J].J o u r n a l o fA r i dE n v i r o n m e n t s,2010,74(10):1200-1211.[13] R e y A,P e g o r a r oE,T e d e s c h lV,e t a l.A n n u a l v a r i a-t i o n i ns o i l r e s p i r a t i o na n d i t s c o m p o n e n t s i na c o p p i c eo a k f o r e s t i nC e n t r a l I t a l y[J].G l o b a lC h a n g eB i o l o g y,2002,8(9):851-866.[14]宋晓辉,王悦骅,王占文,等.不同放牧强度和水分处理下荒漠草原土壤呼吸与群落地下生物量的关系[J].草地学报,2019,27(4):962-968.[15]杨青霄,田大栓,曾辉,等.降水格局改变背景下土壤呼吸变化的主要影响因素及其调控过程[J].植物生态学报,2017,41(12):1239-1250.[16]李新鸽,韩广轩,朱连奇,等.降雨量改变对黄河三角洲滨海湿地土壤呼吸的影响[J].生态学报,2019,39(13):4806-4820.[17]蒿廉伊,张丽华,谢忠奎,等.降水变化对荒漠草原土壤呼吸的影响[J].环境科学,2021,42(9):4527-4537.[18]彭琴,齐玉春,董云社,等.干旱半干旱地区草地碳循环关键过程对降雨变化的响应[J].地理科学进展,2012,31(11):1510-1518.[19]姜佰文,李静,陈睿,等.降雨年型变化及竞争对反枝苋和大豆生长的影响[J].生物多样性,2018,26(11):1158-1167.[20]朱义族,李雅颖,韩继刚,等.水分条件变化对土壤微生物的影响及其响应机制研究进展[J].应用生态学报,2019,30(12):4323-4332.[21]邵玉琴,赵吉,杨劫.恢复草地和退化草地土壤微生物类群数量的分布特征[J].中国沙漠,2004,24(3):223-226. [22]全权,张震,何念鹏,等.短期氮添加对东灵山3种森林土壤呼吸的影响[J].生态学杂志,2015,34(3):797-804. [23] D a v i d s o nEA,V e r c h o t LV,C a t tân i o JH,e t a l.E f f e c t s o fs o i lw a t e rc o n t e n to ns o i l r e s p i r a t i o ni nf o r e s t sa n dc a t t l ep a s t u r e s o f E a s t e r n A m a z o n i a[J].B i o g e o c h e m i s t r y,2000,48(1):53-69.[24]范洪旺,滕臻,许克福.城市绿地土壤呼吸研究综述[J].生态科学,2018,37(5):210-216.[25]魏书精,罗碧珍,孙龙,等.森林生态系统土壤呼吸时空异质性及影响因子研究进展[J].生态环境学报,2013,22(4):689-704.[26] D a v i d s o nE A,B e l kE,B o o n eRD.S o i lw a t e r c o n t e n ta n d t e m p e r a t u r ea s i n d e p e n d e n to rc o n f o u n d e df a c t o r sc o n t r o l l i n g s o i l r e s p i r a t i o n i na t e m p e r a t em i x e dh a r d-w o o d f o r e s t[J].G l o b a lC h a n g eB i o l o g y,1998,4(2):217-227.[27]高宇,樊军,米美霞,等.水蚀风蚀交错区土壤呼吸影响因素及其对土地利用方式变化的响应[J].植物营养与肥料学报,2013,19(5):1207-1217.[28]郭艳萍,李洪建.天龙山灌丛生态系统土壤呼吸对水热和植被因子的响应[J].中国土壤与肥料,2022(4):131-139.D o i:10.11838/s f s c.1673-6257.21262. [29]W a n g Y,H uY,J iB,e t a l.A n i n v e s t i g a t i o no nt h er e l a t i o n s h i p b e t w e e n e m i s s i o n/u p t a k e o f g r e e n h o u s eg a s e s a n de n v i r o n m e n t a l f a c t o r s i nS e r n i a r i dG r a s s l a n d[J].A d v a n c e s i nA t m o s p h e r i cS c i e n c e s,2003,20(1):119-127.[30]张鹤,陈吉,熊沛枫,等.黄土丘陵区3种典型天然草地群落土壤呼吸对模拟降雨的响应[J].环境科学学报,2017,37(8):3139-3148.[31]陈全胜,李凌浩,韩兴国,等.典型温带草原群落土壤呼吸温度敏感性与土壤水分的关系[J].生态学报,2004,24(4):831-836.89水土保持研究第30卷Copyright©博看网. All Rights Reserved.。
2001—2020年黄土高原生态环境质量对气候及土地利用变化的响应
第43卷第3期2023年6月水土保持通报B u l l e t i no f S o i l a n d W a t e rC o n s e r v a t i o nV o l .43,N o .3J u n .,2023收稿日期:2022-09-18 修回日期:2022-11-12资助项目:十三五国家重点研发计划 高塬沟壑区固沟保塬生态防护 (2016Y F C 0501706-02);国家自然科学基金项目(41671283) 第一作者:张洵(1999 ),男(汉族),江苏省盐城市人,硕士研究生,研究方向为水土保持与生态环境㊂E m a i l :z h a n gx u n 0809@n w a f u .e d u .c n ㊂ 通信作者:高照良(1969 ),男(汉族),河南灵宝人,博士,研究员,主要从事水土保持方向研究㊂E m a i l :gz l @m s .i s w c .a c .c n ㊂2001 2020年黄土高原生态环境质量对气候及土地利用变化的响应张洵1,岑云峰1,高照良1,2,李永红1,2,孙贯芳1,刘文博1(1.西北农林科技大学水土保持研究所,陕西杨凌712100;2.中国科学院水利部水土保持研究所,陕西杨凌712100)摘 要:[目的]分析黄土高原生态环境质量(E E Q )时空变化特征及其对气候与土地利用变化的响应情况,为黄土高原制定合理的生态保护措施及土地开发提供一定的依据,以实现其高质量发展㊂[方法]基于改进的遥感生态环境指数及气候㊁土地利用等数据,从像元尺度出发,利用T h e i l -S e n 趋势分析等方法探究了黄土高原2001 2020年E E Q 的时空变化特征,同时采用多元回归及叠加分析等手段研究了E E Q 对气候变化及土地利用转移的响应情况㊂[结果]①研究时段内,黄土高原E E Q 呈现小幅度波动上升㊁下降㊁再上升趋势,相较于2001 2010年,2010 2020年波动有所放缓;空间上,E E Q 总体质量一般,呈 东南高,西北低 的格局,2010 2020年相较于2001 2010年而言,显著增加的区域由东南部向中北部区域转移,显著下降的区域由西北部向东部转移㊂②降水量对E E Q 整体呈正面效应,在2001 2007年期间呈现显著的正相关关系,后期由于其他因素的干扰驱动力有所下降,在植被覆盖较少的区域则影响较小;气温在大部分区域与E E Q 呈负相关,相较于降水量而言影响较小,在城市密集地区影响较大㊂③研究时段内,大量的耕地向草地,草地向林地及未利用地向草地的转移是研究区内E E Q 呈稳中向好格局的主要驱动力,而耕地向建设用地,草地向未利用地的转移是引起E E Q 下降的重要因素㊂[结论]黄土高原的E E Q 受到气候及土地利用的双重影响㊂降水对E E Q 的影响大于温度,土地利用转变对于E E Q 整体呈现正面效应,具有空间异质性,对区域内城市群区域生态保护应予以重视㊂关键词:生态环境质量;黄土高原;气候变化;土地利用文献标识码:A 文章编号:1000-288X (2023)03-0234-11中图分类号:X 87,X 171.1文献参数:张洵,岑云峰,高照良,等.2001 2020年黄土高原生态环境质量对气候及土地利用变化的响应[J ].水土保持通报,2023,43(3):234-244.D O I :10.13961/j .c n k i .s t b c t b .2023.03.028;Z h a n g Xu n ,C e n Y u n f e n g ,G a oZ h a o l i a n g ,e ta l .R e s p o n s eo fe c o -e n v i r o n m e n t a l q u a l i t y t oc l i m a t ec h a n gea n dl a n du s e i n L o e s sP l a t e a u f r o m2000t o 2020[J ].B u l l e t i no f S o i l a n d W a t e rC o n s e r v a t i o n ,2023,43(3):234-244.R e s p o n s e o fE c o -e n v i r o n m e n t a l Q u a l i t y t oC l i m a t eC h a n ge a n d L a n dU s e i nL o e s sP l a t e a uf r o m2000t o 2020Z h a n g X u n 1,C e nY u n f e n g 1,G a oZ h a o l i a n g 1,2,L iY o n g h o n g 1,2,S u nG u a n f a n g 1,L i u W e n b o 1(1.I n s t i t u t e o f S o i l a n d W a t e rC o n s e r v a t i o n ,N o r t h w e s tA&F U n i v e r s i t y ,Y a n g l i n g ,S h a a n x i 712100,C h i n a ;2.I n s t i t u t e o f So i l a n d W a t e rC o n s e r v a t i o n ,C h i n e s e A c a d e m y o f S c i e n c e s a n d M i n i s t r y o f W a t e rR e s o u r c e s ,Y a n g l i n g ,S h a a n x i 712100,C h i n a )A b s t r a c t :[O b j e c t i v e ]T h es p a t i a la n dt e m p o r a lc h a n g e so fe c o l o g i c a le n v i r o n m e n t a l q u a l i t y (E E Q )i n r e s p o n s e t o c l i m a t e a n d l a n du s e c h a n g e s o n t h eL o e s sP l a t e a uw e r e a n a l yz e d i no r d e r t o p r o v i d e ab a s i s f o r t h e f o r m u l a t i o no f r e a s o n a b l e e c o l o g i c a l p r o t e c t i o nm e a s u r e s a n d l a n dd e v e l o pm e n t o n t h eL o e s sP l a t e a u t h a t w i l l p r o m o t e h i g h -q u a l i t y d e v e l o p m e n t .[M e t h o d s ]B a s e d o n a n i m p r o v e d r e m o t e s e n s i n g e c o l o g i c a l e n v i r o n m e n t a l i n d e xa n d c l i m a t e a n d l a n du s ed a t a ,w ed e t e r m i n e d t h e s p a t i a l a n d t e m po r a l c h a r a c t e r i s t i c so fE E Qo nt h e L o e s sP l a t e a u f r o m2001t o 2020u s i n g T h e i l -S e n t r e n d a n a l y s i s a t t h e i m a g e p i x e l s c a l e .[R e s u l t s ]①D u r i n g t h e s t u d yp e r i o d ,E E Qv a l u e s o n t h eL o e s sP l a t e a us h o w e ds m a l l f l u c t u a t i o n s o f r i s i n g ,f a l l i n g ,a n d r i s i n g,a n d t h e f l u c t u a t i o n s s l o w e dd o w nf r o m2010t o2020c o m pa r e dw i t ht h e t i m e p e r i o do f 2001t o2010.E E Q Copyright ©博看网. All Rights Reserved.v a l u e s g e n e r a l l y s h o w e d a s p a t i a l p a t t e r no f h i g h e r i n t h e s o u t h e a s t a n d l o w e r i n t h e n o r t h w e s t .C o m p a r e d w i t ht h e p e r i o d f r o m2001t o2010,t h e p e r i o d o f2010t o2020e x h i b i t e d a n a r e a o f s i g n i f i c a n t i n c r e a s e i nE E Q t h a t s h i f t e d f r o mt h e s o u t h e a s t t o t h en o r t h-c e n t r a l r e g i o n,a n da na r e ao f s i g n i f i c a n td e c r e a s e i nE E Qt h a t s h i f t e d f r o mt h e n o r t h w e s t t o t h e e a s t.②P r e c i p i t a t i o nh a d a n o v e r a l l p o s i t i v e e f f e c t o nE E Q,w i t ha s i g n i f i c a n t p o s i t i v e c o r r e l a t i o n f r o m2001t o2007.D u e t o t h e i n t e r f e r e n c e o f o t h e r f a c t o r s i n t h e l a t e r p e r i o d,t h e d r i v i n g f o r c e i n c r e a s e d,a n dt h ei n f l u e n c e w a ss m a l l i na r e a s w i t hl e s sv e g e t a t i o nc o v e r a g e.T e m p e r a t u r eh a da n e g a t i v e e f f e c to nE E Qi n m o s ta r e a s,w i t hl e s se f f e c tc o m p a r e d w i t h p r e c i p i t a t i o n,a n d g r e a t e re f f e c t i n d e n s eu r b a na r e a s.③D u r i n g t h es t u d y p e r i o d,l a r g et r a n s f e r so fc r o p l a n dt o g r a s s l a n d,g r a s s l a n dt o w o o d l a n d,a n du n u s e d l a n d t o g r a s s l a n dw e r e t h em a i nd r i v i n g f o r c e s f o r t h e s t e a d y t o g o o d p a t t e r no fE E Q i n t h e s t u d y a r e a,w h i l e t h e t r a n s f e ro f c r o p l a n d t oc o n s t r u c t i o n l a n da n do f g r a s s l a n d t ou n u s e d l a n dw e r e i m p o r t a n t f a c t o r s c a u s i n g t h e d e c l i n e o f E E Q.[C o n c l u s i o n]E E Qo n t h eL o e s s P l a t e a uw a s i n f l u e n c e d b y b o t h c l i m a t e a n d l a n du s e.T h e i n f l u e n c e o f p r e c i p i t a t i o no nE E Q w a s g r e a t e r t h a n t h a t o f t e m p e r a t u r e,a n d l a n d u s e s h i f t s g e n e r a l l y s h o w e d p o s i t i v e e f f e c t s o nE E Qb u tw i t hs p a t i a l h e t e r o g e n e i t y.G r e a t e r a t t e n t i o ns h o u l d b e g i v e n t o r e g i o n a l e c o l o g i c a l c o n s e r v a t i o n i nu r b a n c l u s t e r sw i t h i n t h e r e g i o n i n t h e f u t u r e.K e y w o r d s:e c o l o g i c a l e n v i r o n m e n t a l q u a l i t y;L o e s sP l a t e a u;c l i m a t e c h a n g e;l a n du s e近几十年以来,随着气候变化和人类活动的不断加剧,生态环境质量同自然与人类的关系变得尤为复杂㊂实现良好的生态环境是实现可持续发展的重要前提[1],也是推进中国生态文明建设进程的基础条件[2]㊂土地利用/土地覆盖变化(l a n d-u s ea n dl a n d-c o v e r c h a n g e,L U C C)是地表系统最突出的指标之一,能够反映人类活动,被认为是全球生态环境变化的主要原因[3]㊂20世纪以来,西北地区经济的发展引起了土地利用的深刻转型[4],生态的脆弱性及不稳定性也进一步加剧,具有较强的空间异质性[5]㊂研究表明1995 2015年中国生态环境质量变化重心持续向西部地区转移,其变化的热点集中分布在陕西㊁甘肃及内蒙古等区域[6]㊂黄土高原作为中国水土保持与生态建设的重点区域[7],近几十年来气候变化波动剧烈[8],人类活动导致土地利用频繁变化[9]㊂因此,监测黄土高原地区生态环境演变状况㊁研究生态环境变化对气候变化及土地利用的响应并为此做出相应对策是目前亟待解决的问题㊂有关生态环境质量的评估目前已存在众多评价体系,多以数学模型为基础㊂如生态环境部部于2015年颁布的基于植被覆盖度㊁生物丰度㊁土地胁迫指数等指标构建的生态环境状况指数(e c o l o g i c a l i n d e x,E I)㊂徐涵秋[10]于2013年提出的基于遥感技术,耦合了反演得到的植被指数(N D V I)㊁湿度指数(W E T)㊁地表热度(L S T)和建筑物 裸土指数(N D B S I)的遥感生态指数(r e m o t es e n s i n g e c o l o g i-c a l i n d e x,R S E I),从而实现了对区域生态环境时空分布及变化趋势预测的评价,较好地解决了E I指数获取难度大㊁大规模应用困难的问题㊂目前国内学者基于R S E I针对不同区域开展了一系列研究,如华东及华中[11-14]㊁东北[15-16]㊁西北地区[17-18],黄河流域[1,5,19-20]㊁长江中下游[21],以及全国尺度[22-23]等㊂然而,单纯基于以上4个指标的R S E I对于某些研究区域的评估具有局限性,在某些情况下相较于标准化的E I指数来说存在一定的偏差现象㊂由此一些研究者在R S E I的基础上构建出了改进的遥感生态指数模型:如王杰等在原有的基础上附加了盐度(S I-T)及土地退化指标构建了适用于干旱区的A R E S I模型[24],朱冬雨等[25]通过移动窗口细分评价区域构建出了适用于矿区等环境复杂区域的MW-R S E I模型,付杰等[26]在R S E I的基础上增加了土地利用指标(L U S)㊁坡度指标(s l o p e)等构建了I R S E I模型用以评估海南岛,张壑等[27],X uD o n g[28]针对生态系统功能服务构建了R S E I-2模型来评价中国的生态环境质量,并在部分区域生态环境研究得到了一定的验证[29]㊂以往针对黄土高原区域的研究主要集中在植被覆盖度(N D V I)等指标[30-32],有关生态环境质量的研究仍然很少且以定性的描述为主[33],对气候或土地利用变化的影响的关注较少㊂因此,本研究采用基于R S E I-2模型,构建能够反映生境环境质量的生态环境指数,并结合降水气温及土地利用等数据,以黄土高原为研究区域,采用T h e i l-S e n趋势分析㊁逐像元多元回归等方法,分析2001 2020年黄土高原生态环境质量的变化特征及其对气候变化及土地利用的响应,旨在为黄土高原生态环境的制定合理的生态保护措施及实现高质量发展提供一定的科学依据㊂1研究区概况黄土高原地区(33ʎ 41ʎN,100ʎ 114ʎE)位于中532第3期张洵等:2001 2020年黄土高原生态环境质量对气候及土地利用变化的响应Copyright©博看网. All Rights Reserved.国北太行山以西,乌鞘岭以东,秦岭以北,长城以南的地区,面积约有6.40ˑ105k m 2,包括山西㊁青海㊁陕西㊁甘肃等省(自治区)全部或部分区域㊂该地区位于沿海向内陆㊁平原向高原过渡地带,自南而北兼跨暖温带㊁中温带两个热量带,自东向西横贯半湿润㊁半干旱两个干湿区[34]㊂高原东部㊁南部属于暖温带半湿润区,中部属于暖温带半干旱区,西部和北部属于中温带半干旱区,具有典型的大陆季风气候特征[23]㊂全年总雨量少,65%的雨水集中在夏季,降水的强度大;高原日照充足,年均气温在8~14ħ㊂由于气候差异大㊁地貌单元复杂,该地区是中国生态环境最脆弱的地区之一,主要表现在径流量减少㊁土壤侵蚀剧烈㊁土地荒漠化严重㊁植被退化等方面[7]㊂2 数据与方法2.1 研究数据来源及预处理本研究使用的数据主要包括中国高分辨率生态环境质量数据集[27](C H E Q )㊁L a n d s a t 8卫星数据㊁降雨数据㊁气温数据㊁Y a n g Ji e 等[35]基于L a n d s e t 卫星构建出的中国年土地覆盖(C L C D )数据集㊁数字高程数据(D E M )㊁省边界及河网数据,具体信息见表1㊂其中遥感影像直接来源于G o o g l eE a r t hE n gi n e 所计算出的L a n d s a t 8(O L I )地表反射率数据产品(s u r f a c e r e f l e c -t a n c e ,S R ),该数据产品已经过几何校正㊁辐射校正和大气校正㊂基于G E E 平台进行编程(J a v a S c r i p t ),筛选合适时间并使用云掩膜算法去云,并完成裁剪㊂表1 数据源详细说明T a b l e 1 D e t a i l e dd e s c r i pt i o no f d a t a s o u r c e s 数据名空间分辨率时间分辨率时间范围数据来源中国高分辨率生态环境质量(C H E Q )1000m 年2001 2019年文献[27]h t t p s :ʊz e n o d o .o r g /r e c o r d /5500805陆地资源卫星8(L a n d s a t 8)30m 16d 2020年美国航空航天局h t t p s :ʊl a n d s a t .g s f c .n a s a .g o v 中国年土地覆盖数据(C L C D )30m年2001,2010,2019年文献[33]h t t p s :ʊz e n o d o .o r g/r e c o r d /4417810降雨数据1000m 月2001 2020年国家地球系统科学数据中心h t t p :ʊl o e s s .g e o d a t a .c n 气温数据1000m 月2001 2020年国家地球系统科学数据中心h t t p :ʊl o e s s .g e o d a t a .c n 数字高程(D EM )30m 20152015年中国科学院地理科学与资源研究所h t t p s :ʊw w w.r e s d c .c n 中国省边界㊁河网1ʒ100000020152015年中国科学院地理科学与资源研究所h t t ps :ʊw w w.r e s d c .c n 为了定量评价区域生态环境质量,参考2015年环境保护部开发并发布的生态环境质量指数(E I)模型㊂由于此数据源结果与E I 结果高度一致[28],评价指标采用中华人民共和国生态环境部于2021年颁布并实施的‘全国生态状况调查评估技术规范 生态质量评估“(H J 1172-2021)推荐的评价指标定量评价区域生态环境质量,其具体分级标准见表2㊂2.2 研究方法2.2.1 生态质量模型(R S E I -2)的简介与构建 鉴于数据集中缺少2020年数据,本研究基于改进的遥感生态指数模型[10,28],选用表3中的5个指标在E N V I5.3中进行归一化处理㊂表2 生态系统质量分级T a b l e 2 E c o s y s t e m q u a l i t y c l a s s i f i c a t i o n 级别生态系统质量描述优E Q I ȡ75生态系统质量为优良55ɤE Q I <75生态系统质量良好中35ɤE Q I <55生态系统质量为中等水平低20ɤE Q I <35生态系统质量较低差E Q I <20生态系统质量较差表3 生态质量模型指标计算公式T a b l e 3 C a l c u l a t i o n f o r m u l a o f e c o l o g i c a l q u a l i t y mo d e l i n d e x 指标计算公式绿度(N D V I )N D V I =(ρN I R -ρr e d )/(ρN I R +ρr e d )湿度(W E T )W E T O L I =0.1511ρb l u e +0.1973ρg r e e n +0.3283ρr e d +0.3407ρN I R -0.7117ρS W I R 1-0.4559ρS W IR 2干度(N D B S I )I B I 1=2ρS W I R 2/(ρS W I R 1+ρN I R )- ρN I R /(ρr e d +ρN I R )+ρg r e e n /(ρS W I R 1+ρg r e e n ) I B I 2=2ρS W I R 2/(ρS W I R 1+ρN I R )+ ρN I R /(ρr e d +ρN I R )+ρg r e e n /(ρS W I R 1+ρg r e e n ) S I = (ρS W I R 1+ρr e d )-(ρb l u e +ρN I R ) / (ρS W I R 1+ρr e d )+(ρb l u e +ρN I R ) 热度(L S T )L S T=T / 1+(λT /ρ)l n ε -273.15生境指数(HQ I)HQ I =A HQ I ˑ(0.35ˑf o r e s t +0.21ˑG r a s s l a n d +0.28ˑw a t e r +0.11ˑC r o pl a n d +0.04ˑB u i l t +0.01ˑU n u s e d )/A r e a注:ρi 为各对应波段的地表反射率;T 为传感器处热度值;λ为热红外波段中心波长;ρ为常数;ε为地表比辐射率㊂632 水土保持通报 第43卷Copyright ©博看网. All Rights Reserved.并完成主成分分析(P C A ),构建出该年的生态环境质量数据,公式如下: R S E I -2=P C 1-P C 1m i nP C 1m a x -P C 1m i n(1) P C 1=P C A (N D V I ,W E T ,N D B S I ,L S T ,H Q I )(2)式中:R S E I -2为改进遥感生态指数;P C 1为第一主成分;P C 1m i n 为第一主成分的最小值;P C 1m a x 为最大值㊂2.2.2 T h e i l -S e n M e d i a n 与M a n n -K e n d a l l 分析 本研究利用T h e i l -S e n M e d i a n 方法进行生态环境质量(E E Q )变化趋势分析㊂T h e i l -S e n M e d i a n 分析又被称为S e n 斜率估计,该方法是一种稳健的非参数统计的趋势计算方法,常被用于长时间序列数据的趋势分析[36]㊂其公式如下:β=m e d i a n x j -x k j -k æèçöø÷(j =1,2 20;k =1,2 j -1)(3)式中:β为像元回归方程的斜率;x j 与x k 为第j 年与第k 年的E E Q 的平均值㊂显著性检验采取M a n n -K e n d a l l 检定法[37]㊂它是一种非参数的统计方法,可利用连续资料间的大小关系来鉴定E E Q 的变化趋势是否明显,可以处理序列中极值及资料缺漏的问题,其公式为:S =ðn -1i =1ðnj =i +1s g n (x j -x k ),s gn (x j -x k )=1 (x j -x k >0)0 (x j -x k =0)-1 (x j -x k <0)ìîíïïïï(4)式中:x j 为时间序列中第j 个数据值;n 为数据样本的长度,在本研究中为20;s g n 为符号函数㊂当n ȡ10时,M a n n -K e n d a l l 检验统计值S 近似正态分布且平均值为0,其变异系数为:v a r (S )=n (n -1)(2n +5)18(5)由Z 值来判断数据是否有显著性趋势,其公式为:Z =S -1v a r (S) (S >0)0(S >0)S +1v a r (S ) (S >0)ìîíïïïïïï(6)给定95%及99%定置信水平α,当|Z |>Z 1-α/2时,便可以认为其在该水平上有显著的变化趋势;当|Z |<Z 1-α/2时,可以认为其在该水平并无显著的变化趋势㊂2.2.3 相关性分析 本研究采用偏相关分析研究降水量㊁气温两个变量与E E Q 的相关关系㊂偏相关分析是指两个变量同时与第3个变量相关时,将第3个变量的影响剔除,而分析另两个变量之间相关程度的过程[38]㊂其公式为: r x y ,z =r x y -r x z -r y z(1-r 2x z)(1-r 2yz )(7)式中:x i 和y i 为第i 年的值;r x y 为变量x 和变量y 的相关关系㊂当r x y >0时,代表两个变量间存在正相关关系,当r x y <0时,代表量变量间存在负相关关系㊂显著性检验采用T 检验,其公式为:t =r ㊃n -k -21-r2(8)式中:r 为偏相关系数;n 为研究样本数;k 为可控变量个数;n -k -2为自由度㊂2.2.4 多元回归分析及残差分析 本研究构建基于E E Q ㊁降水㊁气温的多元线性回归模型,并剔除模型中气候因素的影像,由此用残差[32]来表征研究时段内气候变化以外的人类活动及土地利用的影响,其公式为:E E Q i d e =a P +b T +c E E Q c c =E E Q r e a -E E Q id e(9)式中:a ,b ,c 为模型参数;P ,T 分别代表降水量及气温;E E Q i d e 为基于所建立的多元线性回归模型而得到的仅有气候因素作用的E E Q 理想值;E E Q r e a 为数据的实际值;E E Q c c 为代表剔除气候因素的其他因素的值,即土地利用等人类活动因素,最后基于公式(3)得到其变化趋势㊂2.2.5 土地利用转移矩阵 本研究参照‘土地利用现状分类标准“(G B /T 21010-2017)将土地覆盖类型分为草地㊁林地㊁耕地㊁水体㊁建设用地和未利用地六大类㊂采用土地利用转移矩阵分析2001 2019年黄土高原土地利用类型的变化[39]㊂其数学表达形式为:U i j =U 11U 12U 1(n -1)U 1nU 21U 22 U 2(n -1)U 2n ︙︙︙︙︙U (n -1)n U (n -1)n U (n -1)(n -1)U (n -1)n U n 1U n 2U n (n -1)U n næèççççççöø÷÷÷÷÷÷(10)式中:U 为土地利用类型面积;U i j 为研究时段初期i 土地利用类型到研究时段末期转变成为j 土地利用类型的面积;n 为土地利用类型种类总数㊂为了直观表达研究时段内土地利用空间变化,采用A r c G I S 对数据进行叠加处理得到各土地间相互转化的空间分布图㊂732第3期张洵等:2001 2020年黄土高原生态环境质量对气候及土地利用变化的响应Copyright ©博看网. All Rights Reserved.3结果与分析3.1生态环境质量时空变化特征(1)在本文时间变化特征分析研究时段内,黄土高原年均E E Q的变化如图1所示㊂2001 2010年黄土高原年均E E Q呈现波动上升态势,其值变化介于0.4856~0.4979之间㊂2001,2005,2010年为较低值,2003年及2008年达到峰值;在2003 2005年及2008 2010年的变化幅度较大,出现了骤然降低的情况㊂2010 2020年黄土高原平均E E Q波动相较于2001 2010年而言较小,其值变化介于0.4803~ 0.4922之间㊂在2012年达到了峰值而2013年回落到低谷;其中2014 2017年持续走低而后呈现上升态势㊂总体而言2001 2020年黄土高原平均生态环境质量呈上升㊁下降㊁再上升的趋势㊂图12001 2020黄土高原生态环境质量(E E Q)变化趋势F i g.1V a r i a t i o n t r e n do f e c o l o g i c a l e n v i r o n m e n t q u a l i t y(E E Q)o nL o e s sP l a t e a u f r o m2001t o2020(2)空间分布及变化分析根据2000 2020年黄土高原E E Q时空变化(图2),对2001,2010及2020年E E Q按照生态系统质量分级㊂总体而言,黄土高原生态环境质量大部分区域为 一般 且较为稳定㊂由图2可知,E E Q为 差 的区域主要集中在库布齐沙漠及其西北部的荒漠地区;E E Q评价为 良 及以上的主要分布在黄河流域中下游㊁黄土高原东南区域;评价为 较差 的区域主要分布在山西太原和临汾㊁陕西西安㊁甘肃兰州㊁青海西宁及宁夏银川和固原等城市一带,与李冠稳等[5]研究一致㊂针对不同年份进行面积统计(表4)可知:在2001 2020年,E E Q评价为 差 的区域逐年降低,由2001年的2.03%降至2020年的1.41%;评价为 良 及以上的区域由2001年的13.84%升至2020年的16.55%;而评价为一般的区域占比最多且总体稳定,在78.15%~81.25%范围内波动变化㊂(3)趋势分析为了进一步研究黄土高原E E Q具体变化趋势,结合MK检验法针对2001 2010年及2010 2020年两个时间段内E E Q变化进行叠加分析,并将趋势分为5类㊂表42001 2020年黄土高原生态环境质量分类面积统计T a b l e4P i x e l s t a t i s t i c s o f e c o l o g i c a l e n v i r o n m e n t q u a l i t y c l a s s i f i c a t i o no nL o e s sP l a t e a u f r o m2001t o2020分类标准2001年面积/k m2比例/%2010年面积/k m2比例/%2020年面积/k m2比例/%差131602.03112271.7390821.41较差187522.89213113.28253193.90一般52758281.2551735879.6750747978.15良642569.906791910.467349411.32优255903.94315254.85339665.23在2001 2010年,变化较为显著的区域主要分布在黄土高原的中部及东南部区域(图3)㊂其中太行山脉与吕梁山脉中间一带,即山西高原中南部(太原 临汾 运城)沿线一带城市地区整体呈下降趋势,而城区周围生态环境质量显著改善;同时,陕西延安北部㊁西安西北部地区生态环境质量也呈明显改善状态,说明延安 退耕还草 退耕还林 等生态修复工程措施卓有成效[9];黄土高原西北部内蒙古自治区呼和浩特南部一带㊁陕北高原西北部及六盘山一带E E Q则呈下降趋势㊂832水土保持通报第43卷Copyright©博看网. All Rights Reserved.图22001 2020年黄土高原生态环境质量(E E Q)时空变化F i g.2T e m p o r a l a n d s p a t i a l c h a n g e s o f e c o l o g i c a l e n v i r o n m e n t q u a l i t y(E E Q)o nL o e s sP l a t e a u f r o m2001t o2020图32001 2020年黄土高原生态环境质量(E E Q)趋势分析F i g.3A n a l y s i s o n t r e n do f e c o l o g i c a l e n v i r o n m e n t q u a l i t y(E E Q)o nL o e s sP l a t e a u f r o m2001t o2020通过对该时间段内的变化趋势进行像元统计(表5)得知显著退化与轻微退化共占总面积的33.37%,基本不变及以上的区域占比达66.63%,其中显著改善的区域为12.21%,结果表明在此时间段内黄土高原大部分区域E E Q处于较为稳定的状态,但部分区域有恶化趋势㊂在2010 2020年,变化较为显著的区域从上个时间段的东南部向中东部地区偏移㊂其中山西东北部(太原 原平 五台山)地区整体呈显著下降趋势,由于山西大部分区域大气结构性污染问题突出㊁矿山开发破坏生态问题依旧存在,推进水生态保护和修复治理的力度还不够,致使生态环境保护形式严峻;河套平原后套㊁鄂尔多斯高原南部毛乌素沙地及陕西延安城区一带也呈下降趋势;甘肃陇中高原㊁鄂尔多斯高原中东部地区相较以往有显著改善,与现有研究结果吻合[34]㊂通过对该时段内的变化趋势进行像元统计(表5)可以得出,有26.11%的区域呈退化状态,相较于上个时间段减少了7.26%;基本不变及以上的区域占总面积的73.89%,其中基本不变的区域占比45.24%,相较以往增加了5.65%㊂结果表明该时间段内的E E Q相较以往得到932第3期张洵等:2001 2020年黄土高原生态环境质量对气候及土地利用变化的响应Copyright©博看网. All Rights Reserved.了改善并趋于稳定,这与李冠稳等人研究结果一致[5],北部部分区域下降的原因可能是由于生态恢复工程落实以来,大规模的人工造林增加了土壤水分的消耗[30],从而引起了一系列生态问题[8]㊂表52001 2020年黄土高原生态环境质量变化趋势面积统计T a b l e5P i x e l s t a t i s t i c s o f e c o l o g i c a l e n v i r o n m e n t q u a l i t y c h a n g e t r e n do nL o e s sP l a t e a u f r o m2001t o2020T h e i l-S e n斜率Z值变化类型2001 2010年面积/k m2比例/%2010 2020年面积/k m2比例/%<-0.001<-1.96显著退化6827910.52618849.53 <-0.001-1.96~1.96轻微退化14830722.8510764016.58 -0.001~0.001-1.96~1.96基本不变25692139.5929370445.24 >0.001-1.96~1.96轻微改善9626514.8312023718.52 >0.001>0.1.96显著改善7924212.216576110.133.2气候变化影响分析黄土高原地处干旱半干旱地区,降水量及气温的变化会直接影响地区蒸散量从而对E E Q产生间接影响,其中水分是限制区域生态系统发展的关键因素[8]㊂由图4可知,2000 2020年黄土高原年平均降水量为 先波动,后平稳 的状态,与3.1中E E Q的趋势类似,为了探两个气候因子的变化与E E Q之间的关系,分别对E E Q与降水量及气温的平均值进行相关分析(图4)㊂时间上,黄土高原地区的降水量与E E Q存在一定的正相关关系(rɤ0.4,p<0.1)㊂其中2001 2007年的E E Q与降水量存在显著的正相关关系(r=0.87,p<0.05),在此之后降水量与E E Q整体相关性下降,说明这一因子之外的扰动进一步加剧㊂在2010 2020年E E Q与气温呈一定的负相关关系(r= -0.57,p<0.1),相较过去2001 2010年(r=-0.17, p<0.1)相关性有所提高,说明气温这一因子的负驱动力相较过去的时间段有所提升㊂黄土高原地区地处干旱和半干旱区,常年受风蚀㊁水蚀显著影响,而气温会导致干旱进一步加剧,也会使土壤沙化严重,土壤水分和植被冠层水分的蒸散发增加,不利于生态环境质量的改善㊂总体而言,降水量对E E Q的影响要大于气温,这一结果与陈万旭等研究结果一致[6]㊂图42001 2020年黄土高原生态环境与气候变化相关分析F i g.4C o r r e l a t i o na n a l y s i s b e t w e e n e c o l o g i c a l e n v i r o n m e n t a n d c l i m a t e c h a n g e o nL o e s sP l a t e a u f r o m2001t o2020对研究区内E E Q与降水及气温进行多元回归分析,并进行p<0.05的显著性检验(图5)㊂在2001 2020年,降水量回归系数大部分区域为正值,对E E Q 主要为正面影响,其主要在内蒙古呼和浩特一带㊁山西大同 太原 运城城市带周边㊁陕西铜川以北㊁甘肃兰州分布,这些地区大多处于以草地为主的半干旱地带,当地植被及河网等生态系统受到降水量的制约,因此降水量对此地区的E E Q具有积极影响;同时,在黄土高原东南区域尤其是关中城市群一带人类活动密集区域降水量回归系数较小,这类地区建设用地覆盖多而植被覆盖较少,因此降水量E E Q的影响较少㊂巴彦淖尔市南部荒漠地区大部分为未利用地,植被覆盖极少,因此降雨量影响微弱,值得注意的是在青海一带的高海拔地区降水量有负面作用,其原因是降雨量增加对植植被的正面作用不及其对温度降低的影响[19]㊂气温回归系数于降水量而言总体较小,与降水量相反,该回归系数在大部分区域为负值,这是由于黄土高原大部分区域㊁蒸散发强[30],气温的升高会导致蒸发量的增加,引起地面干化抑制植被的生长[32],从而间接引起的E E Q的下降㊂而在内蒙古042水土保持通报第43卷Copyright©博看网. All Rights Reserved.呼和浩特市一带气温则有正面影响,这是由于该地区纬度及海拔较高,低气温会抑制植被的生长,导致生态环境质量下降,与上述降水量影响温度的原理类似㊂图5黄土高原生态环境与气候回归分析F i g.5M u l t i-r e g r e s s i o na n a l y s i s o n p a r t i a l c o r r e l a t i o nb e t w e e n e c o l o g i c a l e n v i r o n m e n t a n d c l i m a t e o nL o e s sP l a t e a u3.3土地利用对生态环境质量(E E Q)的影响分析(1)基于2001,2010及2019年的3期土地利用空间分布数据,处理分析得到2001 2010年及2010 2019两个时间段内黄土高原土地利用转移矩阵,结果具体见表6㊂由表6可知,2001 2010年黄土高原土地首要转化方向是草地,其主要来源是耕地与未利用地,分别为33679,9760k m2,占草地总面积的36.36%和10.60%;其次为林地,主要来源是草地,面积为7891k m2,占林地总面积的10.05%㊂该时段内还存在大量草地向耕地㊁耕地向建设用地的土地开发,分别为26427k m2与9760k m2㊂2010 2019年土地转化方向主要为草地及林地,其主要来源是耕地及草地,面积分别为24893,7106k m2,占各自总面积的7.80%和7.56%;同时,未利用地向草地的转化仍在持续,其面积达到了5574k m2㊂所有土地转化过程中耕地与草地相互转化的面积占比较大,这与已有的研究结果相符[9],其中建设用地主要由耕地及少量的草地转化而来,这些地区集中在黄土高原东南部;另一方面来说大量耕地而非林地或草地的转化对黄土高原植被的影响较少㊂表62001 2020年黄土高原土地利用类型转移矩阵T a b l e6T r a n s f e rm a t r i x o f l a n du s e t y p e s o nL o e s sP l a t e a u f r o m2001t o2020k m2土地利用类型2010年面积建设用地草地耕地林地水域未利用地总计积面年1 0 0 2建设用地822748486415538923草地10862839652642778913283990323688耕地532833679162808260665736205115林地2237391275784976083538水域9198328151689282250未利用地14397601980631708127246总计1489733128919152389014289821138650759土地利用类型2019年面积建设用地草地耕地林地水域未利用地总计积面年0 1 0 2建设用地147410130146014900草地9012955062356071061983961331232耕地301724893161846142342234191635林地257811264868455088920水域14111131302306282899未利用地10755472340431524221173总计1893232683818723095374312019265650759142第3期张洵等:2001 2020年黄土高原生态环境质量对气候及土地利用变化的响应Copyright©博看网. All Rights Reserved.(2)经过空间分析得出研究区域内土地利用转移空间分布特征(图6),结果如下:在2001 2010年,耕地向草地的转化分布在除了内蒙古自治区鄂尔多斯高原㊁宁夏北部及关中平原一带的大部分地区,未利用地向草地转化大部分主要呈块状分布在黄土高原西北地区鄂尔多斯高原,大量的草地恢复是维持当地生态环境稳定的重要驱动因素[9];草地向林地的转化主要分布在陕西延安及山西吕梁山一带,说明在该时间段初期延安退耕还林㊁还草项目有显著的效果;内蒙古作为中国荒漠化最严重的区域之一,草地存在部分向未利用地的退化现象㊂2010 2019年,黄土高原土地利用转化分布情况总体与2001 2010年相似,但转化面积有所减少㊂其中,山西大部分区域草地向林地的转化幅度减少,内蒙古自治区鄂尔多斯高原部分区域未利用地向草地转化覆盖范围有所缩小;关中平原等地区建设用地的转化相较于上个时间段而言大幅度减少,说明该地区建设用地的开发速度有所放缓㊂图62001 2010年,2010 2019年黄土高原土地利用转移空间分布F i g.6S p a t i a l d i s t r i b u t i o no f l a n du s e t r a n s f e r o nL o e s sP l a t e a u f r o m2001t o2010,a n d2010t o2019(3)为了进一步探究2001 2010年及2010 1019年两个时间段内黄土高原的土地转移对于生态环境质量的影响,针对不同土地转移变化于E E Q改善的程度进行像元统计,结果如下:2001 2010年,草地向林地转移的像元中,有60.81%呈改善趋势, 85.80%保持稳定并增长;未利用地向草地转移的像元中,有31.72%呈改善趋势,74.32%保持稳定并增长;耕地向草地转移的像元中,有22.17%呈改善趋势,65.67%保持稳定并增长;而在耕地向建设用地及草地向未利用地转移的两类变化中,两者E E Q均主要呈现退化趋势,分别占据了像元总数的51.63%, 41.57%㊂2010 2019年,草地向林地转移的像元中,有53.67%呈改善趋势,82.58%保持稳定并增长;未利用地向草地转移的像元中,有31.89%呈改善趋势, 66.56%保持稳定并增长;耕地向草地转移的像元中,有23.62%呈改善趋势,70.74%保持稳定并增长;与2001 2010年不同的是,在耕地向建设用地及草地向未利用地转移的两类变化中,二者E E Q的退化趋势得到了缓减,分别为44.08%,34.44%㊂综上所述,草地 林地的转化是当地E E Q改善的最主要的因素,其次分别为:未利用地 草地㊁耕地 草地㊂耕地 建设用地转移区域的E E Q在两个研究均呈明显的下降趋势,但有所缓解,与上个时间段相比减小幅度达到了14.62%,说明在2010 2019年的开发建设所造成的影响减弱,与前文的结果相符㊂(4)为了更好地评价气候变化外的土地利用等人类活动对E E Q的影响,针对E E Q及气候数据进行残差分析(图7)并针对残差趋势按照3.1中的结果进行分类㊂结果表明黄土高原在2001 2020年,山西临汾 运城城区一带㊁甘肃定西北部㊁延安市部分地区,残差呈现较为明显的抑制作用,这些地区城市群较为集中,尤其是山西一带耕地向建设用地的土地利用转变较大,工程建设等对当地生态环境产生了负面作用;而内蒙古鄂尔多斯西北部地区㊁内蒙古乌海市及陕西宝鸡一带则有明显的促进作用,一方面是当地生态修复类项目建设落实完善,另一方面是人类活动所造成的影响变小,如2010 2020年关中平原一带城建转化的放缓㊂针对残差趋势进行像元统计,有32%的地区残差呈现下降趋势㊁68%的地区呈现稳定或上升的趋势,由此说明目前土地利用等人类活动对于E E Q242水土保持通报第43卷Copyright©博看网. All Rights Reserved.。
植被类型对黄土高原土壤侵蚀的影响研究
植被类型对黄土高原土壤侵蚀的影响研究
沈玉芳;秦清军;吴永红
【期刊名称】《西北农业学报》
【年(卷),期】2003(012)003
【摘要】根据辛店沟1955~1959年坡面径流小区的观测资料,分析了不同植被(高粱豇豆、苜蓿、草木樨)被覆度对土壤侵蚀的影响,主要为被覆度(C)与侵蚀速率的关系.结果表明土壤侵蚀速率随被覆度的增加呈指数下降.不同植被对土壤侵蚀速率的影响不同,应用USLE(The Universal Slii Loess Equation)分别模拟了3种不同植被被覆度对土壤侵蚀的关系方程,探讨了植被被覆度对土壤侵蚀的作用规律.【总页数】4页(P5-8)
【作者】沈玉芳;秦清军;吴永红
【作者单位】西北农林科技大学资源环境学院,陕西,杨凌,712100;西北农林科技大学资源环境学院,陕西,杨凌,712100;西北农林科技大学资源环境学院,陕西,杨
凌,712100
【正文语种】中文
【中图分类】S171.4
【相关文献】
1.黄土高原水-土-植被系统土壤侵蚀模型研究 [J], 汪明霞;程林;王卫东
2.黄土高原坡沟系统植被格局对土壤侵蚀影响研究进展 [J], 朱冰冰;霍云霈;周正朝
3.黄土高原小流域植被恢复的土壤侵蚀效应评估 [J], 赵文启;刘宇;罗明良;汪亚峰;
吕一河
4.黄土高原不同植被类型与降水因子对土壤侵蚀的影响研究 [J], 沈玉芳;高明霞;吴永红
5.黄土高原土壤侵蚀特点与植被对土壤侵蚀影响的研究 [J], 周佩华;刘炳武;王占礼;郑世清
因版权原因,仅展示原文概要,查看原文内容请购买。
黄土高原典型植被恢复过程土壤与叶片生态化学计量特征
黄土高原典型植被恢复过程土壤与叶片生态化学计量特征高德新;张伟;任成杰;戴银月;乔文静;陈正兴;杨改河;韩新辉【摘要】为揭示黄土高原典型人工植被恢复过程中植物叶片与土壤碳(C)、氮(N)、磷(P)元素变化特征及其交互作用,以延安庙咀沟流域恢复20-40a的刺槐(Robinia pseudoacacia)、柠条(Caragana korshinskii)、草地和坡耕地(对照)为研究对象,分析了各样地植物叶片和土壤C、N、P化学计量的变化特征及相互关系.结果表明:从20a到40a的恢复过程中,3种植被叶片C含量均显著增加,草地叶片P含量显著升高,而刺槐、柠条叶片N和P含量则显著降低.刺槐、柠条及草地土壤C、N、P含量随着恢复年限的延长而增加,比耕地分别增加了70%-349%、27%-202%、13%-62% (P<0.05),其中刺槐的增幅最大.从增速来看,刺槐和柠条林土壤表层C、N增速表现为前期(0-20a)大于后期(20-40a),而草地则相反.在20-40a的恢复过程中,刺槐、柠条叶片C∶N、C∶P均显著增加,草地叶片C∶P、N∶P则显著降低.恢复过程中,土壤C∶P在刺槐和草地中显著增加,而土壤N∶P仅在草地中显著增加,土壤C∶N则没有显著变化.相关性分析显示叶片C和土壤C、N、P显著正相关,叶片N、P和土壤N显著正相关,叶片和土壤N∶P显著正相关,叶片P、C∶P与土壤C、N增速显著相关,表明叶片P可以指示土壤C、N增速的变化,而N∶P可以将植物和土壤联系起来.植被恢复过程中,叶片和土壤C、N、P含量及增速均发生显著变化,且存在密切的联系,这种变化的趋势在刺槐、柠条和草地中有所不同.【期刊名称】《生态学报》【年(卷),期】2019(039)010【总页数】9页(P3622-3630)【关键词】黄土高原;生态化学计量;植被恢复;土壤;叶片;碳氮磷【作者】高德新;张伟;任成杰;戴银月;乔文静;陈正兴;杨改河;韩新辉【作者单位】西北农林科技大学农学院,杨凌712100;陕西省循环农业工程技术研究中心,杨凌712100;西北农林科技大学农学院,杨凌712100;陕西省循环农业工程技术研究中心,杨凌712100;西北农林科技大学农学院,杨凌712100;陕西省循环农业工程技术研究中心,杨凌712100;西北农林科技大学农学院,杨凌712100;陕西省循环农业工程技术研究中心,杨凌712100;西北农林科技大学农学院,杨凌712100;陕西省循环农业工程技术研究中心,杨凌712100;西北农林科技大学农学院,杨凌712100;陕西省循环农业工程技术研究中心,杨凌712100;西北农林科技大学农学院,杨凌712100;陕西省循环农业工程技术研究中心,杨凌712100;西北农林科技大学农学院,杨凌712100;陕西省循环农业工程技术研究中心,杨凌712100【正文语种】中文碳(C)氮(N)磷(P)是植物营养和土壤肥力的核心组成元素[1],植物吸收养分同时以凋落物形式向土壤归还养分,使得土壤和植物不断进行着C、N、P转化与累积的循环过程,从而促进陆地植被生态系统的演化与恢复[2]。
黄土高原与安塞县植被变化及其气候响应特征

黄土高原与安塞县植被变化及其气候响应特征韩新辉;杨改河;刘志超【期刊名称】《西北植物学报》【年(卷),期】2009(29)3【摘要】利用1982~2003年黄土高原和安塞县归一化植被指数(NDVI)及安塞县气候资料,分析了黄土高原不同尺度范围植被的时间变异特征及其对安塞县气候变化的可能影响.结果表明:(1)22年间黄土高原植被NDVI以年均7.0×10⁻⁴增加,且春秋植被NDVI增加显著,表明黄土高原植被覆盖状况明显改善.(2)安塞县植被NDVI并未呈现显著增加趋势,且植被NDVI比黄土高原整体水平低22.93%,使得安塞县气候对黄土高原植被变化有显著的响应变化.(3)当黄土高原年际和春季植被NDVI每增加0.01,安塞县最高和最低气温分别增加0.42℃和0.26℃;生长季植被决定了黄土高原整体植被的分布,当其植被NDVI每增加0.01时,安塞县年均相对湿度增加1.14%,蒸发量和风速分别下降49.70 mm和0.06 m*s-1.可见黄土高原植被恢复对其所含县域尺度区域的气候有明显影响.【总页数】8页(P593-600)【作者】韩新辉;杨改河;刘志超【作者单位】西北农林科技大学,资源环境学院,陕西杨陵,712100;陕西省循环农业工程技术研究中心,陕西杨陵,712100;西北农林科技大学,资源环境学院,陕西杨陵,712100;陕西省循环农业工程技术研究中心,陕西杨陵,712100;延安市气象局,陕西延安,716000【正文语种】中文【中图分类】Q948.1【相关文献】1.陇东黄土高原冬小麦生长对气候变暖的响应特征 [J], 王位泰;黄斌;张天锋;王润元;薛景轩;王灵梅;王琴2.气候和人类因素在黄土高原西北部植被变化中的贡献率研究 [J], 孙建国;张卓;韩惠;颜长珍3.气候和植被变化对黄土高原蒸散发的影响 [J], 杨洁;裴婷婷4.黄土高原中部麻栎宽度年表的气候响应特征初探 [J], 史雯欣;崔琳琳;宋慧明;罗科资;王延丽;何玉珂;刘禹5.黄土高原地区植被变化及其对极端气候的响应 [J], 韩丹丹;穆兴民;高鹏;赵广举;孙文义;田鹏因版权原因,仅展示原文概要,查看原文内容请购买。
黄土高原吕二沟流域土地利用_覆被和气候变化对径流泥沙的影响_邓文平
使泥沙量减少 1. 38 万 t, 而气候变化使泥沙量减少 0. 81 万 t。( 3) 在显著变化期 内, 径 流的减少气 候因素的 贡献率为
65. 57% , 而土地利用的 贡献率为 34. 43% ; 人 类活动 使泥 沙量 减 少 4. 80 万 t , 而气 候变 化使 泥沙 量减 少 4. 37 万 t。
m3 , 万 t) ; R1 基准期平均年径流、年输沙量( 万 m3 ,
不同时期的径流量和输沙量的变化, 以及不同时 期土地利用和气候变化对 流域径流泥 沙的贡献。结 果表明: ( 1) 径流
泥沙 在非显著变化期内的减少量和幅度均小于其在显著变化期。( 2) 在非 显著变化期 内, 径 流的减少, 气候 因素的贡
献率 为 40. 98% , 而土地利用的贡献率为 59. 01% , 即流域土地利用变化是导致流域径流量减少的主要原因; 二沟流域土地利用/ 覆被和气候变化对径流泥沙的影响
黄土高原水蚀风蚀交错区植被恢复中土壤水分变化
黄土高原水蚀风蚀交错区植被恢复中土壤水分变化王亚飞;樊军;贾沐霖【期刊名称】《草地学报》【年(卷),期】2016(024)002【摘要】针对黄土高原生态恢复与重建过程中水资源短缺问题,本文采用空间代替时间序列的方法对地处黄土高原水蚀风蚀交错区的六道沟小流域在植被恢复过程中的土壤储水量和土壤垂直剖面含水量特征进行了研究,分析了紫花苜蓿地(12,15,17,21,26,41 a)、荒草地(15,32,41 a)、弃耕地(12,21,41 a)、杏树地(14 a)的土壤储水量和土壤垂直剖面含水量特征.结果表明:4种植被恢复方式下,土壤储水量的大小顺序为弃耕地>荒草地>杏树地>苜蓿地;苜蓿地、弃耕地0~200 cm储水量随着生长年限的延长先快速增加后缓慢减少,而荒草地的储水量随着生长年限的延长却持续减少.水蚀风蚀交错区植被恢复过程中,植被恢复方式是该地区土壤水分变化的主要影响因素,生长年限对土壤水分动态变化影响不明显.【总页数】7页(P344-350)【作者】王亚飞;樊军;贾沐霖【作者单位】中国科学院水利部水土保持研究所黄土高原土壤侵蚀与旱地农业国家重点实验室,陕西杨凌712100;中国科学院大学,北京100049;中国科学院水利部水土保持研究所黄土高原土壤侵蚀与旱地农业国家重点实验室,陕西杨凌712100;西北农林科技大学水土保持研究所,陕西杨凌712100;西北农林科技大学水土保持研究所,陕西杨凌712100【正文语种】中文【中图分类】S159【相关文献】1.黄土高原水蚀风蚀交错带沟岸灌木林地土壤水分变化 [J], 霍竹;邵明安2.黄土高原水蚀风蚀交错区不同下垫面土壤水蚀特征实验研究 [J], 张丽萍;倪含斌;吴希媛3.黄土高原水蚀风蚀交错区退耕还林工程前后NDVI时空变化特征 [J], 杨灿;魏天兴;李亦然;郑粮;陈宇轩4.黄土高原水蚀风蚀交错带煤田开发区小流域植被恢复模式 [J], 王力;张青峰;卫三平;王全九5.黄土高原水蚀风蚀交错区沙地枯落物的水源涵养功能 [J], 王盛琦;傅文慧;寇建村;白玛嘎翁;乔千洛;杨文权因版权原因,仅展示原文概要,查看原文内容请购买。
黄土高原植被固土减蚀作用研究进展
黄土高原植被固土减蚀作用研究进展
肖培青;姚文艺;张海峰
【期刊名称】《水土保持研究》
【年(卷),期】2012(19)6
【摘要】植被是控制和减弱水土流失的有效措施,具有保持水土的作用,在黄土高原生态环境建设中具有不可替代的作用。
在系统分析黄土高原植被减水减沙作用研究现状的基础上,概述了植被改善土壤特性、植被与土壤抗冲性、植被与土壤抗剪强度、植被减蚀作用的动力学机理等方面的最新研究进展,并针对目前存在的问题以及今后有待深入研究的问题进行了探讨。
该研究对于揭示植被固土减蚀作用的机理,为生态修复工程建设提供科学依据,具有一定的意义。
【总页数】5页(P282-286)
【关键词】植被;水土流失;黄土高原
【作者】肖培青;姚文艺;张海峰
【作者单位】黄河水利科学研究院水利部黄土高原水土流失过程与控制重点实验室;中国海洋大学信息学院海洋信息与技术教育部工程中心
【正文语种】中文
【中图分类】S157
【相关文献】
1.黄土丘陵沟壑区坡面固土防蚀植被重建技术研究 [J], 闫占卿;郭爱军;洪海泉
2.黄土高原现状梯田和林草植被的减沙作用分析 [J], 刘晓燕;杨胜天;王富贵;何兴
照;马红斌;罗娅
3.小湾水电工程弃渣场植被减蚀作用分析 [J], 何辉;杨加友
4.黄土高原两个乔木树种根系固土作用初探 [J], 尹怀吉;赵廷宁
5.植被固土减蚀作用的力学效应 [J], 肖培青;姚文艺;刘希胜;申震洲
因版权原因,仅展示原文概要,查看原文内容请购买。
陕西省黄土高原地区侵蚀性降水变化特征
陕西省黄土高原地区侵蚀性降水变化特征
孙智辉;刘志超;曹雪梅;雷延鹏
【期刊名称】《水土保持通报》
【年(卷),期】2010(30)4
【摘要】利用陕西省黄土高原地区42个站点的逐日降水观测资料,分析了1961—2007年该地区的年降水量、侵蚀性降水量、暴雨量的变化趋势和空间分布特征。
研究表明,陕西省黄土高原地区年降水量、侵蚀性降水和暴雨的空间分布非常相似,具有北少南多的分布特征。
1961—2007年陕西省黄土高原年降水和侵蚀性降水呈下降趋势,暴雨呈上升趋势。
在空间分布上,延安市以北地区,降水量减少幅度小,延安市以南地区降水量减少明显;渭北地区暴雨量增加,而丘陵沟壑区暴雨量则呈减少趋势。
【总页数】6页(P36-39)
【关键词】陕西省黄土高原;侵蚀性降水;暴雨量;时空变化
【作者】孙智辉;刘志超;曹雪梅;雷延鹏
【作者单位】延安市气象局
【正文语种】中文
【中图分类】P426.615;S157
【相关文献】
1.近50年黄土高原地区降水时空变化特征 [J], 王麒翔;范晓辉;王孟本
2.长武黄土高塬沟壑区降水及侵蚀性降雨特征 [J], 陈杰;刘文兆;王文龙;李志
3.近50年黄土高原侵蚀性降水的时空变化特征 [J], 信忠保;许炯心;马元旭
4.陕北黄土高原地区降水时空变化特征 [J], 王涛;于冬雪;杨强
5.1965-2013年黄土高原地区极端降水事件时空变化特征 [J], 赵安周;朱秀芳;潘耀忠
因版权原因,仅展示原文概要,查看原文内容请购买。
黄土高原不同退耕年限刺槐林地土壤侵蚀阻力
黄土高原不同退耕年限刺槐林地土壤侵蚀阻力孙龙;张光辉;王兵;栾莉莉【期刊名称】《农业工程学报》【年(卷),期】2017(033)010【摘要】Plant litter has been accumulated greatly along with vegetation restoration on the Loess Plateau. Besides covering soil surface, plant litter can be incorporated into topsoil under natural circumstances by soil splash, sediment deposition, and soil-dwelling animal activities. The distribution (covering soil surface or incorporated into surface soil) and the decomposition of plant litter can modify soil physical properties (including soil detachment capacity and soil erosion resistance) which are closely related to soil detachment process by overland flow. This study was conducted to investigate the effect of vegetation restoration on soil detachment process for black locust (Robinia pseudoacacia L.) stand with different ages of returning farmland on the Loess Plateau. The experiments were performed in the Zhifanggou small watershed (36°46'28"-36°46'42"N, 109°13'46"-109°16'03"E) in August, 2015. After a complete watershed survey, altogether 6 sampling sites were selected, including 1 corn (Zea mays L.) field and 5 black locust stands of 10, 15, 20, 30, and 40 years. Soil samples were collected from the top 5 cm soil layer using a circular steel ring with 10.0 cm diameter and 5.0 cm depth. Soil detachment was measured in a 4.0 m long, 0.35 m wide flume. Prior to the test of soildetachment capacity, soil samples were saturated in a container for 8 h and drained for 12 h. Then the soil samples were inserted into a hole (0.5 m away from the outlet of flume) on the flume bed and were scoured by flowing water under designed flow shear stress. A total of 180 soil samples were collected from different aged black locust stands and scoured under 6 flow shear stresses. In this study, 6 combinations of flow rates and slopes were applied to obtain 6 different flow shear stresses (5.4-17.4Pa) with similar intervals. Rill erodibility is defined as the increase in soil detachment capacity per unit increase in flow shear stress. Critical shear stress is a threshold parameter defined as the value above which a rapid increase in soil detachment capacity per unit increase in shear stress occurs. When the measured detachment capacity was plotted against the flow shear stress, rill erodibility and critical shear stress could be determined from the slope of the fitted straight line and its intercept on the X axis. The results showed that the density of plant litter in 0-5 cm surface soil was 0.07, 0.18, 0.32, 0.29 and 0.17 kg/m2 for 10, 15, 20, 30, and 40-year-old black locust stands, respectively, with the mean value of 0.20 kg/m2. The 40-year-old black locust stands had more capillary porosities, soil organic matter, and water stable aggregates, and smaller soil bulk density. Soil detachment capacity decreased by 49.8%, 73.9%, 85.0%, 86.0%, and 87.0% for 10, 15, 20, 30, and 40-year-old black locust stands, respectively, compared to the control. The soil detachment capacity decreased significantly over time as an exponential function (R2=0.97, P=0.006). The control (corn field) had the biggest rill erodibility (0.29 s/m), and the 40-year-old black locust stand had the smallest rill erodibility (0.04 s/m). Compared to the control, the rill erodibility for 40-year-old black locust stand was reduced by 86.3%. The black locust stand with 20 years had the biggest critical shear stress (4.78 Pa), and the control had the smallest critical shear stress (4.15 Pa). The critical shear stress increased by 10.1% for 40-year-old black locust stand compared to the control. The critical shear stress increased significantly with litter density as a linear function (R2=0.67, P=0.046). Rill erodibility was better than critical shear stress in the respect of reflecting the variation of soil detachment. The soil-plant litter system has a larger erosion resistance to flowing water than the control. Importantly, the soil-root system may have a larger structural stability and erosion resistance to flowing water than soil-plant litter system.%为了明确黄土高原植被恢复后不断蓄积的枯落物对土壤分离过程的影响,论文选取10、15、20、30、40a退耕年限刺槐林样地及对照样地,采集180个土壤样品用于土壤分离试验,在6组侵蚀动力条件下进行变坡水槽冲刷试验,结果表明:随着退耕年限的增大,刺槐林土壤结构趋于稳定且疏松多孔,40年刺槐林地与对照样地相比:容重降低12.9%、总孔隙度增加10.1%、毛管孔隙度增加62.4%,土壤有机质含量增加97.9%、水稳性团聚体增加112.3%.土壤分离能力均值随着林龄呈指数函数递减(R2=0.82、P<0.05).在退耕0~40年范围内,在0~15 a内土壤分离能力下降迅速,对照、10 a刺槐林地、15年刺槐林地之间的土壤分离能力差异显著(P<0.05),退耕15 a以后土壤分离能力趋于稳定.40 a林龄刺槐林细沟可蚀性比对照的细沟可蚀性降低86.3%,临界剪切力提高10.1%.土壤临界剪切力变化范围在4.15~4.78 Pa之间.细沟可蚀性的变化趋势与土壤分离能力变化趋势相似,相比临界剪切力的变化,细沟可蚀性的变化更能反映土壤分离能力的变化情况.【总页数】7页(P191-197)【作者】孙龙;张光辉;王兵;栾莉莉【作者单位】中国科学院水利部水土保持研究所/黄土高原土壤侵蚀与旱地农业国家重点实验室,杨凌 712100;中国科学院生态环境研究中心/城市与区域生态国家重点实验室,北京 100085;中国科学院水利部水土保持研究所/黄土高原土壤侵蚀与旱地农业国家重点实验室,杨凌 712100;北京师范大学地理学与遥感科学学院,北京100875;西北农林科技大学水土保持研究所/黄土高原土壤侵蚀与旱地农业国家重点实验室,杨凌 712100;北京师范大学地理学与遥感科学学院,北京 100875【正文语种】中文【中图分类】S157.1【相关文献】1.黄土丘陵区不同恢复年限退耕林地土壤碳氮差异及其影响因素 [J], 吴建平;韩新辉;任成杰;杨改河;任广鑫2.黄土高原残塬沟壑区坡地刺槐不同皆伐更新幼林地土壤水分动态 [J], 刘增文;余清珠3.晋南丘陵沟壑区不同退耕年限刺槐林土壤养分含量变化 [J], 郝小玲;周佳佳;张咪咪;吴洁;张粉果;王永吉4.黄土丘陵沟壑区不同退耕年限刺槐林地土壤氮素动态特征 [J], 邓娜;王红雷;胡澍;吴多洋;寇萌;焦菊英5.黄土高原不同年限刺槐土壤化学计量特征分析 [J], 任璐璐;张炳学;韩凤朋;张兴昌因版权原因,仅展示原文概要,查看原文内容请购买。
黄土区浅沟侵蚀影响因素对其侵蚀速率影响的模拟试验-水土保持研究
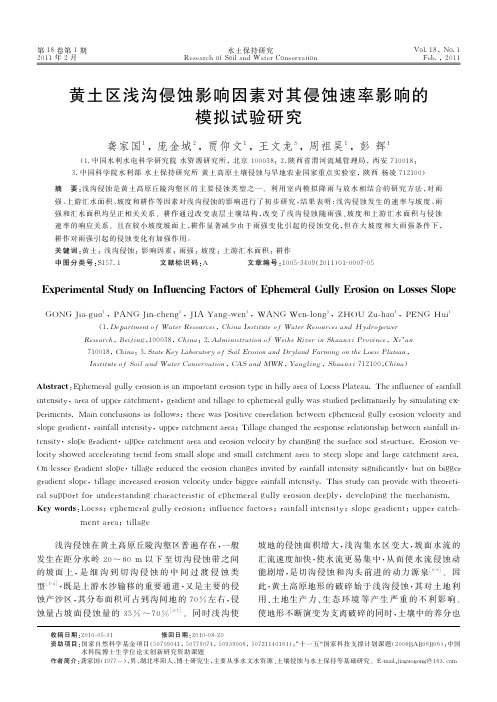
其 中 :Ⅰ ——— 细 沟 ;Ⅱ ——— 浅 沟 ;Ⅲ ——— 切 沟 。
图 1 黄 土 高 原 丘 陵 沟 壑 区 典 型 坡 面 侵 蚀 图
1 材料与试验设计
影 响 浅 沟 侵 蚀 的 因 素 有 许 多 ,包 括 雨 型 、雨 强 、下 垫面覆被状况、土 壤 类 型、坡 度、坡 形、坡 长 及 田 间 管 理措施等。本 研 究 用 典 型 的 黄 土 丘 陵 沟 壑 区———安 塞 黄 绵 土 作 为 侵 蚀 对 象 ,重 点 模 拟 研 究 雨 强 、坡 度 、坡 长 、汇 水 面 积 、耕 作 等 浅 沟 侵 蚀 速 率 的 影 响 。
史得出推算坡面浅沟年均侵蚀量的计算式。唐克丽 等[14]以考察资 料 结 合 定 位 观 测 与 模 拟 降 雨 试 验,对 黄土丘陵区退耕上限坡 度 进 行 了 论 证。 武 敏 等 通 [15] 过 室 内 试 验 定 量 研 究 了 不 同 含 沙 水 流 、不 同 降 雨 条 件 下坡面汇水汇沙对浅沟 侵 蚀 过 程 的 影 响。龚 家 国 等[16]通过野外放水冲刷试验 对 浅 沟 水 流 的 流 态 及 其 水动力学特性进行了研究。
水土保持研究 Research of Soil and Water Conservation
Vol.18,No.1 Feb.,2011
黄土区浅沟侵蚀影响因素对其侵蚀速率影响的
模拟试验研究
龚家国1,庞金城2,贾仰文1,王文龙3,周祖昊1,彭 辉1
(1.中国水利水电科学研究院 水资源研究所,北京 100038;2.陕西省渭河流域管理局,西安 710018; 3.中国科学院水利部 水土保持研究所 黄土高原土壤侵蚀与旱地农业国家重点实验室,陕西 杨凌712100)
locity showed accelerating trend from small slope and small catchment area to steep slope and large catchment area. On lesser gradient slope,tillage reduced the erosion changes invited by rainfall intensity significantly,but on bigger gradient slope,tillage increased erosion velocity under bigger rainfall intensity.This study can provide with theoreti- cal support for understanding characteristic of ephemeral gully erosion deeply,developing the mechanism. Key words:Loess;ephemeral gully erosion;influence factors;rainfall intensity;slope gradient;upper catch-
- 1、下载文档前请自行甄别文档内容的完整性,平台不提供额外的编辑、内容补充、找答案等附加服务。
- 2、"仅部分预览"的文档,不可在线预览部分如存在完整性等问题,可反馈申请退款(可完整预览的文档不适用该条件!)。
- 3、如文档侵犯您的权益,请联系客服反馈,我们会尽快为您处理(人工客服工作时间:9:00-18:30)。
J. Geogr. Sci. 2013, 23(6): 1091-1106DOI: 10.1007/s11442-013-1065-z© 2013 Science Press Springer-VerlagSoil erosion and its response to the changes of precipitation and vegetation cover on the Loess PlateauSUN Wenyi1,2, *SHAO Quanqin1, LIU Jiyuan11. Institute of Geographic Sciences and Natural Resources Research, CAS, Beijing 100101, China;2. University of Chinese Academy of Sciences, Beijing 100049, ChinaAbstract: Soil erosion is a major threat to our terrestrial ecosystems and an important global environmental problem. The Loess Plateau in China is one of the regions that suffered more severe soil erosion and undergoing climate warming and drying in the past decades. The vegetation restoration named Grain-to-Green Program has now been operating for more than 10 years. It is necessary to assess the variation of soil erosion and the response of precipita-tion and vegetation restoration to soil erosion on the Loess Plateau. In the study, the Revised Universal Soil Loss Equation (RUSLE) was applied to evaluate annual soil loss caused by water erosion. The results showed as follows. The soil erosion on the Loess Plateau between 2000 and 2010 averaged for 15.2 t hm-2 a-1 and was characterized as light for the value less than 25 t hm-2 a-1. The severe soil erosion higher than 25 t hm-2 a-1 was mainly distributed in the gully and hilly regions in the central, southwestern, and some scattered areas of earth-rocky mountainous areas on the Loess Plateau. The soil erosion on the Loess Plateau showed a deceasing trend in recent decade and reduced more at rates more than 1 t hm-2 a-1 in the areas suffering severe soil loss. Benefited from the improved vegetation cover and ecological construction, the soil erosion on the Loess Plateau was significantly declined, es-pecially in the east of Yulin, most parts of Yan’an prefectures in Shaanxi Province, and the west of Luliang and Linfen prefectures in Shanxi Province in the hilly and gully regions. The variation of vegetation cover responding to soil erosion in these areas showed the relatively higher contribution than the precipitation. However, most areas in Qingyang and Dingxi pre-fectures in Gansu Province and Guyuan in Ningxia Hui Autonomous Region were predomi-nantly related to precipitation.Keywords: soil erosion; assessment; precipitation; vegetation cover; Loess Plateau1 IntroductionSoil erosion is widespread and a major environmental threat to our terrestrial ecosystems Received: 2013-01-10 Accepted: 2013-04-02Foundation: Ecological environment investigation and assessment in ten years in the zone of major ecological protection and construction, No.STSN-14-00; China Global Research Program, No.2010CB950902Author: Sun Wenyi, Ph.D, specialized in GIS and ecological information. E-mail: sunwy@*Corresponding author: Shao Quanqin, Professor, E-mail: shaoqq@ /content/1009-637X1092 Journal of Geographical Sciences (Belyaev et al., 2005; Singer and Warkentin, 1996). The Chinese Loess Plateau is one of the most severely eroded regions in the world (Liu and Liu, 2010; Ritsema, 2003; Zheng et al., 2005). Severe soil erosion had not only led to the impoverishment of cultivated land causing poverty of local people, but also to desertification that destroys land conditions crucial for human survival.The change of soil erosion was related to precipitation, soil properties, topography and land cover change. Among these factors, soil and topography, generally speaking, are rela-tively stable and change little. Therefore, the variation of soil erosion was mainly driven by the changes of precipitation and vegetation cover, which could retard or accelerate the proc-ess of soil erosion (Alatorre et al., 2012; Mohammad and Adam, 2010; Sharma et al., 2011; Zhu and Zhu, 2012). The precipitation is important for determining the severity of soil and water loss. Rainfall with low intensity mostly cannot produce severe soil erosion, even if experiencing high frequencies (Asselman et al., 2003). The variation of precipitation will also influence soil water content, which then influences the dynamics of vegetation devel-opment and succession under different land uses, and thus eventually decreases or acceler-ates erosion (Hou et al., 1996). Vegetation restoration can also improve the effectiveness of land cover and reduce susceptibility to soil erosion (Ritsema, 2003). The relationships be-tween precipitation, vegetation and erosion become uncertain and complex due to their in-teractions. To some extent, positive or negative correlation between precipitation and ero-sion mainly depends on the condition of vegetation cover (Wei et al., 2010; Xu, 2005). Sev-eral studies under different environmental conditions have demonstrated the positive effect of vegetation cover in reducing the water erosion (Mohammad and Adam, 2010; Nunes et al., 2011), and its negative effect for loss of vegetative cover as a result of human activities leading to increment of the risk of runoff and soil erosion (Asselman et al., 2003; Vásquez-Méndez et al., 2010).In the last 50 years, the climate of Loess Plateau had an obvious tendency of warming and drying (Liu et al., 2006; Xin et al., 2008; Yao et al., 2005). There is a common sense that decreased rainfall would reduce the region's rainfall erosivity and eventually lower the soil loss. However, it may also theoretically lower the density of vegetation cover for lacking of enough water in the arid and semi-arid areas, causing the erosion increment. Since 1998, the Chinese government had launched the Grain-to-Green Program, which has been mainly di-rected to soil and water conservation on the Loess Plateau. Many infrastructure reforms and ecological projects were undertaken including construction of large reservoirs and silt dams, afforestation, and converting cropland on steep slopes to forest and grassland (Chen et al., 2010; Gao et al., 2010; Xin et al., 2008). Positive effects have been achieved through the recovery of the natural vegetation (Fu et al., 2011).Some studies have revealed that the runoff and sediment from the Loess Plateau to the Yellow River had decreased significantly in recent decades, which was closely related to the soil erosion condition on the Loess Plateau (Kang et al., 2001; Wang et al., 2007). On the one hand, the decreased trend of runoff and sediment was attributed to the climate changes as the annual precipitation decreased slightly while the annual temperature and evaporation increased significantly (Wang et al., 2007; Zhang et al., 2008). On the other hand, more at-tention was paid to the vegetation restoration on the Loess Plateau since the implementation of the Grain-to-Green Program (Fu et al., 2011). Only a limited amount of research has beenSUN Wenyi et al .: Soil erosion and its response to the changes of precipitation and vegetation cover1093undertaken on the effects of climate change on soil erosion and how this might relate to hu-man modification of vegetation cover initiated by policies such as the Grain-to-Green Pro-gram. The program has now been operating for more than 10 years under the warming and drying climate. However, little knowledge about ecological effect of vegetation recovery on the soil erosion has been reported.Therefore, in this study, we quantitatively assessed the impacts of vegetation cover and precipitation change on the soil erosion on the Loess Plateau. This assessment is required for scientific support for ongoing implementation and evaluation of ecological construction and environmental management programs.2 Study area and methods2.1 Description of study areaThe Loess Plateau region (Figure 1), located in the upper and middle reaches of the Yellow River Basin, northwestern China, lies between longitudes 100°54′–114°33′E and latitudes 33°43′–41°16′N, covering an area of more than 620,000 km 2, 6.5% of the area of China. It extends to Yinshan Mountains in the north, Qinling Mountains in the south, Wuqiaol-ing-Riyue Mountains in the west and Taihang Mountains in the east. It has very complex topography, including sub-plateaus, basins, hills and gullies, with elevation ranging from 100 to 5000 m. Most of the Plateau has sub-humid and semi-arid climates with an average annual temperature of 4.3℃ in the northwest and 14.3℃ in the southeast (Li et al ., 2012). Average annual precipitation ranges from 150 mm in the northwest to 750 mm in the south-east and mostly falls as high intensity rainstorms between June and September (Li et al .,Figure 1 Location of the Loess Plateau, China1094Journal of Geographical Sciences2009). The Plateau surface is covered by highly erodible loess layers averaging 100 m deep and soil types in most parts are typical loess and clayey loess (Liu, 1964). Natural vegetation types vary from arid desert, to steppe and then to broad-leaved deciduous forest in the direc-tion from northwest to southeast (Yang and Yuan, 1991). The major crops are wheat, corn, millet, sorghum, soybean, and buckwheat.The natural vegetation on the Loess Plateau has been largely destroyed by deforestation and cultivation. The combined effects of frequent heavy rainfalls during summer, steep to-pography, low vegetation cover and highly erodible loess soil have made the Loess Plateau the most severely eroded areas in the world. A large amount of the eroded soil was trans-ported into the Yellow River, carrying an annual sediment load of 16.4×10⁹ t (Zhang and Liu, 2005). The severe soil erosion has had a significant impact on the ecological security of the Yellow River and on the ecological environment of the Loess Plateau. The Chinese gov-ernment has made great efforts to control soil erosion, an ecological restoration program, designated “Grain to Green” was initiated on the Loess Plateau.2.2 Method2.2.1 Revised Universal Soil Loss EquationThe Revised Universal Soil Loss Equation (RUSLE) represents how climate, soil, topog-raphic slope and slope length as well as vegetation cover affect soil erosion caused by rain-fall impact and surface runoff (Renard et al ., 1997). It has been extensively used to estimate soil erosion loss and to assess erosion risk. It is the statistical relationship model established and can be developed better according to the local conditions of these factors. It can be used on the Loess Plateau where water erosion is the dominant cause of soil loss (Fu et al ., 2011). The RUSLE equation is:A = R × K × L × S × C × P (1)where A is the amount of the average soil loss (t hm -2 a -1); R the rainfall erosivity factor (MJmm hm -2 h -1 a -1); K the soil erodibility factor (t hm 2 h hm -2 MJ -1 mm -1); L the slope length factor; S the slope factor; C the vegetation cover factor and P the erosion control practice factor. Factors C and P are dimensionless.Rainfall erosivity factor (R)The rainfall erosivity index (R) in RUSLE model is an index of rainfall erosivity which is the potential ability of the rain to cause erosion. It is the driving force of erosion, and has direct relationships with soil erosion (Angulo-Martinez and Begueria, 2009; Renard et al ., 1997). In this study, the annual rainfall erosivity was calculated using the method of Zhang et al . (2002), a method based on aggradations of half-month rainfall erosivity using daily rainfall data that has been widely used in China (Cheng et al ., 2009; Men et al ., 2008; Zhang, 2003). The annual rainfall erosivity was estimated as follows:1()ki j j M D βα==∑ (2)where M i is the half-month rainfall erosivity (MJ mm hm -2 h -1 a -1) and D j is the effective rainfall for day j in one half-month. D j is equal to the actual rainfall if the actual rainfall is larger than the threshold value of 12 mm, which is the standard for China’s erosive rainfall. Otherwise, D j is equal to zero (Xie et al ., 2000). The term k is the number of days in the half-month. The terms α and β are the undetermined parameters:SUN Wenyi et al .: Soil erosion and its response to the changes of precipitation and vegetation cover1095121218.17724.4550.8363d y P P β=++ (3) 7.189121.586αβ-= (4) where 12d P is the average daily rainfall that is more than 12 mm and 12y P is the yearly average rainfall for days with rainfall more than 12 mm.Soil erodibility factor (K)The soil erodibility represents both susceptibility of soil to erosion and the amount and rate of runoff, as measured under standard plot conditions (Parysow et al ., 2003). The K-factor is related to soil texture, organic matter content permeability, and other factors and is basically derived from the soil type (Wischmeier et al ., 1971). In this study the soil erodi-bility factor was determined using the EPIC equation (Williams et al ., 1984) as follows:0.3(1)0.20.3exp 0.0256SAN 100SIL SIL K CLA SIL ⎧⎫-⎡⎤⎛⎫=+⨯-⎨⎬ ⎪⎢⎥+⎣⎦⎝⎭⎩⎭ 0.250.71.0 1.00.1317exp(3.72 2.95)exp( 5.5122.9)C SNI C C SNI SNI ⎛⎫⎛⎫--⨯ ⎪⎪+-+-+⎝⎭⎝⎭(5) where SAN , SIL and CLA are the sand fraction (%), silt fraction (%), and clay fraction (%), respectively, C is the soil organic carbon content (%), and SNI is equal to 1-SAN/100. 0.1317 is the conversion factor from US customary units to SI units.Topographic factor (LS)The LS factor reflects the effect of slope length and the slope gradient on erosion (Lu et al ., 2004). A DEM-based procedure developed in USA (Hickey, 2000; Van Remortel et al ., 2001) was employed to resolve the difficulties for the estimation of the LS-factor on a re-gional scale. However, the LS factor algorithms was limited to slopes ≤18% because data used to develop RUSLE involved slopes up to 18% only (McCool et al ., 1989). Liu et al . (1994) fixed the formula using soil loss data from natural runoff plots ranging from 9% to 55% slopes and reported that soil loss was linearly related to the sine of the slope angle. Therefore, in this study the formula for L de fined and developed by McCool et al . (1987, 1997) and incorporation of the equations for slope gradient >18% formulated by Liu et al . (1994) was used:22.13m L γ⎛⎫= ⎪⎝⎭ 0.590.4930.3310.21m m m m θθθθ=⎧⎪=>⎪⎨=>⎪⎪=⎩≥≥≥≥ (6) S = 10.8sin 0.03,9%16.8sin 0.05,9%18%21.91sin 0.96,18%θθθθθθ+<⎧⎪-⎨⎪->⎩≤≤ (7) where γ is the slope length (m); m is a dimensionless constant depending on the percent slope (θ).Vegetation cover factor (C)Vegetation is the most sensitive factor influencing soil erosion and soil loss is1096Journal of Geographical Sciencessigni ficantly related to vegetation coverage (Renard et al ., 1997) in a negative exponential relationship, whose turning point is about 78.3% (Wang and Liu, 1999). Cai et al . (2000) developed a method for C factor estimation using vegetation cover based on simulated and natural rainfall on experimental plots. The formula is expressed as:100.65080.3436lg 078.3%078.3%f C f f f =⎧⎪=-<⎨⎪>⎩≤(8) Vegetation coverage (f) was calculated using NDVI, which can better characterize vege-tation cover. ()()soil max soil NDVI NDVI f NDVI NDVI -=- (9) where NDVI soil is NDVI value for pure bare soil pixel; NDVI max refers to NDVI value for regional pure vegetation pixel.Erosion control practice factor (P)The erosion control practice factor was considered the most difficult factor to determine and was the least reliable factor of the RUSLE input factors (Renard et al ., 1997). For this study, the erosion control practice factor (P) was roughly determined from the land use clas-sification map on the Loess Plateau (Liu et al ., 2005) (Table 1).Table 1 Values of the erosion control practice factor ( P) based on the land use map of the Loess Plateau, China Cropland Land useWoodland Grassland Flat Hills Mountains Steep slope( >25) Others P value1 1 0.20 0.350.65 0.80 12.2.2 Trend analysisThe annual variation trends for soil erosion, vegetation cover and precipitation during the years from 2000 to 2010 were calculated by the slope equation described below. The slope equation was estimated by fitting linear functions using ordinary least-squares regression. It indicated the strong or weak, positive or negative trends for the variables. The boundaries were defined from a 95% confidence interval for the slope. The slope is expressed as: 1112211n n n i i i i i n n i i n i var i var Slope n i i =====⨯⨯-=⎡⎤⨯-⎣⎦∑∑∑∑∑ (10)where i is the number of years; n is the total number of years; var is the variable of time-series trend. 2.2.3 Multiple linear regression analysisMultiple linear regressions were applied for examining the relationship of a collection of independent variables (or predictors) for precipitation and vegetation cover to a single de-pendent variable (or criterion) for soil erosion between 2000 and 2010 on the Loess Plateau. The dependent variable for soil erosion and both of independent variables for precipitation and vegetation cover in 2000–2010 were normalized between 0 and 1 using the min-max normalization algorithm before entering into the regression model. A robust regression usingSUN Wenyi et al.:Soil erosion and its response to the changes of precipitation and vegetation cover1097 iteratively reweighted least-squares model (Holland and Welsch, 1977) based on the pixel scales was applied to detect the significances and contribution rates of precipitation and vegetation cover corresponding to the changes of soil erosion. The procedures were per-formed using the robust-fit function of matlab 7.10.0 software.2.3 DatasetsDaily rainfall data provided by the National Meteorological Information Centre of China (/) from 133 meteorological stations, 72 were on the Loess Plateau and the remaining 61 were located adjacent to the Plateau, were used to analyze the annual rain-fall erosivity on the Loess Plateau. Soil organic carbon and texture data were collected and calculated for soil erodibility factor, which were derived from the Second Soil Investigation in China (Wei et al., 2012). DEM Dataset with a resolution of 90 m developed from SRTM (Shuttle Radar Topography Mission) was computed to topographic factor in the study, which was available from the International Scientific and Technical Data Mirror Site, Computer Network Information Center, CAS. (). The monthly 1 km NDVI (Normalized Differential Vegetation Index) MOD13A products between 2000 and 2010 were performed for vegetation cover factor and obtained from NASA EOS DATA Gateway (https:///api).3 Results and discussion3.1 Spatial and temporal characteristics of soil erosion on the Loess PlateauWater erosion is the dominant soil loss mode on the Loess Plateau (Tang, 2004). According to the Standard for Classification and Gradation of Soil Erosion SL190-2007 (Ministry of Water Resources of PR China, 2008), water erosion could be classified into six levels, i.e., slight (less than 10 t hm-2 a-1), light (10–25 t hm-2 a-1), moderate (25–50 t hm-2 a-1), severe (50–80 t hm-2 a-1), very severe (80–150 t hm-2 a-1) and extremely severe (more than 150 t hm-2 a-1). In this study, soil erosion on the Loess Plateau with an average of 15.2 t hm-2 a-1 was identified as light soil erosion, being less than 25 t hm-2a-1 between 2000 and 2010 (Figure 2). The soil erosion less than 25 t hm-2 a-1 accounted for 80.5% of the total area and was mainly distributed in irrigated regions, plain areas, sandy areas and earth-rocky moun-tainous areas. The more severe soil erosion higher than 25 t hm-2 a-1 was mainly distributed in gully and hilly regions in the central and southwestern parts, where the fragmented to-pography, well-developed gullies and steep slopes, and some scattered areas of earth-rocky mountainous areas were common characteristics of the Loess Plateau.The annual change of soil erosion from 2000 to 2010 was shown in Figure 3. Soil loss for most parts of the Loess Plateau declined at a rate of about 1 t hm-2 a-1. Erosion reduced at rates between 1 and 3 t hm-2 a-1 was observed in the areas suffering more severe soil loss on the Loess Plateau. These areas included the east of Yulin, most of the area of Yan’an prefec-ture (the northern part of Shaanxi Province), the west of Luliang and Linfen prefectures (the central part of Shanxi Province), Zhongwei and Guyuan prefectures (the southern part of Ningxia), east of Lanzhou and most of Qingyang (Gansu Province), which were mostly gully and hilly regions in central and southwestern parts along the Yellow River and its1098 Journal of Geographical SciencesFigure 2The spatial distribution of soil erosion averaged between 2000 and 2010 on the Loess Plateau, ChinaFigure 3 The spatial distribution of annual changes of soil erosion between 2000 and 2010 on the Loess Plateau, China.SUN Wenyi et al.:Soil erosion and its response to the changes of precipitation and vegetation cover1099tributaries, and in some earth-rocky mountainous areas. Soil erosion decreased significantly at rates higher than 3 t hm-2 a-1 occurred in Yan’an, Qingyang, Luliang and Linfen prefec-tures, which were the key areas of soil and water conservation and ecological restoration. These results were very similar to that reported in other studies, the areas suffered heavy soil and water loss had now shrunk, and the soil erosion rate in these region had declined from 33.5 to 23.9 t hm-2 a-1 between 2000 and 2008, particularly on the sloping land where soil erosion mainly occurs (Wei et al., 2010; Fu et al., 2011). An indirect example was shown that the suspended sediment flux decreased 16% from the Yellow River (Dai et al., 2009). However, in our study the soil erosion increased at the rate up to 1 t hm-2 a-1 over the ten years in some areas, which were in the western part of Erdos (Inner Mongolia Autonomous Region), the surroundings of Taiyuan city (Shanxi Province), and the eastern parts of Xining, Hainan and Huangnan prefectures (the east of Qinghai Province).3.2 Response of soil loss to the changes of precipitation and vegetation coverPrecipitation and vegetation cover are two direct and sensitive factors that affected the soil erosion (Hudson, 1995; Quan et al., 2011; Renard et al., 1997). The precipitation is a de-structive force to the land surface making the soil prone to splash erosion, and is important for determining the severity of soil and water loss. Vegetation cover has the positive effects on the land surface for protecting soil surface from erosion. The increment of vegetation can improve the effectiveness of land cover and reduce susceptibility to soil erosion (Ritsema, 2003). In the last 60 years, the climate of the Loess Plateau had an obvious trend of warming and drying (Liu et al., 2006; Xin et al., 2011). At the same time, lots of infrastructure and ecological reconstructions were carried out on the Loess Plateau, especially returning farm-land to forest and grassland (Fu et al., 2009; Gao et al., 2010). The soil erosion would be significantly changed due to the variation of precipitation and vegetation cover, especially in the zone of fragile ecosystem and semiarid climate on the Loess Plateau.On the Loess Plateau, erosion rate change predominantly related to precipitation, rather than by erosion-resistance of vegetation, was shown in Qingyang Prefecture in Gansu and Guyuan Prefecture in Ningxia. In these prefectures soil erosion declined markedly as pre-cipitation decreased (Figure 4), but there was little increment of vegetation cover (Figure 5). However, evident erosion-resistance due to vegetation cover (Figure 5) was shown for re-gions along the Yellow River and its tributaries, particularly at slopes greater than 25°. These areas were located in the east of Yulin, most parts of Yan’an prefecture in Shaanxi, and the west of Luliang and Linfen prefectures in Shanxi in hilly and gully regions on the Loess Plateau. They were the key areas for soil and water conservation and ecological restoration undertaken by the National Grain-to-Green Program and a large area of steep slope cropland has been converted into grasslands and forests (Xin et al., 2008). The decrease of soil ero-sion in these areas was mainly driven by significant increments of vegetation cover, whereas precipitation increased relatively more in Yulin and Luliang prefectures and little change in Yan’an and Linfen prefectures (Figure 4).3.3 The significant tests of precipitation and vegetation cover responding to soil erosionStatistical P values were calculated to analyze the significant tests for soil erosion based on the variation of precipitation (Figure 6) and vegetation cover (Figure 7). The P values1100 Journal of Geographical SciencesFigure 4 The variation of precipitation between 2000 and 2010 on the Loess Plateau, ChinaFigure 5 The variation of vegetation coverage between 2000 and 2010 on the Loess Plateau, China (the value of vegetation coverage ranging from 0 to 1)Figure 6 The significance analysis of precipitation on soil erosion in 2000-2010Figure 7 The significance analysis of vegetation on soil erosion in 2000-2010map was divided into three categories, significance at 0.05 and 0.01 levels and no signifi-cance (P>0.05). The significant areas (with P values less than 0.05) of precipitation corre-sponding to soil erosion mostly located in gully and hilly regions, irrigated regions and sandy areas. These areas included Yulin and Yan’an prefectures in Shaanxi, and Luliang and Linfen prefectures in Shanxi in the hilly and gully region, Zhongwei and Guyuan prefectures in Ningxia, Qingyang and Dingxi in Gansu in the gully region and agricultural irrigation areas, and Erdos in Inner Mongolia in sandy areas.The significant areas of vegetation cover corresponding to soil erosion was much lower than that of precipitation, including the north of Yulin, central part of Yan’an in Shaanxi, Luliang and Linfen in Shanxi in the hilly and gully region, small part in Qingyang and Gu-yuan in the gully regions of the Loess Plateau. To some degree, vegetation cover is closely controlled by the distribution of annual precipitation, the larger vegetation cover resulted from higher annual precipitation in disturbed ecosystem, which resulted in higher ero-sion-resistance due to the increased vegetation cover (Nunes et al., 2011; Xu, 2005).3.4 The contribution of precipitation and vegetation cover responding to soil erosion The variations of precipitation and vegetation cover had the significant impacts on the soil erosion on the Loess Plateau, as we mentioned above. However, the significant influences of precipitation and vegetation cover both existed in some areas. The contribution rates of pre-cipitation and vegetation cover to soil erosion may be inconsistent. Therefore, we take a further step to quantify the relative contributions of precipitation and vegetation cover to soil erosion on the Loess Plateau.On the whole, the contribution rate of precipitation showed the positive trend with the variation of soil erosion (Figure 8), which indicated that precipitation decrease reduced the Plateau’s rainfall erosivity and eventually lowered soil loss. At the same time, vegetation cover increase also reduced the soil erosion due to its negative contribution rate (Figure 9), although the contribution rate of vegetation cover in most areas of the Loess Plateau was very low.The areas affected remarkably by precipitation and vegetation cover mainly existed in hilly and gully region in the central and southwestern parts of the Loess Plateau. It was the region that suffered severe soil erosion and experienced the ecological restoration for Grain-to-Green Program. The contribution rate of precipitation in the hilly and gully region, such as Yulin, Yan’an in Shaanxi, and Luliang, Linfen in Shanxi, was mainly between 0.1 and 0.3 (Figure 8). The area in that region with contribution rate from 0.3 to 0.6 for precipi-tation was relatively small and scattered (Figure 8). However, the contribution rate of vege-tation cover in these areas was higher than precipitation, especially along the main stream of the Yellow River (Figure 9). The absolute values of contribution rate for vegetation cover in the hilly and gully region were mainly higher than 0.3, and the areas with contribution rate more than 0.6 performed obviously (Figure 9). Therefore, the change of soil erosion in these areas predominantly related to the increased vegetation cover.However, the areas in the gully region of the Loess Plateau, including Qingyang and Dingxi in Gansu and Guyuan in Ningxia, were more predominantly related to precipitation than to vegetation cover. The contribution rate of precipitation in most of these areas was mainly between 0.3 and 0.6 (Figure 8), while the absolute value of that for vegetation cover。