XXXHPLC分析方法的验证方案75改后资料
HPLC验证方案

设备/系统名称:高效液相色谱仪设备/系统型号:Waters515泵、2487检测器方案编号:VM-QC-001-01仪器编号:R211-JY-04方案制备姓名:日期:方案审核姓名:日期:姓名:日期:方案审核/批准姓名:日期:姓名:日期:目录1.目的 (4)2.范围 (4)3.组织与分工 (4)4.偏差解决 (5)5.变更控制 (5)6.确认内容 (5)6.1安装确认 (5)6.2运行确认 (7)6.3 性能确认 (8)7.验证结果汇总及评价 (12)8.验证周期 (13)9.设备确认总结报告 (14)10.附件 (14)10.1偏差记录 (15)10.2.偏差和解决报告 (16)10.3.附录文件清单 (17)11. 方案完成后审核/批准 (18)1.目的为确认waters515HPLC+waters UV2487高效液相色谱系统测试数据准确可靠,性能稳定,特制订本验证方案,对高效液相色谱仪进行验证。
验证过程应严格按照本方案规定的内容进行。
2.范围2.1 设备验证内容包括:安装确认、运行确认、性能确认。
2.2 该方案适用于本公司实验室高效液相色谱系统的验证。
3.组织与分工3.1成员组成:部门姓名职务3.2 分工(1)由QC负责制订本验证方案。
(2)由QA负责确认本验证方案。
(3)由QC负责进行本验证方案的具体执行。
(4)由QC负责编写验证报告。
3.3.职责划分:(1)验证小组负责本验证方案的设计、批准及实施。
(2)QC负责按本验证方案对受试仪器进行验证,并及时报告验证结果,提供验证原始数据。
(3)验证小组组长全面协调各项验证工作,负责报告验证结果、审核验证的评价与建议以及相应的结论,并在验证过程中提供相关的技术支持。
4. 偏差解决偏差指的是任何的测试失败,偏离规格,缺失文件,或重大偏离已建立的程序而导致潜在的GMP符合性影响。
对于一个偏差事件,偏差必须被审核并评估确定导致偏差的根源。
另外,根据设备的状态对偏差的影响进行分析。
色谱纯度HPLC分析方法验证报告样式

×××色谱纯度分析方法验证报告目录.............................................................................................................................................................................................. ×××色谱纯度分析方法验证报告批准----------------------------------------------------31. 验证目的 ---------------------------------------------------------------------------42. 色谱纯度分析方法 -------------------------------------------------------------------42.1 仪器 ------------------------------------------------------------------------------42.2 试剂 ------------------------------------------------------------------------------42.3 标准品 ----------------------------------------------------------------------------42.4 色谱条件 --------------------------------------------------------------------------42.5 溶液配制 --------------------------------------------------------------------------52.6 进样操作 --------------------------------------------------------------------------53. 方法验证 ---------------------------------------------------------------------------63.1 专属性 ----------------------------------------------------------------------------63.2 系统适用性试验 --------------------------------------------------------------------93.3 精密度 ----------------------------------------------------------------------------93.4 线性及范围 ------------------------------------------------------------------------113.5 准确度 ----------------------------------------------------------------------------173.6 检测限及定量限 --------------------------------------------------------------------204.验证评价及结论 ---------------------------------------------------------------------215. 附件 -------------------------------------------------------------------------------21×××色谱纯度分析方法验证报告批准对本验证方案批准表示同意其验证项目和可接受标准、验证方法和本方案内的各种表格格式、内容。
XXXHPLC分析方法的验证方案(7.5改后)

XXXHPLC分析方法的验证方案(7.5改后)XXX产品HPLC分析方法确认方案XXX制药有限公司确认方案审批表确认方案名称: XXX产品HPLC分析方法确认方案确认方案编号:KY-ZL-YZ-FF-00400目录1 概述2 确认目的3 确认范围4 确认小组成员与职责5 确认方案的审核与批准6 进度计划7 确认内容8 变更与偏差9 确认结果与评价报告10 确认合格证书1 概述我公司产品XXX产品采自《中国药典》2010年版二部,含量及有关物质、A、B、C的检验均使用高效液相色谱仪进行检验,两个检验项目检验参数等条件完全相同,且我公司未对《中国药典》2010年版二部中的方法进行过任何改变,因此按照2010新版GMP要求,需要进行分析方法确认。
本确认方案使用LC-2010AH型高效液相色谱仪对XXX产品采用《中国药典》2010年版二部“含量”、“有关物质”及“A、B、C”的检验方法进行确认,证明此方法在本公司实验室的适用性。
根据《药品GMP指南(质量控制实验室与物料系统)》分册要求,“含量”、“有关物质”及“A、B、C”项需确认项目如下:“是”代表该项内容需确认,“否”代表该项内容不需要确认2确认目的通过对XXX产品含量及有关物质A、B、C的检验方法的确认,证明此方法在本公司实验室的适用性。
3确认范围本确认方案适用于XXX产品含量及有关物质A、B、C、的检验方法进行确认。
4确认小组成员与职责5确认方案的起草与审批5.1 确认方案的起草与审批:确认方案由检验室起草,确认小组会审,质量负责人批准实施。
5.2 确认方案的培训:确认方案经批准后,实施前由确认方案的起草部门组织确认方案的参与者进行培训。
5.3 确认方案的修改:确认方案如需修改,由质量负责人批准实施,在确认报告中体现。
6 进度计划整个确认活动实施时间:确认时间:从_____年___月__日至_____年__ 月__ 日;起草报告:从_____年___月__日至_____年__ 月__ 日;7 确认内容7.1确认前仪器及材料检查7.1.1确认前,对下列试验用仪器和材料进行检查7.1.1.1岛津高效液相色谱仪7.1.1.2 TG-332A型分析天平7.1.1.3色谱柱:C18(4.6*250㎜)7.1.1.4对照品和试剂:产品X二醇物对照品、对硝基苯甲醛对照品、产品X对照品、羟苯甲酯对照品、羟苯乙酯对照品、羟苯乙酯对照品、庚烷磺酸钠,乙腈(色谱级),甲醇(色谱级),磷酸二氢钾、三乙胺、磷酸、蒸馏水7.1.1.5其他一些辅助的玻璃仪器(如量瓶、移液管等)7.1.2可接受标准:仪器和用具经校验且在效期内;对照品、试液、试剂与试药符合验证要求且在效期内;色谱柱使用状态正常。
HPLC的验证
HPLC的验证目录1. 验证目的V alidation purpose (2)2. 验证范围V alidation Scope (2)3. 验证周期V alidation Cycle (2)4. 规程Regulations (2)4.1.确认验证所需文件Qualification required documents (2)4.2.所用试剂与玻璃仪器的准备Reagent and glass instruments preparation (3)4.3.流量控制阀检测Flux control valve test (3)4.4.流量比例控制阀检测Proportion test (3)4.5.基线噪声和基线漂移的检定Baseline Noise & Baseline Drift (4)4.6.最小检测浓度Minimal Detectable Concentration (4)4.7.检测器性能检查Inspect apparatus test (5)4.8.定性、定量重复性Qualitative and Quantitative analysis (5)4.9.偏差Deviation (6)1. 验证目的Validation purpose本验证的计划任务是:确认仪器达到设计要求。
验证仪器的性能是否符合性能要求。
2. 验证范围Validation Scope3.1本验证主要是对试验室的高效液相色谱仪进行性能确认。
3.2验证高效液相色谱仪的流量控制器的性能、二元泵流量比例性能、进样体积控制阀与检测器的性能检查。
3.3相关验证:本确认方案应确保所使用的电子天平经过校验,所使用的容量仪器经过检定。
3. 验证周期Validation Cycle每年三个月对高效液相色谱仪的泵进行流量性能、二元泵流量比例性能的检查,并进行进样体积控制阀与检测器的性能检查。
4. 规程Regulations4.1.确认验证所需文件Qualification required documents目的核实在本次确认中所需的SOP、参考资料等文件均是可用的程序查找和本次确认相关的文件,确保公司文件均为经批准的现行版本,记录文件名称、文件编码、修订版次等内容。
HPLC方法验证及方案

SECTION XV SECTION 15 Analytical Methods(TYPICAL ANALYTICAL METHOD VALIDATION)1.PURPOSET he purpose of this Standard Analytical Procedure is to demonstrate the procedure required to validate in-house HPLC analytical methods and to show that the methods are stability-indicating. Methods based on the USP but modified for stability indicating test purposes require full in-house validation.This procedure ensures that the Product Development Process and Process Qualification Batch analysis is based on a foundation of Good Laboratory Practice using validated test procedures.2.RESPONSIBILITYThe Head of Analytical Development in coordination with the managers of QC and Regulatory Affairs at the proposed manufacturing site.3.FREQUENCYFor each non-compendial analytical method intended for ANDA (or OTC ANDA) manufactured products.For Stability-Indicating Assays and limit testing of impurities that may be based on compendial methods. Each Product strength will follow the full method validation procedure.4.PROCEDURE[a].Method ValidationNon-compendial methods validation will follow the USP direction for parameters needed for the validation of test methods.Typical parameters for validating assays and other non-compendial analytical methods designed for providing quantitative results shall include :• Accuracy• Recovery• Precision ( System reproducibility, Method reproducibility )• Specificity• Linearity• Range• Ruggedness (different analyst s / days /different equipment models / columns) [b].Placebo Analysis.A mixture of non-actives (placebo) shall be prepared and subjected to analysis.No interfering peaks shall be observed in the graph of the placebo chromatogram.[c].The stability of the Standard solution is assessed by re-injection of the standard solution after24 x n hours (where n = number of days the Standard will be used).Standard Preparation for AssayComparison of standard solutions for Assay of Active material, injected after one month and freshly prepared demonstrate that the standard solutions are stable and does not lose its quality after one month if refrigerated.Standard Preparation for ImpurityComparison of standard solutions of Guanine, injected after one month and freshly prepared demonstrate that the standard solutions are stable and does not lose its quality after 1 month if refrigerated.Name of standards Storage conditions Difference. relativeto freshly preparedstandard[Active] 100%4°C<2%[Impurity] 100%4°C<2%Standard Solutions are stored at controlled temperatures and light conditions as per labeling.[d].Stability Indicating Procedures.For the Stability Indicating Method, the product sample shall include forced degradation by stressed analysis. Conditions of concentration and reaction time may vary depending on the active drug substance and drug product e.g. :• Oxidation-(H2O2 plus standing time).• Base Hydrolysis-(NaOH x N plus standing time).• Acid Hydrolysis-(HCl conc. plus standing time).• Sun light-(24 hours standing time).• Heat-(x degrees C).Summary of Stability Indicating ResultsStressed Conditions Temp.Time Raw Material;Tablets(°C)(hr)RemainingSubstance.(%)Peak Purity,(Figure)RemainingSubstance(%)PeakPurity,(Figure)Solution heating9012100.2pure98pure Solid heating160 2101.3pure92pure Sunlight 765 w/m24014101.1pure84.8pure 3,3N Sodium Hydroxide701099.8pure100.2pure 10%Hydrogen Peroxide37 377.5pure90.5pure 5% Hydrochloric Acid Room2079.7pure78.6pure[e]Specificity and Suitability (Resolution and Tailing Factors).When a satisfactory separations of all the degradation peaks have been achieved through the forced degradation reactions, a Resolution Factor (according to the USP requirements) between the main active peak and the nearest degradant peak is calculated using the USP formula.A Tailing Factor (according to the USP formula) is calculated for the main active peak.[f] System Suitability TestA mixture of [Active] AS. standard at the concentration about [0.1]mg/mL and of [Impurity] AS. standard at the concentration about [0.01]mg/mL according to Method SI-1000 was prepared and injected into the HPLC system.For chromatogram obtained the following values were calculated (according to USP):1. Relative Retention Time for [Impurity] peakRRT = RT [Impurity] = 2.65 =0.31RT [Active] 8.452. Tailing factor for [Active] peakT=W2=94.2= 1.1f 0.05 fThe values depict the specificity of the method for resolution between the main peak and impurity peak. (values shown for demonstrations purposes).Peak PurityThe photo diode-array is used for the evaluation of the stability indicating nature of the assay method number SI-1000 for [000]mg and [000]mg tablets using a Waters 996™ Unit, controlled by the chromatography manager Millennium 2010™.Peak purity and match results are reported as:Purity Angle is a measure of spectral non-homogeneity across a peak - i.e. the weighed average of all Spectral Contrast Angles calculated by comparing all spectra in the integrated peak against the peak apex spectrum.Purity Threshold is the sum of Noise Angle and Solvent Angle. It is the limit of detection of shape differences between two spectra.Match Angle is a comparison of the spectrum at the peak apex against a library spectrum.Match Threshold is the sum of the Match Noise Angle and Match Solvent Angle. Noise Angle is a measure of spectral non-homogeneity caused by system noise.Peak Purity (Cont.)Solvent Angle is a measure of spectral non-homogeneity caused by solvent composition.It the purity angle is smaller than the purity threshold and the match angle is smaller than the match threshold, this indicates that no significant differences between spectra are detected. There is no spectroscopic evidence for co-elution and the peak is considered pure.[f]Relative Retention Time of Main and Additional peaks.Each stressed analysis shall indicate the percentage by which the Main peak is decreased as well as the RRT for any other Additional peaks.If the RRT of an Additional peak corresponds to a known degradant/impurity etc. it shall be stated.The peak purity of the main peak shall be given for each stressed analysis (where possible).[g].Validation of limit testing for impurity methods shall include :*Specificity*Detection Limit(DL)*Quantitation Limit(QL)Detection Limit (DL)The detection limit of an individual analytical procedure is the lowest amount of analyte in a sample which can be detested but not necessary quantitated as an exact value.Quantitation Limit(QL)The Quantitation limit of an individual analytical procedure is the lowest amount of analyte in a sample which can be quantitatively determined with suitable precision and accuracy. Used in the determination of impurities and or degradation products.[h].Contents of a typical HPLC Analytical Validation Protocolrefer Method No. A-0340-01-1299Validation of HPLC Analytical MethodMethod No: A-0340-01-1299[1]Introduction - A brief description is given of the following parameters :*Method and Edition # used*Batch # of samples tested (test the lowest and the highest label strength)*Type of detector used to analyze stressed samples*Stress testing of Standard solution to determine origin of Additional peaks.[2]System Reproducibility - PrecisionTen replicate (single) injections of the standard solution at the nominal concentration described in the method is performed and the RSD calculated. The Results (sample # and peak areas) are tabulated. The Average Peak Area, SD and RSD are shown in the table. Target values for RSD = 0.5 to 1.0(Keep this standard solution for the stability of Standard Solutions - Point 9)SYSTEM REPRODUCIBILITYSAMPLE No.PEAK AREAS1.2.3.4.5.6.7.8.9.10.Average Peak Area Standard Deviation Relative Standard Deviation === 0.5 - 1.0[3]Method Reproducibility - PrecisionThe full analytical method # is carried out and repeated Ten times on the finished product (batch #) and the RSD is calculated. Two HPLC injections are performed per method assay and the peak areas are averaged. The Results (assay %) are tabulated. The Average Assay %, SD and RSD are calculated and shown in the tabulations. Target values for RSD = 1.5 to 3.0.METHOD REPRODUCIBILITYSAMPLE NoBatch No:ASSAY %12345678910Average Assay % Standard Deviation Relative Standard Deviation.=== 1.5 - 3.0[4]AccuracyThe Accuracy of an analytical procedure expresses the closeness of agreement between the true value and the value found.Ten replicate (single) injections of the standard solution at the nominal concentration of x mg/100 mL as described in the Analytical Method / Ed # [00] is made and the percent deviation from the true values as determined from the linear regression line is calculated.The Results (Peak areas and % accuracy) are tabulated.The Mean, SD and C.of.V are shown in the tabulations[4]Accuracy (continued).A C C U R A C YINJECTIONNo PEAKAREACALCULATEDCONC.%ACCURACY12345678910Mean (% Accuracy) =Standard Deviation =% Coef. of Variation =[5]Recovery (Extraction time)The extraction efficiency is demonstrated by varying the extraction time of prepared sample solutions as described in the analytical method #. Two HPLC injections are performed per method assay and the peak areas are averaged. The extraction time suitable to ensure complete extraction is highlighted.Not less than three different extraction times are used namely 0.5 T, T and 1.5 T (where T is the extraction time of the method).[5]Recovery (Extraction time - tabulations continued).The Results (Extraction time and Assay %) are tabulated as shown.RECOVERY - EXTRACTION% ASSAYTIME IN MINUTESBatch No:0.5 TT1.5 T[6]Recovery (spiked placebo samples).Five spiked admixtures of the active substance and the non-active vehicle (placebo) at concentrations of about 50 % to 150 % of the stated concentration required by the assay procedure is prepared and analyzed to show the percentage active recovery. Two HPLC injections are performed per method assay and the peak areas are averaged.The Results (Theoretical conc. Actual conc. and % recovery ) are tabulated.The Average Recovery, SD and the % Coefficient of Variation are given.[6]Recovery (spiked placebo samples tables - continued).T he recovery results are shown graphically (peak area Vs conc. (mg/100 mL). These results also show extraction method and detector linearity.RECOVERYStandard solution mg/100mL Peak Area =CONC. Theoretical (mg/100ml)PEAK AREAFOUNDCONC.FOUND(mg/100ml)PERCENTAGERECOVERY5075100125150Mean (% Recovery) =Standard Deviation =% Coef of Variation =The Linear Regression value, Slope and Y-Intercept are shown in the GRAPH. The placebo chromatogram (vehicle only) is shown to highlight the absence of Additional Peaks[7]Linearity and range.T he linearity on an analytical procedure is its ability (within a given range) to obtain test results which are directly proportional to the concentration (amount) of the analyte in the test sample.F ive Standard solutions in a concentration range of (about) 50 % to 150 % of the stated concentration required by the assay procedure are prepared and analyzed by the stated method.T wo HPLC injections are performed per method assay and the peak areas are averaged.[7]Linearity and range - (continued).T he Area count and concentration range is plotted. Linear regression analysis willdemonstrate the acceptability of the method for quantitative analysis over the full spectrum of the concentration range. Detector linearity is demonstrated.The Results (Range conc. and peak areas ) are tabulated.LINEARITY AND R A N G ECONC. Batch No:PEAK AREAS50 %75 %100 %125 %150 %Linear RegressionY-Intercept Slope ===The results are shown graphically (peak area Vs range conc. (mg/100 mL).GRAPH OF LINEARITYConc. mg/100mLPe akAre a200004000060000800001000001200000255075100125150[8]RUGGEDNESS&Robustness.Ruggedness measures the lack of ex ternal influence on the test results whereas robustness measures the lack of in ternal influences on the test results.The Robustness of an analytical procedure is a measure of its capacity to remain unaffected by small but deliberate variations in method parameters and thus providing an indication of its reliability normal usage.The method may be evaluated for specificity using two different columns. No differences in specificity, selectivity or column performance should be observed. RobustnessRobustness determinations are essential when transferring analytical methods from the development laboratory to the commercial plant quality control laboratory. There may usually be a difference in columns or HPLC machine models used. Deliberate variations according to the following table were made to the critical parameters of the method such as column, flow rate and concentration of [organic acid] in the mobile phase. Using the System Suitability solution and LOQ solution as the Test Solutions the performance of the method was evaluated. Column 1: Phenomenex Bondclone 10µ, C-18, 300 x 3.9mm (OOH-2117-CD) Column 2: Waters µ-Bondapak 10µ, C-18, 300 x 3.9mm (27324)C O ND I T I O N RE S U L T SConditionNo.Column Flow RatemL/minBufferConc. (%)RRT T f RSDbet. LOQ of[Active]RSDbet. LOQ of[Impurity]11 2.50.10.3 1.1<10<1021 2.20.10.3 1.1<10<1031 2.80.10.3 1.1<10<1041 2.50.150.3 1.1<10<1052 2.50.10.3 1.1<10<10Notes on different terms frequently used:INTERMEDIATE PRECISIONT he analytical variation expressed between laboratories on different days; with different equipment; or different analysts is known as - intermediate precision. REPRODUCIBILITY (INTRA-LAB)T his intra-laboratory precision or the precision between laboratories is known as reproducibility or more specifically - intra-laboratory reproducibility. Both the above are ruggedness - and a USP requirement.[8]RUGGEDNESS&Robustness- (Tabulations - continued).The Results (Average assay % for Analyst 1 and 2 ) are tabulated.RUGGEDNESSANALYSTNo 1%ASSAYColumn IANALYSTNo 2%ASSAYColumn 212345678910Mean (% Accuracy) =Standard Deviation =% Coef of Variation =R obustness.The evaluation of robustness should be finalized at the end of the development phase - around the time of the process qualification lot manufacture. The robustness evaluation should be developed with the commercial laboratory equipment in mind. It should show the reliability of an analysis with respect to deliberate variations in the method parameters A consequence of robustness evaluation is that a series of system suitability parameters are established to ensure that the validity of the analytical procedure is maintained whenever used.Robustness is defined by both the USP and the ICH Tripartite guidelines as "a measure of its capacity to remain unaffected by small but deliberate variations in method parameters and provides an indication of its reliability during normal use " Robustness is defined both in the USP and ICH, but is not required.[9]Stability of Standard solutionsRe-chromatography of ten replicate single injections of the same standard solution (which have been allowed to stand for x hours ) against freshly prepared Standards showed no significant differences from the original results.STABILITY OF STANDARD SOLUTIONSmg/100mL Initial Analysis(Date)mg/100mL Repeat Analysis 2nd (Date)1 injection2 injection3 injection4 injection5 injection6 injection7 injection8 injection9 injection10 injection1 injection2 injection3 injection4 injection5 injection6 injection7 injection8 injection9 injection10 injectionMeanStandard Deviation Relative Standard Dev.=== NMT 2.0 %[10]Typical Chromatograms.Representative chromatograms of the following traces are routinely provided:-♦ System Suitability♦ Standard Solution♦ Drug Product♦ placeboTypical ChromatogramsWhen R epresentative Chromatograms are displayed - all peaks are LABELED with the peak name and RRT.R epresentative chromatogramDrug Product[11]Conclusion .(Closing Statement)A n appropriate conclusion should be given stating clearly that:“The method # IAG00-005 Ed. No [00] is shown to be accurate and precise for carrying out assay analysis as part of the Assay and Stability Studies for the Drug Product conforming to the formula as shown in Appendix 1”[12]References and Appendixes.A cknowledgment to references as well as attachments such as the drug productformula are attached at the end of the validation protocol.I t is important to emphasize that analytical validation applies to a drug formula anda set manufacturing procedure. Extraneous peaks and processing stresses are specific to a manufacturing procedure, equipment used and the nature of the excipients.References:1. "Validation of compendial methods" USP 23 <1225> USPC Rockville Maryland USA 1994.2. USP/NF XXIII USPC Rockville Maryland USA 1994.3. Scale up and Post approval Changes Manufacturing and Controls In vitro Dissolution and In Vivo Bioequivalence Documentation CEDER 1995 (SUPAC)4. International Conference on Harmonization "Guidelines on validation of Analytical Procedures:Definitions and Terminology; Federal Register (March 1, 1995.)5. ASTM Standard Guide For Conducting Ruggedness Tests E1169 American Society for testing Materials Philadelphia 1989.6. G. Kateman and L. Buydens, T he Ruggedness Test Quality Control in the Analytical chemistryJohn Wiley and Sons NY 2nd Edition 1993, pp118 125.Label the peakclearlyName and Retention time (8.78 min)。
高效液相色谱仪验证方案改

实验室用仪器验证方案型高效液相色谱仪验证目录1.验证目的2.设备简介3.相关文件4.验证内容、方法及接受标准1. 验证目的通过对质量检验室检验用的高效液相色谱仪进行定期检查、保养以及校正,保证仪器的正常运行与使用,为实验数据结果的可靠性、准确性提供基础条件。
2. 设备简介本仪器由生产,由组成。
主要用于各种中药原料及成品药的含量测定。
3. 相关文件校正:每一年由技术监督局对本台仪器校正一次。
4. 验证内容、方法及接受标准4.1. 安装确认项目要求:安装场所环境温度10-30℃,且要稳定;相对湿度≤65%,无腐蚀性气体;远离振源安有空调;电源功率220±10V,50HZ;供电电源应有良好的接地;线路连接各接口连接正确;管线连接各接口连接正确。
4.2 校正高压泵校正泵流量设定值:将仪器的输液系统、进样器、色谱柱和检测器连接好,以甲醇为流动相,按表1设定流量,待流速稳定后,在流动相排出口用事先清洗称重过的容量瓶收集流动相,同时用秒表计时,准确收集至规定的时间,称重,按下式计算S S。
表1 S S的检定计算公式:Fm=(W2-W1)/ρ·tS s = (Fm-Fs)/Fs ×100%其中:Fm为流量实测值(ml/min),Fs为流量设定值(ml/min),W2为容量瓶加流动相的重量(g),W1为容量瓶的重量(g),ρ为实验温度下流动相的密度(g/cm3),t为收集流动相的时间(min)4.3运行确认进行运行确认的目的是在不使用任何试样的条件下,确认该仪器能够达到设计要求。
4.3.1紫外检测器基线漂移和基线噪声的测定。
将仪器的各部分连接好,紫外检测器波长调到254nm,流动相为100%甲醇,流速为1.0ml/min,吸收度范围选择最灵敏档,开机,待基线稳定后,记录基线30~40分钟,计算基线漂移和噪声。
基线漂移应≤5×10⁻³(AU/h),基线噪声应≤5×10-4(AU)。
XXXHPLC分析方法的验证方案(7.5改后)

XXX产品HPLC分析方法确认方案XXX制药有限公司确认方案审批表确认方案名称: XXX产品HPLC分析方法确认方案确认方案编号:KY-ZL-YZ-FF-00400目录1 概述2 确认目的3 确认范围4 确认小组成员与职责5 确认方案的审核与批准6 进度计划7 确认内容8 变更与偏差9 确认结果与评价报告10 确认合格证书1 概述我公司产品XXX产品采自《中国药典》2010年版二部,含量及有关物质、A、B、C的检验均使用高效液相色谱仪进行检验,两个检验项目检验参数等条件完全相同,且我公司未对《中国药典》2010年版二部中的方法进行过任何改变,因此按照2010新版GMP要求,需要进行分析方法确认。
本确认方案使用LC-2010AH型高效液相色谱仪对XXX产品采用《中国药典》2010年版二部“含量”、“有关物质”及“A、B、C”的检验方法进行确认,证明此方法在本公司实验室的适用性。
根据《药品GMP指南(质量控制实验室与物料系统)》分册要求,“含量”、“有关物质”及“A、B、C”项需确认项目如下:“是”代表该项内容需确认,“否”代表该项内容不需要确认2确认目的通过对XXX产品含量及有关物质A、B、C的检验方法的确认,证明此方法在本公司实验室的适用性。
3确认范围本确认方案适用于XXX产品含量及有关物质A、B、C、的检验方法进行确认。
4确认小组成员与职责5确认方案的起草与审批5.1 确认方案的起草与审批:确认方案由检验室起草,确认小组会审,质量负责人批准实施。
5.2 确认方案的培训:确认方案经批准后,实施前由确认方案的起草部门组织确认方案的参与者进行培训。
5.3 确认方案的修改:确认方案如需修改,由质量负责人批准实施,在确认报告中体现。
6 进度计划整个确认活动实施时间:确认时间:从_____年___月__日至_____年__ 月__ 日;起草报告:从_____年___月__日至_____年__ 月__ 日;7 确认内容7.1确认前仪器及材料检查7.1.1确认前,对下列试验用仪器和材料进行检查7.1.1.1岛津高效液相色谱仪7.1.1.2 TG-332A型分析天平7.1.1.3色谱柱:C18(4.6*250㎜)7.1.1.4对照品和试剂:产品X二醇物对照品、对硝基苯甲醛对照品、产品X对照品、羟苯甲酯对照品、羟苯乙酯对照品、羟苯乙酯对照品、庚烷磺酸钠,乙腈(色谱级),甲醇(色谱级),磷酸二氢钾、三乙胺、磷酸、蒸馏水7.1.1.5其他一些辅助的玻璃仪器(如量瓶、移液管等)7.1.2可接受标准:仪器和用具经校验且在效期内;对照品、试液、试剂与试药符合验证要求且在效期内;色谱柱使用状态正常。
液相色谱仪HPLC分析方法验证 液相色谱解决方案

液相色谱仪HPLC分析方法验证液相色谱解决方案为了保证分析检测结果精准、牢靠,必需对所接受的分析方法的精准性、科学性和可行性进行验证,以证明分析方法符合检测的目的和要求,这就是分析方法验证。
从本质上讲,方法验证就是依据检测项目的要求,预先设置确定的验证内容,并通过设计合理的试验来验证所接受的分析方法符合检测项目的要求。
方法验证在质量掌控上有紧要的作用和意义,只有经过验证的分析方法才能用于药品生产的分析检测,方法验证是订立质量标准的基础。
方法验证内容包括方法的专属性、线性、范围、精准度、精密度、检出限、定量限、耐用性和系统适用性等,检测目的不同验证要求也不尽相同。
1.专属性专属性是指分析方法能够将产品和杂质分开的特性,也称为选择性。
对于纯度检测,可在标准品中加入产品中的已知杂质,或者直接用粗品,考察产品峰是否受到杂质的干扰,对于过程跟踪,可用反应体系样品来考察有没有其它的杂质干扰。
必要时使用二极管阵列检测器或者质谱检测器进行色谱峰纯度检查。
一般要求产品和杂质之间的分别度大于2.0、2.线性线性是在设定的范围内,检测结果与样品中原材料或产品的浓度呈线性关系的程度。
线性是定量检测的基础,需要定量检测的项目都需要验证线性。
一般用储备液经过精密稀释,或分别精密称样,制备得到一系列被测物质的浓度(5个以上),按浓度从小到大运行序列,以峰面积和浓度的函数作图,用zui小二乘法进行线性回归计算,考察分析方法的线性。
3.范围范围指在能够达到确定的精准度、精密度和线性时,样品中被分析物的浓度区间。
简单的说,范围就是分析方法适用的样品中待测物的浓度zui大值和zui小值。
需要定量检测的分析方法都需要对范围进行验证,纯度检测时,范围应为测试浓度的80%~120%。
4.精准度精准度是指测定的结果与真实值之间接近的程度,所以也叫做真实度,需要定量得分析方法均需要验证精准度。
精准度应在规定的范围内建立,对于原材料药可用已知纯度的标准品或符合要求的原材料药进行测定,必要时可与另一个已建立精准度的方法比较结果。
验证方案-HPLC
高效液相色谱仪验证方案类别:编号:部门:验证委员会页码:共16页,第1页版次:☐新订☐替代:起草部门:年月日审核:年月日审阅会签:(验证委员会)批准:年月日实施日期:年月日复印数:批准:分发至:目录1.概述 (3)2.验证目的 (3)3.验证依据及验证范围 (3)4.验证工作小组 (3)5.验证方案审批 (3)5.1验证方案起草 (3)5.2验证方案会签 (3)5.3验证方案批准 (3)5.4验证方案实施 (3)6.验证的准备 (3)6.1文件资料的确认 (3)6.2售后服务 (4)6.3关键性仪表及消耗性备品备件 (4)6.4安装检查 (4)6.5计算机的安装情况检查 (4)6.6安装确认结论及批准 (5)7.安装验证内容 (5)7.1评价设备性能、质量、适用性是否符合采购质量标准要求 (5)7.1.1评价仪器的安装条件是否符合GMP及供应商提议的要求 (5)7.1.2起草标准操作规程 (5)7.1.3仪器校正 (5)7.2 运行确认(也即功能试验) (5)7.2.1 测试项目和认可标准 (5)7.2.2 验证所需的材料 (5)7.2.2.1 玻璃仪器设备 (5)7.2.2.2 试剂、标准溶液 (5)7.2.2.3 其它辅助设备 (5)7.2.3 软件系统安全性确认(必要时) (5)7.2.4 运行确认的实施 (6)7.2.5 运行确认评价及结论 (7)8.性能确认(适用性预试验) (7)9.拟订再验证项目及周期 (8)10.验证结论 (8)1.概述高效液相色谱法(High Performance Liquid Chromatography,HPLC)是一种现代液相色谱法,其基本方法是用高压输液泵将流动相泵入到装有填充剂的色谱柱,注入的供试品被流动相带入柱内进行分离后,各成分先后进入检测器,用记录仪或数据处理装置记录色谱图并进行数据处理,得到测定结果。
由于应用了各种特性的微粒填料和加压的液体流动相,本法具有分离性能高、分析速度快的特点。
HPLC方法验证及方案
SECTION XV SECTION 15 Analytical Methods(TYPICAL ANALYTICAL METHOD VALIDATION)1.PURPOSET he purpose of this Standard Analytical Procedure is to demonstrate the procedure required to validate in-house HPLC analytical methods and to show that the methods are stability-indicating. Methods based on the USP but modified for stability indicating test purposes require full in-house validation.This procedure ensures that the Product Development Process and Process Qualification Batch analysis is based on a foundation of Good Laboratory Practice using validated test procedures.2.RESPONSIBILITYThe Head of Analytical Development in coordination with the managers of QC and Regulatory Affairs at the proposed manufacturing site.3.FREQUENCYFor each non-compendial analytical method intended for ANDA (or OTC ANDA) manufactured products.For Stability-Indicating Assays and limit testing of impurities that may be based on compendial methods. Each Product strength will follow the full method validation procedure.4.PROCEDURE[a].Method ValidationNon-compendial methods validation will follow the USP direction for parameters needed for the validation of test methods.Typical parameters for validating assays and other non-compendial analytical methods designed for providing quantitative results shall include :• Accuracy• Recovery• Precision ( System reproducibility, Method reproducibility )• Specificity• Linearity• Range• Ruggedness (different analyst s / days /different equipment models / columns) [b].Placebo Analysis.A mixture of non-actives (placebo) shall be prepared and subjected to analysis.No interfering peaks shall be observed in the graph of the placebo chromatogram.[c].The stability of the Standard solution is assessed by re-injection of the standard solution after24 x n hours (where n = number of days the Standard will be used).Standard Preparation for AssayComparison of standard solutions for Assay of Active material, injected after one month and freshly prepared demonstrate that the standard solutions are stable and does not lose its quality after one month if refrigerated.Standard Preparation for ImpurityComparison of standard solutions of Guanine, injected after one month and freshly prepared demonstrate that the standard solutions are stable and does not lose its quality after 1 month if refrigerated.Name of standards Storage conditions Difference. relativeto freshly preparedstandard[Active] 100%4°C<2%[Impurity] 100%4°C<2%Standard Solutions are stored at controlled temperatures and light conditions as per labeling.[d].Stability Indicating Procedures.For the Stability Indicating Method, the product sample shall include forced degradation by stressed analysis. Conditions of concentration and reaction time may vary depending on the active drug substance and drug product e.g. :• Oxidation-(H2O2 plus standing time).• Base Hydrolysis-(NaOH x N plus standing time).• Acid Hydrolysis-(HCl conc. plus standing time).• Sun light-(24 hours standing time).• Heat-(x degrees C).Summary of Stability Indicating ResultsStressed Conditions Temp.Time Raw Material;Tablets(°C)(hr)RemainingSubstance.(%)Peak Purity,(Figure)RemainingSubstance(%)PeakPurity,(Figure)Solution heating9012100.2pure98pure Solid heating160 2101.3pure92pure Sunlight 765 w/m24014101.1pure84.8pure 3,3N Sodium Hydroxide701099.8pure100.2pure 10%Hydrogen Peroxide37 377.5pure90.5pure 5% Hydrochloric Acid Room2079.7pure78.6pure[e]Specificity and Suitability (Resolution and Tailing Factors).When a satisfactory separations of all the degradation peaks have been achieved through the forced degradation reactions, a Resolution Factor (according to the USP requirements) between the main active peak and the nearest degradant peak is calculated using the USP formula.A Tailing Factor (according to the USP formula) is calculated for the main active peak.[f] System Suitability TestA mixture of [Active] AS. standard at the concentration about [0.1]mg/mL and of [Impurity] AS. standard at the concentration about [0.01]mg/mL according to Method SI-1000 was prepared and injected into the HPLC system.For chromatogram obtained the following values were calculated (according to USP):1. Relative Retention Time for [Impurity] peakRRT = RT [Impurity] = 2.65 =0.31RT [Active] 8.452. Tailing factor for [Active] peakT=W2=94.2= 1.1f 0.05 fThe values depict the specificity of the method for resolution between the main peak and impurity peak. (values shown for demonstrations purposes).Peak PurityThe photo diode-array is used for the evaluation of the stability indicating nature of the assay method number SI-1000 for [000]mg and [000]mg tablets using a Waters 996™ Unit, controlled by the chromatography manager Millennium 2010™.Peak purity and match results are reported as:Purity Angle is a measure of spectral non-homogeneity across a peak - i.e. the weighed average of all Spectral Contrast Angles calculated by comparing all spectra in the integrated peak against the peak apex spectrum.Purity Threshold is the sum of Noise Angle and Solvent Angle. It is the limit of detection of shape differences between two spectra.Match Angle is a comparison of the spectrum at the peak apex against a library spectrum.Match Threshold is the sum of the Match Noise Angle and Match Solvent Angle. Noise Angle is a measure of spectral non-homogeneity caused by system noise.Peak Purity (Cont.)Solvent Angle is a measure of spectral non-homogeneity caused by solvent composition.It the purity angle is smaller than the purity threshold and the match angle is smaller than the match threshold, this indicates that no significant differences between spectra are detected. There is no spectroscopic evidence for co-elution and the peak is considered pure.[f]Relative Retention Time of Main and Additional peaks.Each stressed analysis shall indicate the percentage by which the Main peak is decreased as well as the RRT for any other Additional peaks.If the RRT of an Additional peak corresponds to a known degradant/impurity etc. it shall be stated.The peak purity of the main peak shall be given for each stressed analysis (where possible).[g].Validation of limit testing for impurity methods shall include :*Specificity*Detection Limit(DL)*Quantitation Limit(QL)Detection Limit (DL)The detection limit of an individual analytical procedure is the lowest amount of analyte in a sample which can be detested but not necessary quantitated as an exact value.Quantitation Limit(QL)The Quantitation limit of an individual analytical procedure is the lowest amount of analyte in a sample which can be quantitatively determined with suitable precision and accuracy. Used in the determination of impurities and or degradation products.[h].Contents of a typical HPLC Analytical Validation Protocolrefer Method No. A-0340-01-1299Validation of HPLC Analytical MethodMethod No: A-0340-01-1299[1]Introduction - A brief description is given of the following parameters :*Method and Edition # used*Batch # of samples tested (test the lowest and the highest label strength)*Type of detector used to analyze stressed samples*Stress testing of Standard solution to determine origin of Additional peaks.[2]System Reproducibility - PrecisionTen replicate (single) injections of the standard solution at the nominal concentration described in the method is performed and the RSD calculated. The Results (sample # and peak areas) are tabulated. The Average Peak Area, SD and RSD are shown in the table. Target values for RSD = 0.5 to 1.0(Keep this standard solution for the stability of Standard Solutions - Point 9)SYSTEM REPRODUCIBILITYSAMPLE No.PEAK AREAS1.2.3.4.5.6.7.8.9.10.Average Peak Area Standard Deviation Relative Standard Deviation === 0.5 - 1.0[3]Method Reproducibility - PrecisionThe full analytical method # is carried out and repeated Ten times on the finished product (batch #) and the RSD is calculated. Two HPLC injections are performed per method assay and the peak areas are averaged. The Results (assay %) are tabulated. The Average Assay %, SD and RSD are calculated and shown in the tabulations. Target values for RSD = 1.5 to 3.0.METHOD REPRODUCIBILITYSAMPLE NoBatch No:ASSAY %12345678910Average Assay % Standard Deviation Relative Standard Deviation.=== 1.5 - 3.0[4]AccuracyThe Accuracy of an analytical procedure expresses the closeness of agreement between the true value and the value found.Ten replicate (single) injections of the standard solution at the nominal concentration of x mg/100 mL as described in the Analytical Method / Ed # [00] is made and the percent deviation from the true values as determined from the linear regression line is calculated.The Results (Peak areas and % accuracy) are tabulated.The Mean, SD and C.of.V are shown in the tabulations[4]Accuracy (continued).A C C U R A C YINJECTIONNo PEAKAREACALCULATEDCONC.%ACCURACY12345678910Mean (% Accuracy) =Standard Deviation =% Coef. of Variation =[5]Recovery (Extraction time)The extraction efficiency is demonstrated by varying the extraction time of prepared sample solutions as described in the analytical method #. Two HPLC injections are performed per method assay and the peak areas are averaged. The extraction time suitable to ensure complete extraction is highlighted.Not less than three different extraction times are used namely 0.5 T, T and 1.5 T (where T is the extraction time of the method).[5]Recovery (Extraction time - tabulations continued).The Results (Extraction time and Assay %) are tabulated as shown.RECOVERY - EXTRACTION% ASSAYTIME IN MINUTESBatch No:0.5 TT1.5 T[6]Recovery (spiked placebo samples).Five spiked admixtures of the active substance and the non-active vehicle (placebo) at concentrations of about 50 % to 150 % of the stated concentration required by the assay procedure is prepared and analyzed to show the percentage active recovery. Two HPLC injections are performed per method assay and the peak areas are averaged.The Results (Theoretical conc. Actual conc. and % recovery ) are tabulated.The Average Recovery, SD and the % Coefficient of Variation are given.[6]Recovery (spiked placebo samples tables - continued).T he recovery results are shown graphically (peak area Vs conc. (mg/100 mL). These results also show extraction method and detector linearity.RECOVERYStandard solution mg/100mL Peak Area =CONC. Theoretical (mg/100ml)PEAK AREAFOUNDCONC.FOUND(mg/100ml)PERCENTAGERECOVERY5075100125150Mean (% Recovery) =Standard Deviation =% Coef of Variation =The Linear Regression value, Slope and Y-Intercept are shown in the GRAPH. The placebo chromatogram (vehicle only) is shown to highlight the absence of Additional Peaks[7]Linearity and range.T he linearity on an analytical procedure is its ability (within a given range) to obtain test results which are directly proportional to the concentration (amount) of the analyte in the test sample.F ive Standard solutions in a concentration range of (about) 50 % to 150 % of the stated concentration required by the assay procedure are prepared and analyzed by the stated method.T wo HPLC injections are performed per method assay and the peak areas are averaged.[7]Linearity and range - (continued).T he Area count and concentration range is plotted. Linear regression analysis willdemonstrate the acceptability of the method for quantitative analysis over the full spectrum of the concentration range. Detector linearity is demonstrated.The Results (Range conc. and peak areas ) are tabulated.LINEARITY AND R A N G ECONC. Batch No:PEAK AREAS50 %75 %100 %125 %150 %Linear RegressionY-Intercept Slope ===The results are shown graphically (peak area Vs range conc. (mg/100 mL).GRAPH OF LINEARITYConc. mg/100mLPe akAre a200004000060000800001000001200000255075100125150[8]RUGGEDNESS&Robustness.Ruggedness measures the lack of ex ternal influence on the test results whereas robustness measures the lack of in ternal influences on the test results.The Robustness of an analytical procedure is a measure of its capacity to remain unaffected by small but deliberate variations in method parameters and thus providing an indication of its reliability normal usage.The method may be evaluated for specificity using two different columns. No differences in specificity, selectivity or column performance should be observed. RobustnessRobustness determinations are essential when transferring analytical methods from the development laboratory to the commercial plant quality control laboratory. There may usually be a difference in columns or HPLC machine models used. Deliberate variations according to the following table were made to the critical parameters of the method such as column, flow rate and concentration of [organic acid] in the mobile phase. Using the System Suitability solution and LOQ solution as the Test Solutions the performance of the method was evaluated. Column 1: Phenomenex Bondclone 10µ, C-18, 300 x 3.9mm (OOH-2117-CD) Column 2: Waters µ-Bondapak 10µ, C-18, 300 x 3.9mm (27324)C O ND I T I O N RE S U L T SConditionNo.Column Flow RatemL/minBufferConc. (%)RRT T f RSDbet. LOQ of[Active]RSDbet. LOQ of[Impurity]11 2.50.10.3 1.1<10<1021 2.20.10.3 1.1<10<1031 2.80.10.3 1.1<10<1041 2.50.150.3 1.1<10<1052 2.50.10.3 1.1<10<10Notes on different terms frequently used:INTERMEDIATE PRECISIONT he analytical variation expressed between laboratories on different days; with different equipment; or different analysts is known as - intermediate precision. REPRODUCIBILITY (INTRA-LAB)T his intra-laboratory precision or the precision between laboratories is known as reproducibility or more specifically - intra-laboratory reproducibility. Both the above are ruggedness - and a USP requirement.[8]RUGGEDNESS&Robustness- (Tabulations - continued).The Results (Average assay % for Analyst 1 and 2 ) are tabulated.RUGGEDNESSANALYSTNo 1%ASSAYColumn IANALYSTNo 2%ASSAYColumn 212345678910Mean (% Accuracy) =Standard Deviation =% Coef of Variation =R obustness.The evaluation of robustness should be finalized at the end of the development phase - around the time of the process qualification lot manufacture. The robustness evaluation should be developed with the commercial laboratory equipment in mind. It should show the reliability of an analysis with respect to deliberate variations in the method parameters A consequence of robustness evaluation is that a series of system suitability parameters are established to ensure that the validity of the analytical procedure is maintained whenever used.Robustness is defined by both the USP and the ICH Tripartite guidelines as "a measure of its capacity to remain unaffected by small but deliberate variations in method parameters and provides an indication of its reliability during normal use " Robustness is defined both in the USP and ICH, but is not required.[9]Stability of Standard solutionsRe-chromatography of ten replicate single injections of the same standard solution (which have been allowed to stand for x hours ) against freshly prepared Standards showed no significant differences from the original results.STABILITY OF STANDARD SOLUTIONSmg/100mL Initial Analysis(Date)mg/100mL Repeat Analysis 2nd (Date)1 injection2 injection3 injection4 injection5 injection6 injection7 injection8 injection9 injection10 injection1 injection2 injection3 injection4 injection5 injection6 injection7 injection8 injection9 injection10 injectionMeanStandard Deviation Relative Standard Dev.=== NMT 2.0 %[10]Typical Chromatograms.Representative chromatograms of the following traces are routinely provided:-♦ System Suitability♦ Standard Solution♦ Drug Product♦ placeboTypical ChromatogramsWhen R epresentative Chromatograms are displayed - all peaks are LABELED with the peak name and RRT.R epresentative chromatogramDrug Product[11]Conclusion .(Closing Statement)A n appropriate conclusion should be given stating clearly that:“The method # IAG00-005 Ed. No [00] is shown to be accurate and precise for carrying out assay analysis as part of the Assay and Stability Studies for the Drug Product conforming to the formula as shown in Appendix 1”[12]References and Appendixes.A cknowledgment to references as well as attachments such as the drug productformula are attached at the end of the validation protocol.I t is important to emphasize that analytical validation applies to a drug formula anda set manufacturing procedure. Extraneous peaks and processing stresses are specific to a manufacturing procedure, equipment used and the nature of the excipients.References:1. "Validation of compendial methods" USP 23 <1225> USPC Rockville Maryland USA 1994.2. USP/NF XXIII USPC Rockville Maryland USA 1994.3. Scale up and Post approval Changes Manufacturing and Controls In vitro Dissolution and In Vivo Bioequivalence Documentation CEDER 1995 (SUPAC)4. International Conference on Harmonization "Guidelines on validation of Analytical Procedures:Definitions and Terminology; Federal Register (March 1, 1995.)5. ASTM Standard Guide For Conducting Ruggedness Tests E1169 American Society for testing Materials Philadelphia 1989.6. G. Kateman and L. Buydens, T he Ruggedness Test Quality Control in the Analytical chemistryJohn Wiley and Sons NY 2nd Edition 1993, pp118 125.Label the peakclearlyName and Retention time (8.78 min)。
HPLC有关物质分析方法验证

数据要求:需报告平均值,RSD。
6、精密性
• 报告数据:
• 1、回收率、 • 2、平均回收率、 • 3、RSD
• 评价:
• 1、回收率应为90%~110% • 2、RSD不得不小于10%
7、溶液稳定性
• 供试溶液与对照溶液分别放在室温和冷 藏下保存,分别在不同步间测定HPLC
RSD S 100% x
6、精密性
1. 反复性:
A、在相同条件下,由同一种分析人员测定所得成果旳精密度; 在要求旳范围内,至少用9次测定成果评价,如制备三个不同 浓度样品各测三次或 (回收率法) B、把被测物浓度看成100%,至少测6次进行评价。 (样品测定法)
6、精密性
2. 中间精密度 同一试验室,不同步间 由不同分析人员用不同设备所得成果旳精密 度。
如不能测得杂质旳相对响应因子,可在线测定杂 质旳有关数据,如采用二极管阵列检测器测定紫外光 谱,当杂质旳光谱与主成份旳光谱相同,则可采用原 料药旳响应因子近似计算杂质含量(本身对照法)。
5、响应因子
已知杂质相对与主成份在HPLC上旳响应比值
计算措施:
(1)可直接用主成份对照品及杂质对照品进行测定。
2、敏捷度
LOD试验措施
•空白溶剂 •系统合用性溶液5针 •杂质对照品溶液进1针 •根据上一针杂质对照品旳S/N值进行稀释进样 •直到S/N为约3时,平行进样3针。 •系统合用性溶液1针 •图谱打印: •杂质对照溶液及其稀释液均要以performance+noise格式打印。 系统合用必至少有一针用extend performance格式打印
1、专属性 报告数据:
HPLC分析方法验证指导原则
HPLC分析方法验证指导原则HPLC分析方法验证指导原则产品质量标准分析方法验证的目的是证明采用的方法适合于相应检测要求。
在建立产品质量标准时,分析方法需经验证;在产品生产工艺变更、配方的组分变更、原分析方法进行修订时,则质量标准分析方法也需进行验证。
方法验证理由、过程和结果均应记载在产品标准起草说明或修订说明中。
需验证的分析项目有:鉴别试验,杂质定量检查或限度检查,有效成分含量测定,以及其他成分(如防腐剂等)的测定。
验证内容有:准确度、精密度(包括重复性、中间精密度和重现性)、专属性、检测限、定量限、线性、范围和耐用性。
视具体方法拟订验证的内容。
附表中列出的分析项目和相应的验证内容可供参考。
方法验证内容如下:一、准确度准确度系指用该方法测定的结果与真实值或参考值接近的程度,一般用回收率(%)表示。
准确度应在规定的范围内测试。
1.含量测定方法的准确度原料药可用已知纯度的对照品或样品进行测定,或用本法所得结果与已知准确度的另一个方法测定的结果进行比较。
制剂可用含已知量被测物的各组分混合物进行测定。
如不能得到制剂的全部组分,可向制剂中加入已知量的被测物进行测定,或用本法所得结果与已知准确度的另一个方法测定结果进行比较。
如该分析方法已经测试并求出了精密度、线性和专属性,在准确度也可推算出来的情况下,这一项可不必再做。
2.杂质定量测定的准确度可向原料药或制剂中加入已知量杂质进行测定。
如不能得到杂质或降解产物,可用本法测定结果与另一成熟的方法进行比较,如药典标准方法或经过验证的方法。
在不能测得杂质或降解产物的响应因子或对原料药的相对响应因子情况下,可用原料药的响应因子。
应明确表明单个杂质和杂质总量相当于主成分的重量比(%)或面积比(%)。
3.数据要求在规定范围内,至少用9个测定结果进行评价,例如,设计3个不同浓度,每个浓度各分别制备3份供试品溶液,进行测定。
应报告已知加入量的回收率(%),或测定结果平均值与真实值之差及其相对标准偏差或可信限。
HPLC验证方案

设备/系统名称:高效液相色谱仪设备/系统型号:Waters515泵、2487检测器方案编号: VM-QC-001-01仪器编号: R211-JY-04目录1.目的 (4)2.范围 (4)3.组织与分工 (4)4.偏差解决 (5)5.变更控制 (5)6.确认内容 (5)安装确认 (5)运行确认 (7)性能确认 (8)7.验证结果汇总及评价 (12)8.验证周期 (13)9.设备确认总结报告 (14)10.附件 (14)偏差记录 (15).偏差和解决报告 (16).附录文件清单 (17)11. 方案完成后审核/批准 (18)1.目的为确认waters515HPLC+waters UV2487高效液相色谱系统测试数据准确可靠,性能稳定,特制订本验证方案,对高效液相色谱仪进行验证。
验证过程应严格按照本方案规定的内容进行。
2.范围设备验证内容包括:安装确认、运行确认、性能确认。
该方案适用于本公司实验室高效液相色谱系统的验证。
3.组织与分工成员组成:分工(1)由QC负责制订本验证方案。
(2)由QA负责确认本验证方案。
(3)由QC负责进行本验证方案的具体执行。
(4)由QC负责编写验证报告。
.职责划分:(1)验证小组负责本验证方案的设计、批准及实施。
(2)QC负责按本验证方案对受试仪器进行验证,并及时报告验证结果,提供验证原始数据。
(3)验证小组组长全面协调各项验证工作,负责报告验证结果、审核验证的评价与建议以及相应的结论,并在验证过程中提供相关的技术支持。
4. 偏差解决偏差指的是任何的测试失败,偏离规格,缺失文件,或重大偏离已建立的程序而导致潜在的GMP符合性影响。
对于一个偏差事件,偏差必须被审核并评估确定导致偏差的根源。
另外,根据设备的状态对偏差的影响进行分析。
如必要,必须进行偏差原因的调查,将调查结果包括在“偏差和解决报告”中,偏差的解决(如需要采取的纠正措施,或不采取任何纠正措施但接受该偏差)和说明也包括在“偏差和解决报告”中,如需要纠正措施将会影响部分确认,这些部分的确认测试将延迟至改正措施完成。
HPLC分析方法的开发与验证

HPLC分析方法的开发与验证分析方法开发与验证在不同行业有不同的要求,医药化学行业对于质量的控制非常严格,高效液相分析是控制产品质量的重要手段,其开发与验证对其它行业有很好的借鉴意义。
一、分析方法开发(Development)分析方法的开发主要包括色谱柱的选择、流动相的选择、检测波长的选择和梯度的优化几个方面。
目前高效液相多做反相使用,所以本文主要以反相为例进行讲解。
1. 色谱柱的选择(Column)原料药生产对产品的纯度和杂质含量的要求非常苛刻,要求检测使用的色谱柱有较高的理论塔板数,能提供更好的分离度,从而对可能存在的杂质有更大的分离的可能性,所以5um填料的色谱柱长要250mm,3.5um填料的柱长要150mm,基本上都是各个粒径柱长最长的。
我比较喜欢近两年新出的亚二微米填料的色谱柱,50mm柱长就能提供很高的理论塔板数,而且柱长和粒径小了,流速增加很多,能节省很多的分析时间,极大的提高工作效率。
一般选用直径为4.6mm或3.0mm的柱子,太细了可能会增大柱外效应。
填料的孔径对于小分子合成药物不需要考虑,普通的分析柱都在100A左右,能满足分析检测的需要。
对于API分析方法开发,一般要求必须做色谱柱的筛选实验,最少使用三种不同类型的色谱柱,每种类型三只,要来自于不同厂家。
三种类型包括:▪1) 普通的C18或C8色谱柱,如Waters的Symmetry C18或C8,YMC的Pack Pro C18或C8,Agilent的Zorbax Eclipse C18等,其它公司如菲罗门和热电也有相应的色谱柱;▪2) 封端处理或者极性嵌入型色谱柱,如Waters的SymmetryShield RP18或RP8,XTerra RP18或RP8,YMC的ODS AQ,AgilentZorbax Bonus-RP,DIKMA SpursilC18等,其它公司如“菲罗门”(Luna)和“热电”(Hypersil 、Syncronis)也有相应的色谱柱;▪3) 填料用其它官能团修饰过的色谱柱,如苯基、氨基、氰基等色谱柱等,很多公司都有。
HPLC验证方案
H P L C验证方案(总15页)--本页仅作为文档封面,使用时请直接删除即可----内页可以根据需求调整合适字体及大小--设备/系统名称:高效液相色谱仪设备/系统型号: Waters515泵、2487检测器方案编号: VM-QC-001-01仪器编号: R211-JY-04目录1.目的 (4)2.范围 (4)3.组织与分工 (4)4.偏差解决 (5)5.变更控制 (5)6.确认内容 (5)安装确认 (5)运行确认 (7)性能确认 (8)7.验证结果汇总及评价 (12)8.验证周期 (13)9.设备确认总结报告 (14)10.附件 (14)偏差记录 (15).偏差和解决报告 (16).附录文件清单 (17)11. 方案完成后审核/批准 (18)1.目的为确认waters515HPLC+waters UV2487高效液相色谱系统测试数据准确可靠,性能稳定,特制订本验证方案,对高效液相色谱仪进行验证。
验证过程应严格按照本方案规定的内容进行。
2.范围设备验证内容包括:安装确认、运行确认、性能确认。
该方案适用于本公司实验室高效液相色谱系统的验证。
3.组织与分工成员组成:分工(1)由QC负责制订本验证方案。
(2)由QA负责确认本验证方案。
(3)由QC负责进行本验证方案的具体执行。
(4)由QC负责编写验证报告。
.职责划分:(1)验证小组负责本验证方案的设计、批准及实施。
(2)QC负责按本验证方案对受试仪器进行验证,并及时报告验证结果,提供验证原始数据。
(3)验证小组组长全面协调各项验证工作,负责报告验证结果、审核验证的评价与建议以及相应的结论,并在验证过程中提供相关的技术支持。
4. 偏差解决偏差指的是任何的测试失败,偏离规格,缺失文件,或重大偏离已建立的程序而导致潜在的GMP符合性影响。
对于一个偏差事件,偏差必须被审核并评估确定导致偏差的根源。
另外,根据设备的状态对偏差的影响进行分析。
如必要,必须进行偏差原因的调查,将调查结果包括在“偏差和解决报告”中,偏差的解决(如需要采取的纠正措施,或不采取任何纠正措施但接受该偏差)和说明也包括在“偏差和解决报告”中,如需要纠正措施将会影响部分确认,这些部分的确认测试将延迟至改正措施完成。
HPLC方法验证
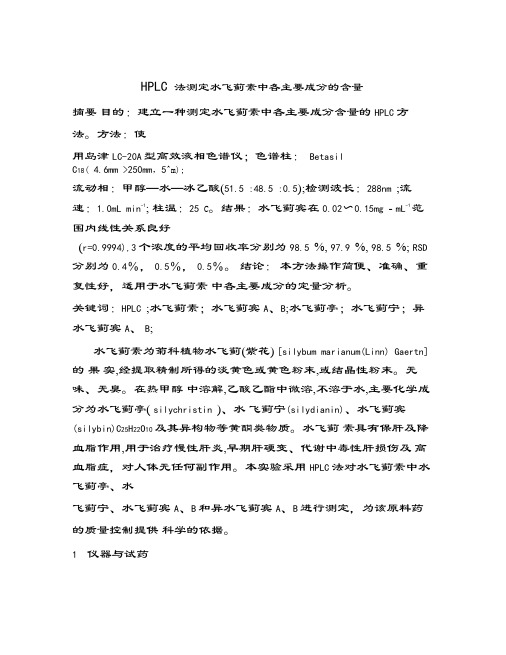
HPLC 法测定水飞蓟素中各主要成分的含量摘要目的:建立一种测定水飞蓟素中各主要成分含量的HPLC方法。
方法:使用岛津LC-20A型高效液相色谱仪;色谱柱:BetasilC18( 4.6mm >250mm,5^m);流动相:甲醇—水—冰乙酸(51.5 :48.5 :0.5);检测波长:288nm ;流速:1.0mL min-1; 柱温:25 C。
结果:水飞蓟宾在0.02〜0.15mg - mL-1范围内线性关系良好(r=0.9994),3个浓度的平均回收率分别为98.5 %, 97.9 %, 98.5 %; RSD 分别为0.4%,0.5%,0.5%。
结论:本方法操作简便、准确、重复性好,适用于水飞蓟素中各主要成分的定量分析。
关键词:HPLC ;水飞蓟素;水飞蓟宾A、B;水飞蓟亭;水飞蓟宁;异水飞蓟宾A、B;水飞蓟素为菊科植物水飞蓟(紫花) [silybum marianum(Linn) Gaertn] 的果实,经提取精制所得的淡黄色或黄色粉末,或结晶性粉末。
无味、无臭。
在热甲醇中溶解,乙酸乙酯中微溶,不溶于水,主要化学成分为水飞蓟亭( silychristin )、水飞蓟宁(silydianin)、水飞蓟宾(silybin)C25H22O10及其异构物等黄酮类物质。
水飞蓟素具有保肝及降血脂作用,用于治疗慢性肝炎,早期肝硬变、代谢中毒性肝损伤及高血脂症,对人体无任何副作用。
本实验采用HPLC法对水飞蓟素中水飞蓟亭、水飞蓟宁、水飞蓟宾A、B和异水飞蓟宾A、B进行测定,为该原料药的质量控制提供科学的依据。
1仪器与试药岛津LC-20A型高效液相色谱仪,紫外可见检测器,赛多利斯BT25S电子天平(0.01mg),DC-DS2060型超声清洗器,上海亚荣生化仪器厂SZ-93型自动双重纯水蒸馏器。
HPLC级甲醇(TEDI A公司,批号:Lot608012) ; HPLC级冰乙酸(sigma 公司,批号:2014807 );对照品水飞蓟亭、水飞蓟宁、水飞蓟宾均购自美国sigma公司,供试品水飞蓟素为本公司生产(批号为140429 )。
分析方法验证报告

分析方法验证报告1. 引言分析方法验证是一项对分析方法进行评估和确认的过程,在药物研发、食品安全、环境监测等领域具有重要意义。
本文将对分析方法验证的步骤和要点进行分析和总结。
2. 分析方法验证步骤分析方法验证包括以下步骤:2.1 确定验证目的和要求在进行分析方法验证之前,首先需要明确验证目的和要求。
验证目的一般包括了解分析方法的适用范围、确定分析方法的精密度和准确度等。
2.2 设计验证方案根据验证目的和要求,设计合理的验证方案。
验证方案应包括验证样品的选取和制备、验证参数的设定和测定、验证方案的可行性和有效性评估等内容。
2.3 实施验证实验根据验证方案,进行验证实验。
验证实验应按照一定的顺序和方法进行,确保数据的准确性和可靠性。
2.4 数据处理和分析对验证实验获得的数据进行处理和分析,计算分析方法的精密度、准确度、线性范围等性能指标。
根据分析结果,评价分析方法的可靠性和适用性。
2.5 编写验证报告根据验证实验和数据分析的结果,编写验证报告。
验证报告应包括验证方法、验证结果、验证数据、验证结论等内容,并应符合相关的法规和标准要求。
3. 分析方法验证要点3.1 精密度精密度是评价分析方法重复性的指标,可通过测定同一样品的多重平行测定来评价。
常用的评价方法包括计算相对标准偏差(RSD)或方差等。
3.2 准确度准确度是评价分析方法准确性的指标,可通过测定已知含量的参考物质(标准品)进行评价。
常用的评价方法包括计算回收率、偏差(bias)等。
3.3 线性范围线性范围是评价分析方法线性关系的指标,可通过测定一系列标准品的浓度与响应(信号强度)之间的关系来评价。
常用的评价方法包括计算回归方程、相关系数等。
3.4 特异性特异性是评价分析方法选择性的指标,即分析方法可以准确地识别和测定目标分析物,而不受其他干扰物的影响。
3.5 确定性确定性是评价分析方法稳定性的指标,即分析方法在不同的实验条件下是否能获得一致的结果。
制剂仿制药HPLC含量方法验证方案
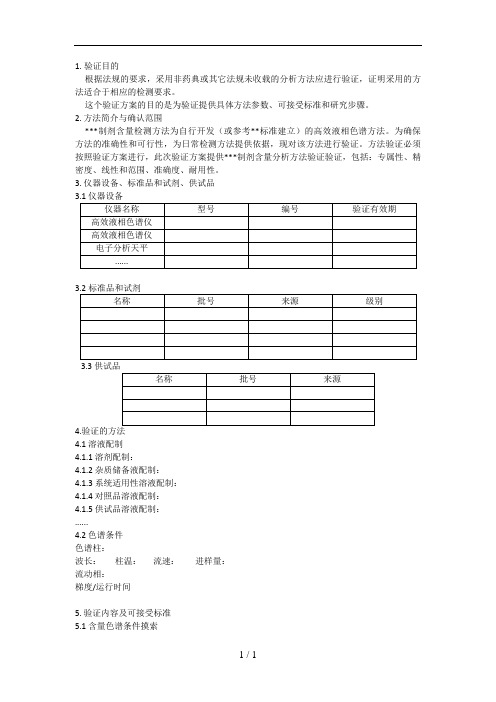
1.验证目的
根据法规的要求,采用非药典或其它法规未收载的分析方法应进行验证,证明采用的方法适合于相应的检测要求。
这个验证方案的目的是为验证提供具体方法参数、可接受标准和研究步骤。
2. 方法简介与确认范围
***制剂含量检测方法为自行开发(或参考**标准建立)的高效液相色谱方法。
为确保方法的准确性和可行性,为日常检测方法提供依据,现对该方法进行验证。
方法验证必须按照验证方案进行,此次验证方案提供***制剂含量分析方法验证验证,包括:专属性、精密度、线性和范围、准确度、耐用性。
3. 仪器设备、标准品和试剂、供试品
3.3
4.
4.1 溶液配制
4.1.1 溶剂配制:
4.1.2 杂质储备液配制:
4.1.3 系统适用性溶液配制:
4.1.4 对照品溶液配制:
4.1.5 供试品溶液配制:
......
4.2 色谱条件
色谱柱:
波长:柱温:流速:进样量:
流动相:
梯度/运行时间
5. 验证内容及可接受标准
5.1 含量色谱条件摸索
6. 样品测定
应用本方法,对3批样品进行测定,系统适用性应符合标准规定,样品含量应能够符合限度要求。
- 1、下载文档前请自行甄别文档内容的完整性,平台不提供额外的编辑、内容补充、找答案等附加服务。
- 2、"仅部分预览"的文档,不可在线预览部分如存在完整性等问题,可反馈申请退款(可完整预览的文档不适用该条件!)。
- 3、如文档侵犯您的权益,请联系客服反馈,我们会尽快为您处理(人工客服工作时间:9:00-18:30)。
XXX产品HPLC分析方法确认方案XXX制药有限公司确认方案审批表确认方案名称: XXX产品HPLC分析方法确认方案确认方案编号:KY-ZL-YZ-FF-00400目录1 概述2 确认目的3 确认范围4 确认小组成员与职责5 确认方案的审核与批准6 进度计划7 确认内容8 变更与偏差9 确认结果与评价报告10 确认合格证书1 概述我公司产品XXX产品采自《中国药典》2010年版二部,含量及有关物质、A、B、C 的检验均使用高效液相色谱仪进行检验,两个检验项目检验参数等条件完全相同,且我公司未对《中国药典》2010年版二部中的方法进行过任何改变,因此按照2010新版GMP要求,需要进行分析方法确认。
本确认方案使用LC-2010AH型高效液相色谱仪对XXX产品采用《中国药典》2010年版二部“含量”、“有关物质”及“A、B、C”的检验方法进行确认,证明此方法在本公司实验室的适用性。
根据《药品GMP指南(质量控制实验室与物料系统)》分册要求,“含量”、“有关物质”及“A、B、C”项需确认项目如下:“是”代表该项内容需确认,“否”代表该项内容不需要确认2确认目的通过对XXX产品含量及有关物质A、B、C的检验方法的确认,证明此方法在本公司实验室的适用性。
3确认范围本确认方案适用于XXX产品含量及有关物质A、B、C、的检验方法进行确认。
4确认小组成员与职责5确认方案的起草与审批5.1 确认方案的起草与审批:确认方案由检验室起草,确认小组会审,质量负责人批准实施。
5.2 确认方案的培训:确认方案经批准后,实施前由确认方案的起草部门组织确认方案的参与者进行培训。
5.3 确认方案的修改:确认方案如需修改,由质量负责人批准实施,在确认报告中体现。
6 进度计划整个确认活动实施时间:确认时间:从_____年___月__日至_____年__ 月__ 日;起草报告:从_____年___月__日至_____年__ 月__ 日;7 确认内容7.1确认前仪器及材料检查7.1.1确认前,对下列试验用仪器和材料进行检查7.1.1.1岛津高效液相色谱仪7.1.1.2 TG-332A型分析天平7.1.1.3色谱柱:C18(4.6*250㎜)7.1.1.4对照品和试剂:产品X二醇物对照品、对硝基苯甲醛对照品、产品X对照品、羟苯甲酯对照品、羟苯乙酯对照品、羟苯乙酯对照品、庚烷磺酸钠,乙腈(色谱级),甲醇(色谱级),磷酸二氢钾、三乙胺、磷酸、蒸馏水7.1.1.5其他一些辅助的玻璃仪器(如量瓶、移液管等)7.1.2可接受标准:仪器和用具经校验且在效期内;对照品、试液、试剂与试药符合验证要求且在效期内;色谱柱使用状态正常。
7.1.3结果记录:将结果记录在附件1《确认前仪器及材料检查表》中。
7.2确认涉及文件检查7.2.1确认前,对与此次确认相关的文件进行检查7.2.1.1XXX产品成品检验操作规程(KY-ZL-SOP-CP-00400)7.2.1.2 型高效液相色谱系统标准操作及维护保养规程(KY-SB-SOP-JY-03700)7.2.1.3 型高效液相色谱系统维护保养及清洁操作规程(KY-WS-SOP-JY-03700)7.2.1.4TG-332A型分析天平标准操作规程(KY-SB-SOP-JY-02300)7.2.1.5TG-332A型分析天平维护保养及清洁标准操作规程(KY-WS-SOP-JY-023007.2.1.6高效液相色谱法标准操作规程(KY-ZL-SOP-ZK-03300)7.2.1.7XXX产品HPLC分析方法的验证方案(KY-YZ-SOP-JY-00400)7.2.1.8XXX产品生产工艺规程(KY-SC-JB-GY-00400)7.2.1.9检验方法验证(确认)管理程序(KY-ZL-SMP-05800)7.2.2可接受标准:所有文件都应为现行版本,且经过批准。
7.2.3结果记录:将结果记录在附件2《确认前文件检查表》中。
7.3人员培训确认7.3.1检查并确认所有参与执行确认的人员是否已得到培训,并在培训记录上签字。
7.3.2可接受标准:验证小组成员均已经过培训,并在培训记录上签字。
7.3.3确认结果:将确认结果填入附件3《人员培训、参与情况确认记录》中。
7.4 确认项目7.4.1 “含量”项确认7.4.1.1重复性/准确度7.4.1.1.1空白基质的制备:精密称定硼酸:13.125g硼砂:0.6g玻璃酸钠:1g羟苯乙酯:0.5g按照XXX产品生产工艺规程(KY-SC-JB-GY-00400)配制加注射用水至1000ml。
7.4.1.1.2对照液制备:称取产品X对照品用注射用水配制成1ml含2.5mg的溶液,取本品用流动相定量稀释制成每1ml中含0.1mg的溶液摇匀,作为对照液备用。
对照液平行制备2份,标识为S-1、S-2(浓度为标示量的100%)。
7.4.1.1.3样品制备:称取产品X对照品用空白基质水溶解后定容,摇匀,备用。
平行制备浓度梯度为标示量80%、100%、120%的样品各3份,标识为A-1、A-2、A-3、A-4、A-5、A-6、A-7、A-8、A-9。
7.4.1.1.4照《高效液相色谱仪标准操作规程》测定。
色谱条件与系统适用性试验用十八烷基硅烷键合硅胶为填充剂;流动相A为0.01mol/L庚烷磺酸钠缓冲溶液(取磷酸二氢钾6.8g,用0.01mol/L庚烷磺酸钠溶液溶解并稀释至1000ml,再加三乙胺5ml,混匀,用磷酸调节PH值至2.5),流动相B为甲醇;检测波长为277nm;按下表进行线性梯度洗脱。
另取产品X对照品、产品X二醇物对照品、对硝基苯甲醛对照品、羟苯甲酯、羟苯乙酯与羟苯丙酯对照品各适量,加甲醇适量(产品X每10mg加甲醇1ml)使溶解,用流动相定量稀释成每1ml中含产品X0.5mg、产品X二醇物40ug与对硝基苯甲醛3ug、羟苯甲酯40ug、羟苯乙酯50ug和羟苯丙酯20ug的混合溶液。
精密吸取该溶液10µl注入色谱仪,作为系统适用性溶液。
记录色谱图。
各相邻峰间的分离度均应符合要求)(应大于1.5)。
7.4.1.1.5测定:精密量取上述A-1、A-2、A-3、A-4、A-5、A-6、A-7、A-8、A-9溶液用流动相定量稀释制成每1ml中含0.1mg的溶液,摇匀,精密量取10ul,注入液相色谱仪,记录色谱图。
1)取S-1精密量取10ul,注入液相色谱仪记录色谱图,该溶液连续进样2针。
2)取S-2精密量取10ul,注入液相色谱仪,记录色谱图,该溶液连续进样1针。
3)分别精密量取稀释后的A-1、A-2、A-3、A-4、A-5、A-6、A-7、A-8、A-9溶液各10ul,注入液相色谱仪,记录色谱图。
4)计算S-1和S-2的F值,相对标准偏差应≤2.0%,以外标法计算稀释后的A-1、A-2、A-3、A-4、A-5、A-6、A-7、A-8、A-9溶液的含量。
结果计算含量(cx)=CR×Ax/ARcx-------- 为供试品的浓度;CR---------为对照品的浓度;Ax-------- 为供试品的峰面积;AR---------为对照品的峰面积。
7.4.1.1.6可接受标准:稀释后的A-1、A-2、A-3、A-4、A-5、A-6、A-7、A-8、A-9各浓度的含量均应在标示量的±3%,且各浓度样品含量的RSD%值应≤2.0%。
确认数据和结果记录于附件4《含量精密度/准确度确认数据和结果》中。
7.4.1.2专属性7.4.1.2.1 测试方法:7.4.1.2.1.1取空白基质进样1针,记录色谱图。
7.4.1.2.1.2 精密量取样品(用成品即可)用流动相A-B(68:32)定量稀释制成每1ml中含产品X0. 1mg的溶液,作为供试品溶液,精密量取10ul,注入液相色谱仪,进样1针,记录色谱图,获得产品X的保留时间。
7.4.1.2.1.3取产品X对照品用流动相定量稀释制成每1ml中含产品X0. 1mg的溶液,作为对照品溶液,注入液相色谱仪,进样1针,记录色谱图,获得产品X的保留时间。
7.4.1.2.1.4可接受标准:溶剂空白相应的峰对样品测定有无明显的干扰;供试品图谱中产品X主峰保留时间与对照品图谱中产品X主峰保留时间一致。
7.4.1.2.1.5 确认记录和数据确认数据和结果记录于附件5《专属性确认数据和结果》中。
7.4.2“有关物质”及“A、B、C”项确认7.4.2.1专属性7.4.2.1.1精密量取样品(用成品即可)用流动相A-B(68:32)定量稀释制成每1ml 中含产品X0.5mg的溶液,作为供试品溶液。
7.4.2.1.2对照溶液;取产品X对照品、产品X二醇物对照品、对硝基苯甲醛对照品、羟苯甲酯、羟苯乙酯与羟苯丙酯对照品各适量,加甲醇适量(产品X每10mg加甲醇1ml)使溶解,用流动相定量稀释成每1ml中含产品X0.5mg、产品X二醇物40ug与对硝基苯甲醛3ug、羟苯甲酯40ug、羟苯乙酯50ug和羟苯丙酯20ug的混合溶液。
作为对照溶液;照含量项下的色谱条件,取对照品溶液10ul,注入液相色谱仪,调节检测灵敏度,使产品X二醇物的峰高约为满量程的64%。
7.4.2.1.3精密量取供试品溶液与对照品溶液各10ul,分别注入液相色谱仪,进样1针,记录色谱图。
7.4.2.1.4可接受标准:供试品图谱中产品X、产品X二醇物、对硝基苯甲醛、羟苯甲酯、羟苯乙酯和羟苯丙酯各峰的保留时间与系统适用性图谱中相对峰的保留时间一致。
溶剂空白相应位置无峰的干扰。
确认数据和结果记录于附件5《专属性确认数据和结果》中。
7.4.2.2精密度 7.4.2.2.1测试程序7.4.2.2.1.1取含量项下系统适用性溶液作为对照溶液D-1;另按同法制备一份对照品作为对照溶液D-2。
7.4.2.2.1.2取样品用含量测定项下的流动相A-B (68:32)定量稀释制成每1ml 中含产品X0.5mg 的溶液,配制6分平行样品作为供试品溶液分别为B-1~B-6。
7.4.2.2.1.3 D-1进样2针,D-2进样1针,然后B-1~B-6分别进针,记录色谱图。
7.4.2.2.1.4各相邻峰之间的分离度应≥1.57.4.2.2.1.5计算D-1和D-2的F 值,相对标准偏差应≤2.0%,以外标法计算B-1、B-2、B-3、B-4、B-5、B-6溶液中各有关物质的含量。
计算:产品X 二醇物(%)=S 二醇物×C 二醇物对照/ S 二醇物对照×C 供试品×100%对硝基苯甲醛(%)=S 对硝基苯甲醛×C 对硝基苯甲醛对照/ S 对硝基苯甲醛对照×C 供试品×100% 羟苯甲酯(%)=S 羟苯甲酯×C 羟苯甲酯醛对照/ S 羟苯甲酯对照×C 供试品×100% 羟苯乙酯(%)=S 羟苯乙酯×C 羟苯乙酯对照/ S 羟苯乙酯对照×C 供试品×100% 羟苯丙酯(%)=S 羟苯丙酯×C 羟苯丙酯对照/ S 羟苯丙酯对照×C 供试品×100%7.4.2.2.1.2可接受标准:6个样品B-1、B-2、B-3、B-4、B-5、B-6含量的RSD%值应≤2.0%。