FLOW----3D操作步骤概要
flow3d 使用说明(英文)
Modelling of groundwater flow in three-dimensional groundwater systems using finite element methods GGU-SS FLOW3DV ERSION 2April 2002Copyright and author: Prof. Johann Buß, BraunschweigContents:1Preface (6)2Installation and language selection (6)3Starting the program (7)4Program concept (7)5Short description (8)6Theoretical principles (10)6.1Overview (10)6.2Differential equation (11)7Explanation of the individual menus and items (13)7.1Overview (13)7.2File menu (14)7.2.1“New” menu item (14)7.2.2“Load” menu item (14)7.2.3“Save” and “Save as” menu items (15)7.2.4“Read ASCII file” menu item (15)7.2.5“Save ASCII file” menu item (15)7.2.6“Print output table” menu item (16)7.2.7“Printer preferences” menu item (17)7.2.8“Print and export” menu item (17)7.2.9“Batch print” menu item (19)7.2.10“Quit” menu item (19)7.2.11“1, 2, 3, 4” menu items (19)7.3Mesh(x/y) menu (20)7.3.1“Preferences” and “Mesh” menu items (20)7.3.2“Outline” menu item (20)7.3.3“Define nodes” menu item (20)7.3.4“Change nodes” menu item (21)7.3.5“Move nodes” menu item (22)7.3.6“Edit nodes” menu item (22)7.3.7“Array” menu item (22)7.3.8“Common systems” menu item (24)7.3.9“Mesh “by hand”” menu item (25)7.3.10“Automatic” menu item (25)7.3.11“Round off” menu item (25)7.3.12“Delete” menu item (26)7.3.13“Optimise” menu item (26)7.3.14“Refine mesh” menu item (27)7.4z menu (30)7.4.1“Standard depths” menu item (30)7.4.2“Standard soil columns” menu item (31)7.4.3“Individual depths” menu item (31)7.4.4“Manipulate depths” menu item (31)7.4.5“Depths in section” menu item (32)7.4.7“Contours (layer thickness)” menu item (33)7.4.8“Define section” menu item (33)7.4.9“Save section” menu item (33)7.4.10“Mesh” menu item (33)7.4.11“Outline” menu item (33)7.4.12“Refine” menu item (34)7.4.13“Unrefine” menu item (34)7.5I mesh menu (34)7.5.1“Interpolation mesh” menu item (34)7.5.2“Nodes” menu item (35)7.5.3“Mesh” menu item (35)7.5.4“Manipulate” menu item (35)7.5.5“Contours” menu item (35)7.5.6“Read/save” menu item (35)7.5.7“Assign” menu item (36)7.6Boundary menu (36)7.6.1“Preferences” menu item (36)7.6.2“Individual potentials” menu item (36)7.6.3“In section” menu item (37)7.6.4“Linear” menu item (37)7.6.5“Single source”, “Line source” and “Area source” menu items (37)7.6.6“Individual soils” and “In section” menu items (38)7.7System menu (38)7.7.1“Info” menu item (38)7.7.2“Project identification” menu item (39)7.7.3“Test” menu item (39)7.7.4“Soil properties” menu item (39)7.7.5“Run” menu item (39)7.8Graphics preferences menu (41)7.8.1“Refresh” menu item (41)7.8.2“Zoom” menu item (41)7.8.3“Pens” menu item (41)7.8.4“Font” menu item (41)7.8.5“WINDOWS font” menu item (41)7.8.6“Mini-CAD” and “Header-CAD” menu items (41)7.8.7“Smarticons1” menu item (42)7.8.8“Smarticons2” menu item (42)7.8.9“Layer/Plane legend” menu item (43)7.8.10“General legend” menu item (44)7.8.11“Soil legend” menu item (44)7.8.12“Section legend” menu item (45)7.8.13“kr = f(u) function legend” menu item (45)7.8.14“Move” menu item (45)7.8.15“Save and Load preferences” menu items (45)7.9Page size and margins menu (45)7.9.2“Manual resize (mouse)” menu item (46)7.9.3“By “hand”” menu item (46)7.9.4“Page size and margins” menu item (46)7.9.5“Font size selection” menu item (46)7.10Evaluation menu (47)7.10.1“Normal contours” menu item (47)7.10.2“Coloured” menu item (48)7.10.3“3D” and “3D array” menu items (48)7.10.4“Discharges” menu item (50)7.10.5“Values along line” menu item (51)7.10.6“Values in section” menu item (52)7.10.7“Velocities” menu item (52)7.10.8“Contours + velocities” menu item (53)7.10.9“Individual values” menu item (53)7.10.10“Flow line preferences” menu item (53)7.10.11“With distance increment” menu item (55)7.10.12“With time increment” menu item (56)7.113D menu (56)7.11.1“Wire model” menu item (56)7.11.2“External model” menu item (56)7.11.3“Potential external model” menu item (57)7.11.4“Isosurface” menu item (58)7.11.5“Seepage surface” menu item (58)7.11.6“Discharge in vertical section” menu item (58)7.12? menu (58)7.12.1“Copyright” menu item (58)7.12.2“Maxima” menu item (59)7.12.3“Help” menu item (59)7.12.4“GGU on the web” menu item (59)7.12.5“What’s new ?” menu item (59)7.12.6“Translation” menu item (59)8Tips (59)9 A worked example (60)9.1Step 1: Defining the system (60)9.2Step 2: Preparing the program (61)9.3Step 3: System input (62)9.4Step 4: Assigning z ordinates (63)9.5Step 5: Refining the mesh (64)9.6Step 6: Assigning soil numbers (65)9.7Step 7: Defining boundary conditions (66)9.8Step 8: Refining the mesh in “z” (66)9.9Step 9: Assigning soil properties (67)9.10Step 10: Compute system (67)9.11Step 11: Evaluating the potentials in “horizontal” planes (68)9.12Step 12: Evaluating the potentials in section (69)9.13Step 13: Representing a cut-away system (69)9.14Step 14: Evaluating discharge (70)9.15Step 15: Removing the weak spot (71)10Index (72)Index of figures:Figure 1 Planes and layers (8)Figure 2 k r = f(u) (12)Figure 3 Unsaturated zone (12)Figure 4 Planes and layers (14)Figure 5 Optimisation of diagonals (26)Figure 6 Basic mesh for description of mesh refinement (28)Figure 7 Mesh refinement using method 1 (29)Figure 8 Mesh refinement using method 2 (29)Figure 9 Mesh refinement using method 3 (30)Figure 10 System (60)Figure 11 Section (61)1 PrefaceThe GGU-SS FLOW3D program allows modelling of steady-state groundwater flow in three-dimensional groundwater systems using finite element methods. The program includes a powerful mesh generator and routines (contour lines, 3D graphics, etc.) for comfortable evaluation of the modelling results.Data input is in accordance with conventional WINDOWS operations and can therefore be learned almost entirely without the use of a manual. Graphic output supports the true-type fonts supplied with WINDOWS, so that an excellent layout is guaranteed. Colour output and Bitmap graphics are supported. DXF files can also be imported by means of the integrated Mini-CAD module (see the Mini-CAD manual).It is not the aim of this manual to give an introduction to finite element methods. For details offinite element methods you are referred to O. C. Zienkiewicz, The Finite Element Method, pub-lished by McGraw-Hill. The hydraulic principles upon which the FEM program is based may be taken from, e.g., Buss, “Unterströmung von Deichen” (Percolation Below the Base of Embank-ments) (Mitteilungsheft 92, Leichtweiß-Institut, TU Braunschweig – Announcements of theLeichtweiß Institute, No. 92, Technical University of Braunschweig). The program has been used in a large number of projects and has been thoroughly tested (using analytical solutions and incomparison with other FEM applications). No faults have been found. Nevertheless, liability for completeness and correctness of the program and the manual, and for any damage resulting from incompleteness or incorrectness, cannot be accepted.2 Installation and language selectionFor installation and subsequent registration of GGU software, please refer to the information inthe “Installation notes for GGU Software”, which are supplied the program.GGU-SS FLOW3D (International version) is a bilingual program. You may choose to work inGerman or English. The international version is delivered with English as the default menu and graphics language.If you would like to work with GGU-SS FLOW3D (International version) in German, start theprogram and go to “File / New” in the initial menu bar. An expanded menu bar appears. Go to the “?” menu and there to the menu item “International version” and deactivate the switch for translat-ing the menus and graphics (see also Section 7.12.6).3 Starting the programAfter starting the program you will see two menus at the top of the GGU-SS FLOW3D window: • File• ?After clicking on the “File” menu, a previously analysed system can be loaded by means of the“Load” menu item, or a new one created using “New”. After selecting the system, the menu bar will show eleven menus:• File• Mesh(x/y)• z• I mesh• Boundary• System• Graphic preferences• Page size and margins• Evaluation• 3D• ?After clicking one of these menus, the so-called menu items roll down, allowing you access to all program functions.The program works on the principle of “What you see is what you get”. This means that the screen presentation represents, overall, what you will see on your printer. In the last consequence, thiswould mean that the screen presentation would have to be refreshed after every alteration youmake. For reasons of efficiency, and as this can take several seconds for complex screen contents, the GGU-SS FLOW3D screen is not refreshed after every alteration. If you would like to refresh the screen contents, press either [F2] or [Esc]. [Esc] will additionally set the screen presentation to A3 format.4 Program conceptThe program uses the finite element method. The real solution is a linear approximation for each element. Triangular prisms are used as finite elements. To simplify data input, the mesh is initially generated in plan. The projection of the triangular prisms onto the plan surface results in triangles, so you must first generate a triangular mesh. Depending on the complexity of the system, a num-ber of height ordinates are associated with each node of this basic mesh, which describe the sys-tem in the third dimension. The height ordinates can possess different values at each node. Theonly condition is that every node has the same number of height ordinates. This allows complex systems to be generated.Using this type of mesh generation, successive planes of nodes are located above each other,whereby “plane” can be somewhat misleading because the nodes of a “node plane” are not neces-sarily on one plane. Instead of the term “node plane” we will simply use “plane”.The regions between these planes are called “layers”. They are filled with triangular prisms.Figure 1 Planes and layersYou can assign a boundary condition to each node (source or potential). You can also assign dif-ferent soil properties to each triangular prism.If you have already worked with the GGU program GGU-SS FLOW2D (formerly GW2), you will hardly encounter problems with the GGU-SS FLOW3D mesh generator. The additional effortinvolved consists of having to manage a “battery” of z ordinates for each node.5 Short descriptionSince I know from personal experience that reading user-manuals is quite a chore, there will now follow a short description of the main program functions. After studying this section, you will be in a position to model steady-state groundwater flow. More detailed information about theprogram can be obtained from the subsequent chapters as you require it.• Design the system to be modelled.• Start GGU-SS FLOW3D and go to “File / New”. Enter the number of element layers. This can be increased or decreased later.• If necessary, adjust the sheet coordinates to fit your system. Use “Page size and margins / By hand” to do this.• Then go to “Mesh(x/y) / Define nodes”.• Using the mouse, click the governing nodes (points) in your system. The points will be numbered. Alternatively, you can also enter the nodes in tabular form using “Mesh(x/y) / Change”. Each newly generated node is awarded the values entered in “z / Standarddepths” as z ordinates. During and after mesh generation, you can edit the z ordinates asso-ciated with a node at will (see below).• If the nodes lie outside of the visible sheet coordinates, go to “Page / Auto-resize” or press [F9].• Now go to “Mesh(x/y) / Mesh “by hand”” and unite groups of three nodes to single trian-gular elements. In this manner you generate a rough structure for your system. Alterna-tively, by using “Mesh(x/y) / Automatic”, you can have the program do this work auto-matically for you. During automatic mesh generation the triangular prisms are assigned the standard soil column for all new triangular elements. The standard soil column defines the soil numbers of the individual triangular prisms. The soil numbers can also be subsequently edited at any time.• If you want to edit the positions of mesh nodes, select one of the menu items “Mesh(x/y) / Edit”, “Mesh(x/y) / Change” or “Mesh(x/y) / Move”.• To define the depths of the planes, enter the plane surfaces in the “z / Standard depths”menu item.• If you want to delete a triangular element, select the “Mesh(x/y) / Mesh “by hand”” menu item once again and click the three corner nodes of the corresponding element. After select-ing this menu item, try a double-click in a triangular element.• You can refresh the screen at any time using [ESC] or [F2].• Turn your rough structure into a fine structure by using the menu items “Mesh(x/y) / Indi-vidually refine” or“Mesh(x/y) / Section” or “Mesh(x/y) / All”.• After mesh refinement, you can still edit your system at will using “Mesh(x/y) / Define nodes”, “Mesh(x/y) / Mesh “by hand””, etc.• For demonstration purposes, use the menu item “Mesh(x/y) / Move” to generate one or more acute, and thus numerically unfavourable, triangular elements. Then select the“Mesh(x/y) / Optimise” menu item and follow the effects on the screen.• Previously, each node was assigned the standard depths during mesh generation. If you want to see your mesh in a vertical section, use “z / Define section” to define a section through the system.• Use “Boundary / Individual potentials”, for example, to define the boundary conditions governing your system. A potential can be assigned to the node in the current plane or to all nodes associated with this point.• You can move through the planes using the and tools, which you can find in the toolbar at the lower left of the program window. The plane and layer in which you now find yourself are shown in a separate legend.• If you wish, you can edit the soil number using the “Boundary / Individual soils” or “Boundary / In section” menu items. Every soil number can subsequently be assigned dif-ferent soil properties. The soil numbers defined refer to the current layer.• If necessary, edit the soil properties using the menu item “System / Soil properties”.• Once you have completed mesh generation, go to “System / Run” to commence modelling.Where required, a bandwidth optimisation will be carried out before modelling com-mences, in order to achieve a numerically favourable equation system.• If wished for, you can send the results to a printer as an output table or write them to a file once modelling is finished. However, this method of result presentation is generally less than satisfactory to the client.• So, proceed immediately to the “Evaluation” or “3D” menus. You can almost always leave the subsequent dialogue boxes using the “OK” button, without having to make furtherchanges. The program will usually suggest sensible input. The “Determine extreme val-ues” switch, which appears in a number of dialogue boxes, should be clicked once how-ever, otherwise an error message will appear.• Define a section (menu item “z / Define section”) and then press Return. Now select thetool from the toolbar at the lower left of the program window. You will now see a “cut-away” of the system. You may rotate the system in steps around the z axis using thetool. Try pressing the F9 function key (or use “Page size and margins / Auto-resize”).Change the current plane from the one you are now in.• If you find yourself in a section and wish to return to a representation or evaluation in plan, go to “Mesh(x/y) / Mesh”.• If you have a colour printer correctly installed in WINDOWS, you can create colour output by going to “File / Print and export” and then pressing the “Printer” button in the subse-quent dialogue box. For black and white printers, grey scales will be used.• At the end of this manual, the program is described using a comprehensive example.This short description demonstrates that only a few items need be selected to model a groundwater system. All further menu items deal principally with saving data, layout and further evaluation of the model, where required. The description will ensue in the following chapters.6 Theoretical principles6.1 OverviewAn analytical solution can be given for simple groundwater systems. When modelling complexsystems, we must rely on numerical methods of solution. In principle,• finite difference methods (FDM) and• finite element methods (FEM)are employed. To facilitate this, the whole area is subdivided into numerous small (finite) sub-areas (elements). When employing FEM, triangles are generally used to represent these sub-areas.Within the triangles, simple, generally linear, approximation functions are applied. The real, com-plex total solution is composed, mosaic-like, of the numerous simple partial solutions. This gives rise to equation systems, the number of unknowns of which correspond to the number of system nodes. Using the finite difference method, we normally only have the option of discretising thetotal area by means of rectangular sub-areas. In contrast to FEM therefore, FDM is substantially less flexible with regard to adjustment to complex boundary structures. Mesh refinement is also less simple to perform in certain areas. In addition, the equation systems which result for FEM are numerically more stable. The principle advantage of FDM consists merely of the theoretically less complex underlying mathematical relationships, which will generally be less interesting to theprogram user. GGU-SS FLOW3D makes use of the finite element method.When using this program, please remember that all finite element or finite difference procedures are approximation methods. The quality of the approximation compared to the real solution in-creases with the fineness of the mesh. You should take care that the mesh is tighter in those areas where the principal subsurface hydraulic activity takes place (e.g. wells, seepage elements). The shape of the triangles also exercises a certain influence. The optimum conditions are provided by isosceles triangles. You can get an idea of the quality of the solution by modelling the same sys-tem again, but using a either a finer or a coarser mesh and comparing the results of the two model-s.The following further general remarks are important:• Triangular elements are used.• Darcy’s Law applies.• The piezometric heads are computed linearly for each element.• A constant approximation of velocities for each element results from the linear approxima-tion of the piezometric heads. In order to improve the quality of the velocity approxima-tion, the velocities for computation of flow lines are converted to mean node values in afollow-up computation.The procedure is:The velocities from the neighbouring elements are added for each element node and thendivided by the number of neighbouring elements. This allows an improved representationof velocity. By the nature of things, the results at the boundary nodes are not as exact.Moreover, the approximation quality of velocities in the region of element nodes belongingto elements of varying material types can deteriorate. If the velocities in such “boundarynodes” are of great interest, some assistance can be had by refining the element mesh inthese regions.6.2 Differential equationThe application solves the differential equation:k r ∗ k x∗∂2h/∂x2 + k r ∗ k y∗∂2h/∂y2 + k r ∗ k z∗∂2h/∂z2 + Q = 0 Where• k x, k y, k z= permeability in m/s, for example, for the x, y and z directions• h= piezometric head in m, for example• k r= coefficient for determining the permeability in the unsaturated zone(dimensionless)• Q= discharge in m³/s, for example• x, y, z= coordinates in m, for exampleThe parameter k r takes account of the change in permeability in the unsaturated zone r above the groundwater table and assumes values between 0.0 and 1.0. In the saturated zone, k r is equal to1.0. The parameter k r is a function of the porewater pressure u. The porewater pressure u is calcu-lated from the piezometric head h, the elevation head y and the unit weight of water γw.u = (h - z) ∗γwThe curves corresponding to three typical soils are shown in Figure 2. The inclusion of this pa-rameter in the differential equation offers the significant advantage, among others, that phreatic lines can be very simply computed during the ensuing finite element analysis.Figure 2 k r = f(u)Further explanation is provided by Figure 3. In the case of a horizontal groundwater table, all four parameters h, y, u and k r are given as a function.Figure 3 Unsaturated zoneIf unsaturated zones are present in the system and computation of the phreatic line is needed, this will require an iteration process, as the location of the phreatic line is not known from the outset.In the first iteration step, the program initially assumes that all system regions are saturatedk r = 1.0After the initial computation of the piezometric heads at the system nodes, the porewater pressures u are computed and k r determined. Using the thus modified permeabilities, the system is remod-elled with new piezometric heads and correspondingly new porewater pressures and k r values. The iteration process is continued until the difference in piezometric heads in iteration step (i) and (i -1) fall below the user-defined limit value (iteration deviation).Remark on boundary conditions:The case of an impermeable boundary is considered automatically by the finite element method.All system boundaries that do not posses water level or source boundary conditions are automati-cally impermeable.7 Explanation of the individual menus and items7.1 OverviewA few of the program functions cannot be reached by means of the menu items. These programfunctions can only be activated via the toolbar in the lower left program window.If you click the corresponding tool in the toolbar with the left mouse button and keep it pressed, the program functions “hidden” behind these icons are shown in the bar at the bottom of the pro-gram window. Of particular importance are the iconsand and ,with which you can move from one plane to the next. This is important when defining soil num-bers, z ordinates and when evaluating modelling results for example.In this chapter, the individual menus and their associated menu items will be explained.7.2 File menu7.2.1 “New” menu itemAfter selecting “New”, the number of element layers must be specified in the dialogue box.Element layer numbering begins at the bottom with “1”, the planes bounding an element layer are also numbering continuously from bottom to top. The number of element layers is – because the system ends at the base – one less than that of the planes; see the schematic section below.Figure 4 Planes and layers7.2.2 “Load” menu itemIf you have entered data at a previous “session” at the computer, and saved these as described in the “Save” menu item, you can reload them by selecting this menu item. It is then possible to edit the data according to your wishes.7.2.3 “Save” and “Save as” menu itemsYou can save data entered during program use to a file, in order to have them available at a later date, or to archive them. For reasons of transparency, it makes sense to use “.F3D” as the fileextension, as the file requester box for the “Load” menu item only shows files with this extension.If you do not enter an extension when saving, “.F3D” will be used automatically. If the currentsystem has been modelled, the results can be saved to a dataset. If this file is later reloaded, theresults remain available for evaluation without renewed computation.7.2.4 “Read ASCII file” menu itemIf the coordinates of FEM mesh nodes are available as an ASCII file, this data can be read into the program. The data must consist of rows containing the x value and the y value of each node. Deci-mal fractions must have a point and not a comma. When loading the ASCII file, you only need to specify in which columns the x and y values are located. New x and y coordinates are assigned the standard depths.The current line of the ASCII file is shown at the top. You can move through the file using thearrow buttons on the right. If all the information is correct, the result for the row is shown in the box below each column. Otherwise, “Error” appears. You may need to change the column delim-iter. If the file contains invalid as well as valid rows, these will simply be skipped during reading.Finally, select the “Read data” button. You can then process the coordinates to a new FEM mesh.7.2.5 “Save ASCII file” menu itemIf a FEM mesh has been generated, the node coordinates can be saved in an ASCII file. The x and y coordinates of the underlying mesh (2D) are saved and, in addition, if the system has been mod-elled, the potential of the current plane.7.2.6 “Print output table” menu itemYou can print an output table. The results can be sent to the printer or to a file (e.g. for further editing in a word processor). The output contains all analysis information, including the system data. First decide the extent of output,by activating the corresponding switches.You can then define more output preferences. Using the “Edit” button, the current printer prefer-ences can be changed or a different printer selected. Using the “Save” button, all preferences from this dialogue box can be saved to a file in order to have them available for a later session. If you select “GW3.DRK” as file name and save the file in the program folder (default), the file will be automatically loaded next time you start the program. Using the “Page format” button you candefine, among other things, the size of the left margin and the number of lines per page. The“Head/foot” button allows you to enter a header and footer text for each page. If the “#” symbol appears within the text, the current page number will be entered during printing (e.g. “Page #”). If you do not wish pagination to begin with “1” you can add an “offset” number to the check box.This offset will be added to the current page number. The text size is given in “pts”. Using thebuttons at the bottom of the dialogue box you start output to the “Printer” or to a “File”, the name of which must be subsequently entered. If you select the “Window” button the results are sent to a separate window. Text editing options are available in this window, as well as loading, saving and printing.7.2.7 “Printer preferences” menu itemYou can edit printer preferences (e.g. swap between portrait and landscape) or change the printer in accordance with WINDOWS conventions.7.2.8 “Print and export” menu itemThe following dialogue box appears:• “Printer”allows graphic output of the current screen contents to the WINDOWS standard printer orto any other printer selected using the menu item “Printer preferences”. For direct output(printer), the following dialogue box appears:。
Flow3D入门实例讲课稿
2 3
2.选择显示数据项
4
选择数据项
5
6
7
3.数据显示(色彩浓淡图)
显示数据标尺
此课件下载可自行编辑修改,仅供参考! 感谢您的支持,我们努力做得更好!谢谢
6.初始边界条件
设置型腔的初始 温度和压强(采用 相对压强)
7.数值计算设定
数据输出设定。
每隔0.1秒输出一 组数据。
估算总数据量。
7.数值计算设定(保持默认值,不做修改)
数值计算方法选择。
四.数值计算
100%时,表明完成计算。
五.后处理
1.加载计算结果文件(前缀“flsgrf.”)
导入计算结果数据。 1
鼠标操作视图 左键:旋转 中键:缩小放大 右键:平移
2.网格划分
1 先将视图转为二维视角
2
注:网格边界应大于 零件边界!
3
按位鼠标左键并拖动鼠标, 形成黄色矩形框,
然后松开鼠标左键, 出现右图对话框。
4 不改变数据,直 接点“OK”。
5 改变右侧导航栏的数据。
6 点更新网格按钮
注:进料口应高 于网格边界!
6 点鼠标右键
7
设定网格尺寸 为0.2cm
8 9
点该按钮查看网 格划分结果
1
2
3
点该按钮退出查
4
看网格状态
3
微调透明度,以显示型腔内部结构
1
4
查看型腔状态
2
三.前处理
1.一般项
2.物理选项(根据分析任务要求进行选择)
3.选择充填金属液
1
2 金属液的特性
4 5
3 可查看和修改金属液的特性
Flow3D入门实例
FLOW-3D水利工程详细案例教程
单位系统与时间控制--General
物理模型--Physics
流体材料--Fluids
② ① ①单击Fluid1; ②单击第一排菜单栏的 Materials,单击Fluids Database...,弹出对话框; ③选中66号流体water; ④单击Load fluid 1。 ③ ④
边界条件--Boundary
输出设置--Output
③ ① ②
①设置restart data的间隔时间:1; ②勾选Hydraulic data; ③设置Selected data interval:0.5,同时勾 选fluid velocity,Hydraulic data,pressure。
数值选项--Numerics
案例4 开闸放水
建模--Geometry
建模 subcomponent1到3属于component1 subcomponent4属于component2
①subcomponent1
①subcomponent2
②subcomponent4 ①subcomponent3
网格划分--Mesh
①新建mesh block1; ②右键mesh block1,单击 adjust mesh block: ③X -0.5 1.5 ④Y 0 1 ⑤Z 0 2 ⑥size of cells:0.02
初始条件--Initial
①展开Initial的Global,设置pressure: Hydrostatic pressure in Z; ②fluid Initialization:Use fluid elevation; ③Initial fluid elevation:10。
添加初始水位
①用户可以选择步长的控制方法,对于初学 者,建议使用Stability and covergence和 Stability,步长会自适应; ②设置Initial time step:0.01; ③设置Minimum time step:1e-7。
flow3d官方培训教程中的实例中文说明
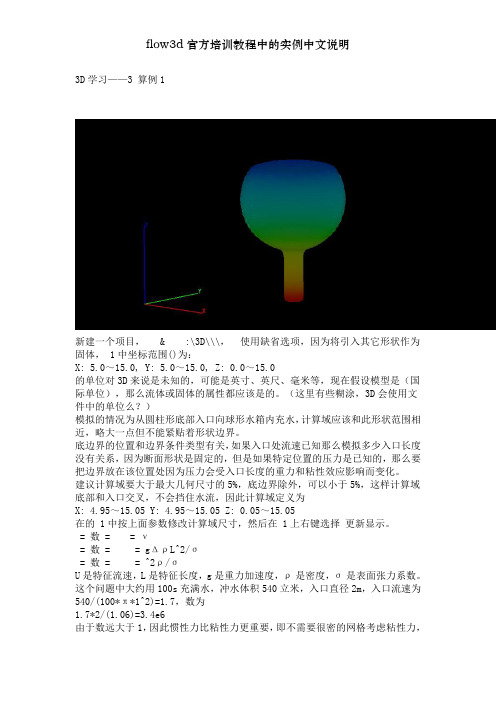
3D学习——3 算例1新建一个项目, & :\3D\\\,使用缺省选项,因为将引入其它形状作为固体, 1中坐标范围()为:X: 5.0~15.0, Y: 5.0~15.0, Z: 0.0~15.0的单位对3D来说是未知的,可能是英寸、英尺、毫米等,现在假设模型是(国际单位),那么流体或固体的属性都应该是的。
(这里有些糊涂,3D会使用文件中的单位么?)模拟的情况为从圆柱形底部入口向球形水箱内充水,计算域应该和此形状范围相近,略大一点但不能紧贴着形状边界。
底边界的位置和边界条件类型有关,如果入口处流速已知那么模拟多少入口长度没有关系,因为断面形状是固定的,但是如果特定位置的压力是已知的,那么要把边界放在该位置处因为压力会受入口长度的重力和粘性效应影响而变化。
建议计算域要大于最大几何尺寸的5%,底边界除外,可以小于5%,这样计算域底部和入口交叉,不会挡住水流,因此计算域定义为X: 4.95~15.05 Y: 4.95~15.05 Z: 0.05~15.05在的 1中按上面参数修改计算域尺寸,然后在 1上右键选择更新显示。
= 数= = ν= 数= = gΔρL^2/σ= 数= = ^2ρ/σU是特征流速,L是特征长度,g是重力加速度,ρ是密度,σ是表面张力系数。
这个问题中大约用100s充满水,冲水体积540立米,入口直径2m,入口流速为540/(100*π*1^2)=1.7,数为1.7*2/(1.06)=3.4e6由于数远大于1,因此惯性力比粘性力更重要,即不需要很密的网格考虑粘性力,也不需要指定粘性特性。
考虑表面张力影响的系数为= gΔρL2/σ = 9.8^2 * 1000 ^3 * (2m)^2/(0.073^2) = 5.4e5= 2ρ/σ = 2m * (1.7 )^2 * 1000 ^3 / (0.073^2) = 7.9e4可以看出表面张力也不需要考虑。
缺省网格在X、Z方向为10,Y方向为1。
FLOW3D 流量监测
Tools / Options
Tools Options下总共可控制三个显示
1. Color:所有的颜色显示,包含了背
景、前景、固体颜色…等。 2. Light/camerasetting:可设定灯光与
录像模式的位置(一般而言仅有录像
模式可能会使用到) 3. 3D GraphicFont:调整后处理字体的
• 输出图片,可储存成三个格式(bmp, jpeg与png)
Tools / Axis rotation
左下角的转轮,除了可以针 对X,Y,Z三轴旋转外,最常用 的功能在于可以直接『key in』旋转角度。
Tools / Show all objects
FLOW-3D V10可任意隐藏单一对象(包含 CAD图档与网格图档。隐藏后如果不想一个一 个慢慢开启,可以执行『Show all objects』 (Ctrl-A)显示所有的对象。
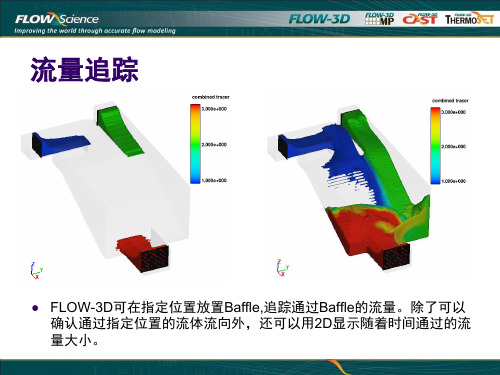
流量追踪
FLOW-3D可在指定位置放置Baffle,追踪通过Baffle的流量。除了可以 确认通过指定位置的流体流向外,还可以用2D显示随着时间通过的流 量大小。
建立Baffle
要设定Tracer,必须先在指 定的位置建立Baffle。 Baffle是平板的意思。在指 定的位置设定平板,就可以 量测通过该平板的所有流场 数据。Baffle是『虚拟』的 平板,不会影响流动数据, 但是会记录流动信息。
大小与显示方式
1 2
新增平板后,必须先开启 『Definne as Flux Surface』 (设定为虚拟平板)以及 『Generate Tracer』(设定 追踪器)。 接着就是设定平板的大小以及 位置。
3
•Definition:设定平板位置 •Limiters:设定平板大小
Flow3D培训教程
Flow3D培训教程FLOW-3D V9.3.2 水利教程上海飞熠软件技术有限公司目录1. 为何选择Flow-3D软件, ............................................................ 2 2. Flow-3D软件界面 (2)3. Flow-3D分析流程 (2)3.1 运行FLOW-3D (2)3.2 几何体的设置 (2)3.3 General设置 (2)3.4 Physics设置 (2)3.5 Fluids设置 (3)3.6 Meshing _Geometry设置 (3)3.7 Boundary设置 (3)3.8 Initial设置 (4)3.9 Output设置 (4)3.10 Numerics设置 (4)3.11 计算 ..................................................................... ... 4 案例1 渠道流动状况 ....................................................................4 案例2 波浪运动 ..................................................................... ... 6 案例3 卷气量分析 ......................................................................7 案例4 球从半空中掉下 (7)案例5 强制球在水面移动 ................................................................ 8 案例6 开闸泄流 ..................................................................... ... 9 案例7 搅拌不同密度流体 (11)3.1 为何选择Flow-3D软件,网格可以自由分割,不需要与几何文档建立关联, FAVOR可以描述非常复杂的流场运动模式,TruVOF与自由液面模型描述,多网格区块建立技术能够大幅度地提高计算效率,运动物体GMO碰撞模型设置简单方便。
FLOW-3D客制化操作步骤
FLOW-3D V9.4
客制化操作流程
Flow-3D 客製化概論
注意:若这里没有赋予dum的数值, 那么你就必须在前处理prepin给定
c include '../comdeck/ijk.f' include '../comdeck/mijk.f' c c c Let fhtw = wave height fhtw=flhtr+wvcosc fhtz=max(fhtw-z(k-1),zero)*rdz(k) fhtz=min(fhtz,one) if(fhtz.gt.ztest) then c c f(ijk)=fhtz u(imjk)=dum1*wvcosr*exp(dum2*(zk(k)-flhtr)) u(ijk)=dum1*wvcosr*exp(dum2*(zk(k)-flhtr)) w(ijk)=dum1*wvsinc*exp(dum2*(z(k)-flhtr)) else c f(ijk)=zero u(ijk)=zero w(ijk)=zero c endif
c c
phasc=dum2*xi(imax)-dum1*t wvcosc=dum3*cos(phasc) wvsinc=dum3*sin(phasc) wvcosr=dum3*cos(dum2*x(im1)-dum1*t) i=imax i=imax-1
do 8000 k=kprb,kprt do 8000 j=jprf,jprbk
第六章 FLOW-3D 物理模型
0
d T Tref dT
Example: slide coating onto moving web NEW!允许较大 的时间步长
stationary wall
在属性树里 可重新输入
moving web
31
推荐湍流模型
必须设 置粘度 值
3D模型,试图捕捉大旋涡结构, 给出了一些波动,流通信息,可 能需要很长的CPU计算时间
29
一个各50%石油和水的混合物从左 侧进入
激活漂移流量模型以及两个流体流 动
Oil Water Water
分散阶段(油)因浮力上升,分离 Separation of 2 incompressible fluids Oil / Water 的两个组成部分 mixture
30
在墙壁/组件里接触角 控制的相互作用
湍流的最大尺寸旋转最小单 元尺寸推测的10% 用劣质单元的aspect ratio在Z 方向改变粘度的问题
注意:湍流的初始条件和边界条件 ,也可以设置,否则,自动设置。
32
聚合物,非晶态合 金,半固态金属。
牛顿粘度模型
FLOW-3D®其他模式下的 粘度是流动特性的功能。
触变性粘度模型中使用的材料,其 粘度是由时间来决定.
4
数值选项 (可选)
打开热传递窗口,选择‘Physics - Heat Transfer ’。 流体能量平流: - 选择一阶或二阶计算流体 (s)内的温度变化。 流体固体热传递: - 集中的温度模型假设在固体 有温度分布均匀: - 当全能量方程求解时,需要 预测在固体温度的变化。
5
43
允许一个组件在整个区域移动 或旋转 运动可以规定,或与流体运动 耦合
FLOW-3D客制化操作步骤

ቤተ መጻሕፍቲ ባይዱ
以下以原廠提供的一個客製造波副程式進行說明。
Step 1: 利用 Microsoft visual studio 2005 打 开Cumtom_double.sln
Step 2: 打开Source文件下 name.f 此例子采用边界条件客制化(bc.f )
注意:建议 bc.f 做备份
Step 3: 编译客制化的子程序
c
Step 4: 重新生成可执行文件
Step 5: 前处理文件的版本类型需选择 Custom double precision
结果
do 8000 k=kprb,kprt do 8000 j=jprf,jprbk
注意:若这里没有赋予dum的数值, 那么你就必须在前处理prepin给定
c include '../comdeck/ijk.f' include '../comdeck/mijk.f' c c c Let fhtw = wave height fhtw=flhtr+wvcosc fhtz=max(fhtw-z(k-1),zero)*rdz(k) fhtz=min(fhtz,one) if(fhtz.gt.ztest) then c c f(ijk)=fhtz u(imjk)=dum1*wvcosr*exp(dum2*(zk(k)-flhtr)) u(ijk)=dum1*wvcosr*exp(dum2*(zk(k)-flhtr)) w(ijk)=dum1*wvsinc*exp(dum2*(z(k)-flhtr)) else c f(ijk)=zero u(ijk)=zero w(ijk)=zero c endif
FLOW-3D V9.4
flow3d中文初级入门教程

设置缺陷产生的速率
加入熔汤的材质,铝合金或者镁合金等。注意单位为CGS
点击flowVu进入网格划分界面,如下:
将模型转为xy平面显示,在图形区画出图示矩形框包围产品,然后弹出网格总数输入框, 输入总数即可自动划分网格,删除block1即可。
指定入水口速度和温度,从上图可以看出从X负方向入水,速度根据熔汤种类而 不同。
加入模壁材料:solids database-load-ok-选择CGS单位。 做压铸分析好像就炭钢一种材料,其他都是砂型铸造用。谁手中有更 多材料库的,可以分享么?
黏性
能量方程
模壁切应力
重力方向
卷气设置
缺陷设置
紊流模型
能量方程设置,考虑熔汤与模壁之间的热传导
设置重力的方向,根据实际压铸的入水口方向来确定重力方向,单位CGS
软件界面
新建一个分析项目
新建一个分析项目
打开一个已有的项目
分析结束条件
充填率100%,完全充满
设置分析结束条件
导入STL模型,方式:mesh-geometry-add-browse-选择STL文件-OK-ADD跳出 另外界面,如下:
设置转换比例,一般产品单位为MM, 此处转为cm
此处设为可充填型腔
熔汤初始温度和速度
大气压强
输出时间步距
Hale Waihona Puke 以充填百分比为输出基准收敛级数,对计算时间,分析结果都有影响
预览网格划分是否足够细密,入水口方向是否正确,
开始进行分析计算
第二章_FLOW-3D

Density Evaluation
• FLOW-3D 内的流体密度可以是其他变数的函数,例如 温度或是固化率。举例而言,计算时可以考虑流体密 度随着流体温度的变化。
Defect Tracking
• 铸件的机械强度与铸造过程中生成的氧化膜、卷气, 以及其他在充填过程中夹杂於固体内之杂质息息相关 。表面追蹤模型(The Surface Defect Tracking model) 會記錄金屬液體與表面空氣接觸的時間以及接觸面, 能夠讓使用者預測金屬氧化膜的生成位置以及集中區 域。
2.1、FLOW-3D 可接受之图档
• FLOW-3D 接受多种图档及网格格式,可从外部绘图程 式或其他 CAE 前处理器转入。不过在预设的前处理器 中,仅能直接读取 STL 格式。其馀格式必须以文字编 辑器编辑 Prepin 档。 • STL • UNV • Other meshes • 操作
STL(stereolithography )format
Multi-Block Meshes
• FLOW-3D 於 V8.0 版之後,推出 Multi-Block Meshes 的设定方式。Multi-Block Meshes 可以适用於各种应用 领域,能够在分析模型中进行局部或整体的网格尺寸 调整,大幅减少分析时所需之内存。 • 网格区块(Mesh Block)不允许局部重叠,仅能完全 相接或者是完全重叠。FLOW-3D 并没有限制仅能采 用 Connected Blocks 或是 Nested Blocks,也没有限制 网格区块的连接方式(连接方式与流体的流动方向无 关)。使用者可以根据实际需求进行调整。
FLOW----3D操作步骤概要

FLOW----3D操作步骤概要
FLOW----3D操作步骤概要
FLOW3D大概操作步骤:
一、引入STL文件
用三维软件UG、PROE等,设计成流道,与产品连在一起,最终另存为STL格式文件。
如果用mastercam做的3D流道,需要对流道进行破面修补,然后再把产品组装起来,最后导出STL文件。
二、建立网格
在FLOW3D里面,默认单位是CM,所以STL导入后,需要将产品的比例改为0.1,从而以CM为单位。
之后就可以建立网格,但网块不能过多,一般六块以下,太多会出错。
三、设置边界条件:
划分网格后,就设置边界条件。
在铸造方面,边界条件一般为W、S、V、P、I五个为主(S为对称、W为围墙、V为速度、P为压力、I 为连接),其余不用。
速度与压力只需要指定一个为边界填充条件即可。
四、设置物理模块
物理模块,根据要做模拟的种类及成型条件来设置。
五、设置通用的参数
通用参数,一般默认而不需要设置。
只需要设置填充条件就行,填充条件一般设置为填充分数
六、导入材料的物理特性
每种成型都有一个材料合金的特性,选择流体数据库,选择一个合金型号,双击就可以导入。
七、预计算
之后就可以预计算,如果没提示错误就可以计算。
Flow-3D9.2使用指南
Flow-3D是一套三维计算流体动力学软件,它
广泛应用于航空航天、水利、海运、环境工程、 金属铸造、微机电系统、喷涂等领域,主要用于 模拟具有自由表面的流体的流动问题。
主要功能:
在砂型、消失模、压铸、熔模、金属型和离 心这六种铸造方法下,实现铸件充型凝固冷却过程 中温度场、流态场、应力场的仿真,评估铸造工艺 设计、解决铸造工艺缺陷。
二.导航
当在特定的铸造方法下,特定的铸件出现了特 定的缺陷时,首先通过对铸件缺陷成因与对策指南 的运用,判断该缺陷是否是由于铸造工艺设计不当 造成的,如果是则可以使用Flow-3D对其仿真。
通过学习使用Flow-3D学习指导书,掌握使用 Flow-3D解决铸造工程问题的操作方法。
附件:1.参考文献 2.安装软件 3.动态网站
4.三级提纲 5.问题集 6.要点和难点 7.翻译包
PPT修改记录
编号 1 2 3 4 5 6
修改日期
ቤተ መጻሕፍቲ ባይዱ修改人
备注
Flow-3D9.2使用指南
刘冠岳
一.总论 二.导航
2019/5/18
一.总论
目的:
通过学习该使用指南,掌握Flow-3D的使用方法, 以便能够运用Flow-3D解决铸造工程问题。
适用范围:
砂型、消失模、压铸、熔模、金属型和离心铸 造的温度场、流态场和应力场的仿真。
特点:
1.Flow-3D是一套三维计算流体动力学软件; 2.高度集成,单一界面整合了所有问题的模型导 入、网格划分、参数设置、仿真计算和结果观看; 3.拥有RSS(快速凝固收缩)物理模型。
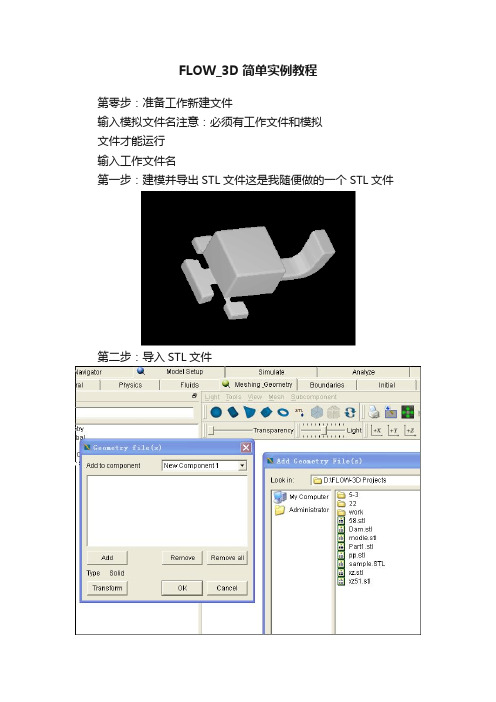
FLOW_3D简单实例教程
FLOW_3D简单实例教程
第零步:准备工作新建文件
输入模拟文件名注意:必须有工作文件和模拟
文件才能运行
输入工作文件名
第一步:建模并导出STL文件这是我随便做的一个STL文件
第二步:导入STL文件
在Model Setup——Mshing_Geometry——STL点Add导入如上图所示,并在Transform转化单位。
在Transform转化单位如下所示:
按上图的单位和类型点OK按默认的
Standard方式
第三步:创建网格
常用命令
单击自动创建网格这是把窗口调整到完整状态
单击自动创建网格时跳出
如左图所示,点OK在产品
上按住左键拖出一个矩形。
松开左键如下图所示,点OK
也可以选择此项,这是捕抓几何
然后在软件的左边的状态如左图所示、Z方向到最佳状态
单击分割网格块,看要在哪个方向加就选择哪个方向。
注意:在两个网格连接处坐标要一样
调整网格大小
上表示网格的总大小表示网格的格的大小
渲染跳出如左
下图所示
如左图选择Open,然后单击Render(渲染),跳出如右下图观察看有没有间隙如有可以把网格的格改小或者把网格的总大小改大或者增加点等。
表示取消渲染
第四步:一般选项的填写
填充时间
填充率
成百分率
一般压铸都是按填充率来计算的第四步:一般选项的填写
单位为CGS
第五步:物理选项填写
注意重力方向与单位,Flow 3D默认单位为cm、g、si。
第一章 FLOW-3D使用简介
12 mm
sand casting
die casting 3 mm
0.003
180 ms
30 s
Solution for one-dimensional heat flow into semi-infinite medium from Casting: An Analytical Approach, Reikher, Barkhudarov, Springer 2007.
1975年,Dr. Hirt & Dr. Nichols发表VOF技术 1.定义流体的液面动作状态 2.追踪流体液面流动时的变化 3.定义流体流动时的边界条件设定 所有的CFD软件,关于自由液面的定义,均Follow此一准则。
利用FAVOR技术,使曲面造型的 Model也能够顺利的以矩形网格加以 描述,使分析模型不会失真。
Heat Penetration Depth: Examples
Tilt pour, filling time 20 seconds (倾斜铸造,充型时间为 20 秒): • total initial cell count: 2.2 million cells • with 40 mm thermal shell: 930k active cells = 740k in Байду номын сангаасold + 185k in metal
New Output Quantities
distance travelled by fluid
fluid residence time
Finite Element Solver For Structural Analysis
FLOW-3D 将提供与结
构分析软件相接之有限元 网格,以预测铸件应力分 析与变形问题。
flow3dHydraulics教程

flow3dHydraulics教程Flow3d 9.3.2 Hydraulics Tutorial⽔⼒教程本练习的⽬的是模拟⽔从⽔库通过薄壁堰流进下游⽔池。
图1 ⽔流模拟在设计中,模拟的第⼀步是需要完全了解要分析的问题。
⽤流体⼒学知识,分析⼯程中哪些参数重要,怎样简化问题,可能出现什么问题,以及希望得到什么样的结果。
确定液体流动特性,如黏性、表⾯张⼒及能量作⽤⼤⼩的常⽤⽅法,是计算⽆量纲参数,如雷诺数、邦德数、韦伯数。
这⾥U是特征速度,L是特征长度,g是重⼒加速度,ρ是密度,σ是表⾯张⼒系数。
对本问题,⽔从18cm⾼堰流过,⽔流在堰底的速度可近似按⾃由落体运动分析得出:Velocity = sqrt(2*980*18) = 187.8 cm/s流体的雷诺数为:Re = 30cm x 187.8cm/s / 10-2cm^2/s = 5.6 x 10⁵雷诺数⼤,意味着与贯性⼒相⽐,黏性⼒不可忽略。
因此,我们不需要精细的⽹格求解壁黏性剪切层。
当然,由于流态的紊乱,液体内部有很多黏性剪切⼒,因此,需要在模型中指定黏性参数。
邦德数按下式求得:Bo = 980cm/s^2 * 1 gm/cc * (30cm)^2/(73gm/s^2) = 1.2 x 10⁴韦伯数按下式求得:We = 30cm * (187.8 cm/s)^2 * 1gm/cc / (73gm/s^2) = 1.45 x 10⁴再者,⼤的邦德数和⼤的韦伯数表明,与重⼒和惯性⼒相⽐,表⾯张⼒可忽略。
模型是这种情况时,不考虑表⾯张⼒。
问题的⼤⼩(模型运⾏的时间)可以利⽤堰中⼼顺⽔流平⾯的对称特性进⾏简化。
因此,我们仅仅需要模拟整个范围的⼀部分(即堰的后半部分),就可也得到堰的全部信息。
我们已经对问题进⾏了简化,下⾯是如何建⽴这些条件,如何确定⼏何条件,利⽤flow3d求解问题。
建模总体参数点击“Model Setup”表的“General”表,“General”是确定整个问题的参数,如结束时间、结束条件、界⾯追踪,流体模式,液体的数量,提⽰选项,单位及精度。
FLOW 3D 操作简介
t=5.001 y=5.000E-01 (ix=2 to 81 kz=2 to 51)
09:59:08 7-20-1999tpon
hydr3d: version 7.5.n
win32 1999
Flow over step: P-VOF Method
Two-fluid VOF models are best applied to dispersed two-phase flow. Simulations with well separated phases should use one fluid TruVOF®
VOF(Volume of Fluid)
1975 年,Dr. Hirt & Dr. Nichols 发表 VOF 技术 1. 定义流体的液面动作状态 2. 追踪流体液面流动时的变化 3. 定义流体流动时的边界条件设定 目前所有的 CFD软件,几乎都是利用VOF来追踪自由液面的位置
Volume-of-Fluid (VOF) Method
Three components of VOF:
F = Fluid fraction
Special advection handing to accurately track sharp interface
Boundary conditions at free surface (a normal pressure and no shear stress)
如何用矩形网格描述复杂的形体?
FAVOR ®
利用 FAVOR 技术,使曲面造 型的 Model 也能够顺利的以矩 形网格加以描述,使分析模型 不会失真。
STL 图档
FLOW-3D 网格图档
FAVOR 对网格数量的影响
最新flow3d初级入门教程全解课件PPT
专题二 中国传统教育哲学思想
专题二 中国传统教育哲学思想
▪ 一、中国传统教育哲学思想的发展历程 ▪ 二、中国古代教育哲学思想的主要特点 ▪ 三、天道观与人性论对教育的影响 ▪ 四、历史观与社会发展引申的问题及其
与教育的关系
中国传统教育思想的发展历程
概述: 中国传统教育哲学思想的发展历程,同中国古代 哲学与教育的发展历程是分不开的。就其大的阶 段而言,大致经历了以下几个阶段: 春秋战国时期的百家争鸣, 汉代的儒学独尊, 魏晋的玄学, 唐代的儒、道、释三教并举, 宋明的理学, 明清之际的实学 近代的西学东渐
设置分析结束条件
有哪位拥有更多的资料,中英文均可,研究后 与大家共享成果,互相交流。哪位有详细的熔 汤压铸工艺参数的请告知。
QQ:496381263,注明flow3d,欢迎和各位同行 交流,谢谢!
黏性 能量方程
缺陷设置
模壁切应力 重力方向
卷气设置
紊流模型
能量方程设置,考虑熔汤与模壁之间的热传导
春秋战国时期的百家争鸣
春秋战国时期,各学派所提出的和争论的问题是非常广泛的, 涉及到天道观、人性论、历史观、政治观、认识论、逻辑学、 道德观、审美观以及科技等各个领域的问题。例如,在天道 观方面,不仅从殷商到西周以来的天命主宰一切的观念发生 了动摇,而且出现了疑天、责天、制天命以及天道自然等朴 素的唯物主义和辨证法思想。在天人关系问题上,也有了各 种不同的新的解释,如郑子产的“天道远,人道迩,非所及 也”,和孟子引《泰誓》的话说“天视自我民视,天听自我 民听”等轻天重人甚至重民的进步思想。荀子更进一步提出 “天人相分”和“人定胜天”的思想。老子在《道德经》中 更为明确地提出“人法地,地法天,天法道,道法自然”的 自然之天的观点。
- 1、下载文档前请自行甄别文档内容的完整性,平台不提供额外的编辑、内容补充、找答案等附加服务。
- 2、"仅部分预览"的文档,不可在线预览部分如存在完整性等问题,可反馈申请退款(可完整预览的文档不适用该条件!)。
- 3、如文档侵犯您的权益,请联系客服反馈,我们会尽快为您处理(人工客服工作时间:9:00-18:30)。
五、设置通用的参数
通用参数,一般默认而不需要设置。只需要设置填充条件就行,填充条件一般设置为填充分数
六、导入材料的物理特性
每种成型都有一个材料合金的特性,选择流体数据库,选择一个合金型号,双击就可以导入。
七、预计算
之后就可以预计算,如果没提示错误就可以计算。
三、设置边界条件:
划分网格后,就设置边界条件。在铸造方面,边界条件一般为W、S、V、P、I五个为主(S为对称、W为围墙、V为速度、P为压力、I为连接),其余不用。速度与压力只需要指定一个为边界填充条件即可。
四、设置物理模块
物理模块,根据要做模拟的种类及成型条件来设置。
FLOW----3D操作步骤概要
FLOW3D大概操作步骤:
一、引入STL文件
用三维软件UG、PROE等,设计成流道,与产品连在一起,最终另存为STL格式文件。如果用mastercam做的3D流道,需要对流道进行破面修补,然后再把产品组装起来,最后导出STL文件。
二、建立网格
在FLOW3D里面,默认改为0.1,从而以CM为单位。之后就可以建立网格,但网块不能过多,一般六块以下,太多会出错。
