埃博拉病毒传播分析与数学建模
美赛 数学建模 埃博拉
For office use only T1________________ T2________________ T3________________ T4________________Team Control Number39595Problem ChosenAFor office use onlyF1________________F2________________F3________________F4________________2015 Mathematical Contest in Modeling (MCM) Summary SheetEradicating EbolaSummaryWith a high risk of death, Ebola virus disease (EDV), or simple Ebola, is a horrible disease which has caused great amount of death. In this paper, we mainly build two mathematical model to help eradicate Ebola, including a Virus Propagation Model based on BA scale-free network and SIRED, a delivery system model base on local optimization.For the former part, we firstly establish a BA scale-free network to simulate the realistic interpersonal network. Basing on this network, we set up a series rules to describe the procedure of Ebola propagation, which can be refined as the “Susceptible-Exposed- Infective-Removal-Death” (SEIRD) model. By combining this two model toget her via stimulation, we, using the variation of infective number and death number to reflect the procedure of Ebola spread, successfully restore the propagation of Ebola and predict the variation trend of them. Both the infective number and death number have a high agreement with the report from WHO. Basing on the infective number curve, we easily gain the quantity of the medicine needed and the speed of manufacturing of the vaccine and drug.For the latter part, we use a local optimization method to establish a feasible delivery system. Firstly, we choose Representative points in the map and make clustering analysis based on Euclidean distance, to classify points into three area parts. Then, we select delivery centers based on Analytic Hierarchy Process (AHP) and Principal Component Analysis (PCA) in each part. Besides, routes are designed according to prim algorithm, aiming at minimum the cost in every part. In this way, we build a delivery system. By comparing the results with treatment Centers distribution which has been built, the effectiveness of the model could be examined.Besides, we also discuss other critical factors, such as isolation measures, in the further discussion part. We conclude that isolation measures play a significant role thought the entire process of eradicating Ebola.Above all, our models are both scientific and reliable. They can be applied further to other relative problems.Key Words:SIRED, Complex Network, Cluster Analysis, Analytic Hierarchy Process (AHP) Delivery Systems Model (DSM), Principal Component Analysis (PCA)Table of Content1.Introduction (1)1.1.Background (1)1.2.Restatement of the Problem (1)2.Assumptions and Notions (1)2.1.Assumptions and Justifications (1)2.2.Notions (2)3.The Virus Propagation Model Based on Complex Networks and SEIRD Model (3)3.1.Model Overview (3)plex Network Model (3)3.2.1.Small-World Network Model (3)3.2.2.BA Scale-Free Network Model (4)3.3.SIR-Based SEIRD Model (5)3.3.1.SIR Model (5)3.3.2.SEIRD Model (6)3.4.The Study of Infection Rate, Recovery Rate and Death Rate Based on the LeastSquare Method (6)3.4.1.The Relevant Calculation about Infection Rate (6)3.4.2.The Relevant Calculation about the Recovery Rate (7)3.4.3.The Relevant Calculation of Death Rate (7)3.5.The Simulation of the Transmission of Ebola Virus (8)3.5.1.The Simulation of Complex Network Model (9)3.5.2.The Simulation of Virus Transmission (10)3.6.Results and Result Analysis (11)3.6.1. A Complex Network Simulation Results Model (11)3.6.2.The Spread of the Virus the Simulation Results (12)4.Delivery Systems Model(DSM) Based on Local Optimization (13)4.1.Model Overview (13)4.2.Cluster Division Based on Cluster Analysis (14)4.3.Delivery Centers and Routes Planning Based on AHP and PCA (17)4.3.1The Three-hierarchy Structure (18)4.3.2Analytic Hierarchy Process and Principal Component Analysis for DSM .. 194.3.3Obtain the Centers (21)4.3.4Obtain the Routes (22)4.4.Results and Analysis (23)5.Other Critical Factors for Eradicating Ebola (24)5.1The Effect of the Time to Isolate Ebola on Fighting against Ebola (24)5.2The Effect of Timely Medical Treatment to Isolate Ebola on Fighting against Ebola (25)6.Results and results analysis (26)6.1.The virus propagation model based on complex networks (26)6.1.1.The contrast and analysis concerning the results of simulation and thereality (26)6.1.2.Forecast for the future (28)6.2.Delivery Systems Model Based on Local Optimization (28)7.Strengths and Weaknesses (29)7.1.Strengths (29)7.2.Weaknesses (29)8.Conclusion (30)9.Reference (30)10.Appendix (1)1.Introduction1.1.BackgroundWith a high risk of death, Ebola virus disease (EDV), or simple Ebola, is a disease of humans and other primates. Since its first outbreak in March 2014, over 8000 people have lost their lives. And till 3 February 2015, 22,495 suspected cases and 8,981 deaths had been reported. [1] However, this disease spreads only by direct contact with the bold or body fluids of a person who has developed symptoms of the disease. Following infection, patients will typically remain asymptomatic for a period of 2-21 days. During this time, tests for the virus will be negative, and patients are not infectious, posing no public health risk.[2] And recently, the world medicine association has announced that their new medication could stop Ebola and cure patients whose disease is not advanced. Thus, a feasible delivery system is in great demand and measures to eradicating Ebola should be taken immediately.1.2.Restatement of the ProblemWith the background mentioned above, we are required to build a model to help eradicate Ebola, which can be decomposed as:●Build a model, which can estimate the suspects number, exposed number,infect number, death number and recover numbers, to describe the spreadprocedure of the Ebola from its very beginning to the future.●Build an optimized model to help establish a possible and feasible deliverysystem including selecting delivery location and delivery system networkdesign.●Estimate of the quantity of the needed medicine and manufacturing speed ofvaccine or drug, based on the results of our models.●Discuss other critical factors which help eradicate Ebola.2.Assumptions and Notions2.1.Assumptions and JustificationsTo simplify the problem, we make the following basic assumptions, each of which is properly justified.●Assume that there is no people flow between countries after outbreak ofdisease in the country.After the outbreak, countries usually will ban thecontact between locals and foreigners to minimize the incoming of the virus.●Assuming that virus infection rate and fatality rate will not change bythe change of regions.Virus infection rate and fatality rate are largelydetermined by the nature of the virus itself. The different between differentregions just have a little effect and it will be ignored.●Assume that there are only rail, road and aircraft for transportation. Inthe West Africa, waterage is rare. Rail, and road are for nearby transportationwhile aircraft is for faraway.2.2. NotionsAll the variables used in this paper are listed in Table 2.1 and Table 2.2.Table 2.1 Symbols for Virus Propagation Model(VPM)SymbolDefinition Units βInfection Rate for the Susceptible in SIR Model or SEIRD Model unitless γRecovery Rate for the Infective in SIR Model unitless rRateRecovery Rate for the Infective in SEIRD Model unitless dRateDeath Rate for the Infective in the SIR Model or SEIRD Model unitless ∆N iNew Patients on a Daily Basis person N i−1The Total Number of Patients in the Previous Day person nThe Average Degree of Each Node in the Network unitless tTime S ∆D iThe New Death Toll on a Daily Basis person D i−1The Total Number of Patients in the Previous Day person moThe Initial Number of Nodes in the BA Scale-Free Network node mThe Number of Added Sides from One New Node in the BA Scale-Free Network side ∏iThe Probability for the Connection between New Nodes and the Existing Node I in the BA Scale-Free Network unitless NThe Total Number of Nodes in the BA Scale-Free Network node k iThe Degree of Node I in the BA Scale-Free Network unitless eThe Number of Sides in the BA Scale-Free Network side n SThe Number of the Susceptible in the SEIRD Model person n EThe Number of the Exposed in the SEIRD Model person n IThe Number of the Infective in the SEIRD Model person n RThe Number of the Removal in the SEIRD Model person n DThe Number of the Dead in the SEIRD Model person RThe Probability of Virus Propagation from the Recovered unitless RandomE The Number of the Exposed Who Have Reached the Exposed Time Limit Ranging from 2 to 21 Days at the Current Momentperson n E(一天)t The Number of the Exposed Who Have Reached the Final Day of the ExposedTime Limit yet not quarantine personTable 2.2 Symbols for Delivery Systems Model(DSM)SymbolDefinition Units Athe judging matrix unitless a ijThe element of judging matrix unitless λmaxthe greatest eigenvalue of matrix A unitless CI the indicator of consistency check unitlessCR the consistency ratio unitlessRI the random consistency index unitlessCW the weight vector for criteria level unitlessAW the weight vector for alternatives level unitlessY the evaluation grade unitlessV A set of points unitlessV i,V j the point of V unitlessE A set of edges unitlessDis ij The real distance of i and j unitless Arrive ij Judging for whether there is an side between i and j unitless3.The Virus Propagation Model Based on Complex Networks and SEIRD Model3.1.Model OverviewWe aim to build a Susceptible-Exposed-Infective-Removal-Death (SEIRD) virus propagation model which is based on Susceptible-Infective-Removal (SIR) model. The aimed model is featured by complex networks, which exhibit two statistical characteristics, including the Small-World Effect and the Scale-Free Effect. These characteristics could produce relatively real person-to-person and region-to-region networks. Through the statistics of the existing patients and deaths, we will try to find the relationship among the infection rate, the recovery rate and the death rate with the change of time. Then, with the help of SEIRD model, these statistics would be used to simulate the current situation concerning the number of the susceptible, the exposed, the infective, the recovered and the dead and conduct the prediction of the future.plex Network ModelResearches have shown that the person-to-person networks in real life exhibit the Small-World Effect and Scale-Free Effect. Here we will introduce the Small-World Network Model by Watts and Strogatz, and the Scale-Free Network Model by Barabdsi and Albert [3].3.2.1.Small-World Network ModelSince random network and regular network could neither properly present some important characteristics of real network, Watts and Strogatz proposed a new network model between the random network and regular network in 1998, namely WS Small-World Network Model, the construction algorithm of which is as follows.Start from a regular network: consider a regular network which contains N nodes, and these nodes form a ring. Each node is linked with its adjacent nodes, the number of which is K/Z on both left side and right side. Also, K is an even number.Randomized re-connection: the probability P will witness a random re connection with each side in the network. In other words, an endpoint of a certain side will remain unchanged and the other endpoint would be the node in the random selection.There are two rules. The first is two different nodes will at most have one side. The second is every node cannot have a side which is connected with this node [4].Randomized re-connection in construction algorithm of the WS Small-World Model may damage connectivity of network, so Newman and Watts improved this model in 1999. The new one is called NW Small-World Model, the construction algorithm of which is as follows.Start from a regular network: consider a regular network which contains N nodes, and these nodes form a ring. Each node is linked with its adjacent nodes, the number of which is K/Z on both left side and right side. Also, K is an even number.Randomized addition of sides: the probability P will witness the random selection of two nodes and the subsequent addition of a side between these two nodes. There are two rules. The first is two different nodes will at most have one side. The second is every node cannot have a side which is connected with this node[4].The network constructed by the two models are shown in Fig 3.1.Fig 3. 1 WS Small-World network and NW Small-World network3.2.2.BA Scale-Free Network ModelIn October, 1999, Barabdsi and Albert published article in Science called "Emergence of Scaling in Random Networks" [5], which proposed an important discovery that the distribution function of connectivity for many complex networks exhibit a form of power laws. Since no obvious length characteristics of connectivity could be seen among nodes in these networks, so they are called scale-free networks.As for the cause of power laws distribution, Barabasi and Albert believe that many previous network models did not take into account two important characteristics of actual networks: the consistent expanding of network and the nature of new nodes’ prior connection in the network. These characteristics will not only make node degrees which are relatively larger increase much faster, but also produce more new nodes, thus node degrees will become even larger. Then we could see the Matthew Effect. [4]Based on the Scale-Free Network, Barabasi and Albert proposed a scale-free network model, called BA Model, the construction algorithm of which is as followsi.The expanding of network: start from a network which has Mo nodes, thenintroduce a new node after each time interval and connect this node with mnodes. The prerequisite is m≤m0.ii.Prior connection: the probability between a new node and an existing node iis ∏i, the node degree of i is k i, and the node degree of j is k j. These threefactors should satisfy the following equation.∏i=k i/∑k jj(3-1) After t steps,this algorithm could lead to a network featured by m0+t nodes and m×t sides.The network of BA Model is shown in Fig 3.2.Fig 3.2 BA Scale-Free Network3.3.SIR-Based SEIRD Model3.3.1.SIR ModelSIR is the most classic model in the epidemic models, in which S represents susceptible, I represents infective and R represents removal. Specifically, the susceptible are those who are not infected, yet vulnerable to be infected after contact with the confirmed patients. The infective are those who have got the disease and could pass it to the susceptible. As for the removal, it refers to those who are quarantined or immune to a certain disease after they have recovered.In the disease propagation, SIR Model is built with the infection rate as β, the recovery rate as γ, which is shown in Fig 3.3:Fig 3.3 SIR propagation modelThis model is suitable epidemics which have the following features: no latency, only propagated by the patients, difficult to cause death, patients are immune to this disease after recovery once and for all. As for the Ebola virus, this model is insufficient to present the propagation process. Therefore, we propose the SEIRD model based on the SIR model and overcome the defects of the SIR model, thus making the SEIRD model more suitable for the research of Ebola virus.3.3.2.SEIRD ModelThe characteristics of Ebola virus are shown in Table 3.1:Table 3.1 The characteristics of Ebola virus characteristicsDetailsLatency Exposed period ranging from 2 to 21days with no infectivity during this stage[2]Retention After the recovery, there is still a certain chance of propagation[6]Immunity Recovery is accompanied with lifelong immunityTherefore, it is needed to add E (the exposed) and D (the dead) in the SIR model.E represents those who have been infected, have no symptoms, and not contagious. But within 2-21 days, the exposed will become contagious. D represents those who are dead and not contagious.From Table 3.1, we know that Ebola virus has the feature of retention, because even when they are in the state of removal, it is still possible these recovered will be infectious.In the process of disease propagation, SEIRD has witnessed the infection rate as β and the recovery rate as rRate and dRate,which is shown as follows.Fig 3.4SEIRD propagation model3.4.The Study of Infection Rate, Recovery Rate and Death RateBased on the Least Square MethodAs for the calculation of infection rate, recovery rate and death rate, we could make use of the least square method to match the daily confirmed patients and the dead toll, thus getting the function about the relationship with the passage of time.And we choose the relevant data from Guinea since it is in severely hit by the Ebola outbreak in West Africa. The variance regarding the total number of patients and the total death toll could be seen in Appendix 11.1.3.4.1.The Relevant Calculation about Infection RateThe infection rate refers to the probability that the susceptible are in contact (here it refers to the contact with body fluids) with un-isolated patients and infected with the virus. For each infective patient, the number of side is the node degree, namely the number whom he or she could infect. Therefore, the infection rate could be calculatedin this way: the number of new patients each day divides the possible number of whom each confirmed patient could infect. The number of new patients is ∆N i. The total number of patients in the previous day is N i−1. The average node degree in the network is n. The equation is as follows.β=∆N i/(N i−1×n)(3-2) The β could be calculated based on the total number o f patients in Guinea (see Appendix 11.1). Then with time data and the method of least square method, we could do data fitting and calculate the time-dependent equation. The fitting image is listed in Fig 3.5.Fig 3.5 The fitting result image of β with the passage of timeThe result of fitting curve is:β=0.0367×t−0.3189/n(3-3) And n is the average degree of person-to-person network in the process of simulation.3.4.2.The Relevant Calculation about the Recovery RateThe recovery rate refers to the probability of recovery for those who have been infected. Since at present, few instances of recovery from Ebola disease could be witness in the world (probability is almost close to zero), so the rRate here is set to be 0.001.3.4.3.The Relevant Calculation of Death RateThe death rate refers to the probability that patients become dead in process of treatment. And the death rate is calculated in the following way: the total number of new deaths every day divides the total number of patients in the previous day. The total number of new deaths in a new day is ∆D i. The total number of patients in the previous day is D i−1. The equation isdRate=∆D i/D i−1(3-4) The dRate could be calculated based on the total number of dead patients and the total number of patients in Guinea (see Appendix 11.1). Then with time data and the method of least square method, we could do data fitting and calculate the time-dependent equation. The fitting image is listed in Fig 3.6.Fig 3.6 The fitting result image of dRate with the passage of time The result of fitting curve is:dRate=(−6.119e−07)×t2 −0.0001562×t + 0.01558(3-5) 3.5.The Simulation of the Transmission of Ebola VirusThe simulation for Ebola will mainly be divided into two aspects, namely the simulation of complex network model and that of virus spread. The related flow chart will be shown in Fig 3.7.Fig 3.7 Flow chat of Stimulation of Ebola Virus Transmission3.5.1.The Simulation of Complex Network ModelFrom the previous introduction about complex network model, BA Scale-Free Network Model has displayed the Matthew Effect, which means the stronger would be much stronger and the weaker would be much weaker. In social networks, this effect is also widely seen. Take one person who just joins in a group for an example, he would normally contact with those who have the largest circle of friends. Therefore, those who get the least friends can hardly know more new friends. This finally leadsto a phenomenon that the person who is most acquainted will have more and more friends and vice versa.Based on this, the BA Scale-Free Network Model is apparently superior to that of Small-World Model. As a result of that,we would use the former to simulate the interpersonal network.According to the rules of BA network model, we should start from a network which has Mo nodes, then introduce a new node after each time interval and connect this node with m nodes. The prerequisite is m≤m0.During the connection process, the probability between a new node and an existing node i is ∏i, the node degree of i k i, and the node degree of j is k j. These three factors should satisfy the following equation.∏i=k i/∑k jj(3-6) Specifically, when the existing nodes have larger node degrees, it would be much more easier for the new ones to connect with the existing ones.After t steps, there would be a BA Scale-Free Network Model. The number of its nodes is expressed as N and the number of its sides is expressed as e:N=m0+t(3-7)e=m×t(3-8) The population of Sierra Leone now is 6.1 million and we would use this datum to produce its interpersonal network. For more details, please refer to Appendix 11.2.3.5.2.The Simulation of Virus TransmissionIn the transmission process, we assume the infection rate is β, the recovery rate is rRate, and the death rate is dRate. Based on the fitting results we previously get, we can simulate the virus transmission situation as time goes.Here comes the details.In the first place, there would be one patient who initiates the epidemic. Every single day, the virus would transmit to others among the main network and the probability of one-time propagation is β. Also, the patients would have rRate of recovery and dRate of death. Meanwhile, if the patient has been infected for 30 days, he or she would die anyway. The exposed would be in a latent period, during which they are not infectious and asymptomatic. In 2 to 21 days, these exposed ones would become infectious.n S、n E、n I、n R、n D represent the 5 different numbers of people in the SEIRD Model. t means time step (or a day),R represents the probability that those who have recovered patients would infect others. RandomE denotes the number of exposed patients who have reached the period of 2 to 21 days at the current moment.Here is the formula showing the changes in the numbers of those five types of people.n S t+1=n S t−n I t×n×β−n R t×n×β×R(3-9) n E t+1=n E t+n I t×n×β+n R t×n×β×R−RandomE(3-10) n I t+1=n I t+RandomE−n I t×rRate−n I t×dRate(3-11)n R t+1=n R t+n I t×rRate(3-12)n D t+1=n D t+n I t×dRate(3-13) After that, when the transmission has reached a certain scale (20 days after the transmission), the international organizations would adopt the measure of quarantine towards infective patients to avoid further contagion. As for the exposed patients, since they could not be quarantined immediately, so they have one day to infect others and in the next day, they would be quarantined at once.Finally, for those who have recovered, there is still a certain chance that they will propagate the disease within their networks.n Ed t on behalf of the moments lurk in reaching the last day with infectious but has not yet been isolated number. The process of five types of personnel number change:It represents the number of the exposed who have reached their last day of latency, begin to be contagious and have not yet been quarantined at the current moment. During this process, the formula exhibiting changes for these five categories of people could be listed as follows.n S t+1=n S t−n Ed t×n×β−n R t×n×β×R(3-14) n E t+1=n E t+n Ed t×n×β+n R t×n×β×R−RandomE(3-15)n I t+1=n I t+RandomE−n I t×rRate−n I t×dRate(3-16)n R t+1=n R t+n I t×rRate(3-17)n D t+1=n D t+n I t×dRate(3-18)3.6.Results and Result Analysis3.6.1. A Complex Network Simulation Results ModelPersonnel network is illustrated as Fig 3.8. Because of the population is too large so it is difficult to figure out. We use a red point to represent 10000 persons.Fig 3.8 Personnel relation network diagramThe probability distribution of nodes in a network of degrees is illustrated as Fig 3.9.The same node degrees set in 2-4, in it with degree of 4most.On behalf of each person every day in the network average fluid contact with 2-4 people.Fig 3.9 The probability of the node degree distribution map network3.6.2.The Spread of the Virus the Simulation ResultsThe number of every kind of the curveof the change over time in SEIRD model is illustrated in Fig 3.10. Due to the large population, the graph is local amplification. It is unable to find the number of susceptible people in the picture. For the rest of the curve, black represents the exposed, red represents the sufferer and pink for the removed.Fig 3.10 The number of SEIR model with the change of time4.Delivery Systems Model(DSM) Based on Local Optimization4.1.Model OverviewOptimized distributing is the most significant problem while building Delivery Systems, and it is a NP (nondeterministic polynomial) problem. In order to studied the problem, Li Zong-yong, Li Yue and Wang Zhi-xue organized an optimized distributing algorithm based on genetic algorithm in 2006[7]. In addition, Liu Hai-yan, Li Zong-ping, Ye Huai-zhen[8]discussed logistics distribution center allocation problem based on optimization method. With the help of current literature, we build a Delivery Systems Model (DSM) for drug and vaccine delivery, based on Local Optimization.In this topic, in order to establish the feasible delivery systems for WesternAfrica, we take Sierra Leone as an example. There is 14 Districts in Sierra Leone.In this model, we choose points based on Sierra Leone politics. Representative point in every District is selected. The points are located by longitude and latitude. We use Euclidean distance-based clustering analysis to process the data, so that the point set will be classified into three sub-set. Every sub-set is a part. Then, one point in every sub-set will be selected as a delivery center based on Analytic Hierarchy Process (AHP) and Principal Component Analysis (PCA). Besides, we will design the routes based on Prim algorithm, aiming at minimum the cost in every sub-set. In this way, we will build a delivery system.In addition, we will compare the results with Treatment Centers distribution which has been built, to analyze the model.4.2. Cluster Division Based on Cluster AnalysisThere are 14 districts in Sierra Leone. In every district, we choose the center position as a point. In this model, the first step is to cluster. Cluster Analysis is based on similarity. In this model, the similarity could be measured by geography distance. There is different method for cluster.Suppose there are n variable, and the objects are x and y1212(,,,),(,,,),n n x x x x y y y y ==By Euclidean distance, the distance can be calculated by (4-1)(,)d x y =(4-1)By Cosine Similarity distance, the distance can be calculated by (4-2)2(,)ni ix yd x y =∑(4-2)In this model, we use Euclidean distance. We cluster 14 districts into three Parts. First of all, we need to know about the distances between districts. The 14 Districts of Sierra Leone are located by longitude and latitude. Establish a right angle coordinate system. Set the longitude as the abscissa and latitude as ordinate. Set the Greenwich meridian and the Equator as 0 degree. The West and the South are regarded as negative while the East and the North are regarded as positive. In addition, the data related to the latitude and longitude would be converted to standard decimal form. For example, point (1330',830'W N ︒︒) is located as (-13.5, 8.5).According to World Health Organization (WHO )[9]statistics data, the basic data of Sierra Leone’ Districts are obtained, which is shown in Table 4.1 .。
埃博拉病毒的传播预测与控制美赛论文
埃博拉病毒的传播预测与控制摘要2014年非洲爆发了历史上最为严重的病毒疫情--埃博拉。
据科学研究报道,这个病毒一旦感染人体,将有着高达90%以上的死亡率,这是一种世上最厉害的感染病毒(生物安全等级为4级),如何消灭埃博拉成为当前的首要任务。
当然,疾病的传播、患病人口的预测、药物的生产和运输,都是消灭埃博拉必须考虑的因素。
根据病毒传播率、感染者人数的预测、药物的合理分配和隔离人数的比重等因素,本文运用随机微分方程、产销平衡和最优控制三种算法分别建立了随机微分方程模型、线性规划模型和最优隔离控制模型。
这三个模型分别解决了埃博拉病毒的传播规律、感染者人数的预测问题、药物的运输问题和以隔离控制为决定性作用因素的优化问题。
针对模型一:将环境因素作为随机变量,结合病毒传播率,本文建立了随机微分方程模型,对以后10个月的患病人口总数进行了预测。
利用数值解方法,对埃博拉病毒感染者人数进行预测,并通过仿真过程验证了疾病传播率的一个临界值,得出能使埃博拉传播速度降低直至消亡的一个条件。
针对模型二:假设几内亚、利比里亚和塞拉利昂为需求地,美国、中国、日本、俄罗斯、法国以及瑞士为药物生产地。
利用产销平衡原理,建立了时间优化模型,求得产地与需求地之间的最短运输时间为15.8小时。
针对模型三:本模型基于SIR传染病模型,利用极值原理给出了最优控制的设计方案,通过仿真,验证了最优控制方案的优越性。
同时,由协态方程得到当系统控制变量为0.50时,隔离效果最佳,也证明了隔离是控制疾病继续传播最有效的控制措施。
本文三个模型均使用的官方数据,而且内容上层层优化,互相补充,使文章所述更为具体,更为实用,为埃博拉病毒问题的解决提供了一份可靠地,可行的,可依赖的数学模型。
关键词:埃博拉病毒预测随机微分方程优化问题最优隔离控制1.问题重述—不用翻译1995年5月14日,扎伊尔发现罕见传染病埃博拉。
2014年,埃博拉病毒首次爆发就夺走了近300人的生命,2014年再度爆发,大约4000人命丧黄泉。
关于埃博拉病毒传播的分析与预测模型
关于埃博拉病毒传播的分析与预测模型作者:梁晴宋彦辰来源:《科学与财富》2018年第33期摘要:埃博拉病毒所致疾病传播速度远远高于其控制的速度,本文通过分析其传播过程建立了埃博拉病毒传播模型,并使用拉丁超立方抽样对疾病传播进行预测估计。
首先,根据Sir Epidemic动态系统-seiifr模型建立了一个模型,在这个模型中,考虑了暴露于人群中的易感人群、埃博拉病人以及患者的自愈恢复。
为了确定最优参数,构造了最小二乘法优化方案。
结果显示该模型短期预测效果较好。
关键词:埃博拉病毒传播拉丁超立方抽样最小二乘法引言2014年西非全面爆发的埃博拉疫情(EVD)是世界近年来见证的规模空前、规模巨大、范围广泛和严重后果的公共卫生危机。
本轮埃博拉疫情主要突击西非几内亚、利比里亚和塞拉利昂三个国家。
这是自1976年人类首次发现并命名埃博拉病毒以来历史上最严重的公共卫生灾难,显示出与过去的许多不同特征。
1 埃博拉传播模型为了研究埃博拉病毒传播的规律性,本文建立了分阶段的埃博拉传播模型,明确纳入疾病的自然病史和动态ETU能力,同时考虑到诸如报告率、症状评分和高危人群比例问题等因素。
可以使用本文模型来评估预测病例的不确定性、死亡和床位预测,估计疾病的每个阶段对传播的影响,并检查ETU能力供应,减少传染病对EVD爆发的影响动态的关系。
从图1所示的结构模型可看出,该模型包括分阶段感染过程,以反映随着感染进展而增加的感染症状和传播。
埃博拉经常经历多个阶段的疾病:第一阶段是感染的初始阶段,并且症状趋于轻微,并且常常发展成腹泻和呕吐;第二阶段是更严重的阶段,伴有更严重的症状(例如出血和多器官衰竭),典型的进展约5-7天。
受感染的人最有可能在第一阶段复原,而第二阶段通常是致命的。
图1的相应等式:其中S代表易感人群比例,E代表暴露人口比例,R代表最近恢复的人口F代表已经死亡和正在被埋葬的人的比例。
最后,将模型与世卫组织提供的关于累计病例和死亡的数据联系起来。
埃博拉病毒传播分析与数学建模word精品

****大学数学建模竞赛承诺书我们仔细阅读了****大学数学建模竞赛的参赛规则与竞赛纪律。
我们完全明白,在竞赛开始后参赛队员不能以任何方式(包括电话、电子邮件、网上咨询等)与队外的任何人研究、讨论与赛题有关的问题。
我们知道,抄袭别人的成果是违反竞赛纪律的,如果引用别人的成果或其他公开的资料(包括网上查到的资料),必须按照规定的参考文献的表述方式在正文引用处和参考文献中明确列出。
我们郑重承诺,严格遵守参赛规则和竞赛纪律,以保证竞赛的公正、公平性。
如有违反竞赛纪律的行为,我们将受到严肃处理。
我们授权****大学数学建模竞赛组委会,可将们的论文以任何形式进行公开展示(包括进行网上公示,在书籍、期刊和其他媒体进行正式或非正式发表等)<日期:2015年05月04日埃博拉病毒传播分析摘要本文的研究对象为1976年在苏丹南部和刚果的埃博拉河地区发现的埃博拉病毒。
埃博拉病毒是一种生物安全等级为4级,并且能引起人类和灵长类动物产生埃博拉出血热的烈性传染病病毒,其主要是通过病人的血液、唾液、汗水和分泌物等途径传播。
其病毒的潜伏期通常只有5天至10天,感染后2〜5天出现高热,6〜9天死亡。
面对其强大的传染力和对人类健康的巨大威胁,本文通过数学建模的方法了解埃博拉病毒的传播规律,并分析隔离措施的严格执行和药物治疗效果的提高等措施对控制疫情的作用。
本文中,首先我们根据已给的信息及相关假设数据,通过对已知条件和所给表格书记的分析,我们大致明白了猩猩从潜伏到发病再到死亡或自愈的过程,因此我们采用了excel拟合曲线,分析其发病、潜伏、自愈、死亡和隔离的相应的变化曲线,估计参数,再根据其建立数学模型,并用MATLA求解方程组,调试参数,从而得到我们需要的结果。
其次通过对已经得到的数据和曲线图的分析,可以得出人类通过严格的药物控制过后,对其发病和潜伏的影响,从而能够达到对疫情的控制的作用,并且对埃博拉病毒未来发展趋势有了更深刻的了解,以为更好的控制埃博拉病毒做出贡献。
埃博拉病毒的传播
西安工业大学数学建模竞赛承诺书我们仔细阅读了中国大学生数学建模竞赛的竞赛规则.我们完全明白,在竞赛开始后参赛队员不能以任何方式(包括电话、电子邮件、网上咨询等)与队外的任何人(包括指导教师)研究、讨论与赛题有关的问题。
我们知道,抄袭别人的成果是违反竞赛规则的, 如果引用别人的成果或其他公开的资料(包括网上查到的资料),必须按照规定的参考文献的表述方式在正文引用处和参考文献中明确列出。
我们郑重承诺,严格遵守竞赛规则,以保证竞赛的公正、公平性。
如有违反竞赛规则的行为,我们将受到严肃处理。
我们参赛选择的题号是(从A/B/C中选择一项填写): B所属学校(请填写完整的全名):西安工业大学参赛队员(打印并签名) :1. 陈文兴2. 闫丽萍3. 魏栩指导教师或指导教师组负责人(打印并签名):日期:2015 年8 月1 日埃博拉病毒传播及控制分析摘要埃博拉病毒是能引起人类和灵长类动物产生埃博拉出血热的烈性传染病病毒,有很高的死亡率。
本文根据研究人员统计所给出的前四十周人类和猩猩的发病数量和死亡数量等信息,对该病毒的传播、预测与控制进行研究并建立模型,并分析了隔离措施的严格执行和药物治疗效果的提高等措施对控制疫情的作用。
针对问题一,在了解埃博拉病毒的传播情况后,根据猩猩的发病情况建立了马尔萨斯模型:()t e t x 0270.097.154=。
在此模型中,较好地描述病毒在“虚拟猩猩种群”中的传播情况;根据“虚拟猩猩种群”中的数据,用matlab 拟合出不同状态下猩猩数量的变化曲线,并以发病状态为例建立灰色预测模型()()()⎪⎪⎩⎪⎪⎨⎧-=+-=+=+-∧897947))1((10539.600.0669 0124.0)0(11e a b e a b x k x x dt dx a ,从而较准确的预测出接下来第80、120、200周的猩猩发病状态的数据。
针对问题二,为描述埃博拉病毒在“虚拟种群“中的相互传播规律及人和猩猩的疫情发展状况,建立SEIR 模型 ()()()()()()()()()()⎪⎩⎪⎨⎧⋅⋅--=⋅⋅---⋅⋅---=⋅⋅----⋅⋅=----)(111)(111)(111)(111)(331212t I e a dt dT t I e a t Q e a a dt dI t Q e a a t I r dt dQ t t t t λ 模型求解时,通过对模型的推导,我们发现不能给出每个函数的解析解,因此考虑利用matlab 中的ode45函数进行求解。
埃博拉病毒的传播分析
=P N (t), 其中 P 是常数。但 应是一个有上限的值, 不
能无限增长。 对于模型中的 M, 定义 10 , (3) M= 10 I t) 考虑到感染者在不同时期的感染能力不同, 我们在( 上 加入了影响因子 M。题中表明感染者一般 6 ~ 9 天死亡, 为 10) 简化我们统一将感染者存活时间定为 10 天, 通过 Mod (t, M 则反映了此时他的感染传 来反映感染者处于哪一感染期, 播能力。 4 问题的求解 4.1 问题一的求解 4.1.1 参数的求解 首先对 SEIR 模型中的四个参数进行求解: 对于潜伏者转换为感染者的转化率 1, 在网上查阅相关资 料可得:
理|论|广|角
埃博拉病毒的传播分析
王
(西北工业大学
摘 要
硕
710068)
陕西·西安
由于猩猩的潜伏期无法忽略,因此我们建立了经典的传染病传播 SEIR 模型。但由于在发病的不同时期患
病者的感染能力不同, 因此我们在此模型的基础上对感染人数增加了一个扰动项。我们未考虑猩猩的出生率和死亡 率, 从而得到适合此问题的改进的 SEIR 模型。通过对模型中参数的求解, 我们可以对埃博拉病毒在猩猩群体的传播 进行预测。 关键词 埃博拉病毒 R332 中图分类号: 1 问题分析 1.1 问题一的分析 问题一是对埃博拉病毒在猩猩种群中传播感染规律的研 究。此问题属于传染病传播问题,解决此类问题一般建立经 典的 SIR 仓室模型进行求解。考虑到本问题中埃博拉病毒的 潜伏期对本问题的结果有不可忽略的影响,因此我们在经典 SIR 模型的基础上增添潜伏期这一仓室建立 SEIR 模型。考 虑到猩猩种群的总数较小 (3000 只) , 并且猩猩的繁殖周期较 长 (3-4 年) , 因此在本模型中忽略猩猩自然出生率及死亡率对 问题结果的影响。 2 模型假设 (1) 假设猩猩的自然出生率及死亡率对预测结果无影响; (2) 假设猩猩和人都处在除埃博拉疫情外正常的生活状态, 不受其它因素影响; (3) 假设感染者在自愈的同时获得免疫力, 不会再感染病 毒; 3 模型的建立 3.1 问题一模型的建立 问题一是考虑在猩猩种群中埃博拉病毒的传播情况,本 问题中埃博拉病毒的潜伏期对本问题的结果有不可忽略的影 响。猩猩种群的总个体数较小 (3000 只) , 并且猩猩的繁殖周 期较长 (3-4 年) , 因此在本模型中忽略猩猩自然出生率及死亡 率对问题结果的影响。同时考虑到有效传染率 、 潜伏期到患 病的转换率 、 死亡率 、 治愈率 r 等因素的影响。我们建立如 下 SEIR 模型: 改进的 SEIR 模型 最小二乘法 A 文献标识码: 们令
埃博拉病毒传播模式的研究
再将 x( t ) 分别代入病毒传播的控后方程 , 就可 以给 出 D ( t ) , R( t ) 以及 Y( t ) 的数 值 解 。 3 . 2控 后 模 型 的 求 解 同理 , 我 们 求 得 现 有病 人数 的解 析 解 为
x( t ) ( T ) e
二
二
二 : t ≥T
当 △= t —o时 , 有: = r X( t ) . ( L + L ) x X( t ) ( 2 ) 累计 死 亡 人 数 。 累 计死 亡 人 数 的 变化 = 新增死亡人数, 有 D( t + △t ) . D( t ) = L 。 x( t ) △t
n ,・ 、
-
2 4
』
l
I d t
= 磅
: L 2 X ( t )
I
心
. 6
【 Y ( O= ( r ) + D( f ) + ( 3模 型 的 求 解 3 . 1 控前模型求解 对 于现 有 病 人数 x( t ) , 可 以根 据 病 毒传 播 的控 , t ≤T 其中, f r :O . 5 5
其 中, 初始值为
i ( O ) :1
《 I r ( 0 ) = 1
l D( O ) = O
【 R ( 0 ) = 0
2 . 2 控 后 模 型
控后隔离强度从控前的 0 变为 P 。未被隔离的病人平均 每 人 单 位 时 间感 染 的人 数 r 随 时 间 逐渐 变 化 , 它 从 初 始 的 最大 值 a + b逐渐减少至最小值 a , a 、 b的值客观存在。设每个被隔 离 的病 人 单 位 时 间感 染 的 人数 为 r ( t ) = a + b e 。 其 中, 用来反映 r ( t ) 的变 化 快 慢 。 类似 于 控 前 模 型 , 我 们 得 到埃 博拉 传 播 的控 后 模 型 :  ̄ 一 c 其中 ’ = a +b e
埃博拉病毒传播问题的数学模型汇编
-4-
现在我们根据建立的模型利用已知数据进行求解,我们将题目中给出的数 据进行整理,得出我们建模求解需要的 S、E、I、R 四个群的猩猩数量(见附录 1),并且利用整理出的已知数据对微分方程组中的参数进行求解:
1)潜伏者日接触率1 (t):
1(t)
E / t I (t) * S(t)
(3)
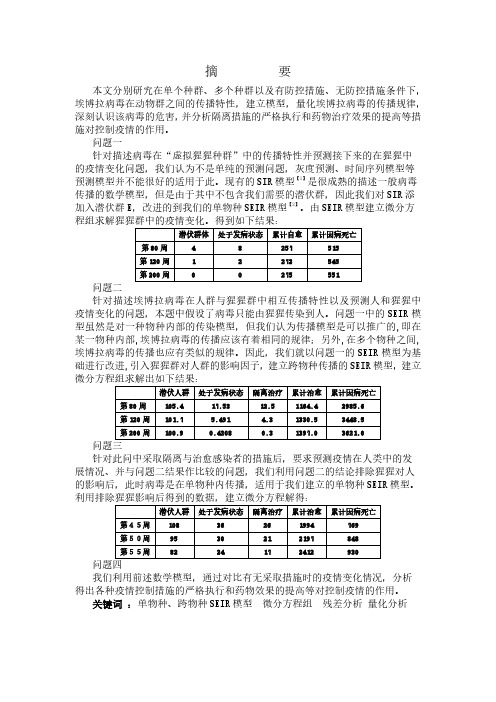
潜伏人群 处于发病状态 隔离治疗 累计治愈 累计因病死亡
第 80 周 105.4
17.53
12.5
1164.4
2985.6
第 120 周 101.7
5.491
4.3
1330.5
3448.5
第 200 周 100.9
0.4208
0.3
1397.0
3621.0
问题三 针对此问中采取隔离与治愈感染者的措施后,要求预测疫情在人类中的发 展情况、并与问题二结果作比较的问题,我们利用问题二的结论排除猩猩对人 的影响后,此时病毒是在单物种内传播,适用于我们建立的单物种 SEIR 模型。 利用排除猩猩影响后得到的数据,建立微分方程解得:
2)感染者日接触率 1 (t):
1 (t )
I / t I *S
(4)
3)退出率1(t) :
1 (t )
R(t) I (t)
(5)
4)潜伏群发病率1(t) :
1
(t
)
=每日新确认病例数
每日疑似累计数
(6)
由我们整理出来的数据带入以上公式,估算得:
1 1.085E-4, 1 0,1 0.3018,1 0.5121
三 、 符号说明
使用符号 S E I R R1 R2
(t ) (t) (t) (t)
数学建模在疾病扩散中的应用

数学建模在疾病扩散中的应用新冠病毒的爆发给全球范围内带来了灾难性的破坏,各国政府和科学家都在竭力寻找有效的方法来控制疫情的扩散和降低死亡率。
其中,数学建模成为了一种重要的工具,能够对疫情的传播规律和趋势进行分析,并预测未来发展趋势,以便及时采取应对措施。
疫情建模的基本思路是把一个疾病的传播过程看作一个数学模型,然后通过建立、分析和优化模型,预测疾病传播的趋势和规律,为疫情防控工作提供科学依据。
疫情建模主要涉及到统计学、动力学和微积分等方面的知识,其中微积分是建模的重要工具。
微积分是关于导数和积分的学科,其核心是对变化的分析和对整体和局部的描述。
在疫情中,微积分可以分析和预测疫情的发展趋势,可以对疾病传播速度、感染率、康复率和死亡率等指标进行深入研究。
微积分可以从中挖掘出疫情传播的规律性和规律性,找到一些有效的控制方法,并辅助政府和医疗机构在疫情防控工作中采取相应的应对措施。
数学模型能够对疾病传染过程各个方面进行深入研究,不仅能够对流行趋势、累计感染人数和病例分布等主要指标进行分析,还能够对影响疾病传播的各种因素进行分析。
例如,通过微积分分析感染速率,可以得出一个感染速率的微分方程。
再根据传染率、病毒基因特征、传染媒介的数量、个体免疫力等因素,以及人口密度、迁移历史、社会因素等因素之间的相互作用,建立一个多因素疫情模型,从而全面、准确地描述疾病传播的一切特征。
除了微积分,疫情建模还需要动力学、统计学和计算机科学等领域的知识。
动力学是研究物体运动的学科,可以用来研究病毒传染的过程和规律。
统计学主要涉及到数据的收集、分析和预测,可以用于疾病数据的处理和分析。
计算机科学提供了调用和管理这些数据的技术,从而将这些数据应用到实际问题中。
综合运用数学模型、动力学、统计学和计算机,可以建立一个完整的疫情模型,从而深入理解疾病的传播过程,为疫情防控工作提供科学依据。
例如,在新冠疫情爆发之初,各国科学家用多因素模型进行分析,推出了一系列应对措施,包括隔离措施、口罩戴法和疫苗研发等,这些措施都对抑制疫情的蔓延起到了至关重要的作用。
剖析埃博拉病毒传播模型及规律预测

剖析埃博拉病毒传播模型及规律预测1 模拟真实环境埃博拉病毒的自然宿主虽尚未最后确定,但已有多方证据表明猴子及猩猩等野生非人灵长类动物有埃博拉感染现象。
该病毒的传播途径分为人畜传播、人人传播两种。
2014年,在几内亚、塞拉利昂和利比里亚等国,许多受埃博拉病毒影响的人口都以丛林肉为重要的蛋白质和营养物质来源,与丛林中动物接触频繁。
这为人畜之间的病毒传播创造了条件。
我们现假设两个感染埃博拉病毒的虚拟种群:即某地区内的20万居民和3000只猩猩。
人能以一定的概率接触到所有的猩猩,当接触到有传播能力的猩猩后有一定概率感染病毒,而人发病之后与猩猩的接触可以忽略。
人与猩猩的潜伏期都为2周。
并在出现疫情41周后模拟外界医疗力量的介入,使得人类与猩猩不再发生接触,且隔离治疗人群的治愈率提高到80%。
模拟数据详见附录。
2 建立数学模型2.1 模型假设(1)依据人或猩猩的健康状态,将人或猩猩划分为健康者、埃博拉感染者(也称患病者)、退出者(含自愈者、死亡者);(2)自然封闭条件下,猩猩无自然迁移,故无病源的流入、流出,种群数量不变。
人类数量庞大,在无大规模迁移的情况下,认为人类数目为一定值,保持不变;(3)健康者中不包含退出者;(4)人和猩猩自愈后二度感染的概率均为0,人被治愈后二度感染的几率为0;(5)不存在有效免疫药物可使人对埃博拉病毒产生免疫,同时猩猩对病毒也不免疫;(6)人的传染途径有人传染人、猩猩传染人两条。
两条途径的传染率并不相同,分别假设为传染率C1和传染率C2。
C1猩猩与猩猩之间传染途径只有猩猩传染猩猩一条,假设猩猩之间的传染率为C0;(7)患病人无法传染患病猩猩;(8)41周外界介入后,猩猩与人的传播途径切断,隔离患者的治愈率提高到80%,同时未被隔离的患者治愈率不变。
2.2 符号说明符号说明如表1所示:3 模型的建立与求解3.1 数据处理根据累计死亡个体数,求得每周死亡个体数。
同理,根据累计自愈个体数,求得每周自愈个体数。
传染病数学模型

传染病数学模型传染病是一种严重的公共卫生问题,它可以通过空气、水和食物等媒介传播,对人类社会造成极大的危害。
为了有效地控制传染病的传播,需要对传染病进行数学建模,以便更好地预测和控制其传播。
一、引言传染病数学模型是一种利用数学工具来模拟传染病的传播和扩散的模型。
通过建立数学模型,可以对传染病的传播过程进行模拟和分析,预测其未来的发展趋势,为制定有效的防控措施提供科学依据。
二、传染病数学模型的建立1、确定模型的基本假设和参数建立传染病数学模型需要先确定模型的基本假设和参数。
这些假设和参数包括:传染病的传播途径、潜伏期、感染期、易感人群的数量、人口的流动等。
2、建立数学方程基于上述假设和参数,可以建立传染病传播的数学方程。
常用的方程包括:SIR(易感者-感染者-康复者)模型、SEIR(易感者-暴露者-感染者-康复者)模型、SEIRD(易感者-暴露者-感染者-康复者-死亡者)模型等。
这些模型可以描述传染病的传播过程,并预测其未来的发展趋势。
三、传染病数学模型的应用1、预测和控制传染病的传播通过建立数学模型,可以对传染病的传播过程进行模拟和分析,预测其未来的发展趋势,为制定有效的防控措施提供科学依据。
例如,通过模拟不同防控措施的效果,可以找到最有效的防控策略,减少传染病的传播。
2、评估疫苗接种的效果通过建立数学模型,可以评估疫苗接种的效果。
例如,通过比较接种疫苗和不接种疫苗的传播情况,可以得出疫苗接种对控制传染病传播的作用。
四、结论传染病数学模型是一种有效的工具,可以帮助我们更好地理解和控制传染病的传播。
通过建立数学模型,可以对传染病的传播过程进行模拟和分析,预测其未来的发展趋势,为制定有效的防控措施提供科学依据。
通过评估疫苗接种的效果,可以为制定合理的疫苗接种策略提供支持。
标题:数学模型在数学论文指导传染病模型1中的应用在当今世界,传染病的爆发和传播已经成为全球面临的共同挑战。
为了有效控制疾病的传播,我们需要对传染病模型进行深入研究。
埃博拉病毒感染数量的一个数学模型

埃博拉病毒感染数量的一个数学模型周后卿;徐幼专【期刊名称】《邵阳学院学报(自然科学版)》【年(卷),期】2014(000)004【摘要】Ebola virus disease (EVD),formerly known as Ebola haemorrhagic fever,is a severe,often fatal illness in humans. EVD outbreaks have a case fatality rate of up to 90%. EVD outbreaks occur primarily in remote villages in Central and West Africa,near tropical rainforests. The virus is transmitted to people from wild animals and spreads in the human population through human-to-human transmission. Severely ill patients require intensive supportive care. No licensed specific treatment or vaccine is available for use in people or animals. In the absence of effective treatment and a human vaccine,raising awareness of the risk factors for Ebola infection and the protective measures being taken are the only two ways to reduce human infection and death. This paper established a mathematical modelof Ebola virus,and made an empirical analysis of epidemic diseases. Furthermore,we made a prediction to the development of epidemic.%埃博拉病毒病(EVD)是严重的、往往致命的人类疾病,病死率高达90%。
基于计算流行病学的埃博拉出血热的传播与爆发仿真研究
基于计算流行病学的埃博拉出血热的传播与爆发仿真研究2014年4月,幾内亚爆发了以发热、粘膜出血为代表症状的一种严重的出血性疾病。
经过世界卫生组织(world health organization,WHO)评估后,认定该病由埃博拉病毒(Ebola virus)导致,称为埃博拉出血热(Ebola virus disease,EVD)。
这一烈性传染病,在短短的数月内迅速扩散到乌干达、刚果、加蓬、苏丹、科特迪瓦、南非、几内亚、利比里亚和塞拉利昂等国。
据WHO公告和已有研究,该病病死率高达50%~90%[1]。
这一病死率,远超霍乱、流感等烈性传染病。
此次埃博拉爆发来势凶猛,引发了全球性关注[2]。
尽管目前疫情主要蔓延于非洲,但随着中国和非洲经济文化联系的日益密切,大量人员频繁来往于中非之间,埃博拉疫情对于我国也构成了公共卫生意义上的威胁。
有鉴于此,国家有关部门对此次疫情给以了高度关注,并发布了防治指导性文件[3-4]。
疫苗研究也已经启动。
与此同时,在严控输入病例的同时,如何在传染性病例传入后,科学地估计疫情规模对于公共决策意义重大。
已有的科学证据表明,传染病根据其传播模式、病死率、防控力度以及易感人群规模等参数的不同其传播规律也极为不同[5-11]。
例如,杨芳廷[9]通过对SARS在某北方大城市爆发的系统仿真研究发现,恰当地建模能够有效地模拟SARS的人群传播模式。
通过数学模型可推导出不同的防控策略(如限制人员流动、对疑似感染者及早隔离等)对于病毒传播的影响[9-11]。
例如,要对快速传播的SARS实现有效控制,就必须在隔离全部疑似病例的同时,还要严格限制人口自由流动[11]。
EVD是一种传染途径尚未完全明确的烈性传染病,已知病毒主要通过体液接触传播,但也不能排除其具有经空气传播的可能[1,12-15]。
迄今为止,该病从未在中国发生过。
作为一个幅员辽阔、人口众多、人员流动频繁和国际交往日益密切的大国,我国已经初步建立了行之有效的急性传染病防控体系和卫生应急管理体系。
埃博拉病毒的根除数学建模论文

毕业设计(论文)原创性声明和使用授权说明原创性声明本人郑重承诺:所呈交的毕业设计(论文),是我个人在指导教师的指导下进行的研究工作及取得的成果。
尽我所知,除文中特别加以标注和致谢的地方外,不包含其他人或组织已经发表或公布过的研究成果,也不包含我为获得及其它教育机构的学位或学历而使用过的材料。
对本研究提供过帮助和做出过贡献的个人或集体,均已在文中作了明确的说明并表示了谢意。
作者签名:日期:指导教师签名:日期:使用授权说明本人完全了解大学关于收集、保存、使用毕业设计(论文)的规定,即:按照学校要求提交毕业设计(论文)的印刷本和电子版本;学校有权保存毕业设计(论文)的印刷本和电子版,并提供目录检索与阅览服务;学校可以采用影印、缩印、数字化或其它复制手段保存论文;在不以赢利为目的前提下,学校可以公布论文的部分或全部内容。
作者签名:日期:学位论文原创性声明本人郑重声明:所呈交的论文是本人在导师的指导下独立进行研究所取得的研究成果。
除了文中特别加以标注引用的内容外,本论文不包含任何其他个人或集体已经发表或撰写的成果作品。
对本文的研究做出重要贡献的个人和集体,均已在文中以明确方式标明。
本人完全意识到本声明的法律后果由本人承担。
作者签名:日期:年月日学位论文版权使用授权书本学位论文作者完全了解学校有关保留、使用学位论文的规定,同意学校保留并向国家有关部门或机构送交论文的复印件和电子版,允许论文被查阅和借阅。
本人授权大学可以将本学位论文的全部或部分内容编入有关数据库进行检索,可以采用影印、缩印或扫描等复制手段保存和汇编本学位论文。
涉密论文按学校规定处理。
作者签名:日期:年月日导师签名:日期:年月日注意事项1.设计(论文)的内容包括:1)封面(按教务处制定的标准封面格式制作)2)原创性声明3)中文摘要(300字左右)、关键词4)外文摘要、关键词5)目次页(附件不统一编入)6)论文主体部分:引言(或绪论)、正文、结论7)参考文献8)致谢9)附录(对论文支持必要时)2.论文字数要求:理工类设计(论文)正文字数不少于1万字(不包括图纸、程序清单等),文科类论文正文字数不少于1.2万字。
数学建模模拟试题

一、根除埃博拉病毒世界医学协会已经宣布他们的新药物能阻止埃博拉病毒并且可以治愈一些处于非晚期疾病患者。
建立一个现实的,合理的并且有用的模型,该模型不仅考虑了疾病的蔓延,需要药物的量,可能可行的输送系统,输送的位置,疫苗或药物的生产速度,而且也要考虑其他重要的因素,诸如你的团队认为有必要作为模型的一部分来进行优化而使埃博拉病毒根除的一些因素,或者至少考虑当前的状态。
除了你的用于比赛的建模方法外,为世界医学协会准备一份1-2页的非技术性的信,方便其在公告中使用。
二、饮酒驾车据报载,2003年全国道路交通事故死亡人数为10.4372万,其中因饮酒驾车造成的占有相当的比例。
针对这种严重的道路交通情况,国家质量监督检验检疫局2004年5月31号发布了新的《车辆驾驶人员血液、呼气酒精含量阈值与检验》国家标准,新标准规定,车辆驾驶人员血液中的酒精含量大于或等于20毫克/百毫升,小于80毫克/百毫升为饮酒驾车(原标准是小于100毫克/百毫升),血液中的酒精含量大于或等于80毫克/百毫升为醉酒驾车(原标准是大于或等于100毫克/百毫升)。
大李在中午12点喝了一瓶啤酒,下午6点检查时符合新的驾车标准,紧接着他在吃晚饭时又喝了一瓶啤酒,为了保险起见他呆到凌晨2点才驾车回家,又一次遭遇检查时却被定为饮酒驾车,这让他既懊恼又困惑,为什么喝同样多的酒,两次检查结果会不一样呢?请你参考下面给出的数据(或自己收集资料)建立饮酒后血液中酒精含量的数学模型,并讨论以下问题:1.对大李碰到的情况做出解释;2.在喝了3瓶啤酒或者半斤低度白酒后多长时间内驾车就会违反上述标准,在以下情况下回答:1)酒是在很短时间内喝的;2)酒是在较长一段时间(比如2小时)内喝的。
3.怎样估计血液中的酒精含量在什么时间最高。
4.根据你的模型论证:如果天天喝酒,是否还能开车?5.根据你做的模型并结合新的国家标准写一篇短文,给想喝一点酒的司机如何驾车提出忠告。
埃博拉病毒传播分析与数学建模

****大学数学建模竞赛承诺书我们仔细阅读了****大学数学建模竞赛的参赛规则与竞赛纪律。
我们完全明白,在竞赛开始后参赛队员不能以任何方式(包括电话、电子邮件、网上咨询等)与队外的任何人研究、讨论与赛题有关的问题。
我们知道,抄袭别人的成果是违反竞赛纪律的, 如果引用别人的成果或其他公开的资料(包括网上查到的资料),必须按照规定的参考文献的表述方式在正文引用处和参考文献中明确列出。
我们郑重承诺,严格遵守参赛规则和竞赛纪律,以保证竞赛的公正、公平性。
如有违反竞赛纪律的行为,我们将受到严肃处理。
我们授权****大学数学建模竞赛组委会,可将们的论文以任何形式进行公开展示(包括进行网上公示,在书籍、期刊和其他媒体进行正式或非正式发表等)。
参赛的题目(从A/B中选择一项填写) B参赛队员姓名学号院系电话日期:2015年05 月04日埃博拉病毒传播分析摘要本文的研究对象为1976年在苏丹南部和刚果的埃博拉河地区发现的埃博拉病毒。
埃博拉病毒是一种生物安全等级为4级,并且能引起人类和灵长类动物产生埃博拉出血热的烈性传染病病毒,其主要是通过病人的血液、唾液、汗水和分泌物等途径传播。
其病毒的潜伏期通常只有5天至10天,感染后2~5天出现高热,6~9天死亡。
面对其强大的传染力和对人类健康的巨大威胁,本文通过数学建模的方法了解埃博拉病毒的传播规律,并分析隔离措施的严格执行和药物治疗效果的提高等措施对控制疫情的作用。
本文中,首先我们根据已给的信息及相关假设数据,通过对已知条件和所给表格书记的分析,我们大致明白了猩猩从潜伏到发病再到死亡或自愈的过程,因此我们采用了excel拟合曲线,分析其发病、潜伏、自愈、死亡和隔离的相应的变化曲线,估计参数,再根据其建立数学模型,并用MATLAB求解方程组,调试参数,从而得到我们需要的结果。
其次通过对已经得到的数据和曲线图的分析,可以得出人类通过严格的药物控制过后,对其发病和潜伏的影响,从而能够达到对疫情的控制的作用,并且对埃博拉病毒未来发展趋势有了更深刻的了解,以为更好的控制埃博拉病毒做出贡献。
传染病的传播及控制分析数学建模

传染病的传播及控制分析数学建模
首先,传染病的传播机理是分析传染病传播的基础。
传染病的传播主
要通过人与人之间的直接接触、空气传播、食物和水传播等途径进行。
数
学建模在研究传染病传播机理时,可以通过建立数学模型来描述不同途径
的传播,例如使用微分方程来描述感染者的增长速度和康复者的增长速度。
其次,传染病的基本模型是了解传染病传播规律的数学工具。
常用的
基本模型包括SIR模型、SEIR模型等。
其中,SIR模型将人群分为易感者(Susceptible)、感染者(Infectious)和康复者(Recovered)三部分。
模型假设人群之间的接触是随机的,并且感染者拥有一定的康复率。
利用
这种模型,可以预测传染病在不同人群中的传播速度和规模,并为制定控
制策略提供科学依据。
最后,传染病的控制策略是基于数学模型进行分析和制定的。
常用的
控制策略包括隔离控制、疫苗接种、社交距离等。
数学模型可以用来评估
不同控制策略的效果和影响。
例如,可以通过调整隔离比例和接种率来观
察传染病的传播趋势和疫情的变化。
此外,数学模型还可以用来优化控制
策略,例如通过数学优化方法来确定最佳的疫苗接种策略或者最佳的防控
资源分配策略。
总之,传染病的传播及控制分析数学建模是研究传染病的传播规律和
制定控制策略的重要工具。
数学模型可以帮助我们理解传染病的传播机理,预测疾病的传播趋势和规模,并为制定控制策略提供科学依据。
因此,加
强传染病传播及控制的数学建模研究对于保障人类健康和社会稳定具有重
要意义。
MCM2015

埃博拉病毒治疗的数学模型研究摘要在埃博拉病毒治疗的问题上,我们将从埃博拉病毒的传染速率,治疗疫苗的输送量以及治疗疫苗的输送方式这三个方面上考虑,我们建立三个初等模型来分别代表这三方面来解决在非洲地区上埃博拉病毒的治疗。
第一个模型是埃博拉病毒传播模型——在非洲埃博拉病毒感染地区不变的假设下,运用第二个模型是治疗疫苗的输送量模型——该模型是在模型(1)的基础上,根据非洲各个地区的传播速率,分别计算出病毒感染地区的治疗疫苗需求量以及实际治疗疫苗的输送量。
第二个模型是治疗疫苗的输送方式模型——该模型是在模型(2)的基础上,根据病毒感染地区的治疗疫苗的输送量以及疫苗输送地点的分布,采用关键词目录一、问题重述1.1 问题简介1.2 埃博拉病毒二、问题分析2.1 埃博拉病毒传播问题分析2.2 治疗疫苗的输送量问题分析2.3 治疗疫苗的输送方式问题分析三、模型假设四、模型的建立4.1埃博拉病毒传播模型4.1.1埃博拉病毒传播地区人口埃博拉病毒目前为止主要呈现地方性流行,局限在中非热带雨林和东南非洲热带大草原,但已从开始的苏丹、刚果民主共和国扩展到刚果共和国、中非共和国、利比亚、加蓬、尼日利亚、肯尼亚、科特迪瓦、喀麦隆、津巴布韦、乌干达、埃塞俄比亚以及南非。
非洲以外地区偶有病例报道,均属于输入性或实验室意外感染,未发现有埃博拉出血热流行。
埃博拉病毒仅在个别国家、地区间歇性流行,在时空上有一定的局限性。
模型研究主要集中与西非的Guinea、Sierra Leone和Liberia这三个国家的不同地区。
Guinea、Sierra Leone和Liberia不同地区的人口统计表如下。
表1. Guinea、Sierra Leone和Liberia三个国家的地区人口情况4.1.2埃博拉病毒传播机理分析埃博拉病毒不能通过飞沫传播,故其传染性没有麻疹或流感那么强。
埃博拉病毒感染者只在出现症状后才具有传染性。
与感染者分泌物的直接接触,如唾液,是埃博拉病毒传播的基本途径。
埃博拉病毒传染机制与研药策略的数模分析
埃博拉病毒传染机制与研药策略的数模分析纪元昕;朱家明;王茜瑶;胡学峰【摘要】In view of the Ebola virus outbreak, we select Guinea, Liberia and Sierra Leone which suffer the most serious epidemic. Firstly we analyze the change of Ebola infections with time passing by based on the original epidemic model. Therefore we use differential equations of population growth to simulate the epidemic. Then we focus on the most seriously affected area Guinea to examine whether this place need to develop new drugs through variance analysis. To simplify the problem rationally, we choose pulmonary tuberculosis, with heat, AIDS as main potential subjects to compare them with Ebola virus and estimate the deadline of pharmacy according to the previous condition. Finally, aimed at the creation of drugs, we establish the mechanism for choosing the most appropriate pharmaceutical companies. Hence, we manage to provide the theoretical cooperation program for companies in order to reduce the cost and risk of pharmacy and improve the pharmacy level.%选取埃博拉病毒疫情最为严重的几内亚,利比里亚和塞拉利昂地区,分析研究其埃博拉病例随时间的变化情况,在原始传染病模型上进行改进,采用种群增长的微分方程来模拟感染人数的变化情况。
- 1、下载文档前请自行甄别文档内容的完整性,平台不提供额外的编辑、内容补充、找答案等附加服务。
- 2、"仅部分预览"的文档,不可在线预览部分如存在完整性等问题,可反馈申请退款(可完整预览的文档不适用该条件!)。
- 3、如文档侵犯您的权益,请联系客服反馈,我们会尽快为您处理(人工客服工作时间:9:00-18:30)。
****大学数学建模竞赛承诺书我们仔细阅读了****大学数学建模竞赛的参赛规则与竞赛纪律。
我们完全明白,在竞赛开始后参赛队员不能以任何方式(包括电话、电子邮件、网上咨询等)与队外的任何人研究、讨论与赛题有关的问题。
我们知道,抄袭别人的成果是违反竞赛纪律的, 如果引用别人的成果或其他公开的资料(包括网上查到的资料),必须按照规定的参考文献的表述方式在正文引用处和参考文献中明确列出。
我们郑重承诺,严格遵守参赛规则和竞赛纪律,以保证竞赛的公正、公平性。
如有违反竞赛纪律的行为,我们将受到严肃处理。
我们授权****大学数学建模竞赛组委会,可将们的论文以任何形式进行公开展示(包括进行网上公示,在书籍、期刊和其他媒体进行正式或非正式发表等)。
埃博拉病毒传播分析摘要本文的研究对象为1976年在苏丹南部和刚果的埃博拉河地区发现的埃博拉病毒。
埃博拉病毒是一种生物安全等级为4级,并且能引起人类和灵长类动物产生埃博拉出血热的烈性传染病病毒,其主要是通过病人的血液、唾液、汗水和分泌物等途径传播。
其病毒的潜伏期通常只有5天至10天,感染后2~5天出现高热,6~9天死亡。
面对其强大的传染力和对人类健康的巨大威胁,本文通过数学建模的方法了解埃博拉病毒的传播规律,并分析隔离措施的严格执行和药物治疗效果的提高等措施对控制疫情的作用。
本文中,首先我们根据已给的信息及相关假设数据,通过对已知条件和所给表格书记的分析,我们大致明白了猩猩从潜伏到发病再到死亡或自愈的过程,因此我们采用了excel拟合曲线,分析其发病、潜伏、自愈、死亡和隔离的相应的变化曲线,估计参数,再根据其建立数学模型,并用MATLAB求解方程组,调试参数,从而得到我们需要的结果。
其次通过对已经得到的数据和曲线图的分析,可以得出人类通过严格的药物控制过后,对其发病和潜伏的影响,从而能够达到对疫情的控制的作用,并且对埃博拉病毒未来发展趋势有了更深刻的了解,以为更好的控制埃博拉病毒做出贡献。
关键词:非线性曲线拟合;微分方程;MATLAB;数学模型1问题的重述1.1背景埃博拉病毒(又译作伊波拉病毒)于1976年在苏丹南部和刚果的埃博拉河地区被发现后,引起了医学界的广泛关注和重视。
该病毒是能引起人类和灵长类动物产生埃博拉出血热的烈性传染病病毒,其生物安全等级为4级。
埃博拉病毒有传染性,主要是通过病人的血液、唾液、汗水和分泌物等途径传播。
各种非人类灵长类动物普遍易感,经肠道、非胃肠道或鼻内途径均可造成感染,病毒的潜伏期通常只有5天至10天,感染后2~5天出现高热,6~9天死亡。
发病后1~4天直至死亡,血液都含有病毒。
埃博拉病毒感染者有很高的死亡率(在50%至90%之间),致死原因主要为中风、心肌梗塞、低血容量休克或多发性器官衰竭。
当前主流的认知是,埃博拉病毒主要通过接触传播,而非通过空气传播;只有病人在出现埃博拉症状以后才具有传染性。
在疾病的早期阶段,埃博拉病毒可能不具有高度的传染性,在此期间接触病人甚至可能不会受感染,随着疾病的进展,病人的因腹泻、呕吐和出血所排出的体液将具有高度的生物危险性;存在似乎天生就对埃博拉免疫的人,痊愈之后的人也会对入侵他们的那种埃博拉病毒有了免疫能力。
埃博拉病毒很难根除,迄今为止已有多次疫情爆发的记录。
据百度百科,最近的一次在2014年。
截至2014年9月25日,此次在西非爆发的埃博拉疫情已经导致逾3000人死亡,另有6500被确诊感染。
更为可怕的是,埃博拉病毒可能经过变异后可以通过呼吸传播!1.2问题假设某地区有20万居民和3000只猩猩。
人能以一定的概率接触到所有的猩猩,当接触到有传播能力的猩猩后有一定概率感染病毒,而人发病之后与猩猩的接触可以忽略。
研究人员统计了前40周人类和猩猩的发病数量和死亡数量等信息,请你根据相关信息,研究回答以下问题:1、根据猩猩的发病数量和死亡数量,建立一个病毒传播模型,动态描述病毒在“虚拟猩猩种群”中的传播,并预测接下来的在猩猩中的疫情变化,并以下述格式给出“虚拟猩猩种群”在第80周、第120周、第200周的相关数据;2、建立“虚拟种群”相互感染的疾病传播模型,综合描述人和猩猩疫情的发展,并预测接下来疫情在这两个群体中的发展情况,并以下述格式给出“虚拟人类种群”在第80周、第120周、第200周的相关数据;3、假设在第41周,外界的专家开始介入,并立即严格控制了人类与猩猩的接触,且通过某种特效药物将隔离治疗人群的治愈率提高到了80%。
请预测接下来疫情在“虚拟人类种群”的发展情况,对比第2问的预测结果说明其作用和影响,给出“虚拟人类种群”在第45周、第50周、第55周的相关数据,数据格式同问题2;4、请依据前述数学模型,分析各种疫情控制措施的严格执行和药物(包括防疫药物、检疫药物和治疗药物等)效果的提高等措施对控制疫情的作用。
2问题分析2.1问题一的分析通过对已知条件的分析,并通过给出的表格数据,大致明白猩猩从潜伏到发病再到死亡或自愈。
我们通过excel作出发病随时间的变化曲线,潜伏随时间变化曲线,估计参数。
然后通过建立数学模型用MATLAB解出方程组,调试参数使其死亡,自愈等曲线与给出表格大致相同,然后通过建立的模型求出问题一。
2.2问题二的分析同问题一分析,我们通过excel作出相应处于发病状态的曲线,自愈以及死亡和隔离的曲线,估计模型相应的参数。
然后通过建立的数学模型用MATLAB解出方程组,调试参数使其自愈,处于发病等曲线和表格给出的数据大致一致。
2.3问题三的分析同问题二分析,我们通过excel作出治愈率提高80%后相应处于发病状态的曲线,自愈以及死亡和隔离的曲线,估计模型相应的参数。
然后通过建立的数学模型用MATLAB解出方程组,调试参数使其自愈,处于发病等曲线和表格给出的数据大致一致。
2.4问题四的分析通过上术数据和曲线图的分析,可以很清楚的看出当有人类干预后即就是严格的通过药物后,发病和潜伏等都有很明显的改善。
3假设与符号3.1模型的假设:⏹由于埃博拉病毒的传播期限不是很长,故假设不考虑这段时间内的人口出生率和自然死亡率;⏹平均潜伏期限为6天;⏹处于潜伏期的埃博拉病人不具有传染性。
3.2符号说明:t0 表示从最初发现埃博拉患者到卫生部门采取预防措施的时间间隔;N 表示疫区总人口数;S(t) 表示t时刻健康人数占总人口数的比例;I(t) 表示t时刻感染人数占总人口数的比例;E(t) 表示t时刻潜伏期的人口数占总人口数的比例;Q(t) 表示t时刻退出类的人数占总人数的比例;λ(t) 表示日接触率,即表示每个病人平均每天有效接触的人数;N’表示疫区总猩猩口数;S(t)’表示t时刻健康猩猩数占总猩猩数的比例;I(t)’表示t时刻感染猩猩数占总猩猩数的比例;E(t)’表示t时刻潜伏期的猩猩数占总猩猩数的比例;Q(t)’表示t时刻退出类的猩猩数占总猩猩的比例;λ(t)’表示日接触率,即表示每个病猩猩平均每天有效接触的猩猩数;λ(t)’’表示日接触率,即表示每个病猩猩平均每天有效接触的人数;g(t) 表示政府控制力度;f(t) 表示疫情指标。
4 模型的建立与求解4.1问题一模型的构建由问题的分析,将猩猩群分为易感猩猩群S ,病毒潜伏猩猩群E ,发病猩猩群I ,退出者Q 四类:● 易感人群S 与病毒潜伏人群E 之间的转化易感者和发病者有效接触后成为病毒潜伏者,设每个病人平均每天有效接触的健康人数为λ(t)S ,NI 个病人平均每天能使λ(t)SNI 个易感者成为病毒潜伏者。
故''''''I N S dt ds N λ-=,即''''I S dtdsλ-= ● 病毒潜伏人群E 与发病人群I 间的转化潜伏人群的变化等于易感人群转入的数量减去转为发病人群的数量,即 ''')'(''E I t S dt dE ελ-=。
● 发病人群I 与退出者Q 间的转化单位时间内退出者的变化等于发病人群的减少,即'''I dtdQω= ''''I Sdt ds λ-= ''')'(''E I t S dt dE ελ-= '''I dtdQω= 1''''=+++Q I E S')'0(,')'0(,')'0(,')'0(0000Q Q I I E E s S ====很明显从我们建立的模型是无法得到E ’,S ’,I ’,Q ’的解析解的。
为了解决这个问题,我们求助于计算机软件MATLAB 来求出它们的数值解。
我们先通过附件中给的数据算出每一天的E ’,S ’,I ’,Q ’,做出它们与时间的函数图象,然后画出我们通过模型解出的数值解随时间变化的图象。
对比这两组图,可以发现实际和理论存在着一定的差异。
这必然是因为我们的参数估计不合理造成的。
所以,我们必须通过不断调整那些非计算得到的参数(λ’,ε’,α’)来使实际图象和理论图象趋于一致。
经过多次调试,我们发现,当λ’=0.680人,ε’=0.9,α’=0.58时,实际图象和理论图象有最好的符合。
而这三个值均在我们估计的范围内,所以我们认为这三个值的得到是合理的。
一旦参数确定,就可以通过MATLAB软件求出该方程组在某个区间段的数值解,从而可推算出我们所需的数值如下表所示。
周数S E Q第80周0.7134 0.0010 0.2338第120周0.7008 0.OOO1 0.2990第200周0.6998 0 0.3202在根据逻辑关系式计算可得下表的预测值表1 “虚拟猩猩种群”群体数量预测结果单位:只周数潜伏人群处于发病状态累计治愈累计因病死亡第80周 3 0 283 596第120周0 0 299 598第200周0 0 300 600结果分析根据上表可知,在第80周以后,处于潜伏状态的猩猩接近于0 ,处于发病状态的猩猩也趋近与0,且猩猩的治愈数和因病死亡数变化不大,由该模型预测出的结果与附件中的数据的得出的发病率和累计死亡率趋势相同。
健康人数占总数比例(比对)图1.1 健康人数占总数比例图(参考数据)图1.2 健康人数占总数的比例图(模拟数据)潜伏人数占总数比例(比对)图2.1 潜伏人数占总数的比例图(参考数据)图2.2 潜伏人数占总数的比例图(模拟数据)退出人数占总数比例(比对)图3.1 退出人数占总数的比例图(参考数据)图3.2 退出人数占总数的比例图(模拟数据)MATLAB主要程序function dx=rossler(t,x,flag,a,b,c)dx=[-a*x(1)+a*x(1)*x(3)+a*x(1)*x(2)+a*x(1)*x(1);a*x(1)-a*x(1)*x(3)-a* x(1)*x(2)-a*x(1)*x(1)-b*x(2);c-c*x(3)-c*x(2)-c*x(1)];a=0.680;b=0.90;c=0.580;x0=[0.995 0.005 0]';[t,y]=ode45('rossler',[0 80],x0,[],a,b,c);flot(t,y);4.2问题二模型的构建由问题的分析,将人群分为易感人群S ,病毒潜伏人群E ,发病人群I ,退出者Q 四类:● 易感人群S 与病毒潜伏人群E 之间的转化易感者和发病者有效接触后成为病毒潜伏者,设每个病人平均每天有效接触的健康人数为λ(t)S ,NI 个病人平均每天能使λ(t)SNI 个易感者成为病毒潜伏者。