英文文献 翻译 电能质量在线监测 科技类
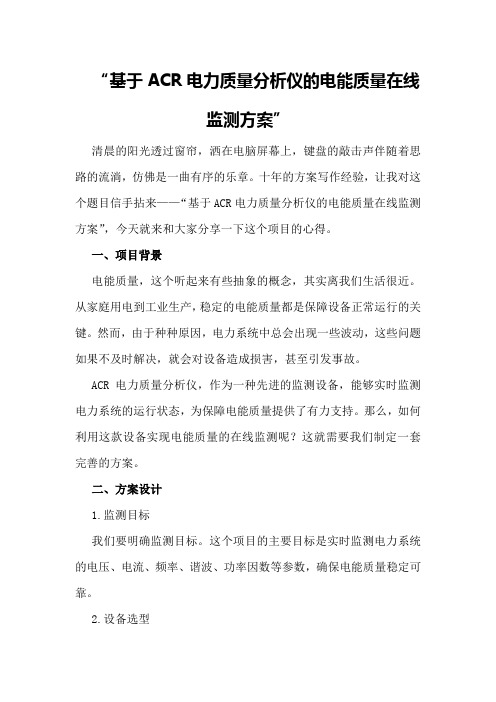
基于IEC标准的风电机组电能质量检测技术
谐
波 harmonics 50Hz<f<2kHz 电流分量 Current components
间谐波 interharmonics* 电流谐波 50Hz<f<2kHz 高频分量 higher frequency components 2kHz<f<9kHz
P13
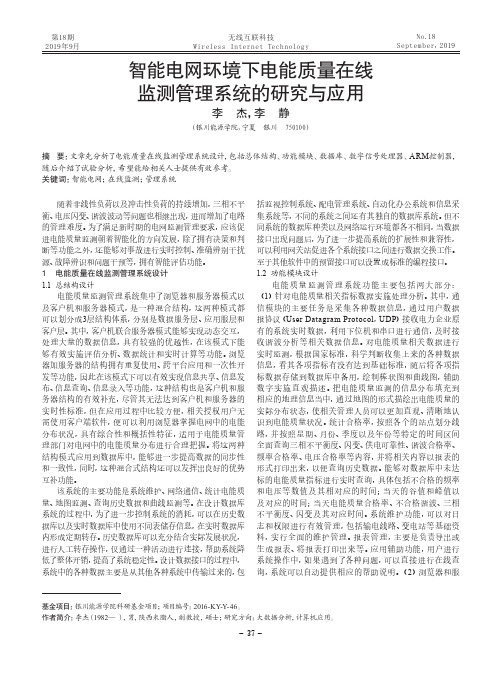
谐波 Harmonics
Order Active power [ in kW ] 2
P10
切换操作 Switching operations
kA 2.4 2.2 2.0 1.8 1.6 1.4 1.2 1.0 0.8
Pitch + variable speed
Current
0.6 0.4 0.2 0.0 -0.2 -0.4 -0.6 -0.8 -1.0 -1.2 -1.4 -1.6 -1.8 -2.0 -2.2 -2.4 20 32 44 56 68 80 s
4 6 8 10 12 14 16 18 20
0.5 0.4 0.3 0.2
22 24 26 28 30
0.1 0.0 0 5 10 15 20 25 30 35 40 45 50 Order
32 34 36 38 40 42 44 46 48 50
Max THC Active Power at max THC [kW]
3 5 7 9 11 13 15 17 19 21 23 25 27 29 31 33 35 37 39 41 43 45 47 49
1205.6 139 834.4 62.3 32.7 32.7 80.7 403 403 1186.1 1147.9 586.9 1000.8 321.8 130.6 73.7 80.7 80.7 80.7 348.8 948.3 1011.6 924.7 958.7
外文文献综述电能质量监测(外文原文+中文翻译)

1 Power Quality MonitoringPatrick ColemanMany power quality problems are caused by inadequate wiring or improper grounding. These problems can be detected by simple examination of the wiring and grounding systems. Another large population of power quality problems can be solved by spotchecks of voltage, current, or harmonics using hand held meters. Some problems, however, are intermittent and require longer-term monitoring for solution.Long-term power quality monitoring is largely a problem of data management. If an RMS value of voltage and current is recorded each electrical cycle, for a three-phase system, about 6 gigabytes of data will be produced each day. Some equipment is disrupted by changes in the voltage waveshape that may not affect the rms value of the waveform. Recording the voltage and current waveforms will result in about 132 gigabytes of data per day. While modern data storage technologies may make it feasible to record every electrical cycle, the task of detecting power quality problems within this mass of data is daunting indeed.Most commercially available power quality monitoring equipment attempts to reduce the recorded data to manageable levels. Each manufacturer has a generally proprietary data reduction algorithm. It is critical that the user understand the algorithm used in order to properly interpret the results.1.1Selecting a Monitoring PointPower quality monitoring is usually done to either solve an existing power quality problem, or to determine the electrical environment prior to installing new sensitive equipment. For new equipment, it is easy to argue that the monitoring equipment should be installed at the point nearest the point of connection of the new equipment. For power quality problems affecting existing equipment, there is frequently pressure to determine it. the problem is being caused by some external source, i. e., the utility. This leads to the installation of monitoring equipment at the service point to try to detect the source of the problem. This is usually not the optimum location for monitoring equipment. Most studies suggest that 80% of power quality problems originate within the facility. A monitor installed on the equipment being affected will detect problemsoriginating within the facility, as well as problems originating on the utility. Each type of event has distinguishing characteristics to assist the engineer in correctly identifying the source of the disturbance.1.1.1 What to MonitorAt minimum, the input voltage to the affected equipment should be monitored. If the equipment is single phase, the monitored voltage should include at least the line-to~neutral voltage and the neutral to-ground voltages. If possible, the Iine_to_ground voltage should also be monitored. For three-phase equipment, the voltages may either be monitored line to neutral, or line to line. Line-to-neutral voltages are easier to understand, but most three-phase equipment operates on line-to-line voltages. Usually, it is preferable to monitor the voltage line to line for three-phase equipment.If the monitoring equipment has voltage thresholds which can be adjusted, the thresholds should be set to match the sensitive equipment voltage requirements. If the requirements are not known, a good starting point is usually the nominal equipment voltage plus or minus 10%.In most sensitive equipment, the connection to the source is a rectifier, and the critical voltages are DC. In some cases, it may be necessary to monitor the critical DC voltages. Some commercial power quality monitors are capable of monitoring AC and DC simultaneously, while others are AC only.It is frequently useful to monitor current as well as voltage. For example, if the problem is being caused by voltage sags, the reaction of the current during the sag can help determine the source of the sag. If the current doubles when the voltage sags 10%, then the cause of the sag is on the load side of the current monitor point. If the current increases or decreases 10 - 20% during a 10% voltage sag, then the cause of the sag is on the source side of the current monitoring point.Sensitive equipment can also be affected by other environmental factors such as temperature, humidity, static, harmonics, magnetic fields, radio frequency interference (RFl), and operator error or sabotage. Some commercial monitors can record some of these factors, but it may be necessary to install more than one monitor to cover every possible source of disturbance.It can also be useful to record power quantity data while searchingfor power quality problems. For example, the author found a shortcut to the source of a disturbance affecting a wide area by using the power quantity data. The recordings revealed an increase in demand of 2500 KW immediately after the disturbance. Asking a few questions quickly led to a nearby plant with a 2500 KW switched load that was found to be malfunctioning.1.2Selecting a MonitorCommercially available monitors fall into two basic categories: line disturbance analyzers and voltage recorders. The line between the categories is becoming blurred as new models are developed. Voltage recorders are primarily designed to record voltage and current strip chart data, but some models are able to capture waveforms under certain circumstances. Line disturbance analyzers are designed to capture voltage events that may affect sensitive equipment. Generally, line disturbance analyzers are not good voltage recorders, but newer models are better than previous designs at recording voltage strip charts.In order to select the best monitor for the job, it is necessary to have an idea of the type of disturbance to be recorded, and an idea of the operating characteristics of the available disturbance analyzers. For example, a common power quality problem is nuisance tripping of variable speed drives. Variable speed drives may trip due to the waveform disturbance created by power factor correction capacitor switching, or due to high or low steady state voltage, or, in some cases, due to excessive voltage imbalance. If the drive trips due to high voltage or waveform disturbances, the drive diagnostics will usually indicate an over voltage code as the cause of the trip. If the voltage is not balanced, the drive will draw significantly unbalanced currents. The current imbalance may reach a level that causes the drive to trip for input over current. Selecting a monitor for variable speed drive tripping can be a challenge. Most line disturbance analyzers can easily capture the waveshape disturbance of capacitor switching, but they are not good voltage recorders, and may not do a good job of reporting high steady state voltage. Many line disturbance analyzers cannot capture voltage unbalance at all, nor will they respond to current events unless there is a corresponding voltage event. Most voltage and current recorders can easily capture the high steady state voltage that leads to a drive trip, but they may notcapture the capacitor switching waveshape disturbance. Many voltage recorders can capture voltage imbalance, current imbalance, and some of them will trigger a capture of voltage and current during a current event, such as the drive tripping off.To select the best monitor for the job, it is necessary to understand the characteristics of the available monitors. The following sections will discuss the various types of data that may be needed for a power quality investigation, and the characteristics of some commercially available monitors.I. 3 VoltageThe most commonly recorded parameter in power quality investigations is the RMS voltage delivered to the equipment. Manufacturers of recording equipment use a variety of techniques to reduce the volume of the data recorded. The most common method of data reduction is to record Min/Max/Average data over some interval. Figure I. I shows a strip chart of rms voltages recorded on a eyeIe-by-cycle basis. Figure I. 2 shows a Min/Max/Average chart for the same time period. A common recording period is I week. Typical recorders will use a recording interval of 2 - 5 minutes. Each recording interval will produce three numbers: the rms voltage of the highest I cycle, the lowest I cycle, and the average of every cycle during the interval. This is a simple, easily understood recording method, and it is easily implemented by the manufacturer. There are several drawbacks to this method. If there are several events during a recording interval, only the event with the largest deviation is recorded. Unless the recorder records the event in some other manner, there is no time~stamp associated with the events, and no duration available. The most critical deficiency is the lack of a voltage profile during the event. The voltage profile provides significant clues to the source of the event. For example, if the event is a voltage sag, the minimum voltage may be the same for an event caused by a distant fault on the utility system, and for a nearby large motor start. For the distant fault, however, the voltage will sag nearly instantaneously, stay at a fairly constant level for 3-10 cycles, and almost instantly recover to full voltage, or possibly a slightly higher voltage it. the faulted section of the utility system is separated. For a nearby motor start, the voltage will drop nearly instantaneousIy,and almost immediately begin a gradual recovery over 30 - 180 cycles toa voltage somewhat lower than before. Figure 1.3 shows a cycle-by-cycle recording of a simulated adjacent feeder fault, followed by a simulation of a voltage sag caused by a large motor start. Figure I.4 shows a Min/Max/Average recording of the same two events. The events look quite similar when captured by the Min/Max/Average recorder, while the cycle-by-cycle recorder reveals the difference in the voltage recovery profile.FIGURE 1.1 RMS voltage strip chart, taken cycle by cycle.FIGURE I. 2 Min/Max/Average strip chart, showing the minimum single cycle voltage, the maximum single cycle voltage, and the average of every cycle in a recording interval. Compare to the Fig. I. I strip chart data.Some line disturbance analyzers allow the user to set thresholds for voltage events. If the voltage exceeds these thresholds, a short duration strip chart is captured showing the voltage profile during the event. This short duration strip chart is in addition to the long duration recordings, meaning that the engineer must look at several different charts to find the needed information.Some voltage recorders have user-programmable thresholds, and record deviations at a higher resolution than voltages that fall within the thresholds. These deviations are incorporated into the stripchart, so the user need only open the stripchart to determine, at a glance, if there are any significant events. If there are events to be examined, the engineer can immediately “zoom in” on the portion of the stripchart with the event.Some voltage recorders do not have user-settable thresholds, but rather choose to capture events based either on fixed default thresholds or on some type of significant change. For some users, fixed thresholds are an advantage, while others are uncomfortable with the lack of control over the meter function. In units with fixed thresholds, if the environment is normally somewhat disturbed, such as on a welder circuit at a motor control center, the meter memory may fill up with insignificant events and the monitor may not be able to record a significant event when it occurs. For this reason, monitors with fixed thresholds should not be used in electrically noisy environments.FIGURE I. 3 Cycle-by-cycle rms strip chart showing two voltage sags. The sag on the left is due to an adjacent feeder fault on the supply substation, and the sag on the right is due to a large motor start. Note the difference in the voltage profile during recoveryMln/Ave/Max Chartt SagFIGURE I. 4 Min/Max/Average strip chart of the same voltage sags as Fig. I. 3. Note that both sags look almost identical. Without the recovery detail found in Fig. I. 3, it is difficult to determine a cause for the voltage sagscapacitor energizationI. 3. I Voltage Waveform Disturbances.Some equipment can be disturbed by changes in the voltage waveform. These waveform changes may not significantly affect the rms voltage, yet may still cause equipment to malfunction. An rms-onIy recorder may not detect the cause of the malfunction. Most line disturbance analyzers have some mechanism to detect and record changes in voltage waveforms. Some machines compare portions of successive waveforms, and capture the waveform if there is a significant deviation in any portion of the waveform. Others capture waveforms if there is a significant change in the rms value of successive waveforms. Another method is to capture waveforms if there is a significant change in the voltage total harmonic distortion (THD) between successive cycles.The most common voltage waveform change that may cause equipment malfunction is the disturbance created by power factor correctioncapacitor switching. When capacitors are energized, a disturbance iscreated that lasts about I cycle, but does not result in a significant change in the rms voltage. Figure 1.5 shows a typical power factorFIGURE 1.6 RMS stripcharts of voltage and current during a large current increase due to a motor start downstream of the monitor point.1.4Current Waveshape DisturbancesVery few monitors are capable of capturing changes in current waveshape. It is usually not necessary to capture changes in current waveshape, but in some special cases this can be useful data. For example, inrush current waveforms can provide more useful information than inrush current rms data. Figure I. 7 shows a significant change in the current waveform when the current changes from zero to nearly 100 amps peak. The shape of the waveform, and the phase shift with respect to the voltage waveform, confirm that this current increase was due to an induction motor start.Figure 1.7 shows the first few cycles of the event shown in Fig.1.6.I.5HarmonicsHarmonic distortion is a growing area of concern. Many commercially available monitors are capable of capturing harmonic snapshots. Some monitors have the ability to capture harmonic strip chart data. In this area, it is critical that the monitor produce accurate data. Some commercially available monitors have deficiencies in measuring harmonics. Monitors generally capture a sample of the voltage and current waveforms, and perform a Fast Fourier Transform to produce a harmonic spectrum. According to the Nyquist Sampling Theorem, the input waveform must be sampled at least twice the highest frequency that is present in the waveform. Some manufacturers interpret this to mean the highest frequency of interest, and adjust their sample rates accordingly. If the input signal contains a frequency that is above the maximum frequency that can be correctly sampled, the high frequency signal may be u aliased, ” that is, it may be incorrectly identified as a lower frequency harmonic. This may lead the engineer to search for a solution to a harmonic problem that does not exist. The aliasing problem can be alleviated by sampling at higher sample rates, and by filtering out frequencies above the highest frequency of interest. The sample rate is usually found in the manufacturer’ s literature, but the presence of an antialiasing filter is not usually mentioned in the literature.I. 6 SummaryMost power quality problems can be solved with simple hand~tools and attention to detail. Some problems, however, are not so easily identified, and it may be necessary to monitor to correctly identify the problem. Successful monitoring involves several steps. First, determine if it is really necessary to monitor. Second, decide on a location for the monitor. Generally,the monitor should be installed close to the affected equipment. Third, decide what quantities need to be monitored, such as voltage, current, harmonics, and power data. Try to determine the types of events that can disturb the equipment, and select a meter that is capable of detecting those types of events. Fourth, decide on a monitoring period. Usually, a good first choice is at least one business cycle, or at least I day, and more commonly, I week. It may be necessary to monitor until the problem recurs. Some monitors can record indefinitely by discardingolder data to make space for new data. These monitors can be installed and left until the problem recurs. When the problem recurs, the monitoring should be stopped before the event data is discarded.After the monitoring period ends, the most difficult task begins — interpreting the data. Modern power quality monitors produce reams of data during a disturbance. Data interpretation is largely a matter of experience, and Ohm’ s law. There are many examples of disturbance data in books such as The BMI Handbook of Power Signatures, Second Edition, and the Dranetz Field Handbook for Power Quality Analysis.1量监测里•曼许多电能质量问题所造成的布线不足或不当的接地。
基于LabVIEW的电能质量参数监测系统的研究

基于LabVIEW的电能质量参数监测系统的研究摘要针对传统硬件为基础的电能质量参数监测系统进行改进,设计了一套以LabVIEW为核心平台的电能质量监测系统。
通过软硬件结合,利用数据采集卡实时采集电能质量参数信号,实现了长期高效自主运行,实时测算,用户分权限管理等功能。
与传统分析仪相比,使用成本低,数据处理能力强,产品升级迭代快等优点。
关键词电能质量;虚拟仪器;数据采集;实时测算Abstract Based on the traditional hardware,the quality parameter monitoring system is improved,and a set of power quality monitoring system is designed with LabVIEW as the core platform. Through the combination of hardware and software,the data acquisition card is used to collect the power quality parameter signal in real time,and realize the function of long-term,high efficiency,autonomous operation,real-time measurement,user’s permission management and so on. Compared with the traditional analyzer,the cost is low,the data processing ability is strong,the product is upgraded iteratively and so on.Key words Power quality;Virtual instruments;Data collection;Real-time measurement目前,伴随着社会高速发展,对电能需求与日俱增的同时,电能质量的要求也愈加严格[1]。
电能质量在线监测技术浅谈

电能质量在线监测技术浅谈电能质量的在线监测技术作为智能电网发展的一部分,它的实现必定为智能电网的推进打下坚实的基础。
随着我国电力市场的逐步建立,对电能质量提出了越来越高的要求。
电力用户也要求高质量的电能来保证其设备、仪器和系统的正常运行。
但是,随着现代科学技术的迅猛发展,一方面,由于电力电子设备的应用领域越来越广,特别是各类冲击负荷和非线性负荷容量的不断扩展,使得电网中电压波形发生畸变,电压波动、闪变和三相不平衡等问题时有发生,严重地影响了电能质量;另一方面,由于人们越来越多地使用精密和复杂的电子设备,如计算机、通信设备以及各种过程控制系统来处理和管理工作过程和事务。
这就要求高质量和高可靠性的配电系统,以提供与之相适应的电能。
而且,随着电力工业的飞速发展以及电网的不断扩大,电力运行对电力调度自动化水平的要求和安全性的要求越来越高,电力调度需要各种功能更为齐全、操作更为简便的各种电力检测仪器仪表。
但是,目前为止用于监测电网用户端电能质量的仪器仪表并没有普及使用,而且随着电力工业的发展和电能质量概念的逐步深化,电能质量监测发生了新的变化。
随着电力行业的发展,随着经济的发展,供电公司要提高自身的竞争力,其中一个最重要的部分就是提供高质量的电能。
那么,提供高质量电能意味着需要对整个电网进行动态实时的监测,这种监测是分散的,是多点监测的。
并且随着因特网的发展,电力企业更加要求监控具有多点成面的效果,能够构成全网的实时监测与全网监测信息的共享,在这个情况下,引进了分布式的概念,从而使得电能质量的监测也具有分布式的效果,完全符合电力企业的要求。
1.推广应用及市场前景近年来,国际上非常重视电网的智能化运行和控制,自美国提出2030年智能电网规划后,掀起了智能电网的研究热潮。
2006年,美国IBM公司与全球电力研究机构、电力企业合作开发了“智能电网”解决方案。
电力公司可以通过使用传感器、计量表、数字控件、分析工具来自动监控电网、优化电网性能、快速恢复供电,同时加强与消费者的互动,以便让他们对电能的使用和管理更加了解。
电能质量在线监测系统的设计分析_周敏慧
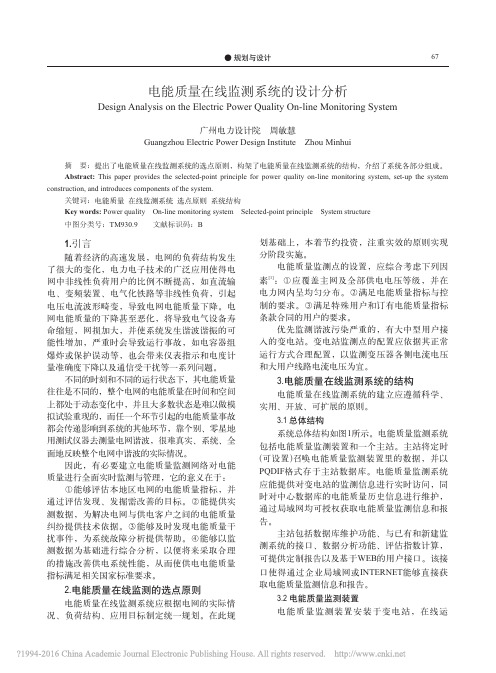
电能质量在线监测系统的设计分析Design Analysis on the Electric Power Quality On-line Monitoring System广州电力设计院 周敏慧Guangzhou Electric Power Design Institute Zhou Minhui摘 要:提出了电能质量在线监测系统的选点原则,构架了电能质量在线监测系统的结构,介绍了系统各部分组成。
Abstract: This paper provides the selected-point principle for power quality on-line monitoring system, set-up the system construction, and introduces components of the system.关键词:电能质量 在线监测系统 选点原则 系统结构Key words: Power quality On-line monitoring system Selected-point principle System structure 中图分类号:TM930.9 文献标识码:B划基础上,本着节约投资,注重实效的原则实现1.引言分阶段实施。
随着经济的高速发展,电网的负荷结构发生电能质量监测点的设置,应综合考虑下列因了很大的变化,电力电子技术的广泛应用使得电[1]素:①应覆盖主网及全部供电电压等级,并在网中非线性负荷用户的比例不断提高,如直流输电力网内呈均匀分布。
②满足电能质量指标与控电、变频装置、电气化铁路等非线性负荷,引起制的要求。
③满足特殊用户和订有电能质量指标电压电流波形畸变,导致电网电能质量下降。
电条款合同的用户的要求。
网电能质量的下降甚至恶化,将导致电气设备寿优先监测谐波污染严重的,有大中型用户接命缩短,网损加大,并使系统发生谐波谐振的可入的变电站。
基于ATT7022CU电能质量在线监测系统的研究与设计
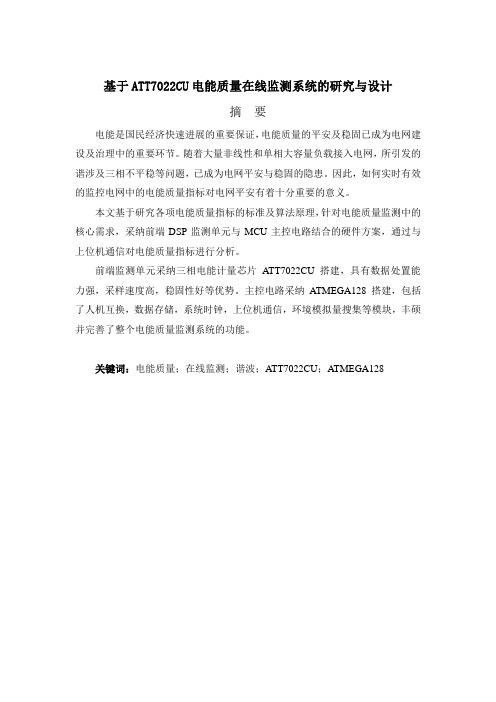
基于ATT7022CU电能质量在线监测系统的研究与设计摘要电能是国民经济快速进展的重要保证,电能质量的平安及稳固已成为电网建设及治理中的重要环节。
随着大量非线性和单相大容量负载接入电网,所引发的谐涉及三相不平稳等问题,已成为电网平安与稳固的隐患。
因此,如何实时有效的监控电网中的电能质量指标对电网平安有着十分重要的意义。
本文基于研究各项电能质量指标的标准及算法原理,针对电能质量监测中的核心需求,采纳前端DSP监测单元与MCU主控电路结合的硬件方案,通过与上位机通信对电能质量指标进行分析。
前端监测单元采纳三相电能计量芯片ATT7022CU 搭建,具有数据处置能力强,采样速度高,稳固性好等优势。
主控电路采纳ATMEGA128 搭建,包括了人机互换,数据存储,系统时钟,上位机通信,环境模拟量搜集等模块,丰硕并完善了整个电能质量监测系统的功能。
关键词:电能质量;在线监测;谐波;ATT7022CU;ATMEGA1281 前言现今社会,电能已经成为人们生产、生活中一种不可或缺的能源,其应用的程度直接反映了一个国家的生产力进展水平。
长期以来,我国的电力供给一直比较紧张,人们关注的核心要紧集中在电力供给量方面,而对电能质量关切不够多,通常只对电压、频率两个指标急性考核。
随着时期的进步与科技的飞速进展,电能质量问题愈来愈受到重视,用户对供电系统的供电质量提出了更高的要求,电力部门不但要解决电力用户对电能质量的投诉,提高电能质量知足用户的需要,还要增强电能质量监督治理。
电能是一种商品,如何保证和提高电能质量,从而保证生产和生活的正常进行,已成为国内外电工领域迫切需要解决的重要课题之一。
为了解决这一问题,第一要对电能质量做出及时、准确的检测,如此才有助于咱们采取适合的操纵策略和方式,进而有针对性的去改善电能质量状况知足电力用户的需求,因此,对电能质量准确及时的检测就显得尤其重要。
在电子信息技术快速进展的时期背景下,电能质量监测装置已经由初期的模拟及数字式测量仪器仪表进展为今天基于微处置器及运算机技术的智能仪表,在测量精度,数据运算处置能力,稳固性等方面取得极大的进步,并依照不同需求与应用处合进展出远程监测型,手持型,便携多功能分析型等多个产品类别。
电能质量远程在线实时监测系统研究
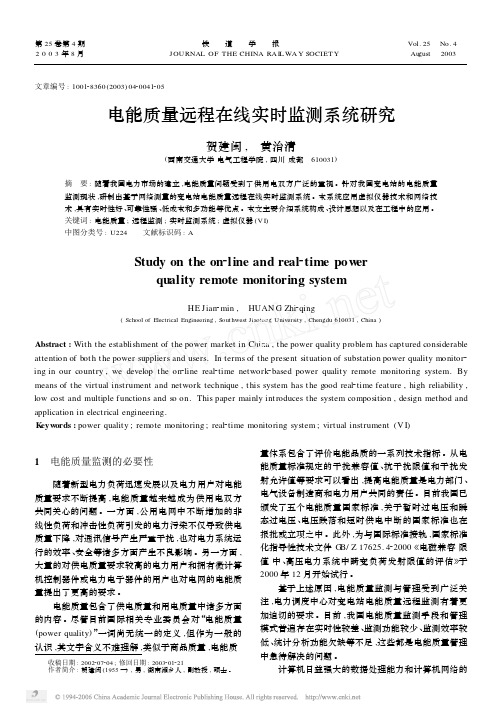
文章编号:100128360(2003)0420041205电能质量远程在线实时监测系统研究贺建闽, 黄治清(西南交通大学电气工程学院,四川成都 610031)摘 要:随着我国电力市场的建立,电能质量问题受到了供用电双方广泛的重视。
针对我国变电站的电能质量监测现状,研制出基于网络测量的变电站电能质量远程在线实时监测系统。
本系统应用虚拟仪器技术和网络技术,具有实时性好、可靠性强、低成本和多功能等优点。
本文主要介绍系统构成、设计思想以及在工程中的应用。
关键词:电能质量;远程监测;实时监测系统;虚拟仪器(V I)中图分类号:U224 文献标识码:AStudy on the on2line and real2time pow erqu ality remote monitoring systemHE Jian2min, HUAN G Zhi2qing(School of Electrical Engineering,Southwest Jiaotong University,Chengdu610031,China)Abstract:With the establishment of the power market in China,the power quality problem has captured considerable attention of both the power suppliers and users.In terms of the present situation of substation power quality monitor2 ing in our country,we develop the on2line real2time network2based power quality remote monitoring system.By means of the virtual instrument and network technique,this system has the good real2time feature,high reliability, low cost and multiple functions and so on.This paper mainly introduces the system composition,design method and application in electrical engineering.K eyw ords:power quality;remote monitoring;real2time monitoring system;virtual instrument(V I)1 电能质量监测的必要性随着新型电力负荷迅速发展以及电力用户对电能质量要求不断提高,电能质量越来越成为供用电双方共同关心的问题。
配电网电能质量的在线检测与治理措置的研究本科毕业设计

本科毕业设计说明书配电网电能质量的在线检测与治理措置的研究DISTRIBUTION NETWORK POWER QUALITY DETECTION AND TREATMENT RENEW ONLINE RESEARCH学院(部):电气与信息工程学院专业班级:学生姓名:指导教师:年月日配电网电能质量的在线检测与治理措置的研究摘要随着电力电子技术、自动化技术、计算机技术等先进技术的进一步发展,大功率非线性、冲击性和波动性负荷不断增加,比如大功率的变频设备及拖动装置、电气化铁路、电化工业的整流设备、电弧炉等,这些负荷造成了电网发生波形畸变(谐波)、电压波动、闪变、三相不平衡、非对称性,使得电网电能质量的严重降低。
同时,基于计算机,微处理器控制的精密电子仪器在国民经济企业中大量使用,对供电质量的敏感程度越来越高,对电能质量提出了更高的要求,从而使电能质量问题及其解决措施逐渐成为研究的热点。
要对电网的电能质量进行改善,首先要对电能质量做出精确的检测和分析,测量电网的电能质量水平,并分析和判断造成各种电能质量问题的原因,为电能质量的改善提供依据。
电能质量问题日益突出,电能质量的监测方式主要为在线监测,对电能质量的全天候、全方位准确的实时监测。
在准确、快速地检测和分析电能质量的基础上,提出了合理有效的治理措施,对有效提高供电可靠性,改善供电电能质量,确保电力设备发挥正常性能水平等,对电网的安全、经济运行,保障工业产品质量和科学实验的正常运行以及降低能耗等均具有非常重要的研究意义。
关键词:配电网,电能质量,在线监测DISTRIBUTION NETWORK POWER QUALITY DETECTION AND TREATMENT RENEW ONLINE RESEARCHABSTRACTWith the power electronics technology, automation technology, computer technology and other advanced technology, further development, high-power nonlinear load impact and increasing volatility and drag equipment, electric railway, electricity and chemical industries rectifier equipment, induction furnace, electric arc furnace, etc, which caused the power grid load waveform distortion (harmonic), voltage fluctuations, flicker, three-phase balance, asymmetry, making the serious degradation of power quality. Meanwhile, computer-based, microprocessor-controlled precision electronic instrument used extensively in the national enterprise, the power supply is becoming more sensitive to the quality of the power quality put forward higher requirements, so that the power quality problems and their solutions measures to gradually become a research hotspot. To improve the quality of grid power, we must first make an accurate power quality testing and analysis, measurement grid power quality, and to analyze and determine the cause of a variety of power quality problem is to provide a basis to improve power quality. Power quality issues have become increasingly prominent, the main mode of power quality monitoring for the online monitoring of power quality all-weather, all-round and accurate real-time monitoring. In the accurate and rapid detection and analysis of power quality based on reasonable and effective governance proposed measures, effectively improve power supply reliability, improve power quality power supply, ensure that the power to play a normal level of performance equipment, etc. on the power grid safety, economic operation to protect the quality of industrial products and the normal operation of scientific experiments and reduce energy consumption etc. is very important significance. KEYWARDS: distribution network, power quality, online monitoring目录4.5本章小结 (30)1绪论1.1 研究电能质量的背景和意义电能是当今社会使用最广泛的能源,其应用程度标志着一个国家的科技、经济发展水平。
基于ACR电力质量分析仪的电能质量在线监测方案
“基于ACR电力质量分析仪的电能质量在线监测方案”清晨的阳光透过窗帘,洒在电脑屏幕上,键盘的敲击声伴随着思路的流淌,仿佛是一曲有序的乐章。
十年的方案写作经验,让我对这个题目信手拈来——“基于ACR电力质量分析仪的电能质量在线监测方案”,今天就来和大家分享一下这个项目的心得。
一、项目背景电能质量,这个听起来有些抽象的概念,其实离我们生活很近。
从家庭用电到工业生产,稳定的电能质量都是保障设备正常运行的关键。
然而,由于种种原因,电力系统中总会出现一些波动,这些问题如果不及时解决,就会对设备造成损害,甚至引发事故。
ACR电力质量分析仪,作为一种先进的监测设备,能够实时监测电力系统的运行状态,为保障电能质量提供了有力支持。
那么,如何利用这款设备实现电能质量的在线监测呢?这就需要我们制定一套完善的方案。
二、方案设计1.监测目标我们要明确监测目标。
这个项目的主要目标是实时监测电力系统的电压、电流、频率、谐波、功率因数等参数,确保电能质量稳定可靠。
2.设备选型高精度:测量精度达到0.5级,确保监测数据的准确性。
实时性:实时监测电力系统运行状态,及时发现问题。
易操作:用户界面友好,操作简便,易于上手。
扩展性:支持多种通信接口,方便与上位机或其他设备连接。
3.系统架构数据采集层:由ACR电力质量分析仪组成,负责实时采集电力系统的各项参数。
数据传输层:采用有线或无线通信方式,将数据传输至服务器。
数据处理层:服务器端对采集到的数据进行处理,监测报告。
用户界面层:用户通过电脑或手机端访问服务器,查看监测数据和报告。
4.功能实现实时监测:实时显示电力系统的各项参数,如电压、电流、频率等。
谐波分析:对电力系统的谐波进行实时分析,了解谐波分布情况。
报警提醒:当监测到电能质量异常时,及时发出报警提醒。
数据存储:将采集到的数据存储在服务器上,方便后续查询和分析。
数据报表:各种电能质量监测报告,为用户提供决策依据。
三、项目实施1.设备安装:将ACR电力质量分析仪安装在电力系统中,连接好通信线路。
智能电网环境下电能质量在线监测管理系统的研究与应用
- 37 -第18期2019年9月No.18September,2019随着非线性负荷以及冲击性负荷的持续增加,三相不平衡、电压闪变、谐波波动等问题也相继出现,进而增加了电路的管理难度。
为了满足新时期的电网监测管理要求,应该促进电能质量监测朝着智能化的方向发展,除了拥有决策和判断等功能之外,还能够对事故进行实时控制、准确辨别干扰源、故障辨识和问题干预等,拥有智能评估功能。
1 电能质量在线监测管理系统设计1.1 总结构设计电能质量监测管理系统集中了浏览器和服务器模式以及客户机和服务器模式,是一种混合结构,这两种模式都可以划分成3层结构体系,分别是数据服务层、应用服层和客户层。
其中,客户机联合服务器模式能够实现动态交互,处理大量的数据信息,具有较强的优越性,在该模式下能够有效实施评估分析、数据统计和实时计算等功能。
浏览器加服务器的结构拥有重复使用、跨平台应用和一次性开发等功能,因此在该模式下可以有效实现信息共享、信息发布、信息查询、信息录入等功能,这种结构也是客户机和服务器结构的有效补充,尽管其无法达到客户机和服务器的实时性标准,但在应用过程中比较方便,相关授权用户无需使用客户端软件,便可以利用浏览器掌握电网中的电能分布状况,具有综合性和概括性特征,适用于电能质量管理部门对电网中的电能质量分布进行合理把握。
将这两种结构模式应用到数据库中,能够进一步提高数据的同步性和一致性,同时,这种混合式结构还可以发挥出良好的优势互补功能。
该系统的主要功能是系统维护、网络通信、统计电能质量、地图监测、查询历史数据和曲线监测等。
在设计数据库系统的过程中,为了进一步控制系统的消耗,可以在历史数据库以及实时数据库中使用不同表储存信息,在实时数据库内形成定期转存。
历史数据库可以充分结合实际发展状况,进行人工转存操作,仅通过一种活动进行连接,帮助系统降低了整体开销,提高了系统稳定性。
设计数据接口的过程中,系统中的各种数据主要是从其他各种系统中传输过来的,包括监视控制系统、配电管理系统、自动化办公系统和信息采集系统等,不同的系统之间还有其独自的数据库系统。
在线电能质量监测系统

电 子 测 量 技 术 EL EC TRON IC M EASU R EM EN T TEC HNOLO GY
第 31 卷 第 7 期
2008 年 7 月
在线电能质量监测系统
柴保明 赵春宇
( 上海交通大学仪器工程系 上海 200240)
摘 要 : 电能质量监测在现代电力系统中越来越重要 , 本文讨论了 IEC 及国家标准规定的电能质量参数的计算方 法 , 设计了电能质量监测系统 。该系统采用了 DSP 和 A RM , 能够满足 FF T 及闪变等高密度的实时计算要求 , 在 线为用户远程提供数据并可以记录较长时间的历史数据 。同时允许用户在线设定参数记录的时间间隔 、电压事件的 门限值和三相电接线方式 , 提高了装置对各种监测要求的适应性 。实际运行表明 , 该装置能够准确监测到各项电能 质量参数 , 并及时记录相关的电压事件 , 能够长时间稳定工作于工业环境 。 关键词 : 电能质量监测 ; FF T ; DSP ; A RM 中图分类号 : TM932 文献标识码 : A
长期闪变值为 :
3
Pl t =
1
n
n
j =1ห้องสมุดไป่ตู้
∑( P
s tj
)3 ,
( 8)
式中 : n 为长时间闪变值测量时间内所包含的短时闪变值 的个数 。 短时间闪变值和长时间闪变值每次测量周期分别是 10 min 和 2 h 。
2 系统硬件架构及工作原理
本文采用 TI 公司的浮点型 DSP 和 A RM7 集成板设 计了在线电能监测系统 , 图 2 是该系统的硬件架构 。 电力系统电量是标称为 50 Hz 的 380 V 三相电源 , 也 可以测量 50 Hz 的 220 V 单相电源 。为了提供一定的冗余 性 , 实际输入为 4 路 , 及 4 路电压和 4 路电流 。通常 , 其 中一路是作为备用的[ 8 ] 。变送及信号调理主要是为了将 输入的高电压大电流信号转换为 AD 和瞬变监测电路能够
电能质量在线监测研究
电能质量在线监测研究作者:贺毅来源:《城市建设理论研究》2013年第09期摘要:在目前的供电系统中,由于电能质量关系到电气设备和电网的整体安全,所以我们必须对电能质量引起足够的重视。
为了保证电能质量能够达到要求,有效保护电气设备和电网安全,并达到安全传输标注,电能质量的监测成为了必然的发展方向。
为了达到对电能质量的有效监测,电能质量监测系统应运而生。
从目前电能质量的监测情况来看,电能质量在线监测系统是一种有效的系统,可以实现对电能质量的实时监测,保证电能质量满足传输需要,对电气设备和电网形成较好的保护。
本文主要分析了电能质量在线监测系统的设计和运行过程,对电能质量在线监测系统进行深入的研究。
关键词:电能质量;在线监测;系统设计中图分类号:R363.1+24 文献标识码:A 文章编号:一、前言随着我国电力事业的发展,电力网络的建设进入了快速发展期,在电力传输过程中,如何提高电能质量并提高电能传输效率成为了电力传输企业重要的研究课题。
目前来看,为了保证电能质量达到要求,并实现对用电设备和电网的有效保护,我们应该积极开展电能质量监测,利用先进手段对电能质量进行实时监测,保证电能质量符合要求。
目前对于电能质量的监测主要是依靠在线监测系统来实现的,因此我们需要对电能质量在线监测系统进行深入的了解,对系统的设计和运行状况进行分析。
二、电能质量在线监测系统设计的必要性考虑到电力传输的自身特点,电能质量是一个动态变化的过程。
电能在传输过程中容易受到许多其他因素的干扰,为此,对电能质量进行在线监测是十分必要的,电能质量在线监测系统的设计也是十分必要的,其必要性主要表现在以下几个方面:1、电能质量在线监测系统设计是提高电能质量的必要手段为了提高电能质量,在电能质量在线传输中,我们需要设计在线监测系统,对电能的整个动态传输过程进行监控,如果发现电能质量出现异常,会通过信息反馈系统将问题反馈给电力生产部门和传输部门,对电能质量进行及时调整。
电能质量与在线监测方法研究
电能质量与在线监测方法研究作者:王宪磊来源:《科技创新导报》 2012年第10期王宪磊(塔里木大学机械电气化工程学院新疆阿拉尔 843300)摘要:现代社会,电能质量问题已经引起了人们的高度重视,针对目前电网中存在的电能质量在线监测问题,分析了电能质量各项指标及在线监测方法,介绍了在线监测系统的组成和工作原理。
关键词:电能质量在线监测数据采集中图分类号:TM76 文献标识码:A 文章编号:1674-098X(2012)04(a)-0001-02Abstract:In modern society, power quality issues have drawn great attention to people, currently exists in the grid power quality online monitoring, analysis method of power quality on-line monitoring and indicators, describes thecomposition and working principle of on-line monitoring system.Key Words:power quality;on-line monitoring;data acquisition现代社会中,电能是一种最为广泛使用的能源,其应用程度是一个国家发展水平的主要标志之一。
随着科学技术和国民经济的发展,人们对电能质量的要求越来越高。
电能质量的好坏直接关系到国民经济的总体效益,提高电能质量有巨大的经济效益,因此,建立和实施电能质量的在线监测和分析是提高电能质量的一个重要技术手段。
随着我国电力事业的不断发展,电力系统容量不断扩大,电网规模逐年增大,系统中各种大容量变流、调速电器设备使用数量增多,这些设备的非线性和冲击性的特性,会引起电能质量下降,造成电能污染,产生的大量谐波会增加电动机的损耗,造成电动机出力不均匀,会影响电动机的使用寿命,同时也给生产企业带来极大的电能浪费。
电能质量外文翻译
科学,技术和创新监控和分析电力的特点质量体系绩效NIKE SHANKU,GENCI SHARKO电气工程学院阿尔巴尼亚地拉那理工大学关键词:电能质量,过压,欠压,持续中断,中断,电压骤降和骤升。
摘要:电能质量是一个边界的集合,使电力系统以其预期的没有重大性能和寿命损失的方式运作。
这个词是用来形容电力驱动的电力负荷和负载的,电力正常运作的能力。
没有适当的电源质量,电气设备就会出现故障,过早失效或根本不能运行。
关于为什么电力质量差是有很多原因的,而导致这种质量差的电源的原因则更多。
电力系统电能质量,影响所有连接的电气和电子设备,是用来测量电压,电流,频率,温度,蜿蜒力和力矩的措施特别是供水系统及其部件的偏差的。
近年来,在非线性负载已有丰富的经验;特别是分布荷载作用下,如电脑、监视器和照明和分布式的来源。
目的纸是电力质量体系的监控和分析功能的显示方式。
作为监控的例子是采取从额定功率在320千伏安,部分分布在阿尔巴尼亚都拉斯市的电网变压器输出。
介绍本文的主要目的是在一般要求的基础上描述监控和分析电力系统的性能。
一个电力生产商可能会发现这目标的重要,如果除了在客户的需求下配合这个系统的性能外,有需要了解其系统性能。
电能质量监测是收集,分析和解释收集成有用信息的测量数据的过程。
采集的数据的过程通常是在持续的时期通过不断开展在扩展的电压和电流测量。
本文中的监测过程的时间已为期11天。
电能质量分析数据电气参数均取自电源输出变压器额定功率320千伏安和额定电压20/0.4千伏。
监测和分析的过程被参考IEEE1159标准和国际标准IEC61000-4-30。
提供的一般准则和定义标准中提到,它提供了一个共同的语言描述电能质量现象。
电能质量监测标准监测电能质量现象的IEC标准被以成系列或数字编号61000-4-XX的文件提供。
在这一系列的封面个别标准每个类型的电能质量变化的具体要求或相关事项。
例如,IEC61000-4-7规定谐波失真水平监测规范。
一种新型电能质量在线检测装置
一种新型电能质量在线检测装置庄骏;陈苏声【摘要】根据国际标准规定的各项电能质量参数计算方法,结合风电电能质量的特点,设计了适用于风力发电机组电能质量的在线检测装置,从而可以帮助风电企业和用户检测风电设备,保障风电机组的电能质量性能.最后将检测结果与国外高精度仪器同步比较,效果良好.%Based on computing methods of power quality parameters specified in international standards,this article designs an online device for measuring power quality of wind power generation sets under consideration of the characteristics of wind power quality,so as to help wind power enterprises and users in their inspection of wind power equipment and guarantee the power quality of wind power generator set.Finally,comparison between the measurenent result and that of foreign high-precision instruments proves that the result is good.【期刊名称】《电气自动化》【年(卷),期】2017(039)001【总页数】3页(P116-118)【关键词】风电;电能质量;在线检测;电压;频率;谐波【作者】庄骏;陈苏声【作者单位】上海市质量监督检验技术研究院,上海200072;上海市质量监督检验技术研究院,上海200072【正文语种】中文【中图分类】TM614电能质量测试是风电机组并网试验的重要组成部分。
可扩展的在线电能质量监测系统
可扩展的在线电能质量监测系统崔恒春;汪勤;赵春宇【摘要】为了实时监测不同规模大小的电力系统上的电能质量,设计了一种可扩展的在线电能质量监测系统.该系统基于模块化的设计思想,将传统的电能监测系统划分为电流检测模块、电压检测模块和主控制模块,实际应用中可以根据所要监测的电力系统的规模大小灵活配置多个电流电压检测模块来同时监测不同通道上电能质量情况,并能够通过与远程主机实现通信,实现历史数据维护和数据分析,很好地满足了现代电能监测系统网络化,实时性和灵活性的要求.%In order to monitor and analyze power quality of electricity grid on different scale in real-time, this paper proposed a on-line monitoring system for power quality. The system was designed according to methodology of modularization. There are three function modules: electric current detection board, electric voltage detection board and main control board. All the modules can be connected conveniently so that users can configure the modules as much as electricity grid needs according to the scale. On the other hand,the main control board can analyze historical data and communicate with remote host.【期刊名称】《仪表技术与传感器》【年(卷),期】2011(000)007【总页数】3页(P106-107,110)【关键词】电能质量;可扩展;在线检测;模块化设计【作者】崔恒春;汪勤;赵春宇【作者单位】上海交通大学电子信息与电气工程学院,上海200240;上海电子信息职业技术学院中德学院,上海201411;上海交通大学电子信息与电气工程学院,上海200240【正文语种】中文【中图分类】P2741 系统总体结构文中介绍了一种可配置基于嵌入式网络的在线电能监测系统,其系统架构如图1所示。
电能质量监测装置在线检测方法探讨
电能质量监测装置在线检测方法探讨
杨灵灵
【期刊名称】《现代科学仪器》
【年(卷),期】2018(0)6
【摘要】在近代电力运维工作当中,电力单位为了保障电能质量,会采用电能质量监测装置来完成工作,但此项装置时常处于电磁环境当中,所以很容易受到电磁影响而失准,说明其运行应当得到管理.在此前提下,本文将提出一种安装现场对电能质量监测装置进行在线检测的系统,该系统能够实时、便捷的核对电能质量监测装置当前是否存在误差、误差具体表现,具有较高应用价值,同时本文为了验证设计系统有效,将通过实验方法来进行测试,结果显示本文系统可靠.
【总页数】4页(P86-89)
【作者】杨灵灵
【作者单位】新疆克孜勒苏柯尔克孜自治州质量技术监督局新疆克孜勒苏柯尔克孜自治州 845350
【正文语种】中文
【中图分类】TM711;TP274
【相关文献】
1.不依赖空气动力装置(AIP)排出气体中C02浓度在线检测装置研制 [J], 贺国;刘燕燕;陈国钧
2.电能质量监测装置在线检测方法研究及系统设计 [J], 郭敏;陈卫东;金庆忍
3.配电网电能质量监测数据简约方法探讨 [J], 王红星;刘军成;李军;张欣;梁栋
4.基于WEB的电能质量监测装置智慧运维管理 [J], 陈国平;孟金棒;马莲;唐兴勇;岑宝仪
5.25.6k采样率的分布式电能质量监测装置研究 [J], 邓劲东;程立;朱何荣;刘东超因版权原因,仅展示原文概要,查看原文内容请购买。
- 1、下载文档前请自行甄别文档内容的完整性,平台不提供额外的编辑、内容补充、找答案等附加服务。
- 2、"仅部分预览"的文档,不可在线预览部分如存在完整性等问题,可反馈申请退款(可完整预览的文档不适用该条件!)。
- 3、如文档侵犯您的权益,请联系客服反馈,我们会尽快为您处理(人工客服工作时间:9:00-18:30)。
1.6 CONCLUSION ...........................................................................................................18
外文文,影响到电力企业和用户的利益。本文介绍了
泛使用,但有很多缺点。测量的结果受到测量地点和时间的极大限制,很难获得整个系
统的全面信息。因此,不可能评估整个系统的电能质量,很难获得足够的信息作进一步
的分析和决定,如查找污染源,为提高电能质量提出最佳解决方案。
1.3.2在线监测
我们都知道电能质量与其他产品质量不同。它是由电力生产商和消费者共同决定的。
1.5 ANALYSISBASEDONOPNET............................................................................14
1.5.1 Shared 10M Ethernet.........................................................................................15
如以太网和光纤系统,通过装置间的数据交换和调和,达到更高的数据分析和判断的目
量分析显得更加优越。因此,主要问题是通信网络是否能够承担这个任务。
本文首先对离线和在线电能质量监测系统进行了比较,并指出构建在线监测系统的
优点和重要性,接着分析了在线监测系统的通信要求和结构。为了利用目前的电力系统
的通信网络,本文研究了以太网传输简单原始数据的应用。
OPNET是一个专业的通信网
外文文献翻译
1外文文献翻译
......................................................................................................................1
1.1摘要
2000年陆续颁
布了
5条电能质量标准,对其质量指标进行定义和规定,例如电压偏移,频率偏移,谐
波,三相电压不对称,电压波动和闪变。随着现代工业的迅猛发展,越来越多非线性负
荷进入电力系统,例如电力电子装置。这极大地恶化了电能质量,电能质量的监测变得
迫切和重要。电能质量监测不仅仅测量和记录电能质量指标,帮助查找污染源,还为采
实际上许多电能质量问题是由用户的电器引起的。此外,电能质量指标在不同的空间时
间也有所不同,他们随着地点和时间而改变。为了得到准确和系统的电能质量信息需要
长时间连续的观测,获得实时的数据。因此,建立电能质量在线监测系统比偶尔进行的
一些测量更加好。目前有几种电能质量在线监测系统。
电能质量在线监测系统由以下几部分组成:
1.3.2 On-line Monitoring............................................................................................ 11
1.4 EVALUATIONONPOWERQUALITYDATATOBETRANSFERRED............13
电能质量监测的功能和方法,讨论了在线监测对电能管理的重要性,并着重介绍了电能
质量在线监测系统通信网络的要求,分析了不同的通信网络在应用电能质量在线监测系
统时的性能,用
OPNET模拟器证实了这些分析。结果显示共享式
10M以太网不能满足电
能质量在线监测的要求,需要交换式的
10M以太网或者比其更好的网络。
这就限制了数据的交流和更高级的电能质量监测功能。
随着电能质量对国民经济的影响逐渐加大和人们对电能质量研究的逐步深入,人们
需要更多的电能质量信息。一种趋势是运用更高性能的硬件提高站点监测装置的数据加
工能力,如出现了
DSP和
MCU结合,
FPGA的应用。另一种趋势就是利用目前的通信系统,
析也可以在这些装置中使用,用来识别瞬时的电能质量问题。为了把远程的电能质量监
测仪的数据传输到监控中心,人们采用了多种的通信电路。
然而,大多数的电能质量监测仪都是有限制或者预定函数的,提升这些仪器的性能
意味着成本上升,而把原始数据传输到电能质量监测中心进行高级的或者扩展的电能质
外文文献翻译
1.3.2在线监测
.............................................................................................................2
1.4对电能质量数据传输的评估
.......................................................................................3
络模拟器,它将为我们提供不同以太网在电能质量监测系统中的性能的虚拟分析。
现在主要有两种主要的电能质量监测形式:离线监测和在线监测。
1.3.1离线监测
电力企业可以派遣员工带着电能质量监测仪,定期的或者不定期的到监测点测量。
这种方法主要针对的分电站和客户,可能持续几个小时或者几周。这种方法今天还在广
1.5.2 Switched 10M and 100M Ethernet....................................................................16
1.5.3 Switched Ethernet with Background Traffic .....................................................17
1.5基于
OPNET的分析
....................................................................................................4
1.5.1共享式
10M以太网
...........................................................................................5
服务器和几个工作站组成。
外文文献翻译
(3)通信电路或者通信网络。通信电路把电能质量监测仪和电能质量监测中心连接
起来。通信电路可以使用各种的通信类型,如电话线、电力线载波、移动通信系统、微
波通信、以太网、光纤网络。为了利用现时的电力通信网络,首选以开放式传输协议为
基础的局域网和广域网。在线监测系统比传统的离线监测更具优点,使电力企业和用户
1.6结论
...............................................................................................................................8
2外文文献原文
......................................................................................................................9
——电能质量,在线监测,通信网络,以太网,
OPNET。
近年来,电能质量受到了电力公司和用户的普遍关注。如果电能质量超过了某一界
限,就回危及到电力系统里设备运行的安全性和稳定性,影响到消费者和电力企业的经
济利益。人们颁布了一些电能质量标准,例如
EN50160。我国从
1990到
1.3 POWERQUALITYMONITORINGSYSTEM......................................................10
1.3.1 Off-line Monitoring...........................................................................................10
取措施提高电能质量提供的必要信息。
人们对电能质量监测的理论和应用做了很多努力,包括电能质量指标的定义,衡量
方法,软硬件的设计,和整个电能质量监测系统的构建,设计了一些专门的电能质量监
测仪,它们都能适合在电力系统中在线或者离线的监测。许多监测仪能够利用高精度的
电子部件,例如
DPS,FPGA,实现实时并行处理数据。此外传统的傅里叶分析,微波分
...............................................................................................................................1
1.2介绍
...............................................................................................................................1
1.3电能质量监测系统
.......................................................................................................2