微观经济学综合习题第7章
微观经济学第七章练习题

微观经济学第七章练习题一、选择题1、垄断竞争厂商的平均收益曲线是一条()(注:此题双选)A.平行于横轴的直线B.向右下方倾斜的线C.垂直于横轴的线D.与需求曲线重合的线2、垄断竞争厂商所面对的需求曲线()A.是平行于横轴的直线B.是垂直于横轴的直线C.是向右下方倾斜的D.以上结论都正确3、完全垄断厂商长期均衡产量上可以有()(注:此题多选)A.P>LACB.P=LACC.AR>LACD.AR=LAC4、垄断竞争市场形成的关键条件是()A.产品有差别B.厂商数目相当多C.厂商生产规模比较小D.企业利用国家的特权5、垄断竞争厂商达到长期均衡时()(注:此题多选)A.超额利润=0B.P>LMCC.d与D曲线相交D.P>LAC6、垄断竞争厂商长期均衡的条件是()A.MR=MCB.MR=LMC=SMC=LAC=SACC.MR=LMC=SMC及AR=LAC=SACD.MR=LMC=AMC7、若在需求曲线上某一点的Ed=3,P=6,则相应的MR为()A.MR=2B.MR=4C.MR=18D.MR=18、根据古诺模型,在三个相同寡头垄断的条件下,每个厂商的产量是市场容量的()A.1/3B.1/4C.1/5D.不能确定9、对垄断厂商来说,下述哪种说法是不正确的()A.面临的需求曲线向右下方倾斜B.在利润最大化产量上,价格等于边际收益C.边际收益与平均收益不相等D.利润最大化产量上,价格高于边际成本10、垄断竞争厂商短期均衡时()A.厂商获得超额利润B.厂商处于亏损状态C.厂商获得正常利润D.以上情况都有可能11、在折弯需求曲线模型中,折点两边的需求弹性()A.左边弹性大,右边弹性小B.两边弹性一样大C.右边弹性大,左边弹性小D.无法判断二、判断题,对错误的部分进行纠正1、斯威齐模型的基本假设条件是“跟涨不跟落”2、垄断厂商所面临的需求曲线就是市场的需求曲线3、古诺模型假定,行业中只有两个厂商,他们的边际成本既定,且每个厂商都假定另一个厂商的产出数量不变4、垄断厂商在短期内实现均衡时,可以获得最大利润,可以利润为零,也可以蒙受最小亏损5、从长期看,垄断竞争市场条件下的超额利润将会消失6、垄断厂商实现长期均衡时,必定获得超额利润7、垄断行业由于有规模经济存在,可以比竞争行业产量更高,价格更低8、垄断竞争与完全竞争的关键差别是垄断竞争存在产品差别9、垄断厂商在长期均衡的情况下,只能获得正常利润10、在垄断厂商的短期均衡时,垄断厂商肯定会获得超额利润11、垄断竞争厂商的AR曲线MR曲线相互重合12、垄断厂商是市场价格的决定者三、计算分析题1、某垄断厂商短期总成本函数为STC=3Q3+8Q2+140,需求函数为Q=720-P,求短期均衡产量和均衡价格。
《微观经济学》综合习题第7章复习过程
微观经济学综合习题一第7章不完全竞争市场练习题1.下列各项中,错误的是()A. 垄断厂商的平均收益曲线与需求曲线相重合B. 垄断厂商的边际收益曲线的斜率大于平均收益曲线的斜率C. 垄断厂商的边际收益大于平均收益D. 垄断厂商的边际收益小于平均收益2.在垄断厂商的短期均衡时,垄断厂商可以()A. 亏损B. 利润为零C. 盈利D. 上述情况都可能存在3.弯折的需求曲线模型的假设条件是()A. 行业内寡头厂商们之间是有勾结的B. 行业内某寡头厂商提价时,其他寡头厂商都会仿效C. 行业内某寡头厂商降价时,其他寡头厂商都会仿效D. 厂商可以任意进出市场4.垄断厂商的平均收益曲线与边际收益曲线均为直线时,平均收益曲线在Q轴上的截距是边际收益曲线在Q轴上的截距的()A. 一倍B. 两倍C. 一半D. 四倍5.当垄断厂商的长期均衡产量上,可以有()A. P大于LACB. P小于LACC. P等于最小的LACD. 以上情况都可能存在6.古诺模型达到均衡时,两厂商所占的市场份额为()A. 1/2,1/2B. 1/3,1/3C. 1/3,2/3D. 3/5,2/57.如果在需求曲线某一点上的需求价格弹性e d=5,商品的价格P=6,则相应的边际收益MR为()A. 7.5B. 24C. 1D. 4.88.古诺模型中,厂商以()为目的A. 减少成本B. 利润最大化C. 价格稳定D. 扩大市场占有9.垄断竞争市场上厂商的短期均衡发生于()A. 边际成本等于D需求曲线中产生的边际收益时B. 平均成本下降时C. d需求曲线与平均成本曲线相切时D. D需求曲线与d需求曲线相交,并有边际成本等于d需求曲线中产生的边际收益时10.当垄断市场的需求缺乏弹性时,MR为()A. 负值B. 0C. 1D. 正值答案:C、D、C、B、A、B、D、B、D、A微观经济学综合习题二第七章不完全竞争的市场一、名词解释不完全竞争市场垄断市场生产集团理想的产量多余的生产能力寡头市场二、填空题1.如果需求曲线上某一点的需求的价格弹性e d=5,商品的价格P=6,则相应的边际收益MR=()。
微观经济学第七章 习题答案

MR,试求:图7—1(1)A点所对应的MR值;(2)B点所对应的MR值。
解答:(1)根据需求的价格点弹性的几何意义,可得A点的需求的价格弹性为e d =eq \f(15-5,5)=2或者e d =eq \f(2,3-2)=2再根据公式MR=P eq \b\lc\(\rc\)(\a\vs4\al\co1(1-\f(1,e d ))),则A点的MR值为MR=2×eq \b\lc\(\rc\)(\a\vs4\al\co1(1-\f(1,2)))=1(2)与(1)类似,根据需求的价格点弹性的几何意义,可得B点的需求的价格弹性为e d =eq \f(15-10,10)=eq \f(1,2)或者e d =eq \f(1,3-1)=eq \f(1,2)再根据公式MR=P eq \b\lc\(\rc\)(\a\vs4\al\co1(1-\f(1,e d ))),则B点的MR值为MR=1×eq \b\lc\(\rc\)(\a\vs4\al\co1(1-\f(1,1/2)))=-12. 图7—2(即教材第205页的图7—19)是某垄断厂商的长期成本曲线、需求曲线和收益曲线。
试在图中标出:(1)长期均衡点及相应的均衡价格和均衡产量;(2)长期均衡时代表最优生产规模的SAC曲线和SMC曲线;(3)长期均衡时的利润量。
图7—2图7—3(1)长期均衡点为E点,因为在E点有MR=LMC。
由E点出发,均衡价格为P0,均衡数量为Q0。
(2)长期均衡时代表最优生产规模的SAC曲线和SMC曲线如图7—3所示。
在Q0的产量上,SAC曲线和LAC曲线相切;SMC曲线和LMC曲线相交,且同时与MR曲线相交。
(3)长期均衡时的利润量由图7—3中阴影部分的面积表示,即π=[AR(Q0)-SAC(Q0)]·Q 0。
3. 已知某垄断厂商的短期总成本函数为STC=0.1Q3-6Q2+140Q+3 000,反需求函数为P=150-3.25Q。
高鸿业版微观经济学练习题第七章_不完全竞争市场(参考练习与答案)
B. 不变成本,运输成本; D. 运输成本,可变成本;E. 不变成本,运输成本
8.219 下列哪种环境组合最有可能出现自然垄断? A. 高不变成本,低运输成本;B. 高不变成本,高运输成本;C. 低不就成本,高运 输成本;D.高可变成本,高运输成本;E.低可变成本,低运输成本。 8.220 买方垄断(Monophony)是( ) 。 A. 销售者的垄断 ;B. 购买者的垄断; C. 购买者和销售者都有垄断力; D. 寡头的另一种说法; E. 由垄断(Monopoly)拼写错误得出的名词。
8.18 当一个厂商对同一种物品向一个消费者集团收取的价格高于另一个消费者集团, 或者 实行“数量折扣” (即大量购买收取低价格)时,就存在价格歧视。 8.19 如果垄断者实行完全的价格歧视,它就可以获得所有消费者剩余。 ( ) ( )
8.110 为了对不同消费者集团实行价格歧视,垄断者就应该向需求富有弹性的消费者集团收 取高价格。 8.111 对学生和有身份的人实行不同价格折扣的厂商不能实现利润最大化。 ( ) ( )
(2) Q=15
8.32 设垄断厂商的产品的需求函数为 P=12-0.4Q,总成本函数 TC=0.6Q +4Q+5,求: (1) Q 为多少时总利润最大,价格、总收益、及总利润各为多少? (2) Q 为多少时使总收益最大,与此相应的价格、总收益及总利润各为多少? (3) Q 为多少时使总收益最大且总利润π ≥10, 与此相应的价格、 总收益及总利润为多少? 解: (1)总利润最大化的条件是 MC=MR。 已知厂商的产品需求函数为 P=12-0.4Q, 则 MR=12-0.8Q, 又知 TC=0.6Q +4Q+5, 则 MC=(TC)′=1.2Q+4。 总利润最大时, MR=MC, 即 12-0.8Q =1.2Q+4 ∴Q=4 把 Q=4 代入 P=12-0.4Q 中可得: P=12-0.4×4 = P=10.4 总收益 TR=PQ=10.4×4=41.6 总利润π =TR-TC=41.6-(0.6×4 +4×4+5)=11
微观经济学第7章不完全竞争市场习题

第7章不完全竞争市场一、名词解释1.价格歧视二、判断正误并解释原因1.只有在纯粹竞争的条件下,才存在行业产出的供给曲线。
( )2.在双寡头垄断的古诺模型中,如果两个厂商有不同的边际成本3.弯折的需求曲线的寡头垄断模型意味着假定没有一个厂商在行业中占支配地位。
( )4.如果垄断者经营一个企业,该企业规模使得垄断者在取得利润最大化产出时具有最低的平均成本,则这个企业达到了长期垄断均衡。
( )5.在一个有支配厂商的价格领导模型中,除支配厂商外,其他所有厂商的行为都像完全竞争市场中厂商的行为一样。
( )6.在完全竞争条件下,当平均可变成本曲线向下倾斜时,厂商不可能处于均衡状态;但在长期及垄断竞争条件下,除非它的平均成本曲线向下倾斜,厂商不可能处于均衡状态。
()7.成为垄断者的厂商可以任意定价。
( )8.在长期,垄断竞争厂商得不到超额利润,所以。
垄断竞争及完全竞争一样是一种有效的市场。
( )9.垄断竞争条件下厂商所面临的主观d需求曲线在所有价格水平下都更缺乏弹性。
( )三、判断题1.垄断厂商面临的需求曲线就是行业需求曲线。
( )2.如果厂商面临的需求曲线是下降的,则这个市场必定是完全垄断市场。
( )3.垄断厂商的边际收益总是大于边际成本。
( )4.差别定价是按边际成本的差异销售不同的价格。
( )5.垄断厂商实现利润最大化的条件不符合边际收益等于边际成本这条规则。
()6.一个垄断者在两个地区市场上以差别定价进行销售,它将选择需求弹性大的市场销售更多的产品。
( )7.垄断竞争市场中存在过剩生产力是消费者为追求产品差别而付出的代价。
( )8.寡头厂商生产的产品必然是有差别的,即使没有质上的差别,9.随着新厂商的进入,垄断竞争厂商的长期需求曲线会向左移动。
( )10.垄断竞争市场长期均衡时,有LAC= SAC。
( )11.垄断竞争及完全竞争的主要区别在于垄断竞争的市场需求曲12.在长期中,垄断竞争厂商得不到超额利润,因此资源可合理配置,所以垄断竞争市场及完全竞争市场一样是一种有效市场。
山东财经大学《微观经济学》习题八:第七章 一般均衡与经济效率
第七章一般均衡和经济效率基本概念1.局部均衡,一般均衡。
2.交换的契约曲线,效用可能性曲线。
3.帕累托改进,帕累托最优(帕累托效率、经济效率),生产可能性曲线,产品边际转换率。
单项选择1.所有市场同时出清叫做()。
BA.局部均衡B.一般均衡C.静态均衡D.动态均衡2.达到帕累托最优配置时,()。
DA.总产量最大B.总效用最大C.消费者得到他们想要的所有东西D.没有一个人可以在不使任何他人境况变坏的条件下使得自己境况变得更好3.当经济中所生产的产品组合反映消费者的偏好时,经济达到了()。
B A.效用的效率B.产品组合的效率C.生产的效率D.交换的效率4.经济具有产品组合的效率时,()。
DA.经济处于生产可能性线内部B.厂商使用的资源准确反映了所有可用的资源C.商品已不可能从进一步交易中获益的方式在所有人中加以分配D.经济中所生产的产品组合反映消费者的偏好5.两种商品在两个人之间的分配,能被称为帕累托最优的条件为()。
D A.不使其他人受损就不能使某人受益B.个人都处在某消费契约曲线上C.个人都处在某效用可能性曲线上D.以上条件都对6.产品边际转换率是()的斜率的绝对值。
DA.需求曲线B.边际产量曲线C.契约曲线D.生产可能性曲线7.如果对于消费者甲来说,以商品X替代商品Y的边际替代率等于2;对于消费者乙来说,以商品X替代Y的边际替代率等于1。
完全竞争市场条件下有可能发生的是()。
A A.乙用X向甲交换YB.乙用Y向甲交换XC.甲和乙不会交换商品D.以上均不正确8.如果橙子与苹果之间的边际转换率是2个橙子换1个苹果,1个苹果的相对价格是1.5个橙子,那么厂商将()。
BA.生产更多的橙子和苹果B.如果将资源由苹果生产转向橙子生产,境况会更好C.如果将资源由橙子生产转向苹果生产,境况会更好D.并不想将资源在苹果和橙子生产之间转移9.生产具有效率时每个厂商()。
CA.任意两种商品的边际替代率等于哪两种商品的价格比率B.任意两种投入的边际技术替代率等于1C.任意两种投入的边际技术替代率等于那两种投入的价格比率D.任意两种投入的边际技术替代率等于厂商在保持产量不变的条件下,在增加一单位一种投入的同时可减少另一种投入的数量10.竞争市场是有效率的,意味着()。
平狄克《微观经济学》(第7版)习题详解(第7章-生成成本)
平狄克《微观经济学》(第7版)第7章生产成本课后复习题详解跨考网独家整理最全经济学考研真题,经济学考研课后习题解析资料库,您可以在这里查阅历年经济学考研真题,经济学考研课后习题,经济学考研参考书等内容,更有跨考考研历年辅导的经济学学哥学姐的经济学考研经验,从前辈中获得的经验对初学者来说是宝贵的财富,这或许能帮你少走弯路,躲开一些陷阱。
以下内容为跨考网独家整理,如您还需更多考研资料,可选择经济学一对一在线咨询进行咨询。
1.某公司支付给会计人员10000美元的年薪,这笔费用是一项经济成本吗?答:这笔费用是一项经济成本。
经济成本是显性成本和隐性成本之和。
显性成本指实际支出,所有涉及到货币交易行为的成本都属于显性成本。
隐性成本是一种经济成本,不涉及到货币交易行为,但涉及到生产中所使用的资源的成本。
当一个公司支付给会计人员10000美元年薪时,这是一笔货币交易,这笔费用是会计人员用劳动换来的收入。
因此,这笔费用属于经济成本中的显性成本。
2.某小零售店女店主自己做账,你将如何计算她工作的机会成本?答:该店主自己做账的机会成本是:她利用做账的时间和精力做其他事情时所能获得的最大收入。
根据机会成本的定义,如果该小零售店女店主不是自己做账,她可以在这段时间里做其他的事情,例如做小生意或者参加一些休闲活动。
那么,女店主自己做账的机会成本就是她用于做账的时间做其他事情时所能获得的最大收入。
3.解释以下说法正确与否:(1)如果一家企业的拥有者不给自己支付工资,则会计成本为零,而经济成本为正。
(2)会计利润为正的企业不一定经济利润也为正。
(3)企业雇佣了一些目前处于失业状态的工人,则其使用这些工人服务的机会成本为零。
答:(1)正确。
因为这里不存在货币交易,所以不存在会计成本(或显性成本)。
但是,因为企业的拥有者可以受雇于其他企业,因而存在经济成本。
经济成本为正,反映了此人工作时间的机会成本。
(2)正确。
会计利润仅考虑显性成本。
人大版微观经济学(第三版)课后答案第7-8章

第七章 不完全竞争市场第一部分 教材配套习题本习题详解1.根据图7-20中某垄断厂商的线性需求曲线d 和相应的边际收益曲线MR ,试求:(1)A 点所对应的MR 值;(2)B 点所对应的MR 值。
图7-20答:由图7-20可知需求曲线d为P=-351+Q , TR(Q)=P ·Q= -Q Q 3512+, 所以MR=TR ′(Q)= -352+Q (1)A 点(Q=5,P=2) 的MR 值为:MR (5)= -352+Q =1; (2)B 点(Q=10,P=1) 的MR 值为: MR (10)= -352+Q =-1 本题也可以用MR=P(1--dE 1)求得: E A =2,P A =2,则MR=P(1--d E 1)=2x (1- 12)=1 E B =12,P B =1,则MR=P(1--d E 1)=1x (1- 10.5)=-12.为什么垄断厂商实现 MR =MC 的利润最大化均衡时,总有P >MC ? 你是如何理 解这种状态的?解答:在完全竞争市场条件下,由于厂商的MR=P,所以完全竞争厂商利润最大化的原则MR=MC可以改写为P=MC。
这就是说,完全竞争厂商的产品价格等于产品的边际成本。
而在垄断市场条件下,由于垄断厂商的MR曲线的位置低于d需求曲线的位置,即在每一产量水平上都有P>MR,又由于垄断厂商是根据利润最大化原则MR=MC来决定产量水平的,所以,在每一个产量水平上均有P>MC。
这就是说,垄断厂商的产品价格是高于产品的边际成本的。
而且,在MC曲线给定的条件下,垄断厂商的d需求曲线以及相应的MR曲线越陡峭,即厂商的垄断程度越强,由利润最大化原则MR=MC所决定的价格水平P高出边际成本MC的幅度就越大。
鉴于在垄断市场上的产品价格P>MC,经济学家提出了一个度量厂商垄断程度的指标:勒纳指数。
勒纳指数可以由1(1eMR P=-)=MC推导出,1(1eMR P=-)=MC,整理得,勒纳指数为:1e PP MC-=。
萨缪尔森《微观经济学》(第19版)习题详解(含考研真题)(第7章 成本分析)

萨缪尔森《微观经济学》(第19版)第7章 成本分析课后习题详解跨考网独家整理最全经济学考研真题,经济学考研课后习题解析资料库,您可以在这里查阅历年经济学考研真题,经济学考研课后习题,经济学考研参考书等内容,更有跨考考研历年辅导的经济学学哥学姐的经济学考研经验,从前辈中获得的经验对初学者来说是宝贵的财富,这或许能帮你少走弯路,躲开一些陷阱。
以下内容为跨考网独家整理,如您还需更多考研资料,可选择经济学一对一在线咨询进行咨询。
一、概念题1.总成本:固定成本和可变成本(total costs :fixed and variable ) 答:(1)总成本(TC )是生产某一特定产量所需要的最低成本总额,即生产活动中所使用的全部生产要素的价格。
在短期中,总成本可以分为固定成本与可变成本,用公式表示即为:TC FC VC =+。
(2)固定成本(FC )也称为“固定开销”,是指在短期内不会随着产量变动而变动的生产要素价格,一般包括租用机器厂房所花费的租金、机器设备折旧费、债务的利息支付、长期工作人员的薪水等等。
(3)可变成本(VC )是指在短期内可以随着产量变动而变动的那些成本,一般包括原材料、燃料和动力的费用、生产工人的工资,也包括非固定的所有成本。
厂商没有进行生产时,可变成本为零。
产量逐渐增加时,可变成本会相应地增加。
2.边际成本(marginal cost )答:边际成本是指厂商多生产一单位产出所需要增加的总成本,或者说,边际成本就是由1单位产量的变动所引起的总成本的变动。
设()C Q 为生产Q 单位产量的总成本,则Q 与(1Q -)单位产量之间的成本()()1C Q C Q --就是边际成本。
如果用TVC ∆表示由产量的变动Q ∆所引起的总可变成本的变动,用TFC ∆表示由产量的变动Q ∆所引起的总固定成本的变动,则边际成本可以表示为:()////MC TVC TFC Q TVC Q P V Q P MP =∆+∆∆=∆∆=⋅∆∆=在边际报酬递减规律作用下的边际成本曲线表现为先降后升的U 形特征,即在产量水平较低的阶段上,边际成本可能随产量的增加而减少,但到达一个最低点后,则随着产量的进一步增加而增加。
西方经济学(微观经济学)课后练习答案第七章
西⽅经济学(微观经济学)课后练习答案第七章微观第七章习题⼀、名词解释完全垄断市场垄断竞争市场寡头市场价格歧视博弈纳什均衡占优策略均衡⼆、选择题1、对于垄断⼚商来说,()。
A、提⾼价格⼀定能够增加收益;B、降低价格⼀定会减少收益;C、提⾼价格未必会增加收益,降低价格未必会减少收益;D、以上都不对。
2、完全垄断的⼚商实现长期均衡的条件是()。
A、MR=MC;B、MR=SMC=LMC;C、MR=SMC=LMC=SAC;D、MR=SMC=LMC=SAC=LAC。
3、完全垄断⼚商的总收益与价格同时下降的前提条件是()。
A、Ed>1;B、Ed<1;C、Ed=1;D、Ed=0。
4、完全垄断⼚商的产品需求弹性Ed=1时()。
A、总收益最⼩;B、总收益最⼤;C、总收益递增;D、总收益递减。
5、完全垄断市场中如果A市场的价格⾼于B市场的价格,则()A、A市场的需求弹性⼤于B市场的需求弹性;B、A市场的需求弹性⼩于B市场的需求弹性;C、A市场的需求弹性等于B市场的需求弹性;D、以上都对。
6、以下关于价格歧视的说法不正确的是()。
A、价格歧视要求垄断者能根据消费者的⽀付意愿对其进⾏划分;B、⼀级价格歧视引起⽆谓损失;C、价格歧视增加了垄断者的利润;D、垄断者进⾏价格歧视,消费者就必定不能进⾏套利活动。
7、垄断竞争的⼚商短期均衡时,()。
A、⼀定能获得差额利润;B、⼀定不能获得经济利润;C、只能得到正常利润;D、取得经济利润、发⽣亏损和获得正常利润都有可能。
8、垄断竞争⼚商长期均衡点上,长期平均成本曲线处于( B )A、上升阶段B、下降阶段C、⽔平阶段D、以上三种情况都有可能9、垄断竞争⼚商实现最⼤利润的途径有:( D )A、调整价格从⽽确定相应产量B、品质竞争C、⼴告竞争D、以上途径都可能⽤10、按照古诺模型下列哪⼀说法不正确,()。
A、双头垄断者没有认识到他们的相互依耐性;B、每⼀个寡头都认定对⽅的产量保持不变;C、每⼀个寡头垄断者都假定对⽅价格保持不变;D、均衡的结果是稳定的。
微观经济学第7章课后计算题答案.docx
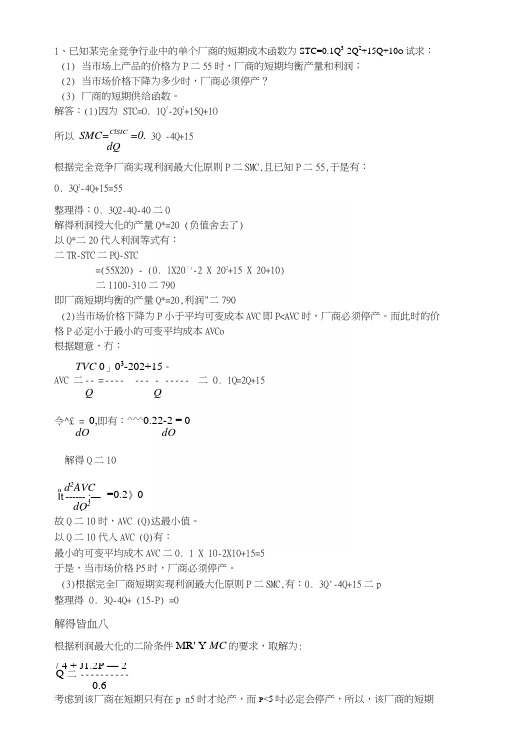
/ 4 + J1.2P — 2 Q 二 ----------0.61、已知某完全竞争行业中的单个厂商的短期成木函数为STC=0.1Q 3-2Q 2+15Q+10O 试求: (1) 当市场上产品的价格为P 二55时,厂商的短期均衡产量和利润; (2) 当市场价格下降为多少时,厂商必须停产? (3) 厂商的短期供给函数。
解答:(1)因为 STC=O. 1Q 3-2Q 2+15Q+1O 所以 SMC=ClSIC =0. 3Q -4Q+15dQ根据完全竞争厂商实现利润最大化原则P 二SMC,且已知P 二55,于是有:0. 3Q 2-4Q+15=55整理得:0. 3Q2-4Q-40二0解得利润授大化的产量Q*=20 (负值舍去了) 以Q*二20代入利润等式有: 二TR-STC 二PQ-STC=(55X20) - (0. lX20:i-2 X 202+15 X 20+10)二1100-310二790即厂商短期均衡的产量Q*=20,利润"二790(2)当市场价格下降为P 小于平均可变成本AVC 即P<AVC 时,厂商必须停产。
而此时的价格P 必定小于最小的可变平均成本AVCo 根据题意,冇:TVC 0」03-202+15。
AVC 二 -- = ---- --- - ----- 二 0. 1Q=2Q+15Q Q 令^£ = 0,即有:^^^0.22-2 = 0dOdO解得Q 二10故Q 二10时,AVC (Q)达最小值。
以Q 二10代入AVC (Q)有:最小的可变平均成木AVC 二0. 1 X 10-2X10+15=5 于是,当市场价格P5时,厂商必须停产。
(3)根据完全厂商短期实现利润最大化原则P 二SMC,有:0. 3Q'-4Q+15二p整理得 0. 3Q-4Q+ (15-P) =0解得皆血八根据利润最大化的二阶条件MR' Y MC 的要求,取解为:考虑到该厂商在短期只有在p n5时才纶产,而P <5吋必定会停产,所以,该厂商的短期ud 2AVC It ------ ;— dQ 2=0.2》0供给函数Q=f (P)为:Q/ +心三0.6P<52、已知某完全竞争的成本不变行业中的单个厂商的长期总成本函数LTC-Q 3-12QM0Q O 试求: (1) 当市场商品价格为P=100时,厂商实现MR=LMC 时的产量、平均成本和利润; (2) 该行业长期均衡时的价格和单个厂商的产量;(3) 当市场的需求函数为Q 二660-15P 吋,行业长期均衡吋的厂商数量。
《微观经济学》课后练习题7-1011
第七章 不完全竞争的市场一.选择题1.对完全垄断厂商来说,( C )A.提高价格一定能够增加收益;B.降低价格一定会减少收益;C.提高价格未必能增加收益,降低价格未必减少收益;D.以上都不对。
2.完全垄断厂商的总收益与价格同时下降的前提条件是( B )A. E d >1;B. E d <1;C. E d =1;D. E d =0 。
3.一垄断者如果有一线性需求函数,总收益增加时( B )A.边际收益为正值且递增;B.边际收益为正值且递减;C.边际收益为负值;D.边际收益为零。
4.完全垄断厂商的产品需求弹性E d =1时,( B )A.总收益最小;B.总收益最大;C.总收益递增;D.总收益递减。
5.理性的垄断者不会选择在需求价格弹性的下列哪一绝对值上生产? ( B )A 等于零B 等于无穷大C 大于1D 小于16.当垄断市场的需求富于弹性时,MR 为( A )A.正;B.负;C.0;D.1。
7.垄断厂商利润极大时,( C )A.P=MR=MC ;B.P >MR=AC ;C.P >MR=MC ;D.P >MC=AC 。
8.如果市场价格超过平均成本,边际收益大于边际成本,垄断厂商多卖1单位产品时( D )A.对总利润没有影响,但会缩小边际收益和边际成本之间的差额;B.总利润会减少;C.厂商总收益会减少其数额等于P -AC ;D.总利润会增加,其数额为MR -MC ,并缩小边际收益和边际成本之间的差额。
9.完全垄断厂商的平均收益曲线为直线时,边际收益曲线也是直线。
边际收益曲线的斜率为平均收益曲线斜率的( A )A.2倍;B.1/2 倍;C.1倍;D.4倍。
10.若一个管理机构对一个垄断厂商的限价正好使经济利润消失,则价格要等于( C )A.边际收益;B.边际成本;C.平均成本;D. 平均可变成本。
11.在短期,完全垄断厂商( D )A.无盈亏;B.取得最大利润;C.发生亏损;D.以上任一种情况都可能出现。
微观经济学课后习题答案第七章完整版

微观经济学课后习题答案第七章HEN system office room 【HEN16H-HENS2AHENS8Q8-HENH1688】第七章 复习思考题 参考答案1、为什么垄断厂商的需求曲线是向右下方倾斜的?并解释相应的TR 曲线、AR 曲线和MR 曲线的特征以及相互关系。
解答:垄断厂商所面临的需求曲线是向右下方倾斜的,其理由主要有两点:第一,垄断厂商所面临的需求曲线就是市场的需求曲线,而市场需求曲线一般是向右下方倾斜的,所以垄断厂商的需求量与价格成反方向的变化。
第二,假定厂商的销售量等于市场的需求量,那么,垄断厂商所面临的向右下方倾斜的需求曲线表示垄断厂商可以通过调整销售量来控制市场的价格,即垄断厂商可以通过减少商品的销售量来提高市场价格,也可以通过增加商品的销售量来降低市场价格。
关于垄断厂商的TR 曲线、AR 曲线和MR 曲线的特征以及相互关系,以图7-1加以说明:第一,平均收益AR 曲线与垄断厂商的向右下方倾斜的d 需求曲线重叠。
因为,在任何的销售量上,都是P=AR 。
第二,边际收益MR 曲线是向右下方倾斜的,且位置低于AR 曲线。
其原因在于AR 曲线是一条下降的曲线。
此外,在线性需求曲线的条件下,AR 曲线和MR 曲线的纵截距相同,而且MR 曲线的斜率的绝对值是AR 曲线的斜率的绝对值的两倍。
第三,由于MR 值是TR 曲线的斜率,即dQdTR MR =,所以,当MR>0时,TR 曲线是上升的;当MR <0时,TR 曲线是下降的;当MR=0时,TR 曲线达极大值。
图 7-1 垄断竞争厂商的AR 与TR 之间的关系2、根据图7-22中线性需求曲线d 和相应的边际收益曲线MR ,试求:(1)A 点所对应的MR 值;(2)B 点所对应的MR 值。
解答:(1)根据需求的价格点弹性的几何意义,可得A 点的需求的价格弹性为:25)515(=-=d e , 或者,2)23(2=-=d e ,根据)11(d e P MR -=,则A 点的MR 值为:MR=2×(2×1/2)=1。
曼昆微观经济学课后练习英文答案(第七章)
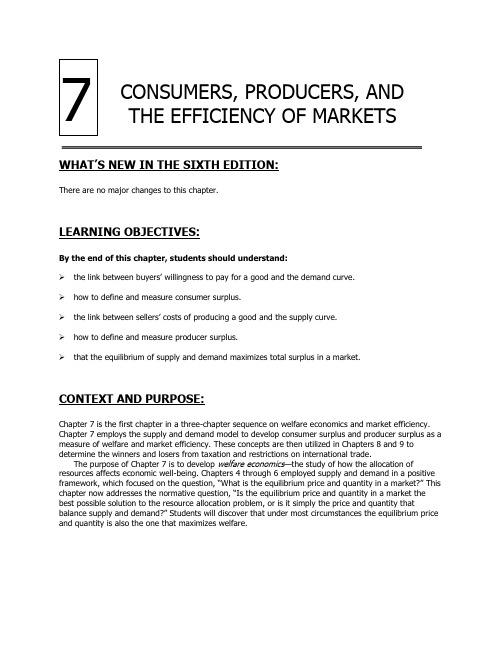
WHAT’S NEW IN THE SIXTH EDITION:There are no major changes to this chapter.LEARNING OBJECTIVES:By the end of this chapter, students should understand:➢ the link between buyers’ willingness to pay for a good and the demand curve.➢ how to define and measure consumer surplus.➢ the link between sellers’ costs of producing a good and the supply curve.➢ how to define and measure producer surplus.➢ that the equilibrium of supply and demand maximizes total surplus in a market.CONTEXT AND PURPOSE:Chapter 7 is the first chapter in a three-chapter sequence on welfare economics and market efficiency. Chapter 7 employs the supply and demand model to develop consumer surplus and producer surplus as a measure of welfare and market efficiency. These concepts are then utilized in Chapters 8 and 9 to determine the winners and losers from taxation and restrictions on international trade.The purpose of Chapter 7 is to develop welfare economics —the study of how the allocation ofresources affects economic well-being. Chapters 4 through 6 employed supply and demand in a positive framework, which focused on the question, “What is the equilibrium price and quantity in a market?” This chapter now addresses the normative question, “Is the equ ilibrium price and quantity in a market the best possible solution to the resource allocation problem, or is it simply the price and quantity thatbalance supply and demand?” Students will discover that under most circumstances the equilibrium price and quantity is also the one that maximizes welfare.7CONSUMERS, PRODUCERS, AND THE EFFICIENCY OF MARKETSKEY POINTS:• Consumer surplus equals buyers’ willingness to pay for a good minus the amount they actually pay for it, and it measures the benefit buyers get from participating in a market. Consumer surplus can be computed by finding the area below the demand curve and above the price.• Producer surplus equals the amount sellers receive for their goods minus their costs of production, and it measures the benefit sellers get from participating in a market. Producer surplus can be computed by finding the area below the price and above the supply curve.•An allocation of resources that maximizes the sum of consumer and producer surplus is said to be efficient. Policymakers are often concerned with the efficiency, as well as the equality, of economic outcomes.• The equilibrium of supply and demand maximizes the sum of consumer and producer surplus. That is,the invisible hand of the marketplace leads buyers and sellers to allocate resources efficiently.• Markets do not allocate resources efficiently in the presence of market failures such as market poweror externalities.CHAPTER OUTLINE:I. Definition of welfare economics: the study of how the allocation of resources affectseconomic well-being.II. Consumer SurplusA. Willingness to Pay1. Definition of willingness to pay: the maximum amount that a buyer will pay for agood.2. Example: You are auctioning a mint-condition recording of Elvis Presley’s first album. Fourbuyers show up. Their willingness to pay is as follows:If the bidding goes to slightly higher than $80, all buyers drop out except forJohn. Because John is willing to pay more than he has to for the album, hederives some benefit from participating in the market.3. Definition of consumer surplus: the amount a buyer is willing to pay for a goodminus the amount the buyer actually pays for it.4. Note that if you had more than one copy of the album, the price in the auction would end upbeing lower (a little over $70 in the case of two albums) and both John and Paul would gain consumer surplus.B. Using the Demand Curve to Measure Consumer Surplus1. We can use the information on willingness to pay to derive a demand curve for the rare ElvisPresley album.PriceBuyersQuantity DemandedMore than $100 None 0 $80 to $100 John1 $70 to $80 John, Paul2 $50 to $70 John, Paul, George3 $50 or lessJohn, Paul, George, Ringo42. At any given quantity, the price given by the demand curve reflects the willingness to pay ofthe marginal buyer . Because the demand curve shows the buyers’ willingness to pay, we can use the demand curve to measure consumer surplus.Figure 1 “This represents the demand curve for the time machine. Consumer surplus is the difference between what consumers are willing to pay and the amount they actually have to pay. The market price will deter mine who uses the time machine and how much surplus they keep.”“If the price of a time machine ride was $500, three rides would be sold—one to Scott, one to Carol, and one to Steve. Jeanne is not willing to pay $500, so she wouldn’t time travel.”“We c an calculate the consumer surplus of three time trips. Scott would pay $3,000 but only pays $500, leaving $2,500 of net benefits.” (Put these numbers on the board.) “Carol has net benefits of $2,000. Steve has $300 in net benefits. Adding up these net savings gives $4,800 in consumer surplus.”Points for DiscussionThe consumer surplus depends on a good’s selling price and the number of consumers who are willing to purchase the good at that price. The lower the price, the greater the consumer surplus.3. Consumer surplus can be measured as the area below the demand curve and above the price. C. How a Lower Price Raises Consumer Surplus1. As price falls, consumer surplus increases for two reasons.a. Those already buying the product will receive additional consumer surplus because theyare paying less for the product than before (area A on the graph).b. Because the price is now lower, some new buyers will enter the market and receiveconsumer surplus on these additional units of output purchased (area B on the graph).D. What Does Consumer Surplus Measure?1. Remember that consumer surplus is the difference between the amount that buyers arewilling to pay for a good and the price that they actually pay.2. Thus, it measures the benefit that consumers receive from the good as the buyersthemselves perceive it.Figure 2Figure 3It is important to stress that consumer surplus is measured in monetary terms. Consumer surplus gives us a way to place a monetary cost on inefficient market outcomes (due to government involvement or market failure).III. Producer SurplusA. Cost and the Willingness to Sell1. Definition of cost: the value of everything a seller must give up to produce a good .2. Example: You want to hire someone to paint your house. You accept bids for the work fromfour sellers. Each painter is willing to work if the price you will pay exceeds her opportunity cost. (Note that this opportunity cost thus represents willingness to sell.) The costs are:3. Bidding will stop when the price gets to be slightly below $600. All sellers will drop out exceptfor Grandma. Because Grandma receives more than she would require to paint the house, she derives some benefit from producing in the market.4. Definition of producer surplus: the amount a seller is paid for a good minus theseller’s cost of providing it.5. Note that if you had more than one house to paint, the price in the auction would end upbeing higher (a little under $800 in the case of two houses) and both Grandma and Georgia would gain producer surplus.ALTERNATIVE CLASSROOM EXAMPLE:Review the material on price ceilings from Chapter 6. Redraw the market for two-bedroom apartments in your town. Draw in a price ceiling below the equilibrium price.Then go through:▪ consumer surplus before the price ceiling is put into place. ▪ consumer surplus after the price ceiling is put into place.B. Using the Supply Curve to Measure Producer Surplus1. We can use the information on cost (willingness to sell) to derive a supply curve for housepainting services.Price Sellers Quantity Supplied$900 or more Mary, Frida, Georgia, Grandma 4$800 to $900 Frida, Georgia, Grandma 3$600 to $800 Georgia, Grandma 2$500 to $600 Grandma 1less than $500 None 02. At any given quantity, the price given by the supply curve represents the cost of the marginalseller. Because the supply curve shows the sellers’ cost (willingness to sell), we can use the supply curve to measure producer surplus.3. Producer surplus can be measured as the area above the supply curve and below the price. Figure 4Figure 5C. How a Higher Price Raises Producer Surplus1. As price rises, producer surplus increases for two reasons.a. Those already selling the product will receive additional producer surplus because theyare receiving more for the product than before (area C on the graph).b. Because the price is now higher, some new sellers will enter the market and receiveproducer surplus on these additional units of output sold (area D on the graph).D. Producer surplus is used to measure the economic well-being of producers, much like consumersurplus is used to measure the economic well-being of consumers.Figure 6ALTERNATIVE CLASSROOM EXAMPLE:Review the material on price floors from Chapter 6. Redraw the market for an agriculturalproduct such as corn. Draw in a price support above the equilibrium price.Then go through:▪ producer surplus before the price support is put in place.▪ producer surplus after the price support is put in place.Make sure that you discuss the cost of the price support to taxpayers.Pretty Woman, Chapter 6. Vivien (Julia Roberts) and Edward (Richard Gere)negotiate a price. Afterward, Vivien reveals she would have accepted a lower price,while Edward admits he would have paid more. If you have done a good job ofintroducing consumer and producer surplus, you will see the light bulbs go off aboveyour students’ heads as they watch this clip.IV. Market EfficiencyA. The Benevolent Social Planner1. The economic well-being of everyone in society can be measured by total surplus, which isthe sum of consumer surplus and producer surplus:Total Surplus = Consumer Surplus + Producer SurplusTotal Surplus = (Value to Buyers – Amount Paid by Buyers) + (Amount Received by Sellers – Cost to Sellers)Because the Amount Paid by Buyers = Amount Received by Sellers:2. Definition ofefficiency: the property of a resource allocation of maximizing thetotal surplus received by all members of society .3. Definition of equality: the property of distributing economic prosperity uniformlythe members of society .B. Evaluating the Market EquilibriumTotal Surplus = Value to Buyers Cost to Sellers Figure 7Now might be a good time to point out that many government policies involve atrade-off between efficiency and equity. When you evaluate government policies, like price ceilings or floors, you can explain them in terms of equity and efficiency.1. At the market equilibrium price:a. Buyers who value the product more than the equilibrium price will purchase the product;those who do not, will not purchase the product. In other words, the free marketallocates the supply of a good to the buyers who value it most highly, as measured bytheir willingness to pay.b. Sellers whose costs are lower than the equilibrium price will produce the product; thosewhose costs are higher, will not produce the product. In other words, the free marketallocates the demand for goods to the sellers who can produce it at the lowest cost.2. Total surplus is maximized at the market equilibrium.Figure 8a. At any quantity of output smaller than the equilibrium quantity, the value of the productto the marginal buyer is greater than the cost to the marginal seller so total surpluswould rise if output increases.b. At any quantity of output greater than the equilibrium quantity, the value of the productto the marginal buyer is less than the cost to the marginal seller so total surplus wouldrise if output decreases.3. Note that this is one of the reasons that economists believe Principle #6: Markets are usuallya good way to organize economic activity.It would be a good idea to remind students that there are circumstances when themarket process does not lead to the most efficient outcome. Examples includesituations such as when a firm (or buyer) has market power over price or when thereare externalities present. These situations will be discussed in later chapters.C. In the News: Ticket Scalping1. Ticket scalping is an example of how markets work to achieve an efficient outcome.2. This article from The Boston Globe descri bes economist Chip Case’s experience with ticketscalping.D. Case Study: Should There Be a Market in Organs?1. As a matter of public policy, people are not allowed to sell their organs.a. In essence, this means that there is a price ceiling on organs of $0.b. This has led to a shortage of organs.2. The creation of a market for organs would lead to a more efficient allocation of resources,but critics worry about the equity of a market system for organs.V. Market Efficiency and Market FailureA. To conclude that markets are efficient, we made several assumptions about how markets worked.1. Perfectly competitive markets.2. No externalities.B. When these assumptions do not hold, the market equilibrium may not be efficient.C. When markets fail, public policy can potentially remedy the situation.SOLUTIONS TO TEXT PROBLEMS:Quick Quizzes1. Figure 1 shows the demand curve for turkey. The price of turkey is P1 and the consumersurplus that results from that price is denoted CS. Consumer surplus is the amount a buyer iswilling to pay for a good minus the amount the buyer actually pays for it. It measures thebenefit to buyers of participating in a market.Figure 1 Figure 22. Figure 2 shows the supply curve for turkey. The price of turkey is P1 and the producersurplus that results from that price is denoted PS. Producer surplus is the amount sellers arepaid for a good minus the sellers’ cost of providing it (measured by the supply curve). Itmeasures the benefit to sellers of participating in a market.Figure 33. Figure 3 shows the supply and demand for turkey. The price of turkey is P1, consumersurplus is CS, and producer surplus is PS. Producing more turkeys than the equilibriumquantity would lower total surplus because the value to the marginal buyer would be lowerthan the cost to the marginal seller on those additional units.Questions for Review1. The price a buyer is willing to pay, consumer surplus, and the demand curve are all closelyrelated. The height of the demand curve represents the willingness to pay of the buyers.Consumer surplus is the area below the demand curve and above the price, which equals theprice that each buyer is willing to pay minus the price actually paid.2. Sellers' costs, producer surplus, and the supply curve are all closely related. The height of thesupply curve represents the costs of the sellers. Producer surplus is the area below the priceand above the supply curve, which equals the price received minus each seller's costs ofproducing the good.Figure 43. Figure 4 shows producer and consumer surplus in a supply-and-demand diagram.4. An allocation of resources is efficient if it maximizes total surplus, the sum of consumersurplus and producer surplus. But efficiency may not be the only goal of economicpolicymakers; they may also be concerned about equity the fairness of the distribution ofwell-being.5. The invisible hand of the marketplace guides the self-interest of buyers and sellers intopromoting general economic well-being. Despite decentralized decision making and self-interested decision makers, free markets often lead to an efficient outcome.6. Two types of market failure are market power and externalities. Market power may causemarket outcomes to be inefficient because firms may cause price and quantity to differ fromthe levels they would be under perfect competition, which keeps total surplus from beingmaximized. Externalities are side effects that are not taken into account by buyers and sellers.As a result, the free market does not maximize total surplus.Problems and Applications1. a. Consumer surplus is equal to willingness to pay minus the price paid. Therefore,Melissa’s willingness to pay must be $200 ($120 + $80).b. Her consumer surplus at a price of $90 would be $200 − $90 = $110.c. If the price of an iPod was $250, Melissa would not have purchased one because theprice is greater than her willingness to pay. Therefore, she would receive no consumersurplus.2. If an early freeze in California sours the lemon crop, the supply curve for lemons shifts to theleft, as shown in Figure 5. The result is a rise in the price of lemons and a decline inconsumer surplus from A + B + C to just A. So consumer surplus declines by the amount B +C.Figure 5 Figure 6In the market for lemonade, the higher cost of lemons reduces the supply of lemonade, asshown in Figure 6. The result is a rise in the price of lemonade and a decline in consumersurplus from D + E + F to just D, a loss of E + F. Note that an event that affects consumersurplus in one market often has effects on consumer surplus in other markets.3. A rise in the demand for French bread leads to an increase in producer surplus in the marketfor French bread, as shown in Figure 7. The shift of the demand curve leads to an increased price, which increases producer surplus from area A to area A + B + C.Figure 7The increased quantity of French bread being sold increases the demand for flour, as shown in Figure 8. As a result, the price of flour rises, increasing producer surplus from area D to D + E + F. Note that an event that affects producer surplus in one market leads to effects on producer surplus in related markets.Figure 84. a. Bert’s demand schedule is:Price Quantity DemandedMore than $7 0$5 to $7 1$3 to $5 2$1 to $3 3$1 or less 4Bert’s demand curve is shown in Figure 9.Figure 9b. When the price of a bottle of water is $4, Bert buys two bottles of water. His consumersurplus is shown as area A in the figure. He values his first bottle of water at $7, butpays only $4 for it, so has consumer surplus of $3. He values his second bottle of water at $5, but pays only $4 for it, so has consumer surplus of $1. Thus Bert’s total consumer surplus is $3 + $1 = $4, which is the area of A in the figure.c. When the price of a bottle of water falls from $4 to $2, Bert buys three bottles of water,an increase of one. His consumer surplus consists of both areas A and B in the figure, an increase in the amount of area B. He gets consumer surplus of $5 from the first bottle($7 value minus $2 price), $3 from the second bottle ($5 value minus $2 price), and $1 from the third bottle ($3 value minus $2 price), for a total consumer surplus of $9. Thus consumer surplus rises by $5 (which is the size of area B) when the price of a bottle ofwater falls from $4 to $2.5. a. Ernie’s supply schedule for water is:Price Quantity SuppliedMore than $7 4$5 to $7 3$3 to $5 2$1 to $3 1Less than $1 0Ernie’s supply curve is shown in Figure 10.Figure 10b. When the price of a bottle of water is $4, Ernie sells two bottles of water. His producersurplus is shown as area A in the figure. He receives $4 for his first bottle of water, but itcosts only $1 to produce, so Ernie has producer surplus of $3. He also receives $4 for his second bottle of water, which costs $3 to produce, so he has producer surplus of $1.Thus Ernie’s total producer surplus is $3 + $1 = $4, which is the area of A in the figure.c. When the price of a bottle of water rises from $4 to $6, Ernie sells three bottles of water,an increase of one. His producer surplus consists of both areas A and B in the figure, anincrease by the amount of area B. He gets producer surplus of $5 from the first bottle($6 price minus $1 cost), $3 from the second bottle ($6 price minus $3 cost), and $1from the third bottle ($6 price minus $5 price), for a total producer surplus of $9. Thusproducer surplus rises by $5 (which is the size of area B) when the price of a bottle ofwater rises from $4 to $6.6. a. From Ernie’s supply schedule and Bert’s demand schedule, the quantity demanded andsupplied are:Price Quantity Supplied Quantity Demanded$2 1 3$4 2 2$6 3 1Only a price of $4 brings supply and demand into equilibrium, with an equilibriumquantity of two.b. At a price of $4, consumer surplus is $4 and producer surplus is $4, as shown inProblems 3 and 4 above. Total surplus is $4 + $4 = $8.c. If Ernie produced one less bottle, his producer surplus would decline to $3, as shown inProblem 4 above. If Bert consumed one less bottle, his consumer surplus would declineto $3, as shown in Problem 3 above. So total surplus would decline to $3 + $3 = $6.d. If Ernie produced one additional bottle of water, his cost would be $5, but the price isonly $4, so his producer surplus would decline by $1. If Bert consumed one additionalbottle of water, his value would be $3, but the price is $4, so his consumer surplus would decline by $1. So total surplus declines by $1 + $1 = $2.7. a. The effect of falling production costs in the market for stereos results in a shift to theright in the supply curve, as shown in Figure 11. As a result, the equilibrium price ofstereos declines and the equilibrium quantity increases.Figure 11b. The decline in the price of stereos increases consumer surplus from area A to A + B + C+ D, an increase in the amount B + C + D. Prior to the shift in supply, producer surpluswas areas B + E (the area above the supply curve and below the price). After the shift in supply, producer surplus is areas E + F + G. So producer surplus changes by the amountF +G – B, which may be positive or negative. The increase in quantity increasesproducer surplus, while the decline in the price reduces producer surplus. Becauseconsumer surplus rises by B + C + D and producer surplus rises by F + G – B, totalsurplus rises by C + D + F + G.c. If the supply of stereos is very elastic, then the shift of the supply curve benefitsconsumers most. To take the most dramatic case, suppose the supply curve werehorizontal, as shown in Figure 12. Then there is no producer surplus at all. Consumerscapture all the benefits of falling production costs, with consumer surplus rising fromarea A to area A + B.Figure 128. Figure 13 shows supply and demand curves for haircuts. Supply equals demand at a quantityof three haircuts and a price between $4 and $5. Firms A, C, and D should cut the hair of Ellen, Jerry, and Phil. Oprah’s willingness to pay is too low and firm B’s costs are too high, so they do not participate. The maximum total surplus is the area between the demand and supply curves, which totals $11 ($8 value minus $2 cost for the first haircut, plus $7 value minus $3 cost for the second, plus $5 value minus $4 cost for the third).Figure 139. a. The effect of falling production costs in the market for computers results in a shift to theright in the supply curve, as shown in Figure 14. As a result, the equilibrium price ofcomputers declines and the equilibrium quantity increases. The decline in the price ofcomputers increases consumer surplus from area A to A + B + C + D, an increase in the amount B + C + D.Figure 14 Figure 15Prior to the shift in supply, producer surplus was areas B + E (the area above the supply curve and below the price). After the shift in supply, producer surplus is areas E + F + G.So producer surplus changes by the amount F + G – B, which may be positive ornegative. The increase in quantity increases producer surplus, while the decline in theprice reduces producer surplus. Because consumer surplus rises by B + C + D andproducer surplus rises by F + G – B, total surplus rises by C + D + F + G.b. Because typewriters are substitutes for computers, the decline in the price of computersmeans that people substitute computers for typewriters, shifting the demand fortypewriters to the left, as shown in Figure 15. The result is a decline in both theequilibrium price and equilibrium quantity of typewriters. Consumer surplus in thetypewriter market changes from area A + B to A + C, a net change of C – B. Producersurplus changes from area C + D + E to area E, a net loss of C + D. Typewriterproducers are sad about technological advances in computers because their producersurplus declines.c. Because software and computers are complements, the decline in the price and increasein the quantity of computers means that the demand for software increases, shifting the demand for software to the right, as shown in Figure 16. The result is an increase in both the price and quantity of software. Consumer surplus in the software market changesfrom B + C to A + B, a net change of A – C. Producer surplus changes from E to C + D + E, an increase of C + D, so software producers should be happy about the technological progress in computers.Figure 16d. Yes, this analysis helps explain why Bill Gates is one the world’s richest people, becausehis company produces a lot of software that is a complement with computers and therehas been tremendous technological advance in computers.10. a. With Provider A, the cost of an extra minute is $0. With Provider B, the cost of an extraminute is $1.b. With Provider A, my friend will purchase 150 minutes [= 150 – (50)(0)]. With Provider B,my friend would purchase 100 minutes [= 150 – (50)(1)].c. With Provider A, he would pay $120. The cost would be $100 with Provider B.Figure 17d. Figure 17 shows the friend’s demand. With Provider A, he buys 150 minu tes and hisconsumer surplus is equal to (1/2)(3)(150) – 120 = 105. With Provider B, his consumersurplus is equal to (1/2)(2)(100) = 100.e. I would recommend Provider A because he receives greater consumer surplus.11. a. Figure 18 illustrates the demand for medical care. If each procedure has a price of $100,quantity demanded will be Q1 procedures.Figure 18b. If consumers pay only $20 per procedure, the quantity demanded will be Q2 procedures.Because the cost to society is $100, the number of procedures performed is too large to maximize total surplus. The quantity that maximizes total surplus is Q1 procedures, which is less than Q2.c. The use of medical care is excessive in the sense that consumers get procedures whosevalue is less than t he cost of producing them. As a result, the economy’s total surplus is reduced.d. To prevent this excessive use, the consumer must bear the marginal cost of theprocedure. But this would require eliminating insurance. Another possibility would be that the insurance company, which pays most of the marginal cost of the procedure ($80, in this case) could decide whether the procedure should be performed. But the insurance company does not get the benefits of the procedure, so its decisions may not reflect the value to the consumer.。
第7-9章 微观经济学习题答案

第7章生产理论习题答案1.名词解释生产函数:在一定时间范围内和生产技术水平不变的情况下,各种生产要素数量组合与其所能生产的最大产量之间的关系。
边际报酬递减规律:在技术水平不变的条件下,把某一种可变生产要素增加到其他一种或几种数量不变的生产要素上去的过程中,当该生产要素的投入数量增加到一定程度以后,单位生产要素投入增加所带来的边际产量终会出现递减。
边际技术替代率:在维持产量水平不变的条件下,增加一单位某种生产要素投入量时所减少的另一种要素的投入数量。
边际技术替代率是递减的,表示在保持产量不变的前提下,某要素投入量越少,越不容易被另外的要素所替代。
等产量曲线:是指在技术水平不变的条件下生产出相同产量的两种生产要素投入量的各种组合的轨迹。
等成本线:是指在既定的成本和既定生产要素价格条件下生产者可以购买到的两种生产要素的各种不同数量组合的轨迹。
规模报酬:分析的是企业的生产规模的改变与所引起的产量变化之间的关系。
如果因生产要素同比例增加而引起的产量增加的比例大于要素增加的比例,那么,生产呈现规模报酬递增;如果因生产要素同比例增加而引起的产量增加的比例等于要素增加的比例,那么生产呈现规模报酬不变;如果因生产要素同比例增加而引起的产量增加的比例小于要素增加的比例,那么生产则是规模报酬递减的。
2.单项选择(1)B、(2)C、(3)A、(4)A、(5)A 、(6)C、(7)D、(8)B、(9)B、(10)D、(11)A、(12)B、(13)D、(14)A、(15)C。
3.多项选择 (1)ABCE; (2)ABCDE; (3)BD; (4)BCD; (5)ABC;4.简答题(1)一个企业主在考虑再雇佣一名工人时,在劳动的平均产量和边际产量中他将更关心劳动的边际产量。
我们知道,厂商的理性决策在劳动的第二阶段。
在这个区域中,劳动的平均产量及边际产量都是递减的,但其中却可能存在着使利润极大化的点,劳动的第二阶段的右界点是使劳动的边际产量为零的点。
高鸿业微观经济学(第5版)课后习题答案 第七章

第七章不完全竞争的市场1. 根据图7—1(即教材第205页的图7—18)中线性需求曲线d和相应的边际收益曲线MR,试求:图7—1(1)A点所对应的MR值;(2)B点所对应的MR值。
解答:(1)根据需求的价格点弹性的几何意义,可得A点的需求的价格弹性为e d=eq \f(15-5,5)=2或者e d=eq \f(2,3-2)=2再根据公式MR=P eq \b\lc\(\rc\)(\a\vs4\al\co1(1-\f(1,e d))),则A点的MR值为MR=2×eq \b\lc\(\rc\)(\a\vs4\al\co1(1-\f(1,2)))=1(2)与(1)类似,根据需求的价格点弹性的几何意义,可得B点的需求的价格弹性为e d=eq \f(15-10,10)=eq \f(1,2)或者e d=eq \f(1,3-1)=eq \f(1,2)再根据公式MR=P eq \b\lc\(\rc\)(\a\vs4\al\co1(1-\f(1,e d))),则B点的MR值为MR=1×eq \b\lc\(\rc\)(\a\vs4\al\co1(1-\f(1,1/2)))=-12. 图7—2(即教材第205页的图7—19)是某垄断厂商的长期成本曲线、需求曲线和收益曲线。
试在图中标出:(1)长期均衡点及相应的均衡价格和均衡产量;(2)长期均衡时代表最优生产规模的SAC曲线和SMC曲线;(3)长期均衡时的利润量。
图7—2解答:本题的作图结果如图7—3所示:图7—3(1)长期均衡点为E点,因为在E点有MR=LMC。
由E点出发,均衡价格为P0,均衡数量为Q0。
(2)长期均衡时代表最优生产规模的SAC曲线和SMC曲线如图7—3所示。
在Q0的产量上,SAC曲线和LAC曲线相切;SMC曲线和LMC曲线相交,且同时与MR曲线相交。
(3)长期均衡时的利润量由图7—3中阴影部分的面积表示,即π=[AR(Q0)-SAC(Q0)]·Q 0。
《微观经济学》课后练习题参考答案7
《微观经济学》课后练习题参考答案7第七章不完全竞争的市场一.选择题1.C11.D21.D2.B12.B22.B3.B13.A23.D4.B14.D24.D5.D15.C25.D6.A16 .B26.C7.C17.B27.C8.D18.B28.B9.A19.A29.A10.C20.B30.C二.名词解释1.垄断:是指一个厂商独占市场控制整个市场的产品的供给和产品的市场价格以攫取最大的利润。
2.自然垄断:所谓自然垄断,就是行业存在规模报酬递增,产量越多平均成本越低,使得一般厂商无法与一个超大规模的厂商竞争,从而形成的垄断。
3.垄断势力:又称垄断势力,指垄断厂商对价格的控制程度,一般用P—MC来测量。
4.价格歧视:所谓价格歧视,是指完全垄断厂商对不同的消费者,或对同一消费者不同的购买量,分别以不同的价格销售。
5.寡头垄断:寡头垄断是指少数几家厂商控制某一市场的产品供给及销售价格的一种市场组织。
在这种市场组织中,每一厂商都必须考虑它的对手对它的行动做出的反应。
6.垄断竞争:所谓“垄断竞争”,就是指有许多厂商在市场中销售近似但不相同的产品。
厂商对市场略有影响。
7.多余的生产能力:经济学家一般把完全竞争企业在长期平均成本LAC最低点上的产量称为理想的产量,把实际产量与理想产量之间的差额称作为多余的生产能力。
8.消费者剩余:就是消费者对一定量的商品或劳务最多愿意支付的价钱与实际支付的价钱之差,是对消费者从交易中所得利益的一种货币度量。
9产品变异:产品变异指变换产品的颜色、款式、质地、做工和附带的服务等来改变原有的产品,以形成产品差异,影响市场均衡。
10.拐折(弯折)需求曲线:根据寡头垄断厂商推测其他寡头跟跌不跟涨的假定,得出自己产品的需求曲线在开始的市场价格处形成拐折点,拐折点之上的需求曲线段比较平坦,拐折点之下的需求曲线段比较陡峭。
三.问答题1.在不完全竞争市场的产品市场中,厂商的需求曲线向右下方倾斜,试说明MR与P的差距会随着产量Q的增加而越来越大。
平狄克《微观经济学》(第7版)习题详解(第7章 生成成本)

平狄克《微观经济学》(第7版)第7章生产成本课后复习题详解跨考网独家整理最全经济学考研真题,经济学考研课后习题解析资料库,您可以在这里查阅历年经济学考研真题,经济学考研课后习题,经济学考研参考书等内容,更有跨考考研历年辅导的经济学学哥学姐的经济学考研经验,从前辈中获得的经验对初学者来说是宝贵的财富,这或许能帮你少走弯路,躲开一些陷阱。
以下内容为跨考网独家整理,如您还需更多考研资料,可选择经济学一对一在线咨询进行咨询。
1.某公司支付给会计人员10000美元的年薪,这笔费用是一项经济成本吗?答:这笔费用是一项经济成本。
经济成本是显性成本和隐性成本之和。
显性成本指实际支出,所有涉及到货币交易行为的成本都属于显性成本。
隐性成本是一种经济成本,不涉及到货币交易行为,但涉及到生产中所使用的资源的成本。
当一个公司支付给会计人员10000美元年薪时,这是一笔货币交易,这笔费用是会计人员用劳动换来的收入。
因此,这笔费用属于经济成本中的显性成本。
2.某小零售店女店主自己做账,你将如何计算她工作的机会成本?答:该店主自己做账的机会成本是:她利用做账的时间和精力做其他事情时所能获得的最大收入。
根据机会成本的定义,如果该小零售店女店主不是自己做账,她可以在这段时间里做其他的事情,例如做小生意或者参加一些休闲活动。
那么,女店主自己做账的机会成本就是她用于做账的时间做其他事情时所能获得的最大收入。
3.解释以下说法正确与否:(1)如果一家企业的拥有者不给自己支付工资,则会计成本为零,而经济成本为正。
(2)会计利润为正的企业不一定经济利润也为正。
(3)企业雇佣了一些目前处于失业状态的工人,则其使用这些工人服务的机会成本为零。
答:(1)正确。
因为这里不存在货币交易,所以不存在会计成本(或显性成本)。
但是,因为企业的拥有者可以受雇于其他企业,因而存在经济成本。
经济成本为正,反映了此人工作时间的机会成本。
(2)正确。
会计利润仅考虑显性成本。
《微观经济学》(刘天祥版)第七章参考答案

《微观经济学》第七章参考答案一、略二、选择题CBDDC CABDD BB1、C.2、B.3、D.完全垄断厂商无论是短期还是长期,其均衡时的产量都是由MR=MC决定的。
4、D.5、C.6、C.7、A.8、B.完全垄断厂商实行价格歧视是在需求价格弹性小的市场上提高价格,而在需求价格弹性大的市场上降低价格。
9、D. 垄断势力的存在使厂商可以维持低产高价,从而使资源配置无效率。
10、B11、B.由于总收益下降,则边际收益为负。
且11d MR PE⎛⎫=-⎪⎝⎭12、B.由11dMR PE⎛⎫=-⎪⎝⎭,可知,当1dE=时,MR=0,所以此时总收益最大。
三、判断题√×√√√√××1、√。
对于垄断厂商有P=AR为需求曲线,而边际收益曲线MR总是位于需求曲线的下方。
2、×。
垄断厂商没有确定的供给曲线。
3、√。
一级价格歧视下,虽然所有的消费者剩余都被厂商剥夺了,但是其均衡的价格和产量与完全竞争下的均衡价格和产量一样,所以其资源配置是有效率的。
4、√5、√6、√7、×。
垄断竞争厂商的边际收益曲线是根据其相应的主观需求曲线得到的。
8、×。
短期内垄断厂商既可能获得经济利润也可能经济利润为0,还可能出现亏损。
四、计算题1、总利润最大化条件为:MC=MR;已知需求函数P=12-0.4Q可推知:MR=12-0.8Q;又有TC函数可以推知:MC=1.2Q+4;利润最大化,即1.2Q+4=12-0.8Q ,可得Q=4;将Q=4代入P=12-0.4Q ,得P=10.4;总收益:TR=P*Q=10.4×4=41.6;总利润:π=TR -TC=11;2、(1)垄断厂商利润最大化:MR=MC ,已知TC 可得MC=Q+10;又TR=(90-0.5Q )Q 可得MR=90-Q ;于是:MR=MC 即Q+10=90-Q ,解之Q=40;将Q=40带入需求函数,解之P=70;利润π=TR -TC=1600(2)当P=55时,即90-0.5Q=55 得,Q=70;当Q=70时,TC=3150;TR=P*Q=3850π=TR -TC=700;(3)假设国家最高限价P=50,这实际上是对垄断厂商采取了边际成本定价的原则即P=MC ;此时厂商提供的产量为Q=40;厂商的利润为π=TR -TC=800;然而此时市场的需求根据需求函数计算得Q=80,故会出现市场供不应求的局面。
蔡继明微观经济学习题第7章
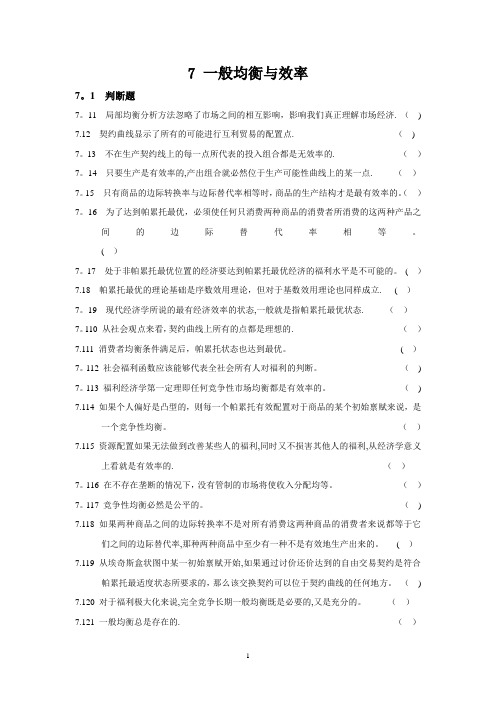
7 一般均衡与效率7。
1 判断题7。
11 局部均衡分析方法忽略了市场之间的相互影响,影响我们真正理解市场经济. () 7.12 契约曲线显示了所有的可能进行互利贸易的配置点. () 7。
13 不在生产契约线上的每一点所代表的投入组合都是无效率的. ()7。
14 只要生产是有效率的,产出组合就必然位于生产可能性曲线上的某一点. ()7。
15 只有商品的边际转换率与边际替代率相等时,商品的生产结构才是最有效率的。
()7。
16 为了达到帕累托最优,必须使任何只消费两种商品的消费者所消费的这两种产品之间的边际替代率相等。
( )7。
17 处于非帕累托最优位置的经济要达到帕累托最优经济的福利水平是不可能的。
( )7.18 帕累托最优的理论基础是序数效用理论,但对于基数效用理论也同样成立. ( )7。
19 现代经济学所说的最有经济效率的状态,一般就是指帕累托最优状态. ()7。
110 从社会观点来看,契约曲线上所有的点都是理想的. ()7.111 消费者均衡条件满足后,帕累托状态也达到最优。
( )7。
112 社会福利函数应该能够代表全社会所有人对福利的判断。
() 7。
113 福利经济学第一定理即任何竞争性市场均衡都是有效率的。
() 7.114 如果个人偏好是凸型的,则每一个帕累托有效配置对于商品的某个初始禀赋来说,是一个竞争性均衡。
()7.115 资源配置如果无法做到改善某些人的福利,同时又不损害其他人的福利,从经济学意义上看就是有效率的. ()7。
116 在不存在垄断的情况下,没有管制的市场将使收入分配均等。
()7。
117 竞争性均衡必然是公平的。
() 7.118 如果两种商品之间的边际转换率不是对所有消费这两种商品的消费者来说都等于它们之间的边际替代率,那种两种商品中至少有一种不是有效地生产出来的。
( )7.119 从埃奇斯盒状图中某一初始禀赋开始,如果通过讨价还价达到的自由交易契约是符合帕累托最适度状态所要求的,那么该交换契约可以位于契约曲线的任何地方。
- 1、下载文档前请自行甄别文档内容的完整性,平台不提供额外的编辑、内容补充、找答案等附加服务。
- 2、"仅部分预览"的文档,不可在线预览部分如存在完整性等问题,可反馈申请退款(可完整预览的文档不适用该条件!)。
- 3、如文档侵犯您的权益,请联系客服反馈,我们会尽快为您处理(人工客服工作时间:9:00-18:30)。
微观经济学综合习题一第7章不完全竞争市场练习题1.下列各项中,错误的是()A. 垄断厂商的平均收益曲线与需求曲线相重合B. 垄断厂商的边际收益曲线的斜率大于平均收益曲线的斜率C. 垄断厂商的边际收益大于平均收益D. 垄断厂商的边际收益小于平均收益2.在垄断厂商的短期均衡时,垄断厂商可以()A. 亏损B. 利润为零C. 盈利D. 上述情况都可能存在3.弯折的需求曲线模型的假设条件是()A. 行业内寡头厂商们之间是有勾结的B. 行业内某寡头厂商提价时,其他寡头厂商都会仿效C. 行业内某寡头厂商降价时,其他寡头厂商都会仿效D. 厂商可以任意进出市场4.垄断厂商的平均收益曲线与边际收益曲线均为直线时,平均收益曲线在Q轴上的截距是边际收益曲线在Q轴上的截距的()A. 一倍B. 两倍C. 一半D. 四倍5.当垄断厂商的长期均衡产量上,可以有()A. P大于LACB. P小于LACC. P等于最小的LACD. 以上情况都可能存在6.古诺模型达到均衡时,两厂商所占的市场份额为()A. 1/2,1/2B. 1/3,1/3C. 1/3,2/3D. 3/5,2/57.如果在需求曲线某一点上的需求价格弹性e d=5,商品的价格P=6,则相应的边际收益MR为()A. 7.5B. 24C. 1D. 4.88.古诺模型中,厂商以()为目的A. 减少成本B. 利润最大化C. 价格稳定D. 扩大市场占有9.垄断竞争市场上厂商的短期均衡发生于()A. 边际成本等于D需求曲线中产生的边际收益时B. 平均成本下降时C. d需求曲线与平均成本曲线相切时D. D需求曲线与d需求曲线相交,并有边际成本等于d需求曲线中产生的边际收益时10.当垄断市场的需求缺乏弹性时,MR为()A. 负值B. 0C. 1D. 正值答案:C、D、C、B、A、B、D、B、D、A微观经济学综合习题二第七章不完全竞争的市场一、名词解释不完全竞争市场垄断市场生产集团理想的产量多余的生产能力寡头市场二、填空题1.如果需求曲线上某一点的需求的价格弹性e d=5,商品的价格P=6,则相应的边际收益MR=()。
2.不完全竞争市场分为三个类型,它们是()市场、()市场和()市场。
3.在不完全竞争条件下,当商品的需求弹性大于1时,厂商的总收益与商品的销售量呈()方向变动;当商品的需求弹性小于1时,厂商的总收益与商品的销售量呈()方向变动。
4.在垄断竞争理论中,把市场上大量的生产非常接近的同种产品的厂商的总和称作为()。
5.关于d需求曲线和D需求曲线的一般关系:如果市场价格下跌,则d需求曲线沿D需求曲线向()平移;如果市场价格上升,则d需求曲线沿D需求曲线向()平移;d需求曲线和D需求曲线相交意味着垄断竞争市场的()状态;而且d需求曲线的弹性()D需求曲线。
6.西方经济学家一般把()与()之间的差额称作为多余的生产能力。
7.根据产品特征,寡头行业可以分为()行业和()行业两类。
8.西方经济学家认为,一个行业在长期均衡时是否实现了(),是判断该行业是否实现了有效的资源配置的一个条件。
三、单项选择题1.在西方经济学中,()市场模型通常被用来作为判断其它类型市场的经济效率高低的标准。
A.完全竞争;B.垄断竞争;C.垄断;D.寡头。
2.垄断条件下,当商品的需求的价格弹性小于1时,厂商的边际收益()。
A.大于0;B.大于1;C.小于0;D.小于1。
3.经济学家一般把()企业在LAC最低点上的产量称作理想的产量。
A.垄断;B.垄断竞争;C.完全竞争;D.寡头。
4.垄断利润属于( )。
A.经济成本;B.正常利润;C.经济利润;D.隐成本。
5.()厂商所面临的需求曲线有两种,它们通常被区分为d需求曲线和D需求曲线。
A.完全竞争;B.垄断竞争;C.垄断;D.寡头。
6.当一个行业由竞争演变成垄断行业时,则()。
A.垄断市场的价格等于竞争市场的价格;B.垄断市场的价格大于竞争市场的价格;C.垄断市场的价格小于竞争市场的价格;D.垄断价格具有任意性。
7.在一种只有固定成本的生产活动中,四个寡头厂商面临的市场需求曲线为P=100-Q,在古诺模型的条件下,每个厂商实现最大利润,那么,下面论述正确的是(B)。
A.每个厂商生产25单位产品;B.市场价格为P=20;C.行业供给量为60单位;D.以上均不对。
8.在垄断厂商的长期均衡产量上可以有()。
A.P>LAC;B.P<LAC;C.P等于最小的LAC;D.P等于最小的LMC。
四、多项选择题1.在垄断厂商的短期均衡时,垄断厂商()。
A.可能亏损;B.不可能亏损;C.可能获利;D.可能利润为零。
2.具有()特点的市场是完全垄断市场。
A.没有相近的替代品;B.完全信息;C.一个卖者;D.高进入壁垒。
3.造成垄断厂商短期亏损的原因可能是()。
A.既定的生产规模过大;B.既定的生产规模成本过高;C.厂商所面临的市场需求过小;D.市场竞争太强。
4.在现实生活中,通常存在的市场类型有()。
A.完全竞争市场;B.垄断竞争市场;C.垄断市场;D.寡头市场。
5.古诺模型假定()。
A.行业中只有两个厂商;B.生产成本为零;C.每个厂商都假定另一个厂商的价格不变;D.每个厂商都假定另一个厂商的产出数量不变。
五、判断题1.垄断厂商在短期均衡点上总能获得最大利润。
2.市场的竞争程度越高,则经济效率越高;市场的垄断程度越低,则经济效率越低。
3.垄断程度越高需求曲线越陡峭;垄断程度越低,需求曲线越平坦。
4.在垄断厂商的长期均衡时,垄断厂商可以亏损.可以利润为零,也可以盈利。
5.在西方经济学中,除完全竞争市场以外的带有一定垄断因素的市场都被称为不完全竞争市场。
6.垄断厂商可以控制和操纵市场价格。
7.如果垄断厂商在短期内获得利润,那么,在长期内他会保持利润的。
8.垄断厂商所面临的需求曲线就是市场的需求曲线。
9.凡是在或多或少的程度上带有垄断因素的不完全竞争市场中,是不存在带有规律性的厂商和行业的短期供给曲线的。
10.垄断厂商的平均收益、价格和边际收益随着商品销售量的增加而下降,但平均收益总是小于边际收益。
11.当垄断厂商所面临的向右下方倾斜的需求曲线d为直线型时,MR曲线也呈向右下方倾斜的直线型,d曲线和MR曲线在纵轴上的截距是相等的,d曲线在横轴上的截距是MR曲线在横轴上的截距的2倍。
12.如果垄断厂商在短期内获得利润,那么,他的利润在长期内会因新厂商的加入而消失。
13.垄断厂商在长期内通过对生产规模的调整一定能获得利润。
14.垄断竞争厂商长期均衡时的利润必定为零。
15.在垄断竞争厂商的长期均衡点上,D需求曲线必定与LAC曲线相切。
16.古诺模型用来解释一些寡头市场上的价格刚型现象。
17.在完全竞争市场,在厂商的长期均衡点上有P=LAC,它表明资源在该行业得到了有效的配置。
18.完全垄断都是不合理的。
19.完全垄断企业是价格的制定者,所以它能随心所欲地决定价格。
六、简答题1.用图说明为什么只有当MR=SMC时,垄断厂商才能实现最大利润?2.试述古诺模型的主要内容和结论。
3.说明与比较垄断市场与寡头市场形成的原因。
4.评述垄断竞争理论。
5.试述寡头垄断厂商的产量及价格决定。
6.利用弯折的需求曲线分析寡头垄断厂商的行为及其均衡。
7.假定一寡头垄断行业的厂商所面临的需求曲线的形状如图,图中P*为这个行业的均衡价格。
PAOP*Q*Q①判断是什么模型的行业;②为什么厂商认为A点的收益最高确定的价格为均衡价格?③为什么成本变化时厂商也不愿意改变商品的价格?七、计算题1.某垄断厂商的短期总成本函数为STC=0.1Q3-6Q2+140Q+3000,反需求函数为P=150-3. 25Q,求该厂商的短期均衡产量和均衡价格。
2.垄断厂商的总收益函数为TR=100Q-Q2,总成本函数为TC=10+6Q。
试求:①厂商利润最大化的产量和价格?②若政府征收10%的从价销售税,那么厂商的均衡产量和市场价格为多少?3.已知一垄断厂商的成本函数为TC=5Q2+20Q+10,产品的需求函数为Q=140-P。
试求:该厂商利润最大化的产量、价格及利润。
4.假定垄断厂商面临的需求函数和成本函数分别为P=100+4-3Q,TC=4Q2+10Q+A,式中:A为厂商的广告支出。
试求:该厂商利润最大化的A、Q和P各为多少?八、论述题。
画图说明垄断竞争厂商短期均衡的形成过程。
第七章参考答案一、名词解释(略)二、填空题1.(4.8)。
2.(垄断)、(寡头)(垄断竞争)。
3.(同)(反)。
4.(生产集团)。
5.(下)(上)(供求相等)(大于)。
6.(实际产量)(理想产量)。
7.(纯粹寡头)(差别寡头)。
8.(价格等于长期边际成本)。
三、单项选择题1.(A)2.(C)。
3.(C)4. (C)。
5.(B)6.(B)。
7.(B)。
8.(A)。
四、多项选择题1.(A C D)。
2.(ACD)。
3.(ABC)4.(BCD)。
5.(ABD)。
五、判断题1.(×)2.(×)3.(×)4.(×)5.(√)6.(√)7.(√)8.(√)9.(√)10.(×)11.(√)12.(×)13.(×)14.(√)15.(×)16.(×)17.(√)18.(×)19.(×)六、简答题1. (略)。
2. (略)。
3.(略)。
4.(略)。
5.(略)。
6.答:因为,只要MR>SMC,垄断厂商增加一单位产量所得到的收益增量就会大于所付出的成本增量。
这时,厂商增加产量是有利的。
随着产量的增加,如图所示,MR会下降,而SMC会上升,两者之间的差额会逐渐缩小,最后达到MR=SMC的均衡点,厂商也由此得到了增加产量的全部好处。
而MR<SMC时,情况正好与前面相反。
所以,垄断厂商的利润在MR=SMC处大最达值。
(图略)7.答:①是斯威齐模型。
②因为厂商认为,价格下降时需求是缺乏弹性的,因此降价不能带来好处。
而提价时需求又富有弹性,因此提价也不能带来好处。
只有在A点对应的价格水平下,厂商的收益最大。
③因为此时厂商所对应的边际收益曲线为间断的边际收益曲线(如图),因此价格具有刚性,所以,成本变化,厂商不愿意改变商品的价格。
七、计算题1.P=85;Q=20。
2.①.Q=47;P=53。
②.Q=46.7;P=48.45。
3.Q=10,P=130,π=590。
4.A=900;Q=15;P=175。
八、论述题。
(图略)说明:见上图,厂商最初处于A点,为取得利润最大化,依据MR1=MC,该垄断竞争厂商决定将生产由A点沿着d1需求曲线调整到B点,即将价格降低为P1,产量增加至Q1。
由于生产集团中每个厂商都将价格降至P1,使整个市场价格降至P1时,每个厂商的产量都只是Q2,而不是Q1。