中国城市建设统计年鉴4-2 按资金来源分全国历年城市市政公用设施建设固定资产投资(1978-2016
中国城市乡村建设统计年鉴数据:1-2-4 按资金来源分全国城市市政公用设施
北京 天津 河北 山西 内蒙古
Beijing Tianjin Hebei Shanxi Inner Mongolia
11573838 2909017 3707876 3464468 3307963
3369804 74138 17542 17295 72289
8204034 2834879 3690334 3447173 3235674
1836553 631979
2341766
345566 331859 177706
74908
2555327 166808 353428
1544431 418291
2330413 64143
114537 735178 815593Βιβλιοθήκη 北京 天津 河北 山西 内蒙古
21115 41830 25643
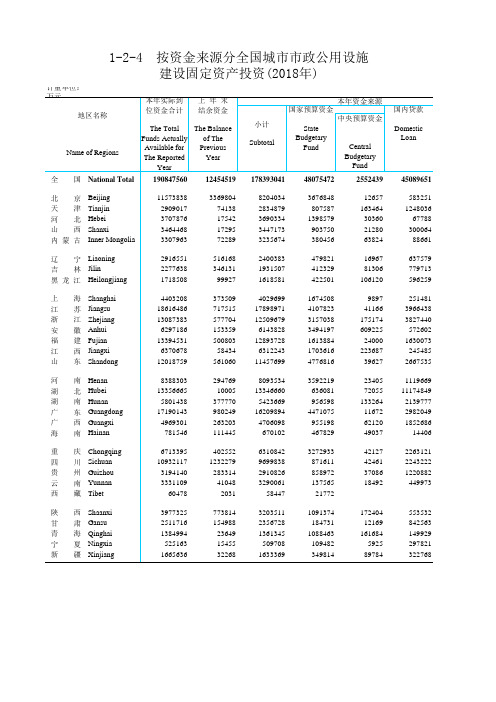
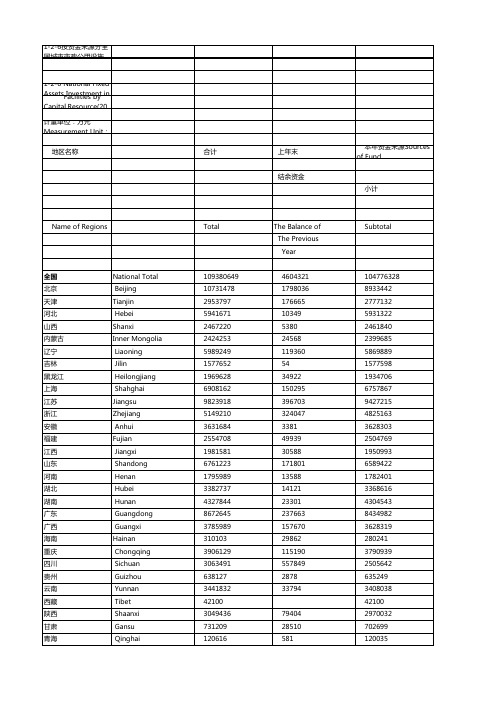
1-2-4 按资金来源分全国城市市政公用设施
建设固定资产投资(2018年)
计量单位: 万元
地区名称
Name of Regions
本年实际到 位资金合计
上年末 结余资金
The Total The Balance
Funds Actually of The
Available for Previous
The Reported
4403208 18616486 13087383
6297186 13394531
6370678 12018759
373509 717515 577704 153359 500803
58434 561060
4029699 17898971 12509679
6143828 12893728
6312243 11457699
中国城市建设统计年鉴2016
5.2 9.1 10.9 15.2 13.5
1175.8 1212.3 1367.0 1642.9 2004.8
1.4 3.1 12.8 20.2 22.0
961.0 1230.4 1430.1 1832.9 2543.2
5.5 28.0 16.2 28.2 38.8
19.5 27.2 28.2 41.7 64.0
Revenue
(%)
of
(%)
Volume of
(%)
Total
in GDP of
Investment
Investment
Investment in The Same
Fixed Assets Period
During The
(%)
Same Period
(%)
1978 1979 1980
13.0 16.9 27.7 26.6 26.0
23.9 24.8 25.9 30.0 23.8
80.1 90.3 113.2 107.0 121.2
170.9 283.2 521.8 666.0 807.6
948.6 1142.7 1477.6 1590.8 1890.7
2351.9 3123.2 4462.4 4762.2 5602.2
10.2 446294.1
19.1 16349.8
6.89
2014
635910.2
7.3 140370.0
8.6 512020.7
15.2 16245.0
-0.63
2015
676707.8
6.9 152216.7
8.4 561999.8
9.8
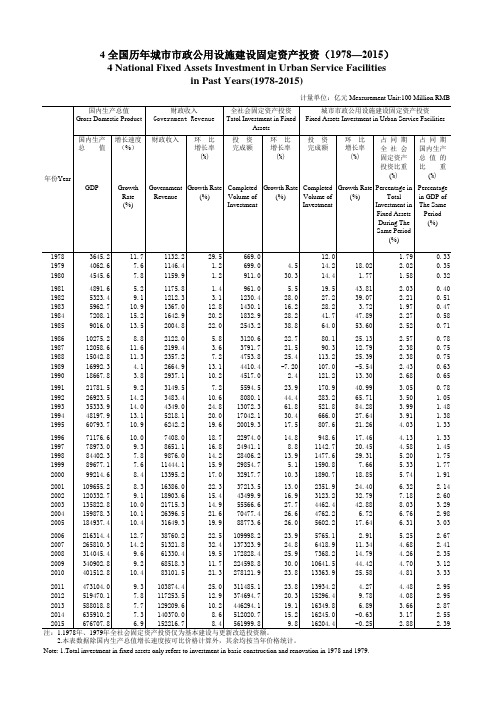
注:1.1978年、1979年全社会固定资产投资仅为基本建设与更新改造投资额。
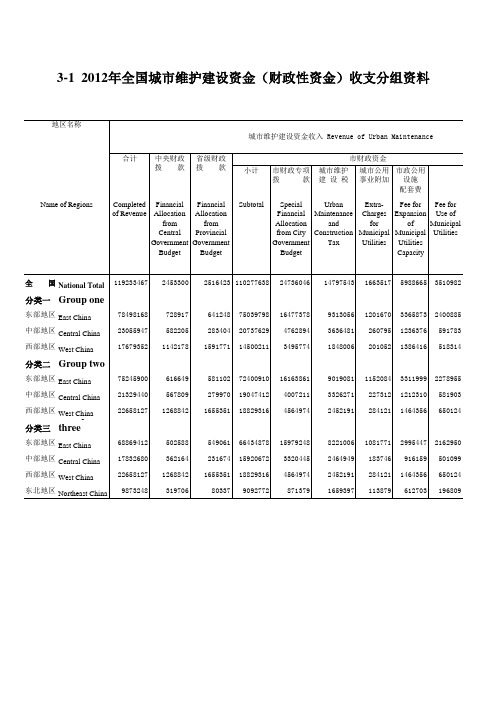
中国城市建设统计年鉴:2012年全国城市维护建设资金(财政性资金)收支分组资料
Roads Fee
Fee Revenue Fee
and
Bridges
Others
Completed Maintenance Expenditure Other
of
Expenditure from Expenditu
Expenditure
Investment res
in Fixed
Assets
Payment for
Utilities Utilities
Budget
Capacity
全 国 National Total 119233467
分类一 Group one
东部地区 East China
78498168
中部地区 Central China 23055947
西部地区 West China
17679352
分类二 Group two
配套费
Cit 市政公用
Completed Financial Financial
of Revenue Allocation Allocation
from
from
Central Provincial
Government Government
Budget Budget
Subtotal
Special
Urban
Extra- Fee for Fee for
Financial Maintenance Charges Expansion Use of
Allocation
and
for
of Municipal
from City Construction Municipal Municipal Utilities
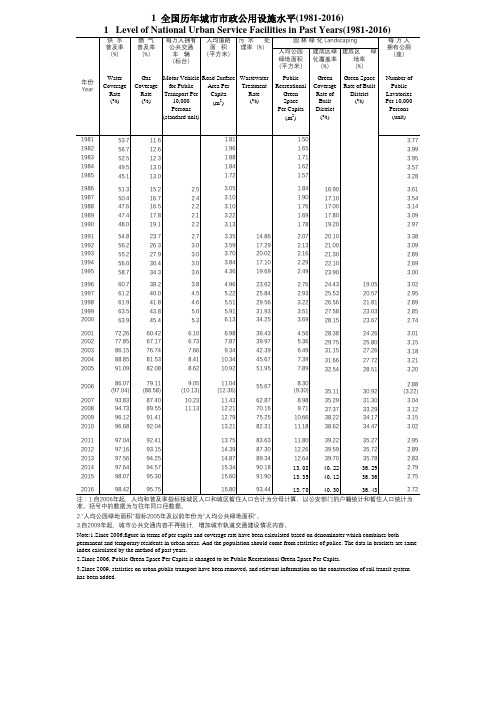
中国城市建设统计年鉴1 全国历年城市市政公用设施水平(1981-2016)
81.53
8.41
10.34
45.67
7.39
31.66
27.72
3.21
2005
91.09
82.08
8.62
10.92
51.95
7.89
32.54
28.51
3.20
2006
2007 2008 2009 2010
86.07 (97.04)
93.83 94.73 96.12 96.68
79.11 (88.58)
11.80
39.22
35.27
2.95
14.39
87.30
12.26
39.59
35.72
2.89
14.87
89.34
12.64
39.70
35.78
2.83
15.34
90.18
13.08 40.22
36.29
2.79
15.60
91.90
13.35 40.12
36.36
2.75
2016
98.42
95.75
Transport Per Capita
10,000
(m2)
Persons
(standard unit)
Wastewater Treatment
Rate (%)
Public Recreational
Green Space Per Capita (m2)
Green Coverage Rate of
Built District
40.0
4.5
5.22
25.84
2.93
25.53
20.57
2.95
中国城市建设统计年鉴:3 全国历年城市维护建设资金收支(1978-2013)
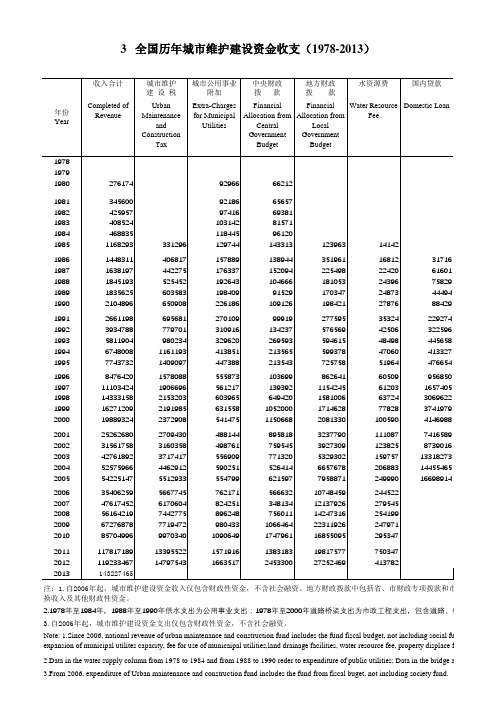
3 全国历年城市维护建设资金收支(1978-2013)注:1.自2006年起,城市维护建设资金收入仅包含财政性资金,不含社会融资。
地方财政拨款中包括省、市财政专项拨款和市级换收入及其他财政性资金。
2.1978年至1984年,1988年至1990年供水支出为公用事业支出;1978年至2000年道路桥梁支出为市政工程支出,包含道路、桥梁3.自2006年起,城市维护建设资金支出仅包含财政性资金,不含社会融资。
Note: 1.Since 2006, national revenue of urban maintenance and construction fund includes the fund fiscal budget, not including social fund expansion of municipal utilites capacity, fee for use of municaipal utilities,land drainage facilities, water resource fee, property displace fee and so on.2.Data in the water supply column from 1978 to 1984 and from 1988 to 1990 reder to expenditure of public utilities; Data in the bridge and3.From 2006, expenditure of Urban maintenance and construction fund includes the fund from fiscal buget, not including society fund.3 National Revenue and Expenditure of Urban Maintenance andConstruction Fund in Past Years(1978-2013)和市级以下财政资金;其他收入中包括市政公用设施配套费、市政公用设施有偿使用费、土地出让转让金、资产置、桥梁、排水等。
4-2-2 2015年按资金来源分全国城市市政公用设施建设固定资产投资(按省分列)

8702347 4585930 2898413 2176524 5176220
3833445 354559 466620 673420 1009312
82661 32249 22256
内蒙古
6388
辽 吉
宁 林
3014546 2539548 1904930
129753 410589 165470
2884793 2128959 1739460
上 海 江 苏 浙 江 安 徽 福 建 江 西 山 东
河 湖 湖 广 广 海
南 北 南 东 西 南
4632048 6849065 7917530 8374861 6013239 886940
189852 18754 40908 630327 225702 128440
4442196 6830311 7876622 7744534 5787537 758500
1280516 933549 1909977 601146
重 庆 四 川 贵 州 云 南 西 藏
135926 91336
134973 606140 73884
陕 西 甘 肃 青 海 宁 夏 新 疆
19944 559750
167906 225980
39863161
1890914
465923
122667
42580254
7807748
1520035 3273738 131006 32000 837054
148
13627
1155267 726271
781955 91028 129079 104814 334753
23920 13469
3345
1866714 431233
2-6按资金来源分全国城市市政公用设施建设固定资产投资(2009年)
债券
Securities
1208486
480638
210741 138
5783 2900 133339 4452 3550 11440 50031 6956 3000 8500 2500 40761 5934
67075 80298
80105
4755 890
利用外资
宁夏 新疆
Ningxia xinjiang
192257 1054711
12242 1580
180015 1053131
中央财政 拨款
Financial Allocation of The Central Government
1129031 76259 15410 20614 8356 14410 142225 67212 48661 16753 30306 33416 60668 18991 6323 47611 38612 51473 35658 39176 45064 13585 8692 88208 29247 28959 11820 15535 23703 26343
13507 52234
49871 244064
62688 565175
4700
27345
外商直接投资 Foreign Direct
Investment
140349 309
7352 5407 9972 2257 6942 16528 5600 15000 20015 12800 28417 4750
5000
自筹资金
Self-Raised Funds
24871118 672127 422166 1131025 143501 1154434 1983359 231126 498314 3597457 2436218 1345511 1641916 413936 304788 1272466 298927 705997 683006 2503908 858975 9769 503613 652968 14252 173913
- 1、下载文档前请自行甄别文档内容的完整性,平台不提供额外的编辑、内容补充、找答案等附加服务。
- 2、"仅部分预览"的文档,不可在线预览部分如存在完整性等问题,可反馈申请退款(可完整预览的文档不适用该条件!)。
- 3、如文档侵犯您的权益,请联系客服反馈,我们会尽快为您处理(人工客服工作时间:9:00-18:30)。
486.1 554.3 600.4 595.2 682.7
117.5 161.4 210.6 201.9 301.5
2001
2002 2003 2004 2005
2351.9
3123.2 4264.1 4650.9 5505.5
109.0 2112.8
104.9
379.1
603.4
16.8
111.0 2705.9
68.0 49.0 58.0 81.0 109.0
871.1 1056.6 1346.4 1453.2 1740.5
34.8 43.0 100.2 173.8 222.0
122.2
4.9
165.3
3.1
284.8
40.3
357.8
55.9
428.6
29.0
105.6 129.5 110.1
68.6 76.7
Foreign Investment
SelfRaised Funds
Other Funds
1978
12.0
6.4
6.4
1979
14.0
1980
14.4
14.4
6.1
0.1
8.2
1981
2
0.5
1982
27.2
27.2
8.6
1.0
—
16.5
1.1
1983
28.2
28.2
166.3 171.1 147.5 102.2 202.1
1339.0 1925.7 2143.9 2705.1 3523.6
4555.6 4446.6 3573.2 4135.2 4406.4
1880.5 1763.7 2037.0 4034.8 4615.6
3992.8 4366.7 4218.0 4383.1 3986.3
4-2 按资金来源分全国历年城市市政公用设施建设固定资产投资(1978-2016) 4-2 National Fixed Assets Investment in Urban Service Facilities by Capital Source
in Past Years(1978-2016)
年份 Year
365.4 369.5 386.9 460.4 659.3
648.9 595.4 987.5 954.0 1295.0
5435.2 5914.0 6890.4 10477.6 12692.4
13509.1 14668.9 15134.3 15100.0 15275.8
89.2 77.3 72.7 112.9 206.0
8.2
0.6
17.2
2.2
1984
41.7
41.7
11.8
2.1
—
25.5
2.3
1985
63.8
63.8
13.9
3.1
0.1
40.9
5.8
1986
79.8
79.8
13.2
3.1
1987
90.0
90.0
13.4
6.2
1988
112.6
112.6
10.2
7.1
1989
106.8
106.8
9.7
6.0
1990
16.4 29.5 27.8 120.8 49.1
111.6 26.8 41.5 96.0
189.1
92.9 73.1 91.2 66.1 113.8
100.3 150.8
62.2 42.0 46.6
1638.1 1635.7 1980.1 2487.1 3058.9
3478.6 3740.5 4714.1 4294.7 4258.0
15.9
72.8
20.8
304.5
107.6
1994
665.5
665.5
27.9
58.3
64.2
397.1
118.0
1995
837.0
807.5
24.2
65.1
84.9
493.3
140.0
1996 1997 1998 1999 2000
939.1 1105.6 1404.4 1534.2 1849.5
2.自2013年起,“中央财政拨款”为“中央预算资金”,“地方财政拨款”为除“中央预算资金”外的“国家预算资金”合计。
Note:1.Since 2013, Completed Investment of This Year is changed to be The Total Funds Actually Available for The Reported Year. 2.Since 2013, Financial Allocation from Central Government Budget is changed to be Central Budgetary Fund, and Financial Allocation from Local Government Budget is State Budgetary Fund excluding Central Budgetary Fund.
本年资金 上年末 来源合计 结余资金
Completed The Balance
Investment of The
of This Previous
Year
Year
小计 Subtotal
计量单位:亿元 Measurement Unit:100 million RMB
本 年 资 金 来 源 Sources of Fund
中央财政 地方财政 国内贷款 债券 拨 款拨 款
利用外资 自筹资金 其他资金
Financial Allocation from Central Government
Budget
Financial Allocation from Local Government
Budget
Domestic Loan
Securities
379.2 409.0 537.6 950.7 1125.3
1103.9 1766.4 2377.7 2046.7 2187.3
2016
17319.2
942.7 16376.5
119.4
5183.7
注:1.自2013年起,“本年资金来源合计”为“本年实际到位资金合计”。
4338.7
133.4
34.6 3963.6 2603.0
274.5
365.7 398.0 445.0 453.0
2006 2007 2008 2009 2010
2011 2012 2013 2014 2015
5800.6 6283.5 7277.4 10938.1 13351.7
14158.1 15264.2 16121.9 16054.0 16570.7
121.2
121.2
7.4
11.0
0.1
57.4
6.0
1.3
61.4
7.7
1.6
78.0
15.7
1.5
72.9
16.7
2.2
82.2
18.4
1991
169.9
169.9
8.6
25.3
6.0
108.1
21.9
1992
265.4
265.4
9.9
42.9
10.3
180.4
38.9
1993
521.6
521.6
96.3
516.9
743.8
7.3
120.7 4143.4
118.9
733.4 1435.4
17.4
267.9 4383.0
63.0
938.4 1468.0
8.5
229.0 5276.6
63.9
1050.6 1805.9
5.2
97.8
109.6 90.0 87.2
170.0
636.4
866.3 1350.2 1372.9 1728.0