SPSS统计分析软件基础教程(英文有图示)
SPSS入门软件操作(修改版)ppt课件
2
1□ 男
2□ 女
问 题 0 0 2 : 您 目 前 的 婚 姻 状 况 ( 单 选 ):
1□ 未 婚
2□ 已 婚
4□ 离 婚 后 再 婚
3□ 离 婚 后 未 再 婚
5□ 丧 偶 后 未 再 婚 2
6□ 丧 偶 后 再 婚
7□ 未 婚 同 居
.
问 题 0 11 : 您 家 中 是 否 有 下 列 物 品 :( 可 多 选 )
.
进入SPSS后显示的文件对话框
以浏览运行 操作指导
使用数据库向 导来创造一个 新的文件选项
在数据窗口输入 数据选项
运行一个已 存在的文件 选项
打开一个已存 在的数据源程 序
打开一个其它类 型的文件
.
主菜单
Spss的主窗口- Data view 数据浏览界面
SPSS的界面
Data view 数据浏览 variable view变量浏览
.
建立数据集
label: 变量标签 本例中各变量的标签: Number——编号 Sex ——性别 Age ——年龄 Height ——身高 Weight ——体重
.
建立数据集
value: 数值标签 本例定义“sex”数值标签: “男”——“1” “女”——“0”
.
建立数据集
missing: 缺失值 本例选择无缺值。
.
数据运算 点击“transfom”菜单→点击子菜单“ compute”打开compute variable对话框→在target variable中指 定一个变量(可以是新变量)→ 在type&lable中定义生成数据的类型或标签→在numeric expression 框中键入公式→ok。
《SPSS的使用教程》PPT课件
数据预处理:
1. 打开数据文件:A2004Data.mdb 注:需要Microsoft Office Access
2. 选择“第一次调查数据” 3. 菜单“文件”——〉”导出”
位置不妨选择“桌面” 保存类型选择“ *.txt ”
4. 打开“第一次调查数据.txt”,修正后保存 将第一行数据(变量名)中双引号里的内容压缩 为不超过4个汉字(因:SPSS变量名最多8字符)
要想看变量值标签,点击: 或选菜单: 会得到如右结果:
6. 频数统计
下面进行频数统计:
7. 练习:奥运会临时超市网点设计
• 2004高教社杯全国大学生数学建模竞赛题目 A题 • 2008 年北京将举办奥运会。根据问卷调查资料分析
人流量的规律 ,给出比赛主场馆的周边临时商业网 点( Mini Supermarket )的设计方案,以满足观 众、游客、工作人员等在奥运会期间的购物需求。
7. 直至“完成”,数据调入SPSS
为便于统计分析,可进一步作处理:
1. 数据排序:“Data”——〉“Sort Cases”,按“no” 排序
2. 将各种出行方式:公交南北、公交东西、出租、 地铁东、地铁西等合并为一个新的变量“出行方 式”
3. 将各种就餐方式:中餐、西餐、商场餐饮合并为 一个新的变量“就餐方式”
新建数据文 件并输入
打开已有数 据并编辑
方法二:通过菜单打开(或新建)
新建数据文 件并输入
打开已有数 据并编辑
2. 定义变量
定义变量有两种方法: 1) 双击变量名,新建变量或修改已有变量
2) 在编辑窗口左下方可以进行数据与变量的编辑切换
点击进入变量编辑窗口
进入变量编辑窗口后会出现如下状态:
SPSS_教程 统计分析软件教程
Labels使用变量标签值来标识每个变量。
Labels and Values使用 变量值和变量标签值来标识每个变 量。
30
统计图形参数设置
主要项目: 图形模板栏 Chart Template 图形的宽与高比设置参数框 Chart Aspect
16
统计图表编辑窗口
17
帮助窗口(Help)
18
六、SPSS系统参数设置
系统初始状态和系统默认值的设置是通过
options选择对话框完成的。具体操作是通过打 开Edit菜单中的options打开系统参数设置对话 框。
参数与状态的设置生效的时间不同,有的在确
认后立即生效,有的要在下一次启动spss系统 时才生效。
4
三、SPSS的启动与退出
SPSS的启动
使用开始菜单启动SPSS 双击SPSS图标启动SPSS
SPSS的退出
使用FILE菜单中的“EXIT
SPSS”菜
单项退出SPSS 单击数据编辑窗右上角“x”的退出 SPSS
5
进入SPSS后显示的文件对话框
以浏览运行
操作指导 在数据窗口输 入数据选项 运行一个 已存在的 文件选项
SPSS系统教程
1
第一节 SPSS简介
SPSS的含义 SPSS for WINDOWS的特点 SPSS for WINDOWS的启动与退出 SPSS for WINDOWS系统运行方式 SPSS for WINDOWS窗口类型
SPSS for WINDOWS系统参数设置
SPSS_教程_ 包括软件详细功能介绍(软件是英文版)

变量显示方式顺序 变量标签显示在前 变量表中只显变量名
变量名按字母顺序 按数据文件中变量类 型顺序
文件表中文件数设定
系统使用过的文件数 设定文件暂存处 输出声明设置 产生新结果时屏幕显 示导航器 产生新结果时屏幕显 示新输出信息
启动时输出窗类型:
•产生交互式要点图和统计图 •输出文本格式要点图和统计图
图形中文字字体设置栏 Font
图形填充和线条样式栏 Fill Patterns and
Line Styles 图形变框栏 Frame
31
图形模板栏 新的图形属 性采用本对话 框之中设置 使用一个图 形模板来确定 当前设置 图形属性 字体
统计图形参数设置
图形宽高 设置栏: 可输入宽 高比值
4
三、SPSS的启动与退出
SPSS的启动
使用开始菜单启动SPSS 双击SPSS图标启动SPSS
SPSS的退出
使用FILE菜单中的“EXIT
SPSS”菜
单项退出SPSS 单击数据编辑窗右上角“x”的退出 SPSS
5
进入SPSS后显示的文件对话框
以浏览运行
操作指导 在数据窗口输 入数据选项 运行一个 已存在的 文件选项
8
四、SPSS系统的运行方式
SPSS系统运行的三种方式:
完全窗口菜单运行管理方式
程序运行管理方式
混合运行管理方式
9
完全窗口菜单运行管理方式
完全窗口菜单运行管理方式主要在数据编辑窗口
和输出观察窗口中进行操作。运行方式操作简便、 直观,特别适合于初学者,也是本门课程讲授的 主要方式。
声音设置:无声;默认 24 声;自选声音文件
观察窗口参数设置
补充内容SPSS基础操作入门.ppt
➢ 除非问卷中有特殊编码,否则按默认情况处理
▪ 其它设置
➢ 均按默认值处理,一般不需要更改
20
变量标鉴与值标签存在与否时的显示差异
值
lcfx
变量名
Valid 1 2 3 4 Total
值标签
Frequency 22 10 6 8 46
Percent 47.8 21.7 13.0 17.4 100.0
➢ 其他按钮
多数情况下会弹出二级对话框 灰色表示不可用
29
SPSS对话框元素介绍
▪ 二级对话框元素
➢ 单选框(组)
一般均成组出现 多选一
➢ 复选框(组)
可成组,也可单独出现 多选多
30
SPSS对话框元素介绍
▪ 二级对话框元素
➢ 下拉列表框
功能实际上和单选框组相同
➢ 文本框
往往会和单选框、复选框结合起来使用
输出窗口( Output -SPSS Viewer)
语法窗口(Syntax- SPSS Syntax Editor)
3
SPSS窗口
数据编辑窗口(SPSS Data Editor) ➢数据视窗: Data View 此窗口下可输入、修改、保存或查看数据 ➢变量视窗: Variable View 定义、修改或察看变量的设置情况。 名称、宽度、类型、小数位数、变量标签、值标 签
▪ 例:将长型数据Anxiety.sav转换为宽型格 式数据
44
一、SPSS基本操作概述
SPSS简史
▪ 软件名称: 原名为: ➢ Statistical Package for Social Science(社会统计软件包) 随着SPSS产品服务领域的扩大和服务深度的增加, SPSS公司已于2000年正式将英文全称更改为 ➢ Statistical Product and Service Solutions,(统计产品 与服务解决方案)
SPSS基础入门ppt课件
地区、时间、营业额...
身高、体重、智力...
指定每个变量的各种属性
3
2
变量名、变量标签值、变量的储存类型、缺失值、变量的测量尺度
录入数据
变量名不能与SPSS保留字相同。 SPSS的保留字有ALL、END、BY、EQ、GE、GT、LE、 LT、NE、NOT、OR、TO、WITH。
ppt课件.
12
数据录入 数据录入的格式
实际观察数
理论数 行百分数 列百分数 合计百分数
残差
ppt课件.
41
Crosstabs:结果解释
曾经 吸过烟 * 性别
Case Processing Summary
Valid
N
P erc en t
999
99.9%
C ases
Missing
N
P erc en t
1
.1%
Total
N
P erc en t
ppt课件.
22
Frequencies:定义统计图
统计图类型
无图形 条图 饼图
直方图加上正态曲线
直方图
以频数绘制条图或饼图
ppt课件.
以构成比绘制条图或饼图
23
Frequencies:定义表格
按数值升序
频数表排列次序
按数值降序
按频数升序 按频数降序
ppt课件.
24
Frequencies:结果解释
999
a. 0 cells (.0%) hav e expected count less than 5. The minimum expected count is 34.53.
ppt课件.
最初软件全称为“ 社会科学统计软件包” (SolutionsStatistical Package for the Social Sciences)
SPSS入门讲义 ppt课件

SPSS软件的特点
①集数据录入、资料编辑、数据管理、统 计分析、报表制作、图形绘制为一体。从 理论上说,只要计算机硬盘和内存足够大, SPSS可以处理任意大小的数据文件,无论 文件中包含多少个变量,也不论数据中包 含多少个案例
医学课件
4
②统计功能囊括了《教育统计学》中所有的项 目,包括常规的集中量数和差异量数、 相关 分析、回归分析、方差分析、卡方检验、t检 验和非参数检验;也包括近期发展的多元统计 技术,如多元回归分析、聚类分析、判别分析、 主成分分析和因子分析等方法,并能在屏幕 (或打印机)上显示(打印)如正态分布图、直方 图、散点图等各种统计图表。从某种意义上讲, SPSS软件还可以帮助数学功底不够的使用者学 习运用现代统计技术。使用者仅需要关心某个 问题应该采用何种统计方法,并初步掌握对计 算结果的解释,而不需要了解其具体运算过程, 可能在使用手册的帮助下定量分析数据。
医学课件 2
目前,世界上最著名的数据分析软件是SAS和 SPSS。SAS由于是为专业统计分析人员设计的, 具有功能强大,灵活多样的特点,为专业人士 所喜爱。而SPSS是为广大的非专业人士设计, 它操作简便,好学易懂,简单实用,因而很受 非专业人士的青睐。此外,比起SAS软件来, SPSS主要针对着社会科学研究领域开发,因而 更适合应用于教育科学研究,是国外教育科研 人员必备的科研工具。1988年,中国高教学会 首次推广了这种软件,从此成为国内教育科研 人员最常用的工具。
医学课件 47
示例1
某物质在处理前与处理后分别抽样分析其 含脂率如下 处理前(Xi) 0.19 0.18 0.21 0.30 0.41 0.12 0.27 处理后(Yi) 0.15 0.13 0.07 0.24 0.19 0.06 0.08 0.12
2-SPSS软件入门ppt课件
SPSS的主要变量类型如下:
Numeric:数值型。定义数值的宽度 (Width),即整 数部分+小数点+小数部分的位数,默认为8位:定 义小数位数(Decimal Places),默认为2位。
Comma:加显逗号的数值型,即整数部分每3位数加 一逗号,其余定义方式同数值型,也需要定义数 值的宽度和小数位数。
SPSS默认的变量为Var00001、Var00002等。用户也可 以根据自已的需要来命名变量。SPSS变量的命名和一般 的编程语言一样,有一定的命名规则,具体内容如下。 1、变量名必须以字母、汉字或字符开头。 2、变量最后一个字符不能是句号。 3、变量名总长度不能超过8个字符(即4个汉字)。 4、不能使用空白字符或其他特殊字符(如“!”、“?”等) 5、变量命名必须惟一,不能有两个相同的变量名。 6、在SPSS中不区分大小写。例如,HXH、hxh或Hxh对 SPSS而言,均为同一变量名称。 7、SPSS的保留字(Resewed Keywords)不能作为变量的名 称,如ALL、AND、WITH、OR等。
2
历史
20世纪60年代末,美国斯坦福大学的三位研究生研制开发了最早的 统计分析软件SPSS
1975年在芝加哥组建了SPSS公司。
1984年SPSS总部首先推出了世界上第一个统计分析软件微机版本 SPSS/PC+
1994至1998年间,SPSS公司陆续购并了SYSTAT公司、BMDP软 件公司、Quantime公司、ISL公司等,并将各公司的主打产品收纳 SPSS旗下,从而使SPSS公司由原来的单一统计产品开发与销售转向 企业、教育科研及政府机构提供全面信息统计决策支持服务,成为走 在了最新流行的“数据仓库”和“数据挖掘”领域前沿的一家综合统 计软件公司。
spss统计软件使用教程.ppt
SPSS统计软件简介
SPSS是社会科学统计软件包(Statistics Package For Social Science)的缩写,经过几十年的改进, 该产品发展成为集统计分析、数据挖掘、商业智能、 顾客关系管理等多功能的统计产品和服务解决方案 (Statistics Product For Service Solutions)的 软件。适用于社会学、医学、心理学、经济学等领 域。
磁盘中,建立可随时存取、修改、统计
分析的数据文件的全过程。
定义变量
数据录入
2019/4/5
保存数据
9
定义变量
变量格式设置窗口(Variable View)
2019/4/5
10
定义变量
例如 在Variable View窗口中
Name—更改变量名称 Type—选择变量类型(如numeric 、date、string) Decimals—设定小数显示的位数 Label—分析输出结果中变量的显示名称
2019/4/5
13
学生操作
建立一个以自己名字为文件名的SPSS数据库 调查变量包括:姓名、性别(1=男性,2=女性)、 出生日期(美式)、身高(单位cm,保留2位小数)
输入自己的数据并保存
2019/4/5
14
二、数据的统计分析
用统计指标、统计表、统
统计描述 计图等方法去对资料的数
量特征及分布规律进行测
Values —分析输出结果中变量内容的显示名称
2019/4/5
11
数据录入
数据编辑窗口(Data Editor)
操作演示
2019/4/5
spss基本操作PPT课件
2020/1/10
26
2.2.7 缺失值(Missing)的处理
当数据中存在明显错误或明显不合 理的数据以及存在漏填数据项时,统计 上通称为数据为不完全数据或缺失数据。
SPSS中说明缺失数据的基本方法是 指定用户缺失值。用户缺失值可以是:
o 对字符型或数值型变量,用户缺失值可以是1至 3个特定的离散值(Discrete missing values);
数据编辑窗口中的数据通常以SPSS数据文 件的形式保存在计算机磁盘上,其文件扩展名 为.sav。
数据编辑窗口由窗口主菜单、工具栏、数 据编辑区、系统状态显示区组成。
2020/1/10
5
标题栏
菜单栏
工 具 栏
2020/1/10
输
入
数据显示区:
数
变量名
据
观察序号
栏
数据编辑器的构成
状态栏
6
菜单表
功能
主窗口菜单及功能 解释
17
2020/1/10
频数数据的组织方式
职称 1 1 1 2 2 2 3 3 3 4 4 4
年龄段 1 2 3 1 2 3 1 2 3 1 2 3
人数 0 15 8 10 20 2 20 10 1 35 2 0
18
2.2 SPSS数据的结构和定义方法
SPSS数据的结构包括变量名、类型、宽度、列宽
• 数值型 (1)标准型(Numeric) (2)科学记数法型(Scientific Notation) (3)逗号型(Comma) (4)圆点型(Dot) (5)美元符号型(Dollar) (6)用户自定义型(Custom Currency)
• 字符型(String) • 日期型(Date)
SPSS Statistics 使用教程及界面介绍翻译
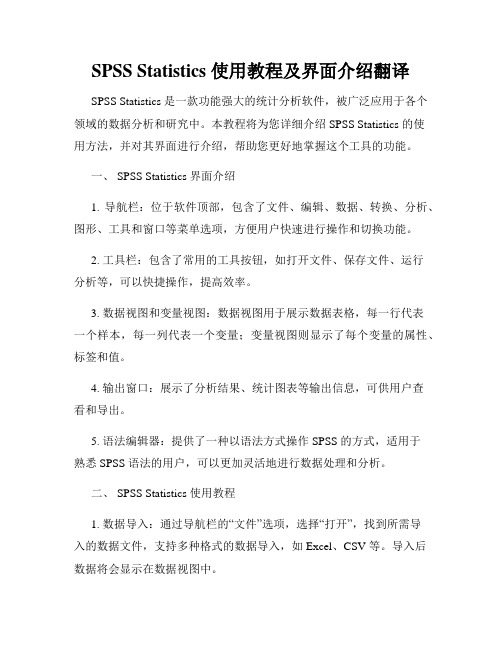
SPSS Statistics 使用教程及界面介绍翻译SPSS Statistics 是一款功能强大的统计分析软件,被广泛应用于各个领域的数据分析和研究中。
本教程将为您详细介绍 SPSS Statistics 的使用方法,并对其界面进行介绍,帮助您更好地掌握这个工具的功能。
一、 SPSS Statistics 界面介绍1. 导航栏:位于软件顶部,包含了文件、编辑、数据、转换、分析、图形、工具和窗口等菜单选项,方便用户快速进行操作和切换功能。
2. 工具栏:包含了常用的工具按钮,如打开文件、保存文件、运行分析等,可以快捷操作,提高效率。
3. 数据视图和变量视图:数据视图用于展示数据表格,每一行代表一个样本,每一列代表一个变量;变量视图则显示了每个变量的属性、标签和值。
4. 输出窗口:展示了分析结果、统计图表等输出信息,可供用户查看和导出。
5. 语法编辑器:提供了一种以语法方式操作 SPSS 的方式,适用于熟悉 SPSS 语法的用户,可以更加灵活地进行数据处理和分析。
二、 SPSS Statistics 使用教程1. 数据导入:通过导航栏的“文件”选项,选择“打开”,找到所需导入的数据文件,支持多种格式的数据导入,如 Excel、CSV 等。
导入后数据将会显示在数据视图中。
2. 数据清理:在导入数据后,您可能需要对数据进行清理和整理,以便后续的分析。
SPSS Statistics 提供了数据转换、排序、过滤等功能,可通过转换菜单进行相关操作。
3. 变量设定:在变量视图中,可以对每个变量进行属性的设定,包括变量名称、数据类型、标签等。
这些属性的设定将会影响到后续的数据分析过程。
4. 数据分析:SPSS Statistics 提供了丰富的数据分析方法,包括描述性统计、假设检验、回归分析、聚类分析等。
选择相应的分析方法后,可以通过菜单或语法编辑器来设定参数和运行分析。
5. 结果输出:分析完成后,结果将会显示在输出窗口中,您可以查看和导出结果。
spss入门基本操作ppt课件
Independent Samples Test
Levene's Test for Equality of Variances
t-test for Equality of Means
F Sig. t
95% Confidence
df
Sig. (2- Mean Std. Error tailed) Difference Difference
17
§1.3 按题目要求进行统计分析
下面我们要用SPSS来做成组设计两样本均数比较的t检验,选 择Analyze==>Compare Means==>Independent-Samples T test,系统弹出两样本t检验对话框如下:
18
将变量X选入test框内,变量group选入grouping框内,注意这时 下面的Define Groups按钮变黑,表示该按钮可用,单击它,系统 弹出比较组定义对话框如右图所示:
22
1.4.2 导出分析结果 文件倒是保存了,但问题还没有完全解决:我们从来写文章什么的 都用的是文字处理软件,尤其是WORD,可WORD不能直接读取 SPO格式的文件,怎么办呢?没关系,SPSS提供了将结果导出为纯 文本格式或网页格式的功能,在结果浏览窗口中选择菜单 File==>Export,系统会弹出Exprot Output对话框如下
现在,第一、第二列的名称均为深色显示,表明这两列已 经被定义为变量,其余各列的名称仍为灰色的“var”,表 示尚未使用。同样地,各行的标号也为灰色,表明现在还 未输入过数据,即该数据集内没有记录。
7
1.1.3 输入数据 在Data View中输入相应的数据,一个单元格输入一个数据, Group中输入1代表患者,2代表健康人。
统计分析软件SPSS图文教程
目录第一章spss概览—实例详解第二章数据文件的管理第三章程序编辑窗口用法详解第四章SPSS结果窗口用法详解第五章SPSS统计绘图功能详解第六章描述性统计分析菜单详解第七章均数间的比较菜单详解第八章一般线性模型详解第九章相关性分析菜单详解第十章多元线性回归与曲线拟合--regression菜单详解(上)第十一章分类资料的回归分析—regression菜单详解(下)第十二章非参数检验菜单详解第十三章生存分析-survival菜单详解(上)第十四章生存分析-survival菜单详解(下)第一章 SPSS概览--数据分析实例详解1.1 数据的输入和保存1.1.1 SPSS的界面1.1.2 定义变量1.1.3 输入数据1.1.4 保存数据1.2 数据的预分析1.2.1 数据的简单描述1.2.2 绘制直方图1.3 按题目要求进行统计分析1.4 保存和导出分析结果1.4.1 保存文件1.4.2 导出分析结果欢迎加入SPSS使用者的行列,首先祝贺你选择了权威统计软件中界面最为友好,使用最为方便的SPSS来完成自己的工作。
由于该软件极为易学易用(当然还至少要有不太高的英语水平),我们准备在课程安排上做一个新的尝试,即不急于介绍它的界面,而是先从一个数据分析实例入手:当你将这个例题做完,SPSS的基本使用方法也就已经被你掌握了。
从下一章开始,我们再详细介绍SPSS 各个模块的精确用法。
我们教学时是以SPSS 10.0版为蓝本讲述的--什么?你还在用7.0版!那好,由于10.0版在数据管理的界面操作上和以前版本有较大区别,本章我们将特别照顾一下老版本,在数据管理界面操作上将按9.0及以前版本的情况讲述,但具体的统计分析功能则按10.0版本讲述。
没关系,基本操作是完全一样的。
好,说了这么多废话,等急了吧,就让我们开始吧!希望了解SPSS 10.0版具体情况的朋友请参见本网站的SPSS 10.0版抢鲜报道。
例1.1 某克山病区测得11例克山病患者与13名健康人的血磷值(mmol/L)如下, 问该地急性克山病患者与健康人的血磷值是否不同(卫统第三版例4.8)?患者: 0.84 1.05 1.20 1.20 1.39 1.53 1.67 1.80 1.87 2.07 2.11健康人: 0.54 0.64 0.64 0.75 0.76 0.81 1.16 1.20 1.34 1.35 1.48 1.56 1.87让我们把要做的事情理理顺:首先要做的肯定是打开计算机(废话),然后进入瘟98或瘟2000(还是废话,以下省去废话2万字),在进入SPSS后,具体工作流程如下:1.将数据输入SPSS,并存盘以防断电。
spss软件操作指南ppt课件

ppt课件.
26
One-Samples T Test过程
• One-Samples T Test过程用于进行样本均数与已知总体均 数的比较。
界面说明
• 【Test Variables框】
• 用于选入需要分析的变量。
• 【Test Value框】
• 在此处输入已知的总体均数,可以自行定义已知总体均数 为任意值,默认值为0。
(2)指定标记变量到 Label Case框 中。这与制作简单散点图中的相同。
ppt课件.
12
对于矩阵散点图主要需要定义:
(1)定义参加绘图的几个变量到Matrix框中。这里
应注意:选择变量的先后顺序,决定了矩阵正对角线上
变量的排列顺序。
(2)指定分组变量到Set Markers框中。这与制作简
单散点图中的相同。
• Kendall's tau-b复选框 计算Kendall's等级相关 系数,其计算等级变量间的秩相关。
• Spearman复选框 计算Spearman相关系数。也是计 算等级相关系数。 以上三种相关分析可以选择其中之一,也可以同时 多选。如果参与分析的变量是连续变量,选择 Kendall's tau-b或Spearman相关,则系统自动对 连续变量的值先求秩,pp再t课件计. 算其秩分数间的相关系16
(3)指定标记变量到Label Cases框中。这与制作简
单散点图中的相同。
对于三维散点图主要需要定义:
(1)指定散点图的y轴上的变量名到y Axis框中。
(2)指定散点图的x轴上的变量名到x Axis框中。
(3)指定散点图的z轴上的变量名到z Axis框中。
(4)指定分组变量到 Set Markers框中。这与制作
- 1、下载文档前请自行甄别文档内容的完整性,平台不提供额外的编辑、内容补充、找答案等附加服务。
- 2、"仅部分预览"的文档,不可在线预览部分如存在完整性等问题,可反馈申请退款(可完整预览的文档不适用该条件!)。
- 3、如文档侵犯您的权益,请联系客服反馈,我们会尽快为您处理(人工客服工作时间:9:00-18:30)。
An Introduction to SPSSOr PASWThe two laboratory sessions created for this course introduce students to the use of SPSS software.Section OneTo Should be completed by all studentsSection ThreeSection Four Further statistical analysis for you to tryIt is expected that students should complete the exercises up to and including Section Three within class time, if this is not achieved students should complete the exercises in their own time.Introduction to SPSSSection OneIntroductionSection One introduces the various screens and displays as well as explaining how to inputyour survey and your data.SPSS is one of the most popular statistical analysis packages in use today and has been around for well over 20 years. The latest version with the w indow‟s interface is particularly easy to use. The windows environment also facilitates the import and export of data, for example importing data from a spreadsheet and exporting results to a word document.The University holds a license that allows students to have a copy of SPSS on their own computers. The CD for installing the latest version of SPSS can be borrowed from the Library. Starting SPSSPASW Version 18 is the latest version. It can befound from Start(Bottom left hand corner),Programmes, SPSS Inc, PASW 18. The openingdisplay asks you to select one of a number ofoptions. At the moment click on the Red Cross toclose the box.The Opening DisplayThe window displayed iscalled the Data Editor; this isused for entering, editing andselecting data. The DataEditor has two views: theVariable View and the DataView you can flip from oneview to the other by using thetab at the bottom of the page. SPSS has a number of other windows including Output, Help and Tutorial.Help SystemThe SPSS Help System is very comprehensive; from the mainmenu select Help: a sub menu appears containing:Help Topics -.Arranged in three ways:1.Contents give help by general function.2. Index,gives an alphabetical listing of help topics. Enter a topic, then select amore specific topic from the list displayed (by highlighting it), click Display. Thisgives general information on the topic. SPSS is a very powerful programme andhas a variety of application, so don‟t worry about the various topics which will bemeaningless to you at the moment!3. Search, will find a given word or set of words in help.Tutorial - step by step tutorials are available on a number of topics.Statistics CoachA data set must be loaded in the Data Editor before this option can be used. Thiscould be data collected for your assignment or from questionnaires used in your dissertation. The statistics coach provides step by step guidance on the analyses that are permissible on the open data set.Entering DataThe best introduction to entering data in SPSS is to go through the SPSS tutorial on entering data. To do this select: Help, Topic, Entering Data.Data EditorVariable View contains descriptions of the attributes of each variable in the data file. In Variable View:• Rows are variables.• Columns are variable attributes.(For example: if you have produced a questionnaire each row represents a question or part of a question from your questionnaire.)1 2 3 4 5 6 7 8 9 10 11You can add or delete variables and modify attributes of variables, including the following attributes:1. Name-This is the name you allocate to the variableVariable names:∙Must be unique∙Can only have eight or less characters∙Must begin with a letter (not a number)∙Cannot include full stops, blanks or other characters (!, ?, @, etc); and∙Cannot include word used as commands by SPSS (all, ne, eq, to, le, It, by, or, gt, and, ge, with)NB The first variable in any data set should be ID, which is a unique number that identifies each case. Before beginning that data entry process, go through and assign a number to each of your questionnaires or data records. Write the number clearly on the front cover. Later, if you find an error in the data set, having the questionnaires or data records numbered will allow you to check back and find where the error occurred.2. Type-the variable type defaults as numeric, leave it as this unless changing tocurrency (see later).3. Width- The number of characters displayed. The default here is 8, it is normallynot necessary to change it.4. Decimals-The number of decimal places displayed, the default here is two.5. Label-Allows for a more detailed description of the Name.6. Values-Values are code numbers applied to a stringed response7. Missing Values- defines specified data values as user-missing. For example,you might want to distinguish between data that are missing because arespondent refused to answer and data that are missing because the questiondidn't apply to that respondent. Data values that are specified as user-missing areflagged for special treatment and are excluded from most calculations.8. Columns- Simply the width of the columns: defaults at 8.9. Align- The position of text within the column: defaults to the right.10. Measure- You can specify the level of measurement as scale (numeric data onan interval or ratio scale), ordinal, or nominal.•Nominal. A variable can be treated as nominal when its values representcategories with no intrinsic ranking (for example, the department of thecompany in which an employee works). Examples of nominal variablesinclude region, zip code, and religious affiliation.•Ordinal.A variable can be treated as ordinal when its values representcategories with some intrinsic ranking (for example, levels of servicesatisfaction from highly dissatisfied to highly satisfied). Examples of ordinalvariables include attitude scores representing degree of satisfaction orconfidence and preference rating scores.•Scale. A variable can be treated as scale when its values represent orderedcategories with a meaningful metric, so that distance comparisons betweenvalues are appropriate. Examples of scale variables include age in years andincome in thousands of pounds.11. Role -Some dialogs support predefined roles that can be used to pre-selectvariables for analysis. When you open one of these dialogs, variables that meetthe role requirements will be automatically displayed in the destination list(s).Available roles are:Input. The variable will be used as an input (e.g., predictor, independent variable).Target. The variable will be used as an output or target (e.g., dependent variable).Both. The variable will be used as both input and output.None. The variable has no role assignment.Partition. The variable will be used to partition the data into separate samples fortraining, testing, and validation.By default, all variables are assigned the Input role.All of these attributes are saved when you save the data file.Data ViewThe variables defined in Variable View as rows are transferred in the Data View as columns. Data View is where you input your responses to your survey etc. Each row represents one respondent.The screen above depicts the variable attributes as values; thiscan be changed to value labels by selecting View, and ValueLabels.Preparing a CodebookBefore you can enter the information from a questionnaire into SPSS you need to prepare a …codebook‟. This is in effect a summary of the instructions you will use to convert the information obtained from each questionnaire response into a format that SPSS can understand. Preparing a codebook involves deciding (and documenting) how you will go about:∙Defining and labelling each of the responses to the questions in your questionnaire (variables); and∙Assigning numbers to each of the possible responses.All this information should be recorded in a book or computer file. Keep this somewhere safe, there is nothing worse than coming back to a data file, which you may have not used for a while, and wondering what the abbreviations and numbers refer to. In your code book you should list all of the variables used in your questionnaire, the abbreviated variable names that you will use in SPSS and the way in which you will code the responses.Coding ResponsesEach response must be assigned a numerical code before it can be entered into SPSS. Variable responses which are already in numerical format i.e. age in years, do not require to be coded, other variables such as gender will need to be converted to numbers (1 = males, 2 = females). If you have used numbers in your questions to label your responses this is relatively straightforward. If not decide on a convention and stick to it. For example, code the first response as 1, the second as 2 and so on.To code responses to the question above: if a person ticked single they would be coded as 1; if in a relationship, they would be coded 2; if married, 3; and if divorced, 4.Table 1 below indicates an example of a possible code book for a questionnaire.Coding Open-ended QuestionsFor open-ended questions (where respondents can provide their own answers), coding is slightly more complicated. Take for example the question: what is the major source of stress in your life at the moment? To code responses to this you will need to scan through the questionnaire and look for common themes, (e.g.) work, finance, relationships, health or lack of time might be highlighted a number of times. In your codebook you would list these major groups of responses under the variable stress, and assign a number to each (work = 1, finance = 2, relationships = 3 and so on). You may also need to add another numerical code for responses that did not fall into these listed categories (other = 9). When entering that data for each respondent you compare their response with those listed in your codebook and enter the appropriate number into the data set under the variable stress.Job Survey Parts 1 and 2 ExercisesThroughout the SPSS sessions we will be referring to the Job Survey. In Part 1 the questionnaire targets employees of a local organisation; in Part 2 the questionnaire targets supervisors of the same employees.Exercise 1.1: Coding the SurveyOn the Job Survey questionnaire sheet (See Appendix 1.1), in the allocated space, assign codes to the possible responses.Exercise 1.2: Entering the Survey into a Blank Data SheetIf restarting SPSS, select Type in Data and ensure the Data Editor is showing Variable View.Enter each question from the Survey intoData Editor.Start by allocating an Identification Number toeach respondent, enter the variable Name asID, change the Decimals to0, and leave allother columns at the default settings. SeeAppendix 1.2 for variable namesContinue on to row 2 with Question 1 in the survey; the variable name will be Ethnicity, change the Decimals to 0. Add the coded values by clicking in the values cell (on the appropriate row) and click on the grey box which will appear. Type 1 for the value and White/European for the value label, and then click ADD, continue until all variable attributes are completed, click OK. Finally, change Measure to Nominal as this is categorical data but is not ranked.Continue to enter all of thequestions from thequestionnaire.Exercise 1.3: To Change the FormatCurrency FormatQuestion 3 in the survey asks about salary. We can change the format of this data to currencyformat i.e. all data relating to the information willbe prefixed with the £ sign. To define currency inthe Type column click on the grey box, selectCustom Currency, CCA, and change to 0decimal places.Continue to enter all of the questions from thequestionnaire.Exercise 1.4: To Input Responses into the Data EditorTo input the responses to the questionnaire ensure the Data Editor is showing Data View. To allow you to practice doing this refer to Appendix 1.3. Appendix 1.3 is an extract of responses given to the Job Survey up to Question 6d. Input these responses into Data View.Missing ValuesOne of the most common problems encountered with using questionnaires is that some questions are not fully answered. These gaps in your questionnaire are called missing values or missing data. If this occurs you have to think why the questions have not been answered and what you can do about it. There are four possibilities why this might happen: ∙The question did not apply to the respondent∙The respondent refused to answer this particular question∙The respondent did not know the answer∙The respondent simply forgot to answer the questionIf whilst inputting your data you find you have missing values, go back to Variable Viewand at the appropriate variable, click on the box to the left of the Missing Value cell and select as below.For the purposes of this survey all missing values willbe coded as 0, with the exception of Absence whichwill be coded 99.Remember to SAVE your work to My Documents.Introduction to SPSSSection TwoIntroductionSection Two explains how to view, manipulate, display and describe your data.Exercise 2.1: To load SPSSStart, Programs, SPSS.Click Cancel on the dialogue box to remove it, you are then left with the Data Editor.Data Editor has a menu bar with many options, as shown below, these include:File: Used to access any files whether you want to Open an existing SPSS file or read data from another application such as Excel or dBase, or start a New file. It is also the menu option you choose to Save files.Edit: Can be used to alter data or text in the Data View or the Variable View.View: Used to alter the way your screen looks. Please leave this on the default settings. Data: Used to define variables and make changes to the data file you are using. Transform: Used to make changes to selected variable(s) in the data file you are using. This can include recode(ing) existing variables and compute(ing) new variables.Analyze:Used to undertake a variety of analyses such as producing Reports, calculating Descriptive Statistics such as Frequencies and Crosstabs(cross tabulations) and associated summary statistics, as well as various statistical procedures such as Regression and Correlation.Graphs: Used to create a variety of graphs and charts such as Bar, Line and Pie charts. Utilities:Is for more general housekeeping such as changing display options and fonts, displaying information on variables.Add-ons: Includes services available such as statistical help.Window: Operates in the same way as other Windows packages.Help:A context sensitive help feature which operates the same way as other Windows packages.Exercise 2.2: To load a previously created SPSS for Windows data fileSPSS for Windows saves data files using a filename of up to 8 characters and the file extension .SAV, for example job survey.savIn the Menu Bar click on the following:File (main menu bar), Open (in File menu), exchange on Wide (X:), Data, IB04A dialogue box similar to that below will appear:Open the file by clicking on JOB SURVEY and then on the button (or double click on the file name).You will now see the file appear in the Data View and the filename above the menu bar change to JOB SURVEY.SAV SAVE this file to H:drive and open the file from H:drive for use in today‟s session. (Exchange on Wide is a shared network; therefore you can not change and save to this network).Exercise 2.3: To undertake a frequency distributionIt is always a good idea to “eyeball” your data; this can be done using Frequencies.∙Click on Analyse, Descriptive Statistics, Frequencies∙Opens the Frequencies dialogue box.∙Highlight ethnicity in the left hand box by clicking on it∙Click on the button to move ethnicity into the Variable(s) box(Note how the arrow button changes direction and the cursor moves to the Variable(s) box. This is to allow you to reverse your decision if you wish.)∙Click on OKYou will now see a series of tables displayed in the SPSS Output Viewer. Note how SPSS first tells you if there are any missing cases. For this variable there are no missing cases.∙Use the and arrows to scroll down and across to view the actual frequencies table. Note how SPSS lets you know if there are any missing casesand calculates the valid percent appropriately. The valid percentages takeaccount of any missing values. If they were none then the percent and validpercent would be the same.∙Repeat this process using Analyze, Descriptive Statistics, Frequencies for Income and Age. You can do this by pointing and clicking on the menucommands which are visible at the top of your screen.Whilst you are doing this explore the effect of thebutton on your output.∙To remove the variables from the right Variable(s)box within the dialogue box either:click on the buttonor highlight the variable in the right Variable(s) box and click on the button ∙To quit this analysis (for example if you make a mistake) click on the buttonYou may (or may not!) have noticed that each of the tasks you have performed in SPSS have been automatically appended to the SPSS Output Viewer. You can see this by scrolling through your output window using the up and down arrows on the right of the window.You can edit the SPSS Output Viewer and save it, or parts of it, to a file which can subsequently be read into a word processor. SPSS output files are suffixed with .spv. Alternatively you can print it out directly.TIP∙To delete some output in the SPSS Output Viewer:click on the area you want to delete, a line will appear around it.press the delete key on the keyboardTo delete all the output in the SPSS Output Viewer:Ensure that the SPSS Output Viewer window is maximisedIn the SPSS Output Viewer click on Edit, Select, All, press the delete key on the keyboardExercise 2.4: To save the OutputTo save the contents of the SPSS Output Viewer to a fileEnsure that the SPSS Output Viewer window is maximisedClick on File, Save asType in the filename you wish to save it to in the File name box, making sure the file type is *.spvEnsure that the file is being saved to the correct drive and directory (i.e. H:drive)NB Donot close without saving or you will loose all of your output. The Output viewer works like a scroll, each new analysis is added to the end of the previous analysis.Exercise 2.5: To produce charts∙Click on Graphs, Chart Builder (If a dialogue box appears click okay).∙Select Simple bar graph by clicking on it and dragging to the canvas.∙Then click on and grab ethnicity from the column of variables, onto the x-axis∙Click OKYour graph will now appear in the Output Viewer.∙Double click on the bar chart and a smaller box appears entitled chart editor.∙Click on one of the bars, all of the bars should now be highlighted with a blue line.∙From the Properties box select Fill and Border; change the colour of your bars.∙Click on Elements, then show data labels.∙In the Properties box, you can add/remove things from the area marked display from the box marked not displayed which are then added to your graphic byusing the red cross to remove and the green arrow to add. Add percentages toyour data labels.Exercise 2.6: To produce a clustered bar chartIt may make more sense to compare two groups, forexample men and woman. A clustered bar chart will show this.∙Click on Graphs∙Click on Chart Builder.∙Click Bar and Drag the Cluster bar chart icon to the canvas∙Drag Ethnicity from the Variables list to the X-axis and Gender to Cluster on X: set colour∙As the two groups male and female are not of equal numbers, 39 men: 31 women, it would give a more accurate comparison to change Count to Percentage. In the Element Properties box, under Statistic, use the arrow to find percentage.∙Click Apply∙Click Ok∙In Chart Editor show the Percentage Data Labels∙Under Number Format, change the decimal places to 0Exercise 2.7: Produce a Stacked Bar∙Produce a Stacked Bar variation of the above chartExercise 2.8: To produce a pie chart∙Click on Graphs∙Click on Chart Builder.∙From Gallery select Pie/Polar∙Drag the Pie chart icon onto the canvas∙Drag Ethnicity to the x-axis from the variables list∙Change Count to Percentage on the y-axis (Element Properties, Statistics)∙Click Apply∙Click OKYour Pie chart will now appear on the Output Viewer.Exercise 2.9: To present your graph in Word∙Open Microsoft Word.∙Select one of the graphs you have produced in the Output Viewer and give it a title.∙Click on the icon circled below or Options, Title∙Give your graph a suitable title∙Close Chart EditorYour chart with a title should have a box around it, if not click on your chart.∙Right click on your chart and select Copy.∙Paste your chart into your open Word document∙Give your chart a numbered title by selecting Insert, Reference, Caption, decide on position and click OK.∙Immediately after the Figure number, title your chart again.∙Adjust the size of your chart by clicking on it and manipulating the black boxes at the corners.Figure 1 Ethnicity of Respondents by GenderExercise 2.10: To recode variablesWhen a variable is a scale measure such as at the interval/ratio level, it normally has to be grouped to be presented as a frequency table. Income from the Job Survey is such a variable. To examine the data:∙Click on Analyse, Descriptive Statistics, Frequencies, select Income and click on the Blue Arrow (income should appear in the variables box)∙Select Statistics, select Minimum and Maximum, press Continue then OKOutput Viewer displays the data for Income, you can see the minimum income is £11800 and the maximum is £21000, and there are thirty-three different categories which are too many to produce a meaningful chart or table. We must, therefore reduce the amount of categories by grouping them. Six new categories seems a useful number. To do this we must Recode the data and give the income category a new variable name called incomegp (income group).∙Transform, Recode,Variables (opensRecode into DifferentVariables box)∙Select Income andplace in the NumericVariables… box∙Type Incomegp intoName∙Select Change∙Select Old and NewValues (opens Old andNew Values box)System or UserMissing and under NewValue select SystemMissing, select Add∙Select Range:Lowestthrough and type11999, under NewValue type1, selectAdd∙Select Range and type12000 and through andtype13999, under NewValue type 2, select Add∙Repeat this until you reach 19999∙Select Range Value: through Highest and type20000, under New Value type6, select Add∙Select Continue∙Select OKYou have now created a newvariable called Incomegp, it is nownecessary to allocate value labelsto the new variable.NB this variable is no longer ascale measure as you havetransformed it to categorical; themeasure should therefore bechanged to Nominal.∙Select Graphs, Chart Builder, Bar to produce a graph of your new category.You have now produced a HistogramFrom the graph, the Income group £16000-17999 is the most common amongstemployees.Exercise 2.11: To create a table (crosstab) of one variable against anotherA useful feature of SPSS is its ability to create crosstabulations (or a table) of one variable against another.You will now create a table of the variable incomegp by the variable gender.∙Click on Analyze, Descriptive Statistics, Crosstabs, (opens dialogue box:)∙Select the Row(s)variable incomegp and the Column(s)variable Gender using the same principles as when selecting frequencies∙Once a row and a column variable have been selected you will be able to click on OKThe Case Summary and the Crosstab will appear in Output Viewer. There are two missing values. Both men and women‟s income is the most common at £16000-17999; however, only women earn more than £20000.NB Crosstabs are an appropriate way to analyse a categorical variable against another categorical variable.Exercise 2.12: To add row and column percents to a table using crosstabs∙Repeat Exercise 11 but before selecting OK∙Click on the button∙Click on Row and/or Column and/or Total in thePercentages dialogue box (see below) to obtain thedesired percentages.∙Click on Continue, OKExercise 2.13: To calculate the arithmetic mean (average), median, mode and the standard deviation∙ Click on Analyze,Descriptive Statistics, Frequencies ∙ Select the Agevariable, then click on the right arrow to put it in the Variable(s) box. ∙ Now click on .You can see from the box to the right that there are a number of choices available to you. Depending on what measure of central tendency is required you can choose from one value or all three.∙ Select the boxesshown∙ Click Continue , then the OK button.Output Viewer as well as displaying the frequencies,displays the statistics that were selected.We can see the average age of respondents is 39.19 years, the minimum age is 18 and the maximum age is 63 years.∙ Repeat this exercise to find the average income of respondents.Obviously calculating a mean makes sense here as we are working out the average age. However we have tobe careful....Categorical variables are given a code, so if your were to ask SPSS to calculate the mean of gender for example, SPSS would take the codes for male (1) and female (2), add them all up and divide by the number of observations, which would result in a mean gender of 1.44 which doesn‟t make sense! It is therefore important that you decide what statistic makes sense for the type of data you have.Your choices for the most appropriate measure of central tendency are:Statistics ageN Valid 69Missing 1 Mean 39.19Median 39.00 Mode 29Std. Deviation 12.317 Range 45Minimum 18 Maximum 63∙Mean: Normally known as the average of the data values, used to measure interval variables but can be skewed if data contains extreme values∙Median: The mid point once all the data values have been ranked: used to measure interval and ordinal data. The median is less distorted by extreme data than the mean.∙Mode: The data value that occurs most often and the measure of central tendency that is used the least. The mode can be employed for all measurement levels but is sometimes difficult to interpret.∙Repeat the above exercise for ethnicity but also check the box to produce a bar graph.AS can be seen the Median and the Mode both indicate the Code 1 which relates to White, but sometimes it is just as effective to look at your data: the graph of ethnicity clearly depicts the white ethnic group as the most common.Exercise 2.14: To select cases for separate analysesIn the above exercise we discovered the average income of respondents is£15638.24. Sometimes we need to extract sub-sets for further analysis and we dothis by selecting cases.∙Select Data, Select Cases∙Select If condition is satisfiedin the dialogue box∙Click on IF∙Select gender and moveover to box using the blue arrow∙Use the numbers andsymbols within the dialogue boxand type in=2 (this means youare only selecting females)∙Select Continue∙Select OK∙Now go to Analyse,Descriptive Statistics,Frequencies∙Select Income (ensure the previous statistics are still selected)∙Select OKThe Output Viewer will reveal the average income for women is £15554.84.What is the average income for men?NB When you have finished analysing your subsets remember to go back into Data, Select Cases and Select All Conditions, to bring all of your data back into play.Exercise 2.15: To recode the value of a variable。
