advisor使用指南
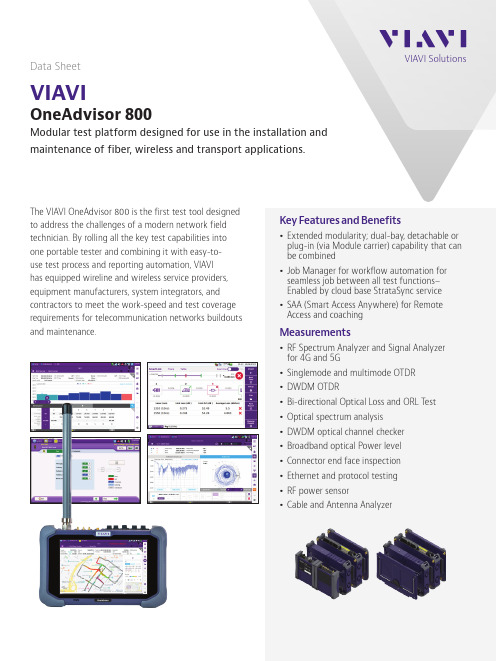
维亚维解决方案 OneAdvisor 800 产品数据表说明书
VIAVI
OneAdvisor 800
Modular test platform designed for use in the installation and maintenance of fiber, wireless and transport applications.
Size and weight (Mainframe)
Weight2ຫໍສະໝຸດ 0 kg (4.4 lb) without module (including battery)
Size (W x H x D)
270 x 170 x 60 mm (10.6 x 6.7 x 2.3 in) without module
ONA-800A-MF2G-T
OneAdvisor ONA-800A Mainframe with Display - no WiFi and Bluetooth Radios
Solution Hardware Modules
E81FMC1
Fiber module receptacle for E8100-series fiber modules
C2K-EMPTYMOD
Empty module to cover an unused expansion port
ONA-800A-DISPL ONA-800A-DISP-F ONA-800A-DISP-T
OneAdvisor Display
ONA-PMVFL
Power Meter and VFL Mainframe Module for OneAdvisor 800
AC Power with battery charging Battery discharging condition
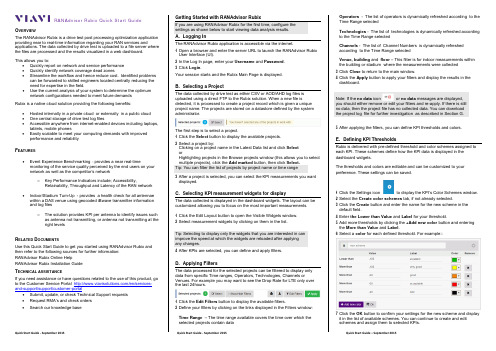
RANAdvisor Rubix 快速启动指南 - 2015年9月说明书
RANAdvisor Rubix Quick Start GuideO VERVIEWThe RANAdvisor Rubix is a drive test post processing optimization application providing near to real-time information regarding your RAN services and applications. The data collected by drive test is uploaded to a file server where the files are processed and the results visualized in a web dashboard.This allows you to:•Quickly report on network and service performance•Quickly identify network coverage dead zones•Streamline the workflow and hence reduce cost. Identified problems can be forwarded to skilled engineers located centrally reducing theneed for expertise in the field.•Use the current analysis of your system to determine the optimum network configurations needed to meet future demandsRubix is a native cloud solution providing the following benefits: •Hosted internally in a private cloud or externally in a public cloud•One central storage of drive test log files•Accessible anywhere from internet-enabled devices including laptops, tablets, mobile phones•Easily scalable to meet your computing demands with improved performance and reliabilityF EATURES•Event Experience Benchmarking - provides a near real-time monitoring of the service quality perceived by the end users on yournetwork as well as the competitor’s networko Key Performance Indicators include; Accessibility,Retainability, Throughput and Latency of the RAN network •Indoor/Stadium Turn-Up - provides a health check for all antennae within a DAS venue using geocoded iBwave transmitter informationand log fileso The solution provides KPI per antenna to identify issues such as antenna not transmitting, or antenna not transmitting at theright levelsR ELATED D OCUMENTSUse this Quick Start Guide to get you started using RANAdvisor Rubix and then refer to the following sources for further information:RANAdvisor Rubix Online HelpRANAdvisor Rubix Installation GuideT ECHNICAL ASSISTANCEIf you need assistance or have questions related to the use of this product, go to the Customer Service Portal /en/services-and-support/support/customer-portal•Submit, update, or check Technical Support requests•Request RMA’s and check orders•Search our knowledge base Getting Started with RANAdvisor RubixIf you are using RANAdvisor Rubix for the first time, configure thesettings as shown below to start viewing data analysis results.A. Logging InThe RANAdvisor Rubix application is accessible via the internet.1 Open a browser and enter the server URL to launch the RANAdvisor RubixUser Interface (UI).2 In the Log In page, enter your Username and Password.3 Click Login.Your session starts and the Rubix Main Page is displayed.B. Selecting a ProjectThe data collected by drive test as either CSV or AOD/AHD log files isuploaded using a direct FTP to the Rubix solution. When a new file isdetected, it is processed to create a project record which is given a uniqueproject name. The projects are stored on a datastore defined by the systemadministrator.The first step is to select a project.1 Click the Select button to display the available projects.2 Select a project by:Clicking on a project name in the Latest Data list and click SelectorHighlighting projects in the Browse projects window (this allows you to selectmultiple projects), click the Add marked button, then click Select.Tip: You can filter the list of projects by project name or time range3 After a project is selected, you can select the KPI measurements you wantdisplayed.C. Selecting KPI measurement widgets for displayThe data collected is displayed in the dashboard widgets. The layout can becustomized allowing you to focus on the most important measurements.1 Click the Edit Layout button to open the Visible Widgets window.2 Select measurement widgets by clicking on them in the list.Tip: Selecting to display only the widgets that you are interested in canimprove the speed at which the widgets are reloaded after applyingany changes.4 After KPIs are selected, you can define and apply filters.D. Applying FiltersThe data processed for the selected projects can be filtered to display onlydata from specific Time ranges, Operators, Technologies, Channels orVenues. For example you may want to see the Drop Rate for LTE only overthe last 24hours.1 Click the Edit Filters button to display the available filters.2 Define your filters by clicking on the links displayed in the Filters window:Time Range –The time range available covers the time over which theselected projects contain dataOperators - The list of operators is dynamically refreshed according to theTime Range selectedTechnologies - The list of technologies is dynamically refreshed accordingto the Time Range selectedChannels - The list of Channel Numbers is dynamically refreshedaccording to the Time Range selectedVenue, building and floor – This filter is for indoor measurements withinthe building or stadium where the measurements were collected3 Click Close to return to the main window.4 Click the Apply button to apply your filters and display the results in thedashboard.Note: If the no dataiconor no datamessages are displayed,you should either remove or edit your filters and re-apply. If there is stillno data, then the project file has no collected data. You can downloadthe project log file for further investigation as described in Section G.5 After applying the filters, you can define KPI thresholds and colors.E. Defining KPI ThresholdsRubix is delivered with pre-defined threshold and color schemes assigned to each KPI. These schemes define how the KPI data is displayed in the dashboard widgets.The thresholds and colors are editable and can be customized to your preference. These settings can be saved.1 Click the Settings icon to display the KPI’s Color Schemes window.2 Select the Create color schemes tab, if not already selected.3 Click the Create button and enter the name for the new scheme in the default field.4 Enter the Lower than Value and Label for your threshold.5 Add more thresholds by clicking the +Add new color button and entering the More than Value and Label.6 Select a color for each defined threshold. For example::7 Click the OK button to confirm your settings for the new scheme and display it in the list of available schemes. You can continue to create and edit schemes and assign them to selected KPIs.8 To assign a scheme to a KPI, select the Assign color schemes tab, if not already selected.9 The KPIs are grouped into Dashboard KPIs, VoLTE KPIs, eMBMS KPIs and WiFi KPIs. Select a link to view the KPIs.10 Open the dropdown list for the KPI and select the scheme you want to assign to it.11 Click the Save button to save all your changes to the KPI schemes.12 Click the Close button to apply your thresholds and display the results on the dashboard.F. Viewing the Dashboard DataThe processed data is aggregated and displayed as color-coded square bins on top of the map.•The Zoom to Data button focuses the view on the actual data present •Additional data is displayed if you click on a bin•The Automatic bin size changes button enables you to automatically change the size of Bins on a map when zooming in or out based on the map scale•Clicking the view icon allows you to switch the view to either a Line chart or Pie chart if data is available•The full screen icon allows you to view the map in full screen•For the data collected indoors with a corresponding iBwave file loaded, an image of selected floor level indoor plan is drawn over a map.G. Downloading Project Log FilesIf the KPI results show any poor performance indicators, you can download the associated log files for further analysis using a 3rd party tool1 Click the Download project files icon to download the original log files for the selected project(s). H.Managing DocumentsThe Manage Documents icon allows you to save the state of the RubixApplication in a document. It saves all the settings for selected projects, chosenfilters, the state of widgets (map/chart).1 Click the Manage Documents icon and select Save as and enter a name tosave your settings.2 To retrieve a saved document, click the Manage Documents icon and selectOpen to select a document from a list of your saved documents.I. Antenna ValidationThe Antenna Validation Report provides a health check for all antennae withina DAS venue using geocoded iBwave transmitter information and AHD log file.This report is generated for LTE and UMTS technologies.The Report table comprises of the Header, the Antenna details column andseparate report columns for the Handset and Scanner.Update button updates report after changes made in Technology, Number ofSamples or PercentileShow Problems Only button filters data from ranges colored in orange andred. If at least one value is "red" in a row, the whole corresponding row isshown.J. eMBMSIf available in the project data, you can view KPIs regarding to evolvedMultimedia Broadcast Multicast Services eMBMS. The data is displayed on theeMBMS dashboard and can be viewed as:•SINR eMBMS Line Chart•Delta eMBMS Line Chart•TableK. VoLTEIf available in the project data, you can view KPIs regarding to Voice over LTE.The data is displayed on the VoLTE dashboard and can be viewed as:•Map•Line Chart•Pie Chart•TableL. WiFiIf available in the project data, you can view KPIs regarding to WiFi. The datais displayed on the WiFi dashboard and can be viewed as:•Map•Line Chart•Pie Chart•TableRANAdvisor RubixQuick Start Guide。
advisor仿真软件安装卸载说明
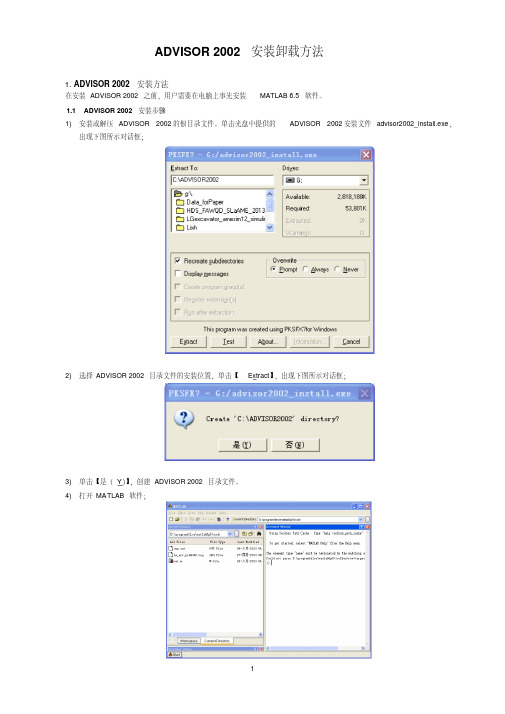
ADVISOR 2002安装卸载方法1.ADVISOR 2002安装方法在安装ADVISOR 2002之前,用户需要在电脑上事先安装MATLAB 6.5软件。
1.1 ADVISOR 2002安装步骤1)安装或解压ADVISOR 2002的根目录文件。
单击光盘中提供的ADVISOR 2002安装文件advisor2002_install.exe,出现下图所示对话框;2)选择ADVISOR 2002目录文件的安装位置,单击【Extract】,出现下图所示对话框;3)单击【是(Y)】,创建ADVISOR 2002目录文件。
4)打开MATLAB软件;5)在MATLAB的菜单栏中单击【File】>>【Set path】,出现下图所示对话框;6)在MA TLAB的菜单栏中单击【File】>>【Set path】,出现下图所示对话框;7)单击【Add Folder】,在出现的下图对话框中,找到ADVISOR2002 的根目录文件,如C:ADVISOR2002;8)单击【确定】,则将ADVISOR 2002的目录文件添加到MA TLAB的工作路径中;9)单击Set Path 对话框中的【Save】,然后单击【Close】关闭对话框;10)在MA TLAB的命令窗口键入:advisor,即可打开ADCVISOR软件界面;11)完成。
2.ADVISOR 2002卸载方法ADVISOR2002 的卸载方法比较简单,直接将ADVISOR 2002目录文件删除即可。
3.兼容高版本MATLAB的ADVISOR 2002安装卸载方法兼容高版本MA TLAB的ADVISOR 2002的使用,需要光盘中的补丁文件ADVISOR2002patchforR13.m。
3.1 兼容高版本MATLAB的ADVISOR2002 安装步骤1)将补丁文件ADVISOR2002patchforR13.m,拷贝到ADVISOR2002的目录文件中,如C:ADVISOR2002;2)将MA TLAB的工作路径,修改为ADVISOR2002的目录文件所在路径;3)在MA TLAB的命令窗口键入:ADVISOR2002patchforR13.m,将会看到ADVISOR2002的底层模块不断的更新;4)更新完成后,在MA TLAB命令窗口键入:advisor,即可运行ADVISOR;,保改成“return”,则将第25行的“break”5)如果MATLAB提示出错,则找到出错的文件,一般是“get_cycle_info.m”存后,重新运行ADVISOR即可。
advisor使用指南
advisor使用指南Advisor使用指南1. 介绍1.1 简介本文档是为Advisor(顾问)编写的使用指南。
它提供了详细的操作步骤和建议,帮助Advisor更好地完成其工作任务。
1.2 目的本文档的目的是使Advisor了解如何正确地使用各种工具、资源和流程,以便能够高效、准确地提供专业的咨询和建议。
2. 必备工具和资源2.1 电脑和办公软件Advisor使用电脑进行工作,需要具备基本的计算机操作技能,并安装以下办公软件:Microsoft Office套件(Word、Excel、PowerPoint)、邮件客户端软件等。
2.2 文档和模板Advisor需要使用各种文档和模板来记录和呈现咨询和建议。
这些文档和模板包括但不限于:项目报告、演示文稿、调研报告、市场分析报告等。
请确保您获得所需的文档和模板,并妥善保存和管理它们。
3. 工作流程3.1 项目接洽与需求梳理在开始任何项目之前,Advisor需要与客户进行接洽并梳理项目需求。
这包括与客户进行沟通、收集客户要求和目标,并明确项目的规模、时间表和预算。
3.2 数据收集与分析在进行任何咨询和建议之前,Advisor需要对相关数据进行收集和分析。
这包括市场调研、数据采集和统计分析等。
使用适当的工具和方法来处理数据,以获得准确的结果。
3.3 制定咨询和建议方案基于数据分析和市场调研结果,Advisor需要制定咨询和建议方案。
这包括明确问题陈述、提出解决方案和制定实施计划。
确保方案与客户的需求和目标相符,并在可行性和可行性方面进行充分评估。
3.4 咨询和建议实施根据制定的方案,Advisor将开始实施咨询和建议。
这可能涉及改进流程、培训团队成员、制定执行计划等。
确保与客户进行密切合作,并根据实际情况进行必要的调整和优化。
3.5 监督和评估在咨询和建议实施过程中,Advisor需要对项目进行监督和评估。
这包括监测关键指标、定期更新客户、收集反馈和评估实际结果。
ADVISOR2002使用入门
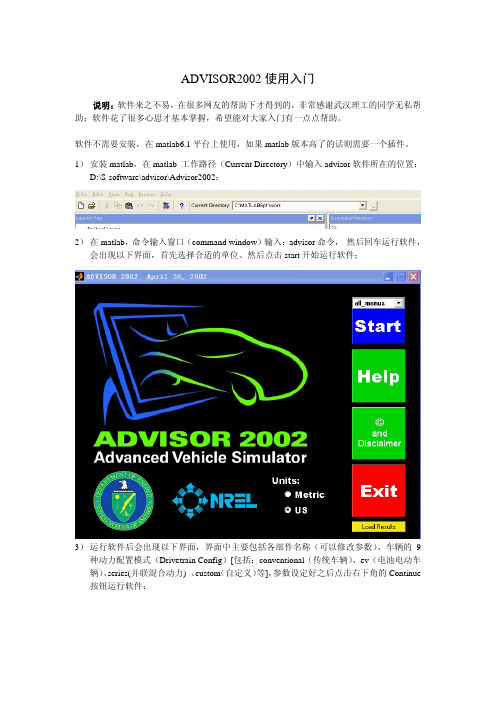
ADVISOR2002使用入门说明:软件来之不易,在很多网友的帮助下才得到的,非常感谢武汉理工的同学无私帮助;软件花了很多心思才基本掌握,希望能对大家入门有一点点帮助。
软件不需要安装,在matlab6.1平台上使用,如果matlab版本高了的话则需要一个插件。
1)安装matlab,在matlab 工作路径(Current Directory)中输入advisor软件所在的位置:D:\S-software\advisor\Advisor2002;2)在matlab,命令输入窗口(command window)输入:advisor命令,然后回车运行软件,会出现以下界面,首先选择合适的单位、然后点击start开始运行软件;3)运行软件后会出现以下界面,界面中主要包括各部件名称(可以修改参数)、车辆的9种动力配置模式(Drivetrain Config)[包括:conventional(传统车辆)、ev(电池电动车辆)、series(并联混合动力) 、custom(自定义)等],参数设定好之后点击右下角的Continue 按钮运行软件;4)点击Continue按钮运行软件之后会出现以下界面,这个界面主要设置试验工况(Drive Cycle)——其中CYC-UDDS图形表示CYC-UDDS工况下速度与时间之间的关系,界面左边浅黄色图表中的数据表示CYC-UDDS工况下一些具体参数,选择好所需要的工况模型之后,设置试验目标(点击界面右边浅黄色按钮)5)点击界面右边浅黄色按钮之后会出现以下界面,可以设置加速时间、最高车速、在一定时间内可以运行的最长距离、在一定距离内所需要的最短时间、最大加速性能、最高车速等。
设置好之后,需要选定(前面方框中选中)点击OK。
6)点击界面右边浅黄色按钮之后会出现以下界面,界面主要是设置爬坡度——以某一车速行驶一定的时间所能爬的最大坡度。
需要注意的是这里无论选用哪种单位标准,这里车速都是英里每小时,注意换算。
advisor原创教程
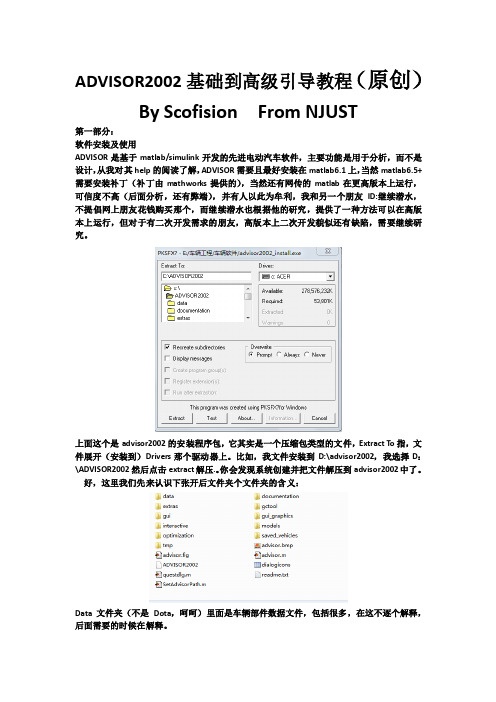
ADVISOR2002基础到高级引导教程(原创)By Scofision From NJUST第一部分:软件安装及使用ADVISOR是基于matlab/simulink开发的先进电动汽车软件,主要功能是用于分析,而不是设计,从我对其help的阅读了解,ADVISOR需要且最好安装在matlab6.1上,当然matlab6.5+需要安装补丁(补丁由mathworks提供的),当然还有网传的matlab在更高版本上运行,可信度不高(后面分析,还有弊端),并有人以此为牟利,我和另一个朋友ID:继续潜水,不提倡网上朋友花钱购买那个,而继续潜水也根据他的研究,提供了一种方法可以在高版本上运行,但对于有二次开发需求的朋友,高版本上二次开发貌似还有缺陷,需要继续研究。
上面这个是advisor2002的安装程序包,它其实是一个压缩包类型的文件,Extract T o指,文件展开(安装到)Drivers那个驱动器上。
比如,我文件安装到D:\advisor2002,我选择D:\ADVISOR2002然后点击extract解压.。
你会发现系统创建并把文件解压到advisor2002中了。
好,这里我们先来认识下张开后文件夹个文件夹的含义:Data文件夹(不是Dota,呵呵)里面是车辆部件数据文件,包括很多,在这不逐个解释,后面需要的时候在解释。
Documentation文件夹是帮助文件夹,里面都是帮助文件,当然你可以在软件开启的时候,打开,有些浏览器问题可能会打不开,你可以在浏览器地址栏输入:D:\advisor2002\documentation\advisor_ch1.htm上句地址的含义是在你所安装的advisor文件夹中找到advisor_ch1.htm文件而已。
Extras文件夹是扩展文件夹,包含着,电池模型扩展;发动机模型扩展;发动机map图转成数据图(image2map,这里的2代表to(two=to),转换的意思,开发的人为了方便,写成这样,后面有好多都是这样的表示);还有简单的数据比较文件夹;发动机比例转换;还有第三方优化软件VSOLE的文件夹。
advisor软件介绍
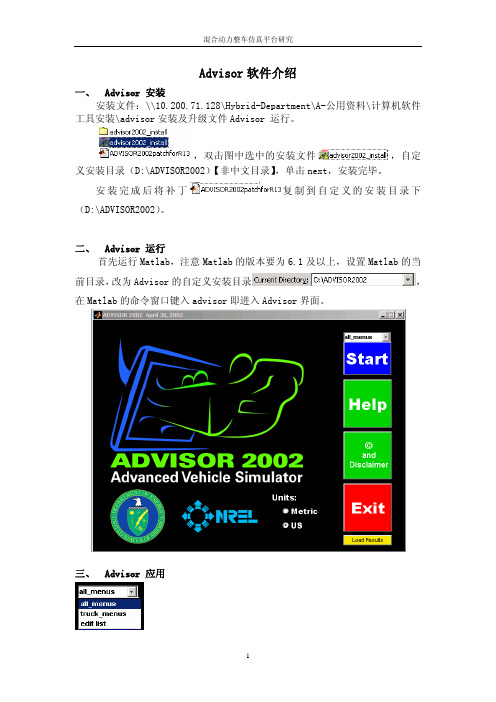
Advisor软件介绍一、 Advisor 安装安装文件:\\10.200.71.128\Hybrid-Department\A-公用资料\计算机软件工具安装\advisor安装及升级文件Advisor 运行。
,双击图中选中的安装文件,自定义安装目录(D:\ADVISOR2002)【非中文目录】,单击next,安装完毕。
安装完成后将补丁复制到自定义的安装目录下(D:\ADVISOR2002)。
二、 Advisor 运行首先运行Matlab,注意Matlab的版本要为6.1及以上,设置Matlab的当前目录,改为Advisor的自定义安装目录,在Matlab的命令窗口键入advisor即进入Advisor界面。
三、 Advisor 应用,启动Advisor,进入整车输入界面。
,获得Advisor帮助文件。
,Advisor版权及声明。
,退出Advisor。
,调入结果。
点击start按钮,进入整车输入窗口,如下图。
1.,根据所调用的动力传动系统结构的不同,所显示的整车结构图也有所不同,该图中主要包括了发动机、电机、控制器、电池等关键零部件布置及能量传递情况。
单击整车即图中绿色部分,进入整车参数编辑窗口,可以清楚的看到,该窗口可以把自定义的整车参数.m文件增加到列表中,亦可从列表中删除不需要的.m文件,查看并编辑列表中已经存在的整车参数.m文件,参数确定后,单击Done确认。
单击Help可获得相关的帮助文档。
同理,单击发动机、电机、控制器、电池等零部件,进入对应的参数编辑窗口,进行相关零部件的参数编辑。
2. ,此图是根据输入得出的直观图形,该图是发动机的效率曲线。
选择上图左侧下拉菜单,可得到不同零部件的曲线,选择右侧下拉菜单,可得到对应零部件的不同曲线。
3. ,其中load file调用的是整车所有参数,一旦选择某一车型.m文件,即可自动调用对应车型的整车、内燃机、排放、电池、电机、传动系、扭矩拟合、车轮、电器等等的参数.m文件;也可使用该车型部分参数,对其余参数进行修改。
advisor使用指南
advisor使用指南Advisor使用指南一、简介1.1 Advisor的定义1.2 Advisor的主要功能1.3 Advisor的优势二、安装与配置2.1 安装Advisor2.2 配置Advisor的基本设置2.3 添加和管理用户账号三、用户界面导览3.1 登录与注销3.2 主界面概览3.3 导航栏功能介绍3.4 个人设置与偏好四、数据管理4.1 数据导入与导出4.2 数据清理与处理4.3 数据查询与分析4.4 数据可视化与报表五、模型建立与优化5.1 创建新模型5.2 模型参数设置5.3 模型优化与调整5.4 模型评估与验证六、任务管理6.1 创建新任务6.2 任务设置与分配6.3 任务进度跟踪与管理6.4 任务结果保存与导出七、协作与协同7.1 多用户协作与权限控制 7.2 与他人共享任务与模型7.3 团队协同与项目管理八、常见问题与解决8.1 安装与配置问题8.2 数据导入与处理问题 8.3 模型建立与优化问题8.4 任务管理与协作问题九、附件附件1:Advisor安装包附件2:用户手册十、法律名词及注释1、法律名词1、注释12、法律名词2、注释2:::附件:附件1:Advisor安装包:rar 附件2:用户手册:pdf法律名词及注释:- Advisor:一种数据分析工具,用于帮助用户进行数据清洗、建模与优化等任务。
- 用户账号:用户在Advisor中的个人身份,用于登录与管理。
- 数据导入与导出:将外部数据文件导入到Advisor中,或将Advisor中的数据导出到外部文件中。
- 数据清理与处理:对数据进行清洗、转换和格式化等操作,以保证数据的质量和一致性。
- 数据查询与分析:使用查询语言或分析工具对数据进行高级查询和统计分析。
- 数据可视化与报表:通过图表、图形和报表等方式将数据可视化展示,并分析报告。
- 模型建立与优化:基于数据进行模型建立和参数优化,以实现模型的预测、分类、回归等功能。
advisor使用介绍
advisor使⽤介绍第6章 ADVISOR模拟计算软件的详细分析ADVISOR(Advanced Vehicle Simulator),是由美国国家可再⽣能源实验室开发的仿真软件,可以仿真纯电动汽车、串联式或者并联式混合动⼒电动汽车以及传统的内燃机汽车。
ADVISOR是在Matlab/Simulink下开发⽽成,它的图形⽤户界⾯可以使⽤户很容易地改变汽车模型的参数,⽽不要修改Simulink代码。
它具有各种类型的零部件模型以及很⼤的灵活性,可以仿真任何类型的HEV 和内燃机汽车。
ADVISOR可以使⽤⽤户⾃⼰订制的循环⼯矿以及各种标准⼯况,它的仿真结果包括燃油经济性、排放、加速性能等各种所需要的数据。
6.1 Matlab/Simulink 介绍Simmlink是⼀个⽤来对动态系统进⾏建模、仿真和分析的软件包。
它⽀持线性和⾮线性系统,连续和离散时间模型,或者是两者的混合。
系统还可以是多采样率的,⽐如系统的不同部分拥有不同的采样率,另外,Simulink还提供⼀套图形动画的处理⽅法,使⽤户可以⽅便地观察到仿真的整个过程。
Simulink没有单独的语⾔,但它提供了S函数规则。
所谓的S函数可以是⼀个M ⽂件、FORTRAN程序、C或C++语⾔程序等,通过特殊的语法规则使之能够被Simulink模型或模块调⽤。
S(以后有关章节详细讲解)函数使Simulink更加充实、完备,具有更强的处理能⼒。
同MATLAB⼀样,Simulink也不是封闭的,它允许⽤户可以很⽅便地定制⾃⼰的模块和模块库。
同时Simulink也同样有⽐较完整的帮助系统,使⽤户可以随时找到对应模块的说明,便于应⽤。
⽬前,随着软件的不断升级换代,Simulink在软硬件的接⼝⽅⾯有了长⾜的进步,使⽤Simulink已经可以很⽅便地进⾏实时的信号控制和处理、信息通信以及DSP的处理。
世界上许多知名⼤公司已经使⽤Simulink作为他们产品设计和开发的强有⼒⼯具,ADVISOR 就是在这种条件下产⽣的。
OneAdvisor 800 5G NR 信号分析指南说明书
5G NR Signal Analysis GuideOneAdvisor 800Table of Contents1.Scope (2)2.OneAdvisor 800 Overview (3)3.5G Radio Verification (4)3.1Overview (4)3.1.1Test Setup (4)3.1.25G Radio – Downlink Spectrum (5)3.1.3Uplink Spectrum – TDD Auto-Gated Spectrum (TAGS) (6)3.1.4PCI Scan: 5G Radio Physical Cell Identity (9)3.1.5Time Drift: 5G Time and Frequency Verification (11)4.5G Network Verification (13)4.1Overview (13)4.1.1Test Setup (13)4.1.2Network Coverage of 4G and 5G (13)4.1.3Cell Phase Synchronization (16)5.Annex (20)5.1Save Measurement Results (20)5.2Creating Maps for OneAdvisor-800 (20)6.Technical Support (23)1. ScopeThis document describes how to configure the OneAdvisor 800 for 5G NR analysis, including:- RF spectrum profile: Realtime Spectrum - TDD Interference: Gated Spectrum- PCI Scan: Carrier Scanner and Beam Analysis - Time Drift: Frequency and Time Error Variation - Cell Phase Synchronization- Coverage Map: 5G NR Route MapThe required products and parts to complete this procedure are as follows:DescriptionDiagramCellAdvisor 5G or OneAdvisor-800 with the following functions:- OneAdvisor-800 platform equipped with the followingmodules and options:o SPA06MA or SPA06MA-O: Spectrum Analyzer 9KHzto 6GHz or 9KHz to 6GHz with Optical HWo ONA-SP-GNSS: GPS connectivity with GPS antenna o ONA-SP-GSS: Gated Sweep Spectrumo ONA-SP-5GOTA: 5GNR OTA Beamforming analyzer o ONA-SP-CPS: 5G Cell Phase SynchronizationOneAdvisor-800RF Antennas:- Either of the following broadband omni-antennas:o G700050350: RF omni antenna Type-N(m); 3300 to3800 MHzo G700050345: Mag mount RF omni antenna Type-N(m) 600 MHz to 6 GHz- Either of the following broadband directional antennas:o G700050366: RF Log Periodic Antenna SMA-f 650to 4000 MHz 1.85 dBdo G700050367: RF Log Periodic Antenna SMA-f 650to 6000 MHz 2.85 dBdOmni-Antenna Mag-Mount AntennaDirectional Antenna2. OneAdvisor 800 OverviewThe OneAdvisor 800 is a portable instrument for radio access installation, maintenance, and optimization. Their main test functions include:RF Testing- Realtime Spectrum Analysis - Interference Analysis- LTE-TDD and LTE-FDD Signal Analysis - 5GNR Signal Analysis- NSA Signal Analysis (multi-carrier LTE and5G)- DSS Signal Analysis (co-channel LTE and5G)- Blind Scanner (DSS, LTE and 5G) - RFoCPRI Interference AnalysisOneAdvisor 800 Cable Testing- Reflection (Return Loss, VSWR)- Distance to Fault (Return Loss, VSWR) - Cable Loss- Insertion Gain Loss x-Haul Testing- Ethernet Test (1G, 10G, 25G, 100G) - Sync and Timing (PTP/1588) - 5G NR Discovery- Network Devices: Throughput, Latency,Frame Loss (RFC 1544 / 5180)- Ethernet Service Activation (Y.1564) Fiber Testing- Fiber inspection (Fiber Scope P5000i orFiberCheck)- Fiber Characterization (OTDR)3.5G Radio VerificationThe following procedure describes the steps to perform 5G radio verification over the air with theOneAdvisor 800.3.1OverviewThe following procedure describes the steps to perform 5G Radio Verification, including:-Downlink Spectrum: Realtime spectrum of the signal transmitted by the radio to verify carrier’s center frequency and power.-Uplink Spectrum: TDD Interference analysis with gated spectrum-PCI Scan: 5G beam analysis to verify the carrier power, modulation quality, beam forming and PCI values-Time Drift: 5G time and frequency to verify 3GPP stability requirements (≤ ± 1.5µs) against GPS.3.1.1Test SetupStep Action Description1 Power ON OneAdvisor-800 Press and hold the ON/OFF button for 3 secondsOneAdvisor-8002 For 5G radio verification, connectthe following antennas into theOneAdvisor 800:-Directional antenna into theSpectrum Analyzer RF Inport.-GPS antenna into the GNSSport.OneAdvisor 800 with RF antennas (Directional and GPS)3.1.25G Radio – Downlink SpectrumStep Action Description1 Test Mode: Realtime SpectrumAnalysis.To start real-time spectrumanalysis, select:-{Home}, {Tests}, {RadioAnalysis}, {Real-timeSpectrum}Real-time Spectrum Measurement ModeReal-time Spectrum2 Configuration: Configure theamplitude and frequency settingsby selecting:-{Settings}, if the title is not“Menu” {Back Arrow},{Frequency}, {CenterFrequency}, Enter the CenterFrequency of the 5G Carrier,{Back Arrow}, {Amp/Scale},{Auto Preamp: On}, {Auto-Scale} Frequency and Amplitude Settings3 Result: verify carrier’s centerfrequency, bandwidth, andpower level.Note:To save a measurement resultrefer to Section 5.1 SaveMeasurement Results5G Real-time Spectrum3.1.3Uplink Spectrum – TDD Auto-Gated Spectrum (TAGS)Step Action Description1 Test Mode: To test UplinkSpectrum with TAGS, select:-{Home}, {Tests}, {RadioAnalysis}, {TDD Auto-GatedSpectrum}TAGS Measurement Mode2 Configuration: Configure theamplitude and frequency settingsby selecting:-{Settings}, if the title is not“Menu” {Back Arrow},{Frequency}, {CenterFrequency}, Enter the CenterFrequency of the 5G Carrier,{Back Arrow}, {Amp/Scale},{Auto Preamp: On}, {Auto-Scale}Frequency and Amplitude Settings 5G Setup: there are two differentsetup process based on the 5Gtransmission mode (5GStandalone or 5G non-Standalone). To select the propersetup, select:-{Back Arrow}, {Setup}, if 5G isstandalone the select {AutoConfiguration}, else select{Manual Configuration (NR)} 5G Stand-Alone and 5G Non-Stand-Alone Setup 4 5G Standalone Setup: Set the 5Gsignal properties by selecting:-Center Frequency field, enterthe center frequency of the5G carrier-Case field, select the case(sub-carrier spacing) of the5G signal from the drop-list.-Bandwidth field, select thebandwidth of the 5G carrierfrom the drop-list.-SSB Periodicity field: selectthe SSB periodicity of the 5Gsignal, standard is 20ms.-Enable SSB Auto Search withthe check-box and select{Search}-Select {Analysis Mode}5G Standalone5 5G Non-Standalone Setup: Setthe 5G signal properties byselecting:-{Settings}, if the title is not“Menu” {Back Arrow},{Frequency}, {CenterFrequency}, Enter the CenterFrequency of the 5G Carrier,{Back Arrow}, {Amp/Scale},{Auto Preamp: On}, {Auto-5G Frequency and Amplitude Settings Scale}-{Bandwidth/SSB SCS}, selectthe bandwidth and sub-carrier spacing of the 5G signal from the list, {Apply} - Beam can be found by selecting {Settings}, {SSB Auto Search}, {Start}Set the gate window to uplink slot and symbol by selecting: - {Manual Configuration (NR)}, {Gate Window Settings}, {P vs T Slot view}, {Frame} - {Auto-Scale}, {Check Periodicity}, {Deviation}- NR/Frame : Set the Downlink, Uplink and Pattern 2 slots according to the deviation, selecting:o {Downlink}, enter thenumber of downlink slots from the beginning of the frame.o {Uplink}, enter thenumber of uplink slots. o {Pattern 2}, enter secondpattern slots, if needed. o Select the transmissionslot with the swipe icono {Next}- NR/Slot : Set the Downlink, Uplink symbols, and the Gate Window start symbol and width, by selecting:o {Downlink}, enter thenumber of downlink symbols.o {Uplink}, enter thenumber of uplink symbols.o Gate Widow: StartSymbol field, enter the starting window slot o Gate Window: Symbolwidth field, enter the number of symbols for the window width.5G non-StandaloneGate Window Settings5G Frame Periodicity and DeviationNR/Frame ConfigurationNR/Slot Configuration6 Result: verify uplink spectrumactivity to detect interference.Note 1:Analyze TAGS with Spectrum,Spectrogram, PersistentSpectrum, PersistentSpectrogram, RSSI, InterferenceFinder, or Radar Chart byselecting:Note 2:To save a measurement resultrefer to Section 5.1 Save5G Uplink Spectrum Analysis Measurement Results3.1.4PCI Scan: 5G Radio Physical Cell IdentityStep Action Description1 Test Mode: 5G Beam Analysis.To start 5G beam analysis, select:-{Home}, {Tests}, {RadioAnalysis}, {5G NR SignalAnalyzer}, {Menu}, {BeamAnalyzer}, {Done}5G NR Signal Analyzer / Beam Analyzer Measurement Mode2 Configuration: Set the 5G signalproperties by selecting:-{Settings}, if the title is not“Menu” {Back Arrow},{Frequency}, {CenterFrequency}, Enter the CenterFrequency of the 5G Carrier,{Back Arrow}, {Amp/Scale},{Auto Preamp: On}, {Auto-Scale}-{Settings}, if the title is not “Setup”, {Back Arrow},{Bandwidth/SSB SCS}, selectthe bandwidth and sub-carrier spacing of the 5Gsignal from the list, {Apply} -{Settings}, Beam can befound by selecting {SSB Auto Search}, {Start}Frequency and Amplitude Settings Bandwidth and Sub-carrier Spacing and SSB Frequency Settings3 Result: verify carrier’s PCIs arethose configured at the radio.Note:To save a measurement resultrefer to Section 5.1 SaveMeasurement Results5G Signal Analysis – PCI Scan3.1.5Time Drift: 5G Time and Frequency VerificationStep Action Description1 Test Mode: 5G Beam Analysis.To start 5G beam analysis, select:-{Home}, {Tests}, {RadioAnalysis}, {5G NR SignalAnalyzer}, {Menu}, {BeamAnalyzer}, {Done}5G NR Signal Analyzer / Freq / Time/ Power Variation Mode2 Configuration: Set the 5G signalproperties by selecting:-{Settings}, if the title is not“Menu” {Back Arrow},{Frequency}, {CenterFrequency}, Enter the CenterFrequency of the 5G Carrier,{Back Arrow}, {Amp/Scale},{Auto Preamp: On}, {Auto-Scale}-{Settings}, if the title is not “Setup”, {Back Arrow},{Bandwidth/SSB SCS}, selectthe bandwidth and sub-carrier spacing of the 5Gsignal from the list, {Apply} -{Settings}, Beam can befound by selecting {SSB AutoSearch}, {Start}Set the sync and timing reference to GPS by selecting: -{Back Arrow}, {Trigger/Freq Ref}, {Trigger}, {GPS},{Frequency Reference}, {GPS}Frequency and Amplitude Settings Bandwidth and Sub-carrier Spacing and SSB Frequency Settings Sync and Timing Reference ConfigurationStep Action DescriptionAmplitude / Scale Reference and Scale Configuration 3 Result: Verify that the timereference is within 3GPP stabilityrequirements (≤ ± 1.5µs) againstGPS.Note:To save a measurement resultrefer to Section 5.1 SaveMeasurement Results5G Signal Analysis – Sync and Timing Verification4.5G Network VerificationThe following procedure describes the steps to perform 5G network verification over the air with the OneAdvisor 800.4.1OverviewThe following procedure describes the steps to perform 5G network verification, including:-Network Coverage: signal strength network coverage of 5G and 4G.-Cell Phase Synchronization: network synchronization verification.4.1.1Test SetupStep Action Description1 Power ON OneAdvisor-800 Press and hold the ON/OFF button for 3 secondsOneAdvisor-8002 For 5G network verification, thefollowing antennas into theOneAdvisor 800:-Either of the omni-directionalantennas into the SpectrumAnalyzer RF In port.-GPS antenna into the GNSSport.OneAdvisor 800 with RF antennas (Omni-directional and GPS)4.1.2Network Coverage of 4G and 5GStep Action Description1 Test Mode: NSA Beam Analysis.To start 5G beam analysis, select:-{Home}, {Tests}, {RadioAnalysis}, {NSA SignalAnalyzer}, {Menu}, {NSAAnalyzer}, {Online NSA RouteMap}, {Done}NSA Signal Analyzer / NSA Analyzer Mode2 Configuration : Set the 4G and 5G signal properties by selecting: - {Settings}, {Configuration}- Carrier Configuration: o Select the carrier number to be configured.o Select the toggle buttonto enable the carrier to be configured.o Select the carrier type tobe configured. - Center Frequency o Enter the center frequency of the carrier, alternatively, enter the channel number - Channel Numbero Enter the 5G channelnumber- Bandwidth/SSB SCSo In case of 5G carrier, inthis field select thecorresponding Bandwidth and Sub-Carrier Spacing- Auto Search o Automatically search the SSB- In case or LTE carriers: o Select the carrier type o Set the bandwidth fromthe list.- To start making outdoorsignal coverage make sure the GPS antenna is connected and the GPS is lockedConfigurationCarrier ConfigurationCenter FrequencyChannel NumberIn case of 5G: Select the 5G Bandwidth and SSB SCSLTE Mode and Bandwidth Configuration3 To start the Online RouteMeasurement, select:-Close Configuration-Center Map-Start Measurement-Start the drive-test-To suspend themeasurement, select Pause-To finish the measurement, select Stop- A pop-up window will be displayed, to confirm themeasurement has beencompleted select Yes- A pop-up window will be displayed, to save themeasurement select Yes -Select the desire file type formats-Select the file name field -Enter the file name-Select Done-Select SaveResult: verify network signal coverage of 4G and 5G. Note:To save a measurement result refer to Section 5.1 Save Measurement ResultsStart Online Route Measurements4G and 5G Network Coverage Cell Phase Synchronization Map ControlStop MeasurementSave MeasurementFile type formatsEnter the file name4.1.3Cell Phase SynchronizationStep Action Description1 Test Mode: 5G Beam Analysis,To start 5G beam analysis, select:-{Home}, {Tests}, {RadioAnalysis}, {5G NR SignalAnalyzer}, {Menu}, {5G NRSignal Analyzer}, {SyncAnalysis}, {Done}5G NR Signal Analyzer / Cell Phase Synchronization Mode2 Configuration: Set the 5G signalproperties by selecting:-{Settings}, if the title is not“Menu” {Back Arrow},{Frequency}, {CenterFrequency}, Enter the CenterFrequency of the 5G Carrier,{Back Arrow}, {Amp/Scale},{Auto Preamp: On}, {Auto-Scale} Frequency and Amplitude Settings-{Settings}, if the title is not “Setup”, {Back Arrow},{Bandwidth/SSB SCS}, selectthe bandwidth and sub-carrier spacing of the 5Gsignal from the list, {Apply} -{Settings}, Beam can befound by selecting {SSB AutoSearch}, {Start}Set the sync and timing reference to GPS by selecting: -{Back Arrow}, {Trigger/Freq Ref}, {Trigger}, {GPS},{Frequency Reference}, {GPS}Set the Cell Phase Synchronization limit by selecting:-{Back Arrow}, {Limit}, {Test Limits: ON} Bandwidth and Sub-carrier Spacing and SSB Frequency SettingsSync and Timing Reference ConfigurationCPS Limit Configuration3 Result: Verify that the Cell PhaseSynchronization is within 3GPPrequirements (≤ ± 3µs).Note:To save a measurement resultrefer to Section 5.1 SaveMeasurement Results5G Signal Analysis – Cell Phase Synchronization Verification 4 Test Mode: Cell PhaseSynchronization Route Map,To start 5G Sync Route Map,select:-{Menu}, {5G Signal Analyzer}, {Sync Route Map}, {Done}-Create a compatible map, as described on Section 5.2Creating Maps forOneAdvisor-800-Load the compatible map by selecting:o{Folder}, Select thecompatible map from thelist, {Load}-To start making outdoor cell phase synchronizationnetwork make sure the GPSantenna is connected and theGPS is locked-Select {Play}-Start the drive-test-To suspend themeasurement, select Pause-To finish the measurement, select Stop- A pop-up window will bedisplayed, to confirm themeasurement has beencompleted select Yes- A pop-up window will bedisplayed, to save themeasurement select Yes-Select the desire file type formats-Select the file name field-Enter the file name-Select Done-Select SaveResult: Verify that the Cell Phase Synchronization is within 3GPP requirements (≤ ± 3µs). 5G NR Signal Analyzer – Sync Route Map Measurement ModeLoad Compatible MapCell Phase Synchronization NetworkCell Phase Synchronization Map ControlStop MeasurementSave MeasurementFile type formats Enter the file name5.Annex5.1Save Measurement ResultsThe following procedure describes the steps to save measurement results with OneAdvisor-800 Step Action Description1 Saving measurements-Select the save icon andenter file name-Select the type of file tosave:o Result (to bereplayed or post-processed by theCellAdvisor 5G)o Result as CSV, to bepost-processed by aPC applicationo Screen, as a picture -Select the destination to save the file-Select “Save”Save and File Name SequenceFile Type as Result, Result as CSV or Screen Select the destination either Internal or USBSelect Save5.2Creating Maps for OneAdvisor-800 Step Action Description1 Open JDMapCreatorapplication Run the application software JDMapCreator* and select the CellAdvisor platform type, for example, [CellAdvisor 5G]:JDMapCreator > CellAdvisor 5G*Note: JDMapCreator is a free application software of Viavi Solutions’ CellAdvisor instruments that can be downloaded at / on the section CellAdvisor AppSW2 Set the number of maplayers to be created:-Select Settings-Select Map Layers-Select Single or Multiple Configure the number of layers to be created on the map:a.Single, creates 1-layer map (no zooming)b.Multiple, creates 3-layer mar (zooming available)Multiple Map Layers3 Create a geo-coordinatesmap.-Select Capture Map-Select Open GoogleMaps-Enter the Address ofinterest-Select Search-Select Capture To set a map with geo-coordinates select [Capture Map], [Open Google Maps], as follows:Capture Map > Open Google MapsSearch the location of the interest test area by entering the address in the [Address] field, as follows:Search AddressOnce the test area has been located, select [Capture] to create the single or multi-layer map, as follows:Map Capture4 Save the created map intoa USB memory:-Select File-Select Save-Enter the file name-Select Save buttonNote: Make sure the mapfile (*.mcfv) is saved on aUSB memory drive.Save the map into a USB memory device:File > Save > File Name > Save6.Technical SupportTechnical support is provided by:§Phone: 1-844-GO-VIAVI (1-844-468-4284) options 3-2-3§Email: **********************************Regularly new firmware updates for the CellAdvisor 5G are released and it is recommended to keep the instrument in the latest firmware to provide all the enhancements and bug fixes.§For firmware updates go to: /§For additional information of cell site test go to:/en/products/network-test-and-certification/cell-site-test。
ADVISOR使用指南
ADVISOR的使用这一章将着重讲解利用GUI及Matlab命令行的简单指令,来使用ADVISOR。
2.1使用GUI(图形用户界面)首先介绍如何启动ADVISOR。
由于Matlab版本不断升级,在装载ADVISOR2002工具包后,必须利用advisor2002patchforR13.m文件对其进行更新,以便适应高版本的Matlab。
现在推荐的启动方式为:●先启动Matlab,进入其工作界面;●在命令栏输入“advisor”并回车,或在路径窗口中找到advisor.m文件,进入文件并点击运行按钮。
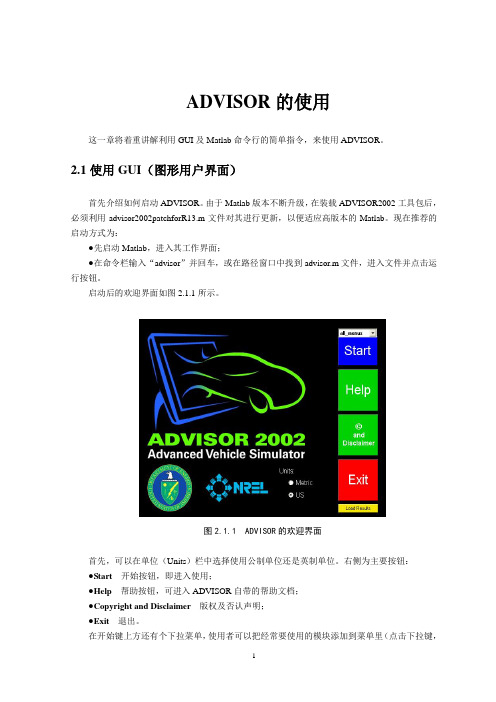
启动后的欢迎界面如图2.1.1所示。
图2.1.1 ADVISOR的欢迎界面首先,可以在单位(Units)栏中选择使用公制单位还是英制单位。
右侧为主要按钮:●Start 开始按钮,即进入使用;●Help 帮助按钮,可进入ADVISOR自带的帮助文档;●Copyright and Disclaimer 版权及否认声明;●Exit 退出。
在开始键上方还有个下拉菜单,使用者可以把经常要使用的模块添加到菜单里(点击下拉键,选择edit list来实现添加,如图2.1.2所示),在开始仿真前就选好模块,提高效率。
图2.1.2 利用下拉菜单预先选择模块2.2定义车辆点击Start进入定义值输入界面。
进入后可看到一系列定义车辆的缺省值,如图2.2.1所示。
图2.2.1 定义值输入界面动力传动类型选择从动力传动类型的菜单(界面右部顶端第二个下拉菜单,名为“Drivetrain Config”)中选择车辆的动力传动构造类型(例如串联型、并联型等等)。
一旦更改类型,会导致左侧的汽车图示一起改变,以便形象地显示现在所选的动力传动结构。
选定动力传动类型后,此种类型所需的各个部件也会做出相应的更改调整。
这里将缺省值parallel(混合动力车,发动机与电动机并联)改为conventional(传统汽车),变化如图2.2.2所示。
可以明显看到,图示车辆的动力传动结构变成了熟悉的传统布局。
安捷伦 Lab Advisor 用户手册
Agilent Lab Advisor 用户手册Agilent Technologies声明© 安捷伦科技有限公司, 2016-2018根据美国和国际版权法,未经 Agilent Technologies, Inc. 事先同意和书面许 可,不得以任何形式、任何方式(包括 存储为电子版、修改或翻译成外文)复 制本手册的任何部分。
手册部件号M8550-97007 Rev. B版本05/2018Germany印刷Agilent TechnologiesHewlett-Packard-Strasse 876337 Waldbronn 担保说明本文档内容按 “ 原样 ” 提供,在将来的版本中如有更改,恕不另行通知。
此外,在适用法律允许的最大范围内,Agilent 对本手册以及此处包含的任何信息不作任何明示或暗示担保,包括但不仅限于适销性和针对某一特殊用途的适用性的暗示担保。
对于因提供、使用或执行本手册或此处包含的任何信息而产生的错误,或造成的偶然或必然的损失,Agilent 不承担任何责任。
如果 Agilent 与用户签订了单独的书面协议,其中涉及本文档内容的担保条款与这些条款冲突,则以协议中的担保条款为准。
技术许可本文档中所述的硬件和 / 或软件是根据许可提供的,只能根据此类许可的条款进行使用或复制。
权力限制说明美国政府受限权利。
授予联邦政府的软件和技术数据权利仅包括通常提供给最终用户的那些权利。
Agilent 根据FAR12.211(技术数据)和 12.212(计算机软件)和 (对于国防部)DFARS252.227-7015 (技术数据 -商品)以及DFARS 227.7202-3(商业计算机软件或计算机软件文档中的权利)来提供软件和技术数据方面的此常规商业许可。
安全警告小心提示表示危险。
提醒您注意某个操作步骤、某项操作或类似问题,如果执行不当或未遵照提示操作,可能会损坏产品或丢失重要数据不要忽视小心提示,直到完全理解和符合所指出的条件。
ADVISOR中文说明
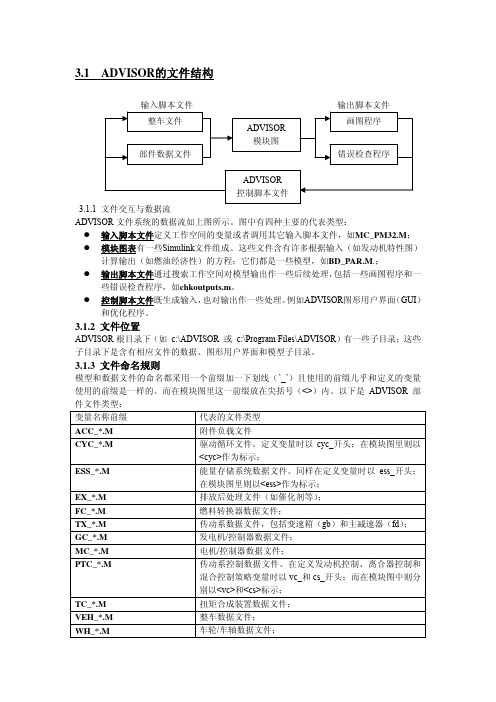
3.1 ADVISOR的文件结构3.1.1ADVISOR文件系统的数据流如上图所示。
图中有四种主要的代表类型:z输入脚本文件定义工作空间的变量或者调用其它输入脚本文件,如MC_PM32.M;z模块图表有一些Simulink文件组成。
这些文件含有许多根据输入(如发动机特性图)计算输出(如燃油经济性)的方程;它们都是一些模型,如BD_PAR.M.;z输出脚本文件通过搜索工作空间对模型输出作一些后续处理,包括一些画图程序和一些错误检查程序,如chkoutputs.m。
z控制脚本文件既生成输入,也对输出作一些处理。
例如ADVISOR图形用户界面(GUI)和优化程序。
3.1.2 文件位置ADVISOR根目录下(如 c:\ADVISOR 或 c:\Program Files\ADVISOR)有一些子目录;这些子目录下是含有相应文件的数据、图形用户界面和模型子目录。
3.1.3 文件命名规则模型和数据文件的命名都采用一个前缀加一下划线(’_’)且使用的前缀几乎和定义的变量使用的前缀是一样的。
而在模块图里这一前缀放在尖括号(<>)内。
以下是ADVISOR部件文件类型:变量名称前缀代表的文件类型ACC_*.M附件负载文件CYC_*.M驱动循环文件。
定义变量时以cyc_开头;在模块图里则以<cyc>作为标示;ESS_*.M能量存储系统数据文件。
同样在定义变量时以ess_开头;在模块图里则以<ess>作为标示;EX_*.M排放后处理文件(如催化剂等);FC_*.M燃料转换器数据文件;TX_*.M传动系数据文件,包括变速箱(gb)和主减速器(fd);GC_*.M发电机/控制器数据文件;MC_*.M电机/控制器数据文件;PTC_*.M 传动系控制数据文件。
在定义发动机控制、离合器控制和混合控制策略变量时以vc_和cs_开头;而在模块图中则分别以<vc>和<cs>标示;TC_*.M 扭矩合成装置数据文件;VEH_*.M 整车数据文件;WH_*.M车轮/车轴数据文件;除了上述部件数据文件外,还有另一种类型文件也用前缀定义:BD_*.M-----代表Simulink模块图(模型);所有带前缀文件名用大写字母,而变量名则全部采用小写字母,以免相互混淆。
ADVISOR使用
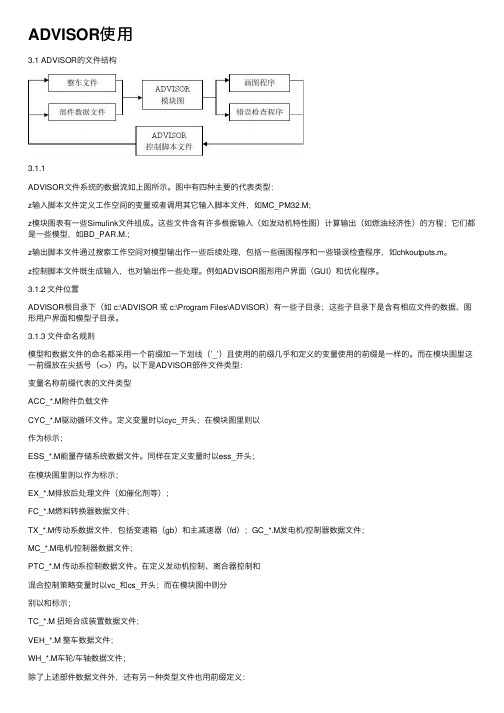
ADVISOR使⽤3.1 ADVISOR的⽂件结构3.1.1ADVISOR⽂件系统的数据流如上图所⽰。
图中有四种主要的代表类型:z输⼊脚本⽂件定义⼯作空间的变量或者调⽤其它输⼊脚本⽂件,如MC_PM32.M;z模块图表有⼀些Simulink⽂件组成。
这些⽂件含有许多根据输⼊(如发动机特性图)计算输出(如燃油经济性)的⽅程;它们都是⼀些模型,如BD_PAR.M.;z输出脚本⽂件通过搜索⼯作空间对模型输出作⼀些后续处理,包括⼀些画图程序和⼀些错误检查程序,如chkoutputs.m。
z控制脚本⽂件既⽣成输⼊,也对输出作⼀些处理。
例如ADVISOR图形⽤户界⾯(GUI)和优化程序。
3.1.2 ⽂件位置ADVISOR根⽬录下(如 c:\ADVISOR 或 c:\Program Files\ADVISOR)有⼀些⼦⽬录;这些⼦⽬录下是含有相应⽂件的数据、图形⽤户界⾯和模型⼦⽬录。
3.1.3 ⽂件命名规则模型和数据⽂件的命名都采⽤⼀个前缀加⼀下划线(’_’)且使⽤的前缀⼏乎和定义的变量使⽤的前缀是⼀样的。
⽽在模块图⾥这⼀前缀放在尖括号(<>)内。
以下是ADVISOR部件⽂件类型:变量名称前缀代表的⽂件类型ACC_*.M附件负载⽂件CYC_*.M驱动循环⽂件。
定义变量时以cyc_开头;在模块图⾥则以作为标⽰;ESS_*.M能量存储系统数据⽂件。
同样在定义变量时以ess_开头;在模块图⾥则以作为标⽰;EX_*.M排放后处理⽂件(如催化剂等);FC_*.M燃料转换器数据⽂件;TX_*.M传动系数据⽂件,包括变速箱(gb)和主减速器(fd);GC_*.M发电机/控制器数据⽂件;MC_*.M电机/控制器数据⽂件;PTC_*.M 传动系控制数据⽂件。
在定义发动机控制、离合器控制和混合控制策略变量时以vc_和cs_开头;⽽在模块图中则分别以和标⽰;TC_*.M 扭矩合成装置数据⽂件;VEH_*.M 整车数据⽂件;WH_*.M车轮/车轴数据⽂件;除了上述部件数据⽂件外,还有另⼀种类型⽂件也⽤前缀定义:BD_*.M-----代表Simulink模块图(模型);所有带前缀⽂件名⽤⼤写字母,⽽变量名则全部采⽤⼩写字母,以免相互混淆。
ADVISOR总结
1.ADVISOR入门总结1.1.ADVISOR是什么用于仿真各种汽车(包括电动车和内燃机车)的仿真软件。
将整车分为不同模块建立模型,仿真整车,由此测试、分析汽车各性能。
特点:采用MATLAB/simulink语言1.2.ADVISOR如何用安装好软件后,通过在MATLAB中设置ADVISOR路径,即在MATLAB 工作目录中设置:AdvisorPath,在MATLAB命令行输入advisor,通过MATLAB 打开软件。
ADVISOR有三个界面:整车参数界面、仿真参数输入界面、仿真运行结果界面。
1.2.1.ADVISOR安装Advisor2002需要用MATLAB6.1打开,先安装MATLAB6.1,将advisor2002文件放入MATLAB6.1安装文件内。
(1)打开matlab6.1,设置目录:E:\MATALB6.1SYSTEM\work。
(2)在matlab工作区直接键入advisor,打开advisor界面,国内数据单位选择metric,(国外一般选择英制),并打击start(如图1)。
图11.2.2.整车参数的输入整车参数输入的方式有两种:M文件导入和界面按钮直接数字输入。
(1)出现图2所示界面后,在Drivertrain Config (红色框线部分)下拉选项中选择动力传动系统结构,选择EV(即选择纯电动结构)。
图2(2)图2中蓝色框标出部分为整车零部件参数设置部分。
行为零部件名称(如黄色框线标记),列为version,type,和对应的参数M 文件(version&type 的区别:version 是针对零部件的分类;type 是针对version 的分类)。
根据目标车型性能参数,找到M文件设置参数值。
(3)不同M文件代表的含义如表1所示,如有其他相关文件代表含义可直接查看HELP。
表1变量名称前缀代表的文件类型ACC_*.M 附件负载文件CYC_*.M 驱动循环文件。
advisor使用指南
NREL, CENTER FOR TRANSPORTATION TECHNOLOGIES AND SYSTEMS 2
ADVISOR的使用流程
NREL, CENTER FOR TRANSPORTATION TECHNOLOGIES AND SYSTEMS 3
仿真参数的输入
通过这个界面 , 可以输入汽车的 各种参数以对汽车进行定义。界面 左侧为汽车相关图像信息, 右侧为 相关操作区域, 图像信息的显示随 着用户操作的不同会有相应变化。 图中界面左上方为汽车的结构示意 图 , 标识了汽车的整个动力传动系 统结构和能量的传递方向 , 单击图 中的每个汽车部件都会弹出一个对 话框 , 通过它可以读取已经存储的 部件数据 , 也可查看或编辑相应的 m文件;左下方为发动机或传动系统 的某个总成的性能曲线 , 可以根据 自己的需要通过下拉菜单选择要显 示的其中一种曲线 , 图中所示即为 发动机在不同转速和转矩下消耗的 能量曲线。最后 , 用户可以将定义 好的汽车文件进行保存 , 以便以后 仿真时可直接调用。
仿真结果
NREL, CENTER FOR TRANSPORTATION TECHNOLOGIES AND SYSTEMS 11
说明
在此期间,作者只是初步认识了软件 ADVISOR 的使用方法,在此后还要更好的去学习研究!进而 在ADVISOR的基础上进行二次开发,充分利用其中 现有的大部分模型,仅对少数不符合使用要求的模 型进行改造或者重新建模,为我国汽车企业设计电 动汽车提供技术支持的产品。
veh_glider_mass = 1126kg % vehicle width = 1480mm % vehicle height = 1480mm(源文件为英尺,需要转换为英尺。一英寸=2.54厘米)
- 1、下载文档前请自行甄别文档内容的完整性,平台不提供额外的编辑、内容补充、找答案等附加服务。
- 2、"仅部分预览"的文档,不可在线预览部分如存在完整性等问题,可反馈申请退款(可完整预览的文档不适用该条件!)。
- 3、如文档侵犯您的权益,请联系客服反馈,我们会尽快为您处理(人工客服工作时间:9:00-18:30)。
仿真结果
NREL, CENTER FOR TRANSPORTATION TECHNOLOGIES AND SYSTEMS 11
说明
在此期间,作者只是初步认识了软件ADVISOR 的使用方法,在此后还要更好的去学习研究!进而 在ADVISOR的基础上进行二次开发,充分利用其中 现有的大部分模型,仅对少数不符合使用要求的模 型进行改造或者重新建模,为我国汽车企业设计电 动汽车提供技术支持的产品。
ADVISOR的使用流程
NREL, CENTER FOR TRANSPORTATION TECHNOLOGIES AND SYSTEMS 3
仿真参数的输入
通过这个界面, 可以输入汽车的 各种参数以对汽车进行定义。界面 左侧为汽车相关图像信息, 右侧为 相关操作区域, 图像信息的显示随 着用户操作的不同会有相应变化。 图中界面左上方为汽车的结构示意 图,标识了汽车的整个动力传动系 统结构和能量的传递方向,单击图 中的每个汽车部件都会弹出一个对 话框,通过它可以读取已经存储的 部件数据,也可查看或编辑相应的 m文件;左下方为发动机或传动系统 的某个总成的性能曲线,可以根据 自己的需要通过下拉菜单选择要显 示的其中一种曲线,图中所示即为 发动机在不同转速和转矩下消耗的 能量曲线 。 最后,用户可以将定义 好的汽车文件进行保存,以便以后 仿真时可直接调用。
ADVISOR2002 (高级车辆仿真器)应用指南
作者:王群 E-mail:545035199@
2009.7
NREL, CENTER FOR TRANSPORTATION TECHNOLOGIES AND SYSTEMS 1
ADVISOR 简介
ADVISOR(Advanced Vehicle Simulator, 高级车辆仿真器)
NREL, CENTER FOR TRANSPORTATION TECHNOLOGIES AND SYSTEMS 12
此课件下载可自行编辑修改,此课件供参考! 部分内容来源于网络,如有侵权请与我联系删除!感谢你的观看!
最大行驶速度为120km/h平均速度为32.1km/h,最大加速度为1.05m/s2,最大 减速度为-1.39m/s2
NREL, CENTER FOR TRANSPORTATION TECHNOLOGIES AND SYSTEMS 8
根据整车技术参数修改脚本文件
由所给条件需要修改VEH_、MC_、ESS_三个M文件。 VEH_文件修改如下:(在源文件VEH_EV1定义上做相应修改)
NREL, CENTER FOR TRANSPORTATION TECHNOLOGIES AND SYSTEMS 4
ห้องสมุดไป่ตู้
仿真参数的设置
通过这个界面可以选择试验 方案和设定仿真初始条件。 界面右侧上方可以设置仿真 条件, 如道路循环、时间阶 跃、循环次数、 初始条件 等,道路坡度、 是否交互仿 真以及是否进行加速度测试 和爬坡能力测试为可选项, 用户可以根据需要进行选择 ;右侧下方可以对最多3个部 件参数进行灵敏度分析,有 助于研究这些参数对汽车性 能的影响,为汽车的设计提 供参考。界面左侧为道路循 环相关信息,左侧上方为所 选道路循化的轨迹曲线。
NREL, CENTER FOR TRANSPORTATION TECHNOLOGIES AND SYSTEMS 7
通过实例介绍ADVISOR的使用过程
二、整车动力性能仿真
1.整车技术参数
2.循环工况的选择
当前评价整车性能的循环工况主要有ECE-EUDC,UDDS和HWFET,我国 主要以ECE-EUDC循环工况为主。循环周期为1225s,行驶距离为10.93km,
是由美国可再生能源实验室NREL(National
Renewable
Energy Laboratory) 在 MATLAB和 SIMULINK 软件环境下开
发的高级车辆仿真软件。该软件从 1994 年 11 月份开始开发
和使用, 最初是用来帮助美国能源部 DOE (Department of
Energy)开发某混合动力汽车的动力系统, 随后功能逐渐扩展,
NREL, CENTER FOR TRANSPORTATION TECHNOLOGIES AND SYSTEMS 5
查看仿真结果
NREL, CENTER FOR TRANSPORTATION TECHNOLOGIES AND SYSTEMS 6
通过实例介绍ADVISOR的使用过程 实验:基于Advisor的纯电动汽车动力性能仿真 一、仿真模型的建立 1.蓄电池的仿真模型建立 2.电机仿真模型的建立 3.整车仿真模型的建立
目前最新的正式版本 ADVISOR2002 可以对传统汽车、纯电
动汽车和混合动力汽车的各种性能作快速分析, 是世界上能
在网站上免费下载和用户数量最多的汽车仿真软件。由于该
软件通过大量的实践被证实具有较好的实用性, 现在世界上
许多生产企业、研究机构和高校都在使用该软件做汽车仿真
方面的研究。
NREL, CENTER FOR TRANSPORTATION TECHNOLOGIES AND SYSTEMS 2
veh_glider_mass = 1126kg % vehicle width = 1480mm % vehicle height = 1480mm(源文件为英尺,需要转换为英尺。一英寸=2.54厘米)
% veh_wheelbase=260mm
MC_文件修改:
MC_文件可选择软件自带的MC_AC124_EV1_draft文件进行仿真
ESS_文件修改:
ESS_文件可选择软件自带的ESS_NIMH60_OVONIC文件进行仿真
NREL, CENTER FOR TRANSPORTATION TECHNOLOGIES AND SYSTEMS 9
导入脚本文件
NREL, CENTER FOR TRANSPORTATION TECHNOLOGIES AND SYSTEMS 10
