仪器分析第一章
仪器分析化学 第一章 色谱基本理论

n理5.54 (Yt1R /2)216 (tYR)2
n有效
5.54( tR' Y1/ 2
)2
16(tR' Y
)2
H有效
L n有效
(二) 塔板数和塔板高度
组分在固定相中的浓度 K 组分在流动相中的浓度
一定温度下,组分的分配系数K越大,出峰越慢; 试样一定时,K主要取决于固定相性质; 选择适宜的固定相可改善分离效果; 试样中的各组分具有不同的K值是分离的基础; 某组分的K = 0时,即不被固定相保留,最先流出。 同一条件下,若两组分的K值相等,则色谱峰重合, 差别越大,色谱峰的距离越大
三. 速率理论-影响柱效的因素
(一). 范.弟姆特(Van Deemter)方程式- 气相色谱速率理论
H = A + B/u + C·u
H:理论塔板高度, u:载气的线速度(cm/s)
减小A、B、C三项可提高柱效; 存在着最佳流速; A、B、C三项各与哪些因素有关?
A─涡流扩散项(eddy diffusion)
(四) 分配比与保留时间的关系
tR = tM(1+k) tR’=ktM
(五) 分配比、分配系数与选择性因子的关系
a = t´R(2)/ t´R(1)= k2 /k1= K2 /K1
讨论:如何使A、B组分完全分离
浓
度
A
B
A
B
组分A、B在沿柱移动时不同位置的浓度轮廓
1.两组分的分配系数必须有差异 2.区域宽度的扩展速度应小于区域分离的速度 3.在保证快速分离的前提下,提供足够长的色谱柱
仪器分析完整版(详细)
第一章绪论1.仪器分析是以物质的物理组成或物理化学性质为基础,探求这些性质在分析过程中所产生分析信号与被分析物质组成的内在关系和规律,进而对其进行定性、定量、进行形态和机构分析的一类测定方法,由于这类方法的测定常用到各种比较贵重、精密的分析仪器,故称为仪器分析。
与化学分析相比,仪器分析具有取样量少、测定是、速度快、灵敏、准确和自动化程度高的显著特点,常用来测定相对含量低于1%的微量、痕量组分,是分析化学的主要发展方向。
2.仪器分析的特点:速度快、灵敏度高、重现性好、样品用量少、选择性高局限性:仪器装置复杂、相对误差较大3.精密度:是指在相同条件下对同一样品进行多次测评,各平行测定结果之间的符合程度。
4、灵敏度:仪器或方法的灵敏度是指被测组分在低浓度区,当浓度改变一个单位时所引起的测定信号的该变量,它受校正曲线的斜率和仪器设备本身精密度的限制。
5.准确度:是多次测定的平均值与真实值相符合的程度,用误差或相对误差来描述,其值越小准确度越高。
6.空白信号:当试样中没有待测组分时,仪器产生的信号。
它是由试样的溶剂、基体材质及共存组分引起的干扰信号,具有恒定性,可以通过空白实验扣除。
7.本底信号:通常将没有试样时,仪器所产生的信号主要是由随机噪声产生的信号。
它是由仪器本身产生的,具有随机性,难以消除,但可以通过增加平行测定次数等方法减小;、8.仪器分析法与化学分析法有何异同:相同点:①都属于分析化学②任务相同:定性和定量分析不同点:①与化学分析相比,仪器分析具有取样量少、测定快速、灵敏、准确和自动化程度高等特点②分析对象不同:化学分析是常量分析,而仪器分析是用来测定相对含量低于1%的微量、衡量组分,是分析化学的主要发展方向9.仪器分析主要有哪些分类:①光分析法:分为非光谱分析法和光谱法两类。
非光谱法:是不涉及物质内部能级跃迁的,通过测量光与物质相互作用时其散射、折射、衍射、干涉和偏振等性质的变化,从而建立起分析方法的一类光学分析法。
仪器分析 01仪器分析概述

0.9
1 1.5 5 0.328
1.2
1 1.5 5 0.468
1.5
1 1.5 5 0.573
5.0
1 1.5 5 0.428
混匀后放置3-5 min
定容至50mL,放置10 min后于510 nm处测定A
解:求出标准系列溶液的浓度
cFe/mgL-1 A 0.6 0.112 1.2 0.227 1.8 0.328 2.4 0.468 3.0 0.573
吸附
分配 吸附 光、电、 质谱等
分配
静电 筛分 亲和
Signal
Time
1-4 分析仪器(1)
1-4 分析仪器(2)
分析仪器的基本结构单元
分析仪器种类繁多、型号多变、计算机应用和智能化程度 相差很大,但一般都是以下四个基本部件组成:
输出 信号
信号 发生器
分析 信号
检测器
输入 信号
信号 处理器
信号 显示装置
仪器校正灵敏度与所选标准物和测定条件有关!
有些仪器方法有习惯使用的表示方式。
1-4-2 检出限(1)
检出限指仪器所能检测到的最小有效信号对应的待测组分的浓 度或质量。最小有效信号如何确定?这就需要了解一下试样及 测量信号的组成。 试样:待测组分+基体 待测液:待测组分+基体+相关试剂+溶剂 理想空白:基体+相关试剂+溶剂(不含待测组分) 试剂空白:相关试剂+溶剂(选择合适的测定条件或前处理方
能消除,但可通过仪器的改善或适当的数据处理而减小,是影
响测量精密度的原因,也是决定检出限的主要因素之一。即所 测信号过小时,就难以区分是由待测组分产生还是仪器的自身 噪音,因此最小有效信号应大于本底信号一定倍数。
仪器分析 (第三版 魏培海)第一章 紫外可见分光光度法
讨 论 T: 0.00%~100.0%。T=0.00%表示光全 部被吸收;T=100.0%表示光全部透过。 A: 0.00 ~ ∞ 。 A=0.00 表示光全部通过; A→∞表示光全部被吸收。
2. 朗伯-比尔吸收定律
当一束平行单色光垂直通过溶液时, 溶液对光的吸收程度与溶液浓度和液层 厚度的乘积成正比。
T = 0.398 摩尔吸光系数: A 0.400 3 1.33 10 L / mol cm 3 cb 0.15 10 2.00 1.33 103 5.30 L / g cm 质量吸光系数: a M 251
4. 朗伯-比尔定律的偏离现象
原 因 朗伯-比尔定律的局限性: 浓度不高的溶液; 非单色入射光引起的偏离: 仪器因素; 溶液本身发生化学变化引起的偏离 。
第一章
紫外可见分光光度法
利用物质对紫外可见光的吸收特征和 吸收强度,对物质进行定性和定量分析的 一种仪器分析方法。在化工、医药、冶金、 环境监测等领域广泛应用。
“十二五”职业教育国家规划教材
仪器分析
(第三版)
魏培海 曹国庆 主编
第一章 紫外可见分光光度法
“十二五”职业教育国家规划教材
知识目标
• • • • • 了解紫外可见吸收光谱的产生 理解化合物电子能级跃迁的类型和特点 熟悉紫外可见分光光度计的工作原理 掌握光吸收定律的应用及测量条件的选择 掌握紫外可见分光光度法在定量分析中的 应用
1. 光强度、透光率和吸光度
术语 光强度 透光率 定义 单位时间(s)、单位面积(1cm2)上辐射 光的能量,与光子的数目有关。 透射光强度与入射光强度的比值(It/I0) 符号 I0:入射 It:透射 T
吸光度
透光率的负对数 -lg(It/I0)
仪器分析复习题参考答案
仪器分析复习题参考答案《仪器分析》复习题第⼀章绪论⼀、仪器分析⽅法的分类(四⼤类)(⼀)光学分析法(spectroscopic analysis)以物质的光学性质(吸收,发射,散射,衍射)为基础的仪器分析⽅法。
包括原⼦吸收光谱法、原⼦发射光谱法、紫外-可见吸收光谱法、红外光谱法、核磁共振波谱法等。
(⼆)电分析(electrical analysis):电流分析,电位分析,电导分析,电重量分析,库仑法,伏安法。
(三)⾊谱分析(chromatography analysis) :⽓相⾊谱法,液相⾊谱法(四)其它仪器分析⽅法(other analysis):1. 质谱法2. 热分析法包括热重法、差热分析法、⽰差扫描量热法等。
3. 电⼦显微镜,超速离⼼机,放射性技术等。
⼆、定量分析⽅法的评价指标灵敏度:物质单位浓度或单位质量的变化引起响应信号值变化的程度,称为⽅法的灵敏度,⽤S表⽰。
精密度:是指使⽤同⼀⽅法,对同⼀试样进⾏多次测定所得测定结果的⼀致程度。
精密度⽤测定结果的标准偏差 s或相对标准偏差(s r )量度。
准确度: 试样含量的测定值与试样含量的真实值(或标准值)相符合的程度称为准确度。
检出限:某⼀分析⽅法可以检出被测物质的最⼩浓度或最⼩质量,称为该⽅法对该物质的检出限。
以浓度表⽰的称为相对检出限,以质量表⽰的称为绝对检出限。
第⼆章光谱分析导论⼀、光谱区中紫外、可见、红外对应的波长范围?紫外:200-380nm 可见:380-780nm 近红外:780-2500nm 中红外:2.5-50µm 远红外:50-300µm ⼆、原⼦光谱和分⼦光谱的⽐较。
原⼦光谱的特征:电⼦能级间的跃迁,属电⼦光谱,线状光谱。
分⼦形成带状光谱的原因能量离散,导致谱线宽度扩展测不准原理、相对论效应导致谱线宽度扩展。
再加上能级之间的能量间距⾮常⼩,导致跃迁所产⽣的谱线⾮常多,间距⾮常⼩,易于重叠。
原⼦光谱:原⼦基态与激发态能量差△E=1-20eV,与紫外-可见光的光⼦能量相适应,特征是线状光谱相邻电⼦能级间的能量差△Ee=1-20eV,与紫外-可见光的光⼦能量相适应,特征是线状光谱分⼦光谱:相邻振动能级间的能量差△Ev=0.05-1eV,与中红外区的光⼦能量相适应,特征是带状光谱相邻转动能级间的能量差△Er<0.05eV, 与远红外区的光⼦能量相适应,特征是带状光谱三、 1. 物质吸收光的过程⽆辐射退激共振发射荧光磷光2. 物质散射光的过程瑞利散射斯托克斯散射反斯托克斯散射四、荧光与磷光产⽣的量⼦解释及其区别?荧光:激发分⼦与其它分⼦相碰,⼀部分能量转化为热能后,下降到第⼀激发态的最低振动能级,然后再回到基态的其它振动能级并发射光⼦的发射光称荧光。
仪器分析第一章 绪论

精品文档
23
1)精密度(Precision)使用同一方法或步骤进行多次重复 测量所得分析数据之间符合的程度。
光散射 浊度法;拉曼光谱
光折射 折光分析;干涉法
光衍射 X-射线和电子衍射光谱
光偏转 旋光分析;旋光性色散分析;圆振二向色性分析
电 位 电位分析
四种电学特性的测量
电 荷 库仑分析
电 流 电流分析法;极谱分析
电 阻 电导分析
离 色谱分析 薄层色谱;气相色谱;液相色谱;离子色谱……..
多组份同时分离分析
操作简便,分析速度快,容易实现自
动化。
精品文档
6
仪器分析的特点(与化学分析 比较)
相对误差较大。化学分析一般可用于 常量和高含量成分分析,准确度较高, 误差小于千分之几。多数仪器分析相 对误差较大,一般为5%,不适用于常 量和高含量成分分析。 需要价格比较昂贵的专用仪器。
精品文档
7
常量分析、半微量和微量分析
(analyte, target
species)的颜色、沸熔点、气味、光学性质
(拆射、反射、衍射等)以及在不同溶剂中
精品文档
9
仪器分析 化学分离:色谱技术和毛细管电泳技术开始 取代沉淀、 萃取、蒸馏等分离方法; 定性定量方法:利用物质原子、分子、离子 等的特性, 如电导、电位、光吸收和发射、质荷比、荧 光等;
精品文档
3
分析化学—化学分析、仪器分析
分析化学是研究物质的组成、状态和结构的科学, 它包括化学分析和仪器分析两大部分。 化学分析是指利用化学反应和它的计量关系来确 定被测物质的组成和含量的一类分析方法。测定 时需使用化学试剂、天平和一些玻璃器皿。
精品文档
4
仪器分析 课件 第一章:绪论

四 课程性质与目标
1. 课程性质
仪器分析:化学+物理学+电子技术+计算机 (综合性 学科) 基础课:化学专业、应用化学、生物化学、环境化 学等专业的基础课;
2. 课程目标
培养两类人才:分析仪器的熟练应用者——解决问 题;创新型人才——发现问题,开拓新领域;
(1 ) 掌握常用仪器分析方法原理、应用,熟悉仪器结构; (2 ) 使学习者具备选择适宜的分析方法的能力;
22
应该指出:仪器分析本身不是一门独立的学 科,而是多种仪器方法的组合。可是这些 仪器方法在化学学科中极其重要。它们已 不单纯地应用于分析的目的,而是广泛地 应用于研究和解决各种化学理论和实际问 题。因此,将它们称为“化学分析中的仪 器方法”更为确切。
ห้องสมุดไป่ตู้
23
四 仪器分析与化学分析的区别
化学分析 从原理看 根据化学反应及计 量关系 仪器分析
按试样量的大小:
常量分析 半微量分析 微量分析 超微量分析
1 0 0 10~ 100 0 .1 ~ 1 0 0 .1
1 0 1~ 10 0 .1 ~ 1 0 .0 1
30
1-5 仪器分析的发展
20世纪40~50年代兴起的材料科学, 60 ~70年代发展起来的环境科学都促进了 分析化学学科的发展。80年代以来,生命 科学的发展也促进分析化学一次巨大的发 展。仪器分析是分析化学的重要组成部分, 也随之不断发展,不断地更新自己,为科 学技术提供更准确、更灵敏、更专一、更 快速、更简便的分析方法。
31
如生命科学研究的进展,需要对多肽、 蛋白质、核酸等生物大分子进行分析, 对生物药物分析,对超微量生物活性 物质,如单个细胞内神经传递物质的 分析以及对生物活体进行分析。 信息时代的到来,给仪器分析带来了 新的发展。信息科学主要是信息的采 集和处理。
仪器分析笔记
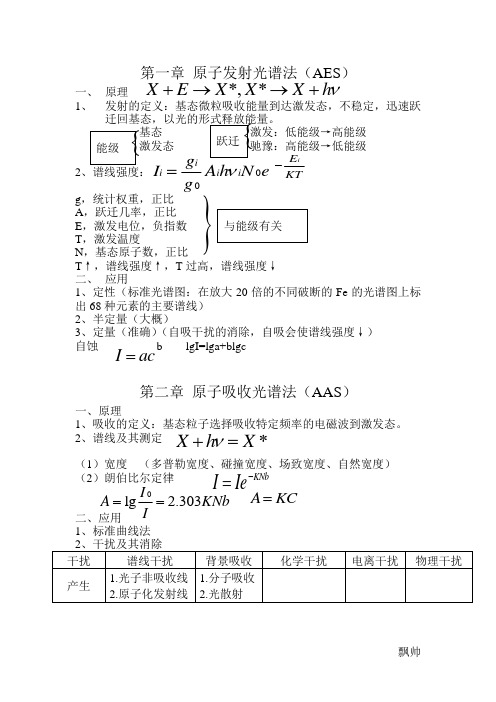
第一章原子发射光谱法(AES)一、原理1、发射的定义:基态微粒吸收能量到达激发态,不稳定,迅速跃基态激发:低能级→高能级激发态驰豫:高能级→低能级2、谱线强度:g,统计权重,正比A,跃迁几率,正比E,激发电位,负指数T,激发温度N,基态原子数,正比T↑,谱线强度↑,T过高,谱线强度↓二、应用1、定性(标准光谱图:在放大20倍的不同破断的Fe的光谱图上标出68种元素的主要谱线)2、半定量(大概)3、定量(准确)(自吸干扰的消除,自吸会使谱线强度↓)自蚀 b lgI=lga+blgc第二章原子吸收光谱法(AAS)一、原理1、吸收的定义:基态粒子选择吸收特定频率的电磁波到激发态。
2、谱线及其测定(1)宽度(多普勒宽度、碰撞宽度、场致宽度、自然宽度)(2)朗伯比尔定律二、应用1、标准曲线法ii i igI A h N egν=iEKT-*,*X E X X X hν+→→+I ac=}*X h Xν+=I Ie=KNb-lg 2.303IA KNbI==A KC=第三章紫外可见分光光度法(UI-UIS)以分子的外层电子吸收紫外可见光,在分子的电子能级发生跃迁的基础的分析方法。
(使用材料简单,仪器造价低,广泛用于有机物的定量分析)一、原理分子光谱简介:电子光谱,紫外可见光谱,能级差约为1-20eV。
振转光谱,红外光谱,能级差约为0.05-1eV。
转动光谱,远红外光谱,能级差约为0.005-0.05eV。
紫外光谱吸收光线各类有机分子紫外光谱二、应用1.结构分析:分子骨架推断由于特征性差,UV-VIS应用于结构分析有局限性,仅用于两个方面:1.鉴定生色团种类2.辅助确定分子结构2.定量分析:多组分分析法测定色素、蛋白质、核酸、激素三、有机分子键、电子、轨道类型:键的类型:ζ键和π键电子的类型:ζ电子、π电子和n电子轨道类型:ζ成键轨道、π成键轨道、n非键轨道、π*反键轨道和ζ*反键轨道有机分子跃迁类型:ζ→ζ* 跃迁-单键,π→π*跃迁-双键、三键,n →ζ*跃迁-单键、杂原子,n→π*跃迁-双键、杂原子,电荷迁移跃迁-取代芳烃朗伯比尔定律基本式:A=abc 摩尔式:A=εbc,使用广泛质量式:A=Ebc 吸收曲线的绘制:将不同波长的单色光,依次通过待测物质,测得不同波长下的吸收参数,称为扫描。
仪器分析各章习题与答案
仪器分析各章习题与答案第⼀章绪论问答题1. 简述仪器分析法的特点。
第⼆章⾊谱分析法1.塔板理论的要点与不⾜是什么?2.速率理论的要点是什么?3.利⽤保留值定性的依据是什么?4.利⽤相对保留值定性有什么优点?5.⾊谱图上的⾊谱流出曲线可说明什么问题?6.什么叫死时间?⽤什么样的样品测定? .7.在⾊谱流出曲线上,两峰间距离决定于相应两组分在两相间的分配系数还是扩散速率?为什么?8.某⼀⾊谱柱从理论上计算得到的理论塔板数n很⼤,塔板⾼度H很⼩,但实际上柱效并不⾼,试分析原因。
9.某⼈制备了⼀根填充柱,⽤组分A和B为测试样品,测得该柱理论塔板数为4500,因⽽推断A和B在该柱上⼀定能得到很好的分离,该⼈推断正确吗?简要说明理由。
10.⾊谱分析中常⽤的定量分析⽅法有哪⼏种?当样品中各组分不能全部出峰或在组分中只需要定量其中⼏个组分时可选⽤哪种⽅法?11.⽓相⾊谱仪⼀般由哪⼏部分组成?各部件的主要作⽤是什么?12.⽓相⾊谱仪的⽓路结构分为⼏种?双柱双⽓路有何作⽤?13.为什么载⽓需要净化?如何净化?14.简述热导检测器的基本原理。
15.简述氢⽕焰离⼦化检测器的基本结构和⼯作原理。
16.影响热导检测器灵敏度的主要因素有哪些?分别是如何影响的?17.为什么常⽤⽓固⾊谱分离永久性⽓体?18.对⽓相⾊谱的载体有哪些要求?19.试⽐较红⾊载体和⽩⾊载体的特点。
20.对⽓相⾊谱的固定液有哪些要求?21.固定液按极性⼤⼩如何分类?22.如何选择固定液?23.什么叫聚合物固定相?有何优点?24.柱温对分离有何影响?柱温的选择原则是什么?25.根据样品的沸点如何选择柱温、固定液⽤量和载体的种类?26.⽑细管⾊谱柱与填充柱相⽐有何特点?27.为什么⽑细管⾊谱系统要采⽤分流进样和尾吹装置?28.在下列情况下⾊谱峰形将会怎样变化?(1)进样速度慢;(2)由于汽化室温度低,样品不能瞬间汽化;(3)增加柱温;(4)增⼤载⽓流速;(5)增加柱长;(6)固定相颗粒变粗。
仪器分析第1章绪论-精品文档

2.1 光学分析法
紫外可见法
分子光谱 原子光谱
红外法
原子发射法
光分析法
荧光法
核磁法
光学分析法 某能量作用于待测物质后测定其产生的辐射讯号
或引起的某些变化的分析方法。
1.非光谱法--指那些不以光的波长为特征、讯号,仅通 过测量电磁辐射的某些基本性质(反射、折射等) 的变化的分析方法。如:干涉法、折射法、散射法、 旋光法、衍射法等。
体液、单细胞分析
分析仪器在保障人类健康生活、监控病人病情、预防灾害 发生等方面起着重大的作用。
没有新型DNA分析仪的进一步发展,人类也很难在防病、 治病特别是在防治癌症和各种遗传病方面对现有基因图谱加以 利用。
2019年美籍华裔钱永健因在荧光蛋白研究领域的成果而获 得诺贝尔化学奖.他的父亲钱学榘是美国波音公司的工程师,舅舅 是麻省理工学院的的工程学教授,堂叔是中国导弹之父钱学森,哥 哥钱永佑是神经生物学家\美国科学院院士\斯坦福大学教授.堂 兄钱永刚是中国解放军某研究所高级工程师,上海交通大学兼职教 授.
4.仪器分析应用领域
社会:体育(兴奋剂)、生活产品质量(鱼新鲜度、食 品添加剂、农药残留量)、环境质量(污染实时检 测)、法庭化学(DNA技术,物证)
化学:新化合物的结构表征;分子层次上的分析方法; 生命科学:DNA测序;活体检测; 环境科学:环境监测;污染物分析; 材料科学:新材料,结构与性能; 药物:天然药物的有效成分与结构,构效关系研究; 外层空间探索:微型、高效、自动、智能化仪器研制。
➢ 中国:10个国家级分析测试中心,12个部级测试中 心,21个省市测试中心,137个国家级产品质量监督 检验中心,300多个进出口商品检验室,8千多个环 境监测机构,数十万庞大的分析队伍。
仪器分析绪论

蛋白质旳氮含量14-18% 平均为16%,折算系数 为6.25。
检测仪器: 气相色谱-质谱联用仪(GC-MS)、高效液相色谱 仪(HPLC)、液相色谱-质谱-质谱联用仪(HPLC-MS-MS) 等
分析化学及其任务
定义:研究物质化学构成、构成含量、表征物质化 学构造旳分析措施及有关理论旳科学。
清楚明了方法原理,弄懂记着基本概念。 知晓分清仪器装置,着重熟悉关键部件。 理解方法理论公式,熟练使用重点公式。
措施
发明了分配色谱法
发明了相差显微镜 首次发展了极谱法
发明了计算机控制扫描层析 诊疗法 (CT)
发展了高辨别率电子光谱法
发展了激光光谱学
对晶体显微镜旳发展
28项诺贝尔奖与分析仪器发展有关 2023年诺贝尔化学奖:
约翰·芬恩(美)与田中耕一(日): 库尔特·维特(瑞) 建立利用质谱分析生物大分子旳措施。 建立利用核磁共振测定生物大分子三维构造旳措施。
对电解理论旳贡献
对电导率旳理论研究及试验工作
制造了光学精密仪器及对天体所 做旳光谱研究
发觉结晶X射线衍射
共同采用X射线技术对晶体构造 旳分析
发觉了多种元素X射线发射旳不 同
发觉了质谱技术能够用来测定同 位素
编号 年份 获奖者 15 1939 Lawrence Ernest Orlando 16 1944 Rabi, Isidor Isaac
绪论应该讲旳内容? 为何学习仪器?
学术成就
生命质量
与仪器分析发明发展有关旳诺贝尔取得者
编号 年份 获奖者 1 1901 Rontgen Wilhelm Conrad 2 1901 Van't Hoff Jacbus Henricus
仪器分析知识点总结各章

仪器分析知识点总结各章第一章仪器分析的基本概念和原理1.1 仪器分析的定义仪器分析是利用仪器设备对样品进行检测、分析和测量,以获取样品中特定组分的含量、性质和结构等信息的一种分析方法。
1.2 仪器分析的分类仪器分析按照分析方法的不同可以分为物理分析、化学分析和生物分析三大类,其中每类又分为多个不同的分支。
1.3 仪器分析的基本原理仪器分析的基本原理是根据目标分析物的性质和特点,选用合适的分析仪器进行检测和分析。
常用的仪器分析原理包括光谱分析原理、色谱分析原理、质谱分析原理等。
第二章光谱分析2.1 光谱分析的基本概念光谱分析是利用样品对电磁波的吸收、散射、发射或者透射特性进行分析的方法,分析样品中的成分、结构和性质。
2.2 原子吸收光谱分析原子吸收光谱分析(AAS)是利用原子对特定波长的光的吸收特性来测定样品中金属元素的含量的分析方法。
原子吸收光谱分析的原理是利用吸收特性和比例计算出样品中目标元素的含量。
2.3 紫外可见光谱分析紫外可见光谱分析(UV-Vis)是利用样品对紫外和可见光的吸收特性进行分析的方法,常用于测定有机物和某些无机物的含量和结构。
2.4 荧光光谱分析荧光光谱分析是利用样品对激发光的发射特性进行分析的方法,荧光光谱常用于生物分析、环境分析和材料科学等领域。
第三章色谱分析3.1 色谱分析的基本概念色谱分析是利用色谱仪器对样品中的组分进行分离、检测和定量测定的方法,主要包括气相色谱分析、液相色谱分析和超临界流体色谱分析等。
3.2 气相色谱分析气相色谱分析(GC)是将样品分离为各个成分,再通过气相色谱柱进行分离和检测的方法,主要用于分析有机物、气体和挥发性物质。
3.3 液相色谱分析液相色谱分析(HPLC)是将样品分离为各个成分,再通过液相色谱柱进行分离和检测的方法,主要用于分析生物化学物、药物和小分子有机化合物等。
3.4 色谱联用技术色谱联用技术是将不同色谱方法和检测手段结合起来,以达到更高的分离能力和检测灵敏度,常见的色谱联用技术包括气相色谱-质谱联用(GC-MS)和液相色谱-质谱联用(LC-MS)等。
- 1、下载文档前请自行甄别文档内容的完整性,平台不提供额外的编辑、内容补充、找答案等附加服务。
- 2、"仅部分预览"的文档,不可在线预览部分如存在完整性等问题,可反馈申请退款(可完整预览的文档不适用该条件!)。
- 3、如文档侵犯您的权益,请联系客服反馈,我们会尽快为您处理(人工客服工作时间:9:00-18:30)。
Chapter 1 IntroductionAnalytical chemistry deals with methods for determining the chemical composition of samples of matter. A qualitative method yields information about the identity of atomic or molecular species or the functional groups in the sample; a quantitative method. in contrast, provides numerical information as to the relative amount of one or more of these components.1.1 CLASSIFICATION OFANALYTICAL METHODSAnalytical methods are often classified as being either classical or instrumental. This classification is largely historical with classical methods, sometimes called wet chemical methods, preceding instrumental methods by a century or more.1.1.1 Classical MethodsIn the early years of chemistry, most analyses were carried out by separating the components of interest (the analytes) in a sample by precipitation, extraction, or distillation. For qualitative analyses, the separated components were then treated with reagents that yielded products that could be recognized by their colors, their boilingor melting points, their solubilities in a series of solvents, their odors, their optical activities, or their refractive indexes. For quantitative analyses, the amount of analyte was determined by gravimetric or by titrimetric measurements. In gravimetric measurements, the mass of the analyte or some compound produced from the analyte was determined. In titrimetric procedures, the volume or mass of a standard reagent required to react completely with the analyte was measured.These classical methods for separating and determining analytes still find use in many laboratories. The extent of their general application is, however, decreasing with the passage of time and with the advent of instrumental methods to supplant them.1.1.2 Instrumental MethodEarly in the twentieth century, chemists began to exploit phenomena other than those used for classical methods for solving analytical problems. Thus, measurements of physical properties of analytes--such as conductivity, electrode potential, light absorption or emission, mass to-charge ratio, and fluorescence--began to be used for quantitative analysis of a variety of inorganic, organic, and biochemical analytes. Furthermore, highly efficient chromatographic and electrophoretic techniques began to replace distillation, extraction, and precipitation for the separation of components of complex mixtures prior to their qualitative or quantitative determination. These newer methods for separating and determining chemical species are known collectively as instrumental methods of analysis.Many of the phenomena that instrumental methods are based on have been known for a century or more. Their application by most chemists, however, was delayed by lack of reliable and simple instrumentation. In fact, the growth of modem instrumental methods of analysis has paralleled the development of the electronics and computer industries.1.2 TYPES OF INSTRUMENTALMETHODSFor this discussion, it is useful to consider chemical and physical characteristics that are useful for qualitative or quantitative analysis. Table 1-1 lists most of the characteristic properties that are currently used for instrumental analysis. Most of the characteristics listed in the table require a source of energy to stimulate a measurable response from the analyte. For example, in atomic emission an increase in the temperature of the analyte is required to first produce gaseous analyte atoms and then to excite the atoms to higher energy states. The excited state atoms then emit characteristic electromagnetic radiation, which is the quantity measured by the instrument.Sources of excitation energy may take the formof a rapid thermal change as in the previous example, electromagnetic radiation from a selected region of the spectrum, application of one of the electrical quantities-voltage, current, or charge--or perhaps subtler forms intrinsic to the analyte itself.Note that the first six entries in Table I-1 involve interactions of the analyte with electromagnetic radiation. In the first property, radiant energy is produced by the analyte; the next five properties involve changes in electromagnetic radiation brought about by its interaction with the sample. Four electrical properties then follow. Finally, four miscellaneous properties are grouped together: mass-to-charge ratio, reaction rate, thermal characteristics, and radioactivity.The second column in Table 1-1 lists the names of instrumental methods that are based upon the various physical and chemical properties. Be aware that it is not always easy to select an optimal method from among available instrumental techniques and their classical counterparts. Some instrumental techniques are more sensitive than classical techniques, but others are not. With certain combinations of elements or compounds, an instrumental method may be more selective; with others, a gravimetric or volumetric approach may suffer less interference. Generalizations on the basis of accuracy, convenience, or expenditure of time are equally difficult to draw. Nor is it necessarily true that instrumental procedures employ more sophisticated or more costly apparatus; indeed, the modern electronic analytical balance used for gravimetric determinations is a more complex and refined instrument than some of those used in the other methods listed in Table1-1.As noted earlier, in addition to the numerous methods listed in the second columnof Table 1-1, there is a group of instrumental procedures that are used for separation and resolution of closely related compounds. Most of these procedures are based upon chromatography or electrophoresis. One of the characteristics listed in Table 1-1 is ordinarilyCharacteristic Properties Instrumental MethodsEmission of radiation Emission spectroscopy (X-ray, UV, visible, electron, Auger);fluorescence, phosphorescence, and luminescence (X-ray, UV, andvisible)Absorption of radiation Spectrophotometry and photometry (X-ray, UV, visible, IR);photoacoustic spectroscopy;nuclear magnetic resonance and electronspin resonance spectroscopyScattering of radiation Turbidimetry; nephelometry; Raman spectroscopyRefraction of radiation Refractometry; interferometryDiffraction of radiation X-Ray and electron diffraction methodsRotation of radiation Polarimetry; optical rotary dispersion; circular dichroismElectrical potential Potentiometry; chroaopolentiometryElectrical charge CoulometryElectrical current Amperometry; polarographyElectrical resistance ConductemetryMass Gravimetry (quartz crystal microbalance)Mass-to-charge ratio Mass spectrometryRate of reaction Kinetic methodsTABLE 1-1 Chemical and Physical Properties Employed in Instrumental Methodsused to complete the analysis following chromatographic separations. Thus, for example, thermal conductivity, ultraviolet and infrared absorption, refractive index, and electrical conductance have been used for this purpose.This text deals with the principles, the applications, and the performance characteristics of the instrumental methods listed in Table 1-1 and of chromatographic andelectrophoretic separation procedures as well. No space is devoted to the classical methods, the assumption being that the reader will have encountered these techniques in earlier studies.1.3 INSTRUMENTS FORANALYSISAn instrument for chemical analysis converts information stored in the physical or chemical characteristics of the analyte to information that may be manipulated and interpreted by a human. Thus, an analytical instrument can be viewed as a communication device between the system under study and the investigator. To retrieve the desired information from the analyte, it is necessary to provide a stimulus, which is usually in the form of electromagnetic, electrical, mechanical, or nuclear energy as illustrated in Figure 1-1. The stimulus elicits a response from the system under study whose nature and magnitude are governed by the fundamental laws of chemistry and physics. The resulting information is contained in the phenomena that result from the interaction of the stimulus with the analyte. A familiar example is the passage of a narrow band of wavelengths of visible light through a sample to measure the extent of its absorption by the analyte. The intensity of the light is determined before and after its interaction with the sample, and the ratio of these intensities provides a measure of the analyte concentration.Generally, instruments for chemical analysis comprise just a few basic components, some of which are listed in Table 1-2. To understand the relationships among these instrument components and the flow of information from the characteristics of the analyte through the components to the numerical or graphical output produced by the instrument, it is instructive to explore the concept of data domains.1.3.1 Data DomainsThe measurement process is aided by a wide variety of devices that convert information from one form to another. In order to investigate how instruments function, it is important to understand the way in which information is encoded, or transformed from one system of information to another, as a characteristic of electrical signals--that is, as voltage, current, charge, or variations in these quantities. The various modes of encoding information electrically are called data domains. A classification scheme has been developed based on this concept that greatly simplifies the analysis of instrumental systems and promotes understanding of the measurement process.1 As shown in the data domains map of Figure 1-2, data domains may be broadly classified into nonelectrical domains and electrical domains.1.3.2 Nonelectrical DomainsThe measurement process begins and ends in nonelectrical domains. The physical and chemical characteristics that are of interest in a particular experiment reside in these data domains. Among these characteristics are length, density, chemical composition, intensity of light, pressure, and others listed in the first column of Table 1-1.It is possible to make a measurement entirely in nonelectrical domains. For instance, the determination of the mass of an object using a mechanical equal-arm balance involves a comparison of the mass of the object, which is placed on one balance pan, with standard masses placed on a second pan. The informationTABLE 1-2So meE x a mp l e s o f Inst rume nt Compon ent srepresenting the mass of the object in standard units is encoded directly by the experimenter, who provides information processing by summing the masses to arrive at a number. In certain other mechanical balances, the gravitational force on a ass is amplified mechanically by making one of the balance arms longer than the other, thus increasing the resolution of the measurement.The determination of the linear dimensions of an object with a ruler and the measurement of the volume of a sample of liquid with a graduated cylinder are other examples of measurements carded out exclusively in nonelectrical domains. Such measurements are often associated with classical analytical methods. The advent of inexpensive electronic signal processors, sensitive transducers, and readout devices has led to the development of a host of electronic instruments, which acquireinformation from nonelectrical domains, process it in electrical domains, and finally present it in nonelectrical domains once again. Electronic devices process information and transform it from one domain to another in ways analogous to the multiplication of mass in mechanical balances with unequal arms. As a consequence of the availability of these electronic devices and their rapid and sophisticated information processing, instruments that rely exclusively on nonelectrical information transfer are rapidlybecoming relics of the past. Nonetheless, the information that we seek begins in the properties of the analyte and ends in a number, both of which are nonelectrical domains. The ultimate objective in all measurements is that the final numerical result must be in some manner proportional to the relevant chemical or physical characteristic of the analyte.Figure 1-2 Data domains map. The upper (shaded) half of the map comprises nonelectrical domains. The bottom half is made up of electrical domains. Note that the digital domain spans both electrical and nonelectrical domains.1.3.3 Electrical DomainsThe modes of encoding information as electricalquantities can be subdivided into analogdomains, time domains, and digital domains, asillustrated in the bottom half of the circular mapin Figure 1-2. Note that the digital domainspans three electrical domains and onenonelectrical domain because numbers presentedon any type of display convey digitalinformation and can also be encodedelectrically.Any measurement process can berepresented as a series of interdomainconversions. For example, Figure 1-3 illustratesthe measurement of the intensity of molecularfluorescence of a sample of tonic watercontaining a trace of quinine and, in a generalway, some of the data domain conversions thatare necessary to arrive at a number expressingthe intensity. The intensity of the fluorescenceis significant in this context because it isproportional to the concentration of the quinine inthe tonic water, which is ultimately theinformation that we desire. The informationbegins in the solution of tonic water as theconcentration of quinine. This information isteased from the sample by applying to it astimulus in the form of electromagnetic energyfrom the laser shown in Figure 1-3. Theradiation interacts with the quinine molecules inthe tonic water to produce fluorescence emissionin a region of the spectrum characteristic ofquinine and of magnitude proportional to itsconcentration. Radiation, and thus information, that is unrelated to the concentration of quinineis removed from the beam of light by an opticalfilter, as shown in Figure 1-3a. The intensity ofthe fluorescence emission, which is anonelectrical domain, is encoded into anelectrical domain by a special type of devicecalled an input transducer. The particular type oftransducer used in this experiment is aphototransducer, of which there are numeroustypes, some of which are discussed in Chapter 7.In this example, the input transducer convertsthe fluorescence from the tonic water to anelectrical current, I, proportional to the intensityof the radiation. The mathematical relationshipbetween the electrical output and the inputradiant power impinging on its surface is calledthe transfer function of the transducer.The current from the phototransducer isthen passed through a resistor R, whichaccording to Ohm's law produces a voltage Vthat is proportional to/, which is in turnproportional to the intensity of the fluorescence.Finally, V is measured by the digital voltmeter toprovide a readout proportional to theconcentration of the quinine in the sample.Voltmeters, alphanumeric displays,electric motors, computer screens, and manyother devices that serve to convert data fromelectrical to nonelectrical domains are calledoutput transducers. The digital voltmeter of thefluorometer of Figure 1-3a is a rather complexoutput transducer that converts the voltage V to aFigure 1-3 A block diagram of a fluorometer showing (a) a general diagram of the instrument, (b) a diagrammatic representation of the flow of information through various data domains in the instrument and (c) the rules governing the data domain transformations during the measurement process.number on a liquid crystal display so that it may be read and interpreted by the user of the instrument. We shall consider the detailed nature of the digital voltmeter and various other electrical circuits and signals in Chapters 2 through 4.Analog DomainsInformation in analog domains is encoded as the magnitude of one of the electrical quantities--voltage, current, charge, or power. These quantities are continuous in both amplitude and time as shown by the typical analog signals of Figure 1-4. Magnitudes of analog quantities can be measured continuously or they can be sampled at specific points in timedictated by the needs of a particular experimentor instrumental method as discussed in Chapter4. Although the data of Figure 1-4 are recordedas a function of time, any variable such aswavelength, magnetic field strength, or temperature may be the independent variable under appropriate circumstances. The correlation of two analog signals that result from corresponding measured physical or chemical properties is important in a wide variety ofinstrumental techniques, such as nuclear magnetic resonance spectroscopy, infrared spectroscopy, and differential thermal analysis. Analog signals are especially susceptible to electrical noise that results from interactions within measurement circuits or from other electrical devices in the vicinity of the measurement system. Such undesirable noise bears no relationship to the information ofinterest, and methods have been developed to minimize the effects of this unwanted information. Signals, noise, and the optimization of instrumental response are discussed in Chapter 5. Time Domains Information is stored in time domains as the time relationship of signal fluctuations, rather than in the amplitudes of the signals. Figure 1-5 illustrates three different time-domain signals recorded as an analog quantity versus time. The horizontal dashed lines represent an arbitrary analog signal threshold that is used to decide whether a signal is HI (above the threshold) or LO (below the threshold). The time relationshipsbetween transitions of the signal from HI to LOFigure 1-4 Analog signals. (a) Instrument response from the photometric detection system of a flow injection analysis experiment. A stream of reaction mixture containing plugs of red Fe(SCN)2+ flows past a monochromatic light source and a phototransducer, which produces a changing voltage as sample concentration changes. (b) The current response of a photomultiplier tube when the light from a pulsed source falls on the photocathode of the device.or from LO to HI contain the information of interest. For instruments that produce periodic signals, the number of cycles of the signal per unit time is the frequency, and the time required for each cycle is its period. Two examples of instrumental systems that produce information encoded in the frequency domain are Ramanspectroscopy and instrumental neutron activation analysis. In these methods, the frequency of arrival of photons at a detector is directly related to the intensity of the emission from the analyte, which is proportional to its concentration.The time between successive LO to HI transitions is called the period, and the timebetween a LO to H1 and a HI to LO transition iscalled the pulse width. Devices such asvoltage-to-frequency converters and frequency-to-voltage converters may be used to convert time-domain signals to analog-domain signals and vice versa. These and other such data domain converters will be discussed in Chapters3 and4 as a part of our treatment of electronicdevices and will be referred to in other contextsthroughout this book.Figure 1-5 Time-domain signals. The horizontal dashed lines represent signal thresholds. When each signal is above the threshold, the signal is HI, andwhen it is below the threshold, the signal is LO.Digital DomainsData are encoded in the digital domain in atwo-level scheme. The information can be represented by the state of a light bulb, a light-emitting diode, a toggle switch, or a logic level signal, to cite but a few examples. The characteristic that these devices share is that each of them must be in one of only two states. For example, lights and switches may be only ON or OFF and logic-level signals may be only HI or LO. The definition of what constitutes ON and OFF for switches and lights is understood,but in the case of measure very electricalsignals, as in the case of time domain signals, anarbitrary signal level must be defined thatdistinguishes between HI and LO. Such adefinition may depend on the conditions of anexperiment, or it may depend upon the characteristics of the electronic devices in use. For example, the signal represented in Figure 1-5c is a train of pulses from a nuclear detector. The measurement task is to count the pulses during a fixed period of time to obtain a measure of the intensity of radiation. The dashed line represents a signal level that not only is lowFigure 1-6 Diagram illustrating three types of digital data: (a) count serial data, (b)binary-coded serial data, and (c) parallel binary data. In all three cases, the data represent the number n = 5.enough to ensure that no pulses are lost but also is sufficiently high to reject random fluctuations in the signal that are unrelated to the nuclear phenomena of interest. If the signal crosses the threshold fourteen times, as in the case of the signal in Figure 1-5c, then we may be confident that fourteen nuclear events occurred. After the events have been counted, the data are then encoded in the digital domain in the form of the number 14. In Chapter 4, we shall explore the means for making HI-LO electronic decisions and encoding the information in the digital domain.As suggested by the data domains map of Figure 1-2, the digital domain spans both electrical and nonelectrical domains. In the example just cited, the nuclear events are accumulated by using an electronic counter and are displayed on a digital readout. When the experimenter reads and interprets the display, the number that represents the measured quantity is once again in a nonelectrical domain. Each piece of HI-LO data that represents a nuclear event is a bit of information, which is the fundamental unit of information in the digital domain. Bits of information that are transmitted along a single electronic channel or wire may be counted by an observer or by an electronic device that is monitoring the channel; such accumulated data is termed count digital data, which appears in the data-domains map of Figure 1-2. For example, the signal in Figure 1-5a corresponds to the number n = 8 because there are eight complete cycles in the signal. The signal in the Figure 1-5b corresponds to n = 5, and the signal in Figure 1-5c corresponds to n = 14. Although effective, this means of transmitting information is not very efficient.A far more efficient way to encode information is to use binary numbers to represent numeric and alphabetic data. To see how this type of encoding may be accomplished, let us consider the signals in Figure 1-6. The count digital data of the signal in Figure 1-6a represent the number n = 5 as before. We monitor the signal and count the number of complete oscillations. The process requires a period of time that is proportional to the number of cycles of the signal, or in this case, five times the length of a single time interval, as indicated in Figure 1-6. Note that the time intervals are numbered consecutively beginning with zero. In a binary encoding scheme, such as the one shown for the signal in Figure 1-6b, we assign a numerical value to each successive interval of time. For example, the zeroth time interval represents 2o = 1, the first time interval represents 21 = 2, the second time interval represents 22 = 4, and so forth, as shown in Figure 1-6. During each time interval, we need only decide whether the signal is HI or LO. If the signal is HI during any given time interval, then the value corresponding to that interval is added to the total. All intervals that are LO contribute zero to the total.In Figure 1-6b, the signal is HI only in interval 0 and interval 2, so the total value represented is 1 x 2o + 0 x 21 + 1 x 22 = 5. Thus, in the space of only three time intervals, the number n = 5 has been determined. In the count digital example of the signal in Figure 1-6a, five time intervals were required to determine the same number. In this limited example, the binary-coded serial data is nearly twice as efficient as the count serial data. A more dramatic example may be seen in the counting of n = 10 oscillations similar to those of the signal in Figure 1-6a. In the same ten time intervals, ten HI-LO bits of information in the serial binary coding scheme enable the representation of the binary numbers from 0 to 210 = 1024, or 0000000000 to 1111111111. The improvement in efficiency is 1024/10, or about 100-fold. In other words, the count serial scheme requires 1024 time intervals to represent the number 1024, while the binary coding scheme requires only ten time intervals. As a result of the efficiency of binary coding schemes, most digital information is encoded, transferred, processed, and decoded in some form of binary.Data represented by binary coding on a single transmission line is called serial-coded binary data, or simply serial data. A common example of serial data transmission is the computer modem, which is a device for transmitting data between computers by telephone over a single conductor (and ground).A still more efficient method for encoding data in the digital domain is seen in the signal ofFigure 1-6c. Here we use three light bulbs to represent the three binary digits: 20 = 1; 21 = 2; and 22 = 4. However, we could use switches, wires, light-emitting diodes, or any of a host of electronic devices to encode the information. In this scheme, ON = 1 and OFF = 0, so that our number is encoded as shown in Figure 1-6 with the first and third lights ON and the middle light OFF, which represents 4 + 0 + 1 = 5. This scheme is highly efficient because all of the desired information is presented to us simultaneously, just as all of the digits on the face of the digital voltmeter in Figure 1-3a appear simultaneously. Data presented in this way are referred to as parallel digital data. Data are transmitted within analytical instruments and computers by parallel data transmission. Since data usually travel relatively short distances within these devices, it is economical and efficient to use parallel information transfer. This economy of short distances is in contrast to the situation in which data must be transported over long distances from instrument to instrument or from computer to computer. In such instances, communication is carried out serially by using modems or other more sophisticated or faster serial data transmission schemes. We will consider these ideas in somewhat more detail in Chapter 4.1.3.4 Detectors, Transducers, andSensorsThe terms detector, transducer, and sensor are often used synonymously, but in fact the terms previously, the mathematical relationship between the electrical output and the input radiant power, temperature, force, or magnetic field strength is called the transfer function of the transducer.The term sensor also has become rather broad, but in this text we shall reserve the term for the class of analytical devices that are capable of monitoring specific chemical species continuously and reversibly. There are numerous examples of sensors throughout this text, including the glass electrode and other ion-selective electrodes, which are treated in Chapter 23, the Clark oxygen electrode, which is described in Chapter 25, and optrodes, or fiber-optic sensors, which appear in Chapter 7. Sensors consist of a transducer coupled with a chemically selective recognition phase. So, for example, optrodes consist of a phototransducer coupled with a fiber optic that is coated on the end opposite the transducer with a substance that responds specifically to a particular physical or chemical characteristic of an analyte.A sensor that is especially interesting and instructive is the quartz crystal microbalance, or QCM. This device is based on the piezoelectric characteristics of quartz. When quartz is mechanically deformed, an electrical potential develops across its surface. Furthermore, when a voltage is impressed across the faces of a quartz crystal, the crystal deforms. A crystal connected in an appropriate electrical circuit oscillates at a frequency that is characteristic of the mass and shape of the crystal and that is amazingly constant--provided that the mass of the crystal is constant. This property of some crystalline materials is called the piezoelectric effect, and forms the basis for the quartz-crystal microbalance. Moreover, the characteristic constant frequency of the quartz crystal is the basis for modem high-precision clocks, time bases, counters, timers, and frequency meters, which in turn have led to many highly accurate and precise analytical instrumental systems.have somewhat different meanings. The most general of the three terms, detector, refers to a mechanical, electrical, or chemical device that identifies, records, or indicates a change in one of the variables in its environment, such as pressure, temperature, electrical charge, electromagnetic radiation, nuclear radiation, particulates, or molecules. This term has becomea catchall to the extent that entire instruments are often referred to as detectors. In the context of instrumental analysis, we shall use the term detector in the general sense in which we have just defined it, and we shall use detection systemto refer to entire assemblies that indicate or record physical or chemical quantities. An example is the UV (ultraviolet) detector often used to indicate and record the presence of eluted analytes in liquid chromatography.The term transducer refers specifically to those devices that convert information in nonelectrical domains to information in。