The optical to gamma-ray emission of the Crab pulsar a multicomponent model
光的衍射英文作文
光的衍射英文作文Light DiffractionLight is a fundamental aspect of our physical world, and its behavior has been the subject of intense study and fascination for centuries. One of the most intriguing and complex phenomena associated with light is diffraction, which refers to the bending and spreading of light waves as they encounter obstacles or apertures. This phenomenon has profound implications in various fields, from optics and quantum mechanics to biology and technology.At its core, diffraction is a wave-like property of light, where the interaction between light and the physical structures it encounters leads to the interference and redistribution of the light waves. This process is governed by the principles of wave interference, where the constructive and destructive interference of light waves result in patterns of light and dark regions, known as diffraction patterns.The fundamental principles of diffraction can be understood by considering the wave nature of light. Light, like other forms of electromagnetic radiation, can be described as a wave, with a specific wavelength and frequency. When light encounters an obstacle or anaperture, the waves are forced to bend and spread out, creating a diffraction pattern. The specific characteristics of this pattern are determined by factors such as the size and shape of the obstacle or aperture, as well as the wavelength of the light.One of the most well-known examples of diffraction is the phenomenon of single-slit diffraction. When light passes through a narrow slit, the resulting diffraction pattern consists of a central bright region, known as the central maximum, surrounded by alternating bright and dark regions, known as diffraction fringes. The spacing and intensity of these fringes are directly related to the wavelength of the light and the width of the slit.Another important aspect of diffraction is the concept of the Fraunhofer diffraction, which describes the diffraction pattern observed at large distances from the aperture or obstacle. In this case, the diffraction pattern is characterized by a series of bright and dark spots, known as the Fraunhofer diffraction pattern. This pattern is particularly useful in applications such as optical imaging, spectroscopy, and the design of diffraction-based optical devices.Diffraction also plays a crucial role in the behavior of light in various natural and man-made systems. For example, the diffraction of light through small apertures or slits is responsible for the characteristic patterns observed in the interference of light, such as those seen inYoung's double-slit experiment. Additionally, the diffraction of light around the edges of objects or through small openings is responsible for the phenomena of diffraction fringes, which can be observed in various optical devices and natural phenomena, such as the colorful patterns seen in the wings of some insects or the halos and glories observed around the Sun or Moon.The study of diffraction has also led to the development of numerous applications in science and technology. In optics, diffraction is used in the design of various optical devices, such as diffraction gratings, which are used in spectroscopy and other analytical techniques. In the field of quantum mechanics, the wave-like nature of particles, as described by the de Broglie hypothesis, has led to the observation of diffraction patterns in the behavior of subatomic particles, such as electrons and neutrons.Furthermore, the understanding of diffraction has been instrumental in the development of modern imaging techniques, such as X-ray crystallography, where the diffraction of X-rays by the atoms in a crystal is used to determine the arrangement and structure of the atoms within the crystal. Similarly, the diffraction of light by various biological structures, such as the compound eyes of insects or the structures found in the wings of some butterflies, has inspired the development of biomimetic materials and devices.In conclusion, the phenomenon of light diffraction is a fundamental and fascinating aspect of our physical world. It is a testament to the wave-like nature of light and the complex interplay between light and the physical structures it encounters. The study of diffraction has led to numerous insights and advancements in various fields, and its continued exploration promises to yield further discoveries and innovations that will shape our understanding of the universe and the technology we use to interact with it.。
在海拔5000米以上地区利用单粒子方法探测γ暴实验构想--基于水切伦科夫技术
在海拔5000米以上地区利用单粒子方法探测γ暴实验构想--基于水切伦科夫技术刘茂元;厉海金;扎西桑珠;周毅【摘要】Ground extensive air shower experiment is powerless for detecting cosmic ray particles of tens GeV en⁃ergy renge in the GRBs (Gamma Ray Burst) so far, because of its threshold energy. The experimental altitude needs to be increased in order to achieve more effective observation. In the present paper, setting up a water Che⁃renkov detector array at 5200m altitude in Tibet was proposed and the idea of ground experiments on multi-GRB and tens of GeV photon observing can be achieved by using single-particle technology, and also can supportpre⁃dicting for large-scale experiments.%目前,对于伽玛射线暴(Gamma Ray Burst, GRB)的探测,地面广延大气簇射实验由于阈能原因,对几十GeV能区的宇宙线粒子探测无能为力,只有提高实验海拔才能实现更有效的观测。
文章描述了在海拔5000m以上地区建造水切伦科夫(WCD)探测器阵列,利用单粒子技术,来实现地面实验多GRB几十GeV光子的正观测设想,为大规模实验提供预言支持。
SAGCM-APD增益影响因子分析与优化
SAGCM-APD增益影响因子分析与优化胡大鹏,郭方敏,朱晟伟,熊大元【摘要】应用二维漂移扩散模型研究具有分立吸收层、渐变层、电荷层和倍增层结构(SAGCM)的InGaAsP-InP雪崩光电探测器(APD),仿真分析了不同电荷层、倍增层厚度和掺杂浓度对电场分布、电流响应及击穿电压的影响,特别是参数变量对增益计算模型的影响,载流子传输过程的时间依赖关系和倍增层中所处位置的影响。
仿真结果表明:较高掺杂浓度和较薄电荷层结构可以改变器件内部的电场分布,进而提高增益值。
当入射光波长为1.55 μm,光功率为500 W/m2时,光电流响应量级在10-2A;阈值电压降低到10 V以下,击穿电压为42.6 V时,器件倍增增益值大于100。
【期刊名称】红外与激光工程【年(卷),期】2010(039)002【总页数】6【关键词】SAGCM-APD;雪崩光电探测器;倍增增益;电流响应;仿真分析0 引言雪崩光电探测器(APD)主要应用于高比特的光波传输系统中,相比传统的PIN光电探测器,这种具有内部增益的APD器件是长距离光纤通信系统中的重要器件[1]。
近年来,具有分立吸收层、渐变层、电荷层和倍增层结构(SAGCM)的APD由于其结构优势而被广泛研究[2-8]。
图1是典型的SAGCM-APD结构,把倍增层和吸收层分离是为了得到较低的偏压和低噪声,因此,吸收作用只发生在低带隙材料层中,而应用宽带隙材料作为倍增层则有利于发生倍增效应[3]。
加入高掺杂浓度的电荷层可以使倍增层得到较高增益带宽积所需要的高电场分布[4]。
此外,在吸收层和倍增层之间加入渐变层结构可以减小空穴在异质结界面传输时发生的捕获效应,增加进入倍增层中的载流子数,提高电流响应。
虽然很多文献对SAGCM-APD进行理论研究,但是很少讨论电荷层和倍增层的厚度、掺杂浓度对电流响应及击穿电压的影响。
文中应用二维漂移扩散模型讨论了不同电荷层、倍增层厚度和掺杂浓度对SAGCM-APD电流响应及击穿电压的影响,研究了器件结构参量改变对倍增增益的影响。
Lecture 3 Light and Optics Part 1
Measurements of the Speed of Light
Since light travels at a very high speed, early attempts to measure its speed were unsuccessful
This was important because it demonstrated that light has a finite speed as well as giving an estimate of that speed
Measurements of the Speed of Light – Fizeau’s Method
This means it is directed backward into the first medium
Specular Reflection
Specular reflection is reflection from a smooth surface The reflected rays are parallel to each other All reflection in this text is assumed to be specular
Ray Approximation, cont.
If a wave meets a barrier, we will assume that λ<<d
d is the diameter of the opening
This approximation is good for the study of mirrors, lenses, prisms, etc.
推荐信所以我们看不见的光英语作文
推荐信所以我们看不见的光英语作文英文回答:In the invisible realm of light, beyond the reach of our mortal eyes, lies a vast tapestry of electromagnetic energy. While our vision is confined to a narrow band of wavelengths known as the visible spectrum, there exists a hidden world of light that encompasses a far broader range of frequencies.The electromagnetic spectrum is a continuousdistribution of energy that ranges from high-energy gamma rays to low-frequency radio waves. The visible spectrum, which we experience as colors, occupies a tiny sliver of this spectrum, stretching from violet to red. Beyond the visible spectrum, there are invisible regions of light that have profound effects on our world and our understanding of the universe.Ultraviolet Light:Just beyond the violet end of the visible spectrum lies the ultraviolet (UV) region. UV light has shorter wavelengths and higher energy than visible light. Exposure to UV radiation has both beneficial and harmful effects on humans. Moderate UV exposure promotes vitamin D production, essential for bone health. However, excessive UV exposure can cause sunburn, skin cancer, and premature aging.Infrared Light:On the opposite side of the visible spectrum, beyond red, lies the infrared (IR) region. IR light has longer wavelengths and lower energy than visible light. It is emitted by warm objects and can be detected by thermal imaging systems. IR light is used in a wide range of applications, from remote sensing to night vision goggles.Microwaves:Moving further down the electromagnetic spectrum, we encounter microwaves. Microwaves have even longerwavelengths than IR light. They are commonly used in communication, navigation, and cooking. Microwave ovens heat food by generating electromagnetic waves that vibrate water molecules.Radio Waves:At the lowest end of the electromagnetic spectrum are radio waves. Radio waves have the longest wavelengths and lowest energy among electromagnetic waves. They are usedfor communication and broadcasting. Radio telescopes detect radio waves emitted by celestial objects, providing valuable insights into the distant reaches of the universe.中文回答:在光的不为人知领域,超越我们凡人的眼睛所及范围,存在着一个庞大的电磁能量挂毯。
The Atmospheric Optics of the Earths Atmosphere
The Atmospheric Optics of the Earths Atmosphere The atmospheric optics of the Earth's atmosphere is a fascinating topic that encompasses the study of the various optical phenomena that occur in the atmosphere. From the beautiful colors of the sunrise and sunset to the intricate patterns of the clouds, the Earth's atmosphere provides a canvas for a wide range of optical effects that can be observed by the naked eye.One of the most well-known atmospheric optics phenomena is the rainbow. Rainbows occur when sunlight is refracted, or bent, as it passes through water droplets in the air. This causes the light to be separated into its component colors, creating the familiar arc of colors we see in the sky. Rainbows are a beautiful reminder of the complex interplay between light and the Earth's atmosphere.Another optical phenomenon that is commonly observed in the atmosphere is the halo. Halos are formed when light is refracted through ice crystals in the atmosphere, creating a circular or elliptical ring of light around the sun or moon. These halos are often accompanied by other optical effects, such as sundogs or light pillars, which add to the beauty of the display.Clouds themselves are also a source of optical phenomena. From the wispy cirrus clouds to the towering cumulonimbus clouds, each type of cloud has its own unique visual characteristics. One of the most striking cloud formations is the iridescent cloud, which appears as a rainbow-like patch of colors on the surface of a cloud. This effect is caused by the diffraction of sunlight as it passes through the tiny water droplets or ice crystals in the cloud.The Earth's atmosphere also plays a crucial role in the observation of celestial bodies. The atmosphere acts as a lens, refracting and scattering light from the stars and planets in the sky. This can create a range of optical effects, such as twinkling stars or the reddening of the sun as it sets. The atmosphere also helps to protect the Earth from harmful radiation and particles from space, making it possible for life to exist on our planet.However, the Earth's atmosphere is not without its challenges. Human activities, such as pollution and deforestation, can have a significant impact on the quality of the atmosphere and the optical phenomena that occur within it. Air pollution can obscure the view of the sky and reduce the clarity of the optical effects, while deforestation can alter the atmospheric composition and disrupt the delicate balance of the Earth's climate.In conclusion, the atmospheric optics of the Earth's atmosphere is a fascinating and complex topic that encompasses a wide range of optical phenomena. From the beauty of the rainbow to the intricacy of the cloud formations, the Earth's atmosphere provides a canvas for a diverse range of optical effects that can be observed and appreciated by all. However, it is important to remember that the quality of the atmosphere is fragile and can be easily disrupted by human activities. As such, it is our responsibility to protect and preserve the Earth's atmosphere for future generations to enjoy.。
很全面的资料-中子星与黑洞 Neutron Stars and Black Holes

vesc
vesc
The Schwarzschild Radius
=> There is a limiting radius where the escape velocity reaches the speed of light, c:
Black Holes
Just like white dwarfs (Chandrasekhar limit: 1.4 Msun), there is a mass limit for neutron stars:
Neutron stars can not exist with masses > 3 Msun
We know of no mechanism to halt the collapse of a compact object with > 3 Msun. It will collapse into a single point – a singularity:
=> A Black Hole!
Escape Velocity
Pulsars / Neutron Stars
Neutron star surface has a temperature of ~ 1 million K.
Cas A in X-rays
Wien’s displacement law,
lmax = 3,000,000 nm / T[K] gives a maximum wavelength of lmax = 3 nm, which corresponds to X-rays.
光学专业英语
Iris – aperture stop虹膜孔俓光珊retina视网膜[ˈrɛtnə]Color Blind 色盲weak color 色弱Myopia – near-sighted 近视(Myopia[maɪˈopiə])Sensitivity to Light感光灵敏度(Sensitivity [ˌsɛnsɪˈtɪvɪti])boost推进[bust]lag behind落后于Hyperopic – far-sighted 远视Dynamic Range 动态范围(Dynamic[daiˈnæmik])critical fusion frequency 临界融合频率(critical[ˈkrɪtɪkəl])fusionˈfjuʒən]CFF临界闪变频率visual sensation视觉Chromaticity Diagram色度图 Chromaticity[ˌkroməˈtɪsɪti]Color Temperature色温HSV Model色彩模型(hue色度[hju]saturation饱和度value纯度CIE Model 相干红外能量模式Complementary Colors补色Bar Pattern条状图形Heat body 热稠化approximate近似violet紫罗兰Body Curve人体曲线Color Gamut色阶adjacent邻近的normal illumination法线照明Primary colors红黄蓝三原色Color saturation色饱和度Color Triangle颜色三角Color Notation颜色数标法Color Difference色差TV Signal Processing电视信号处理Gamma Correction图像灰度校正Conversion Tables换算表out of balance失衡wobble摇晃back and forth前后clear (white) panel白光板vibrant震动fuzzy失真quantum leap量子越迁SVGA (800x600)derive from起源自culprit犯人render呈递inhibit抑制,约束stride大幅前进blemish污点obstruction障碍物scratch刮伤substance物质实质主旨residue杂质criteria标准parameter参数adjacent邻近的接近的asynchrony异步cluster串群mutually互助得algorithm运算法则Chromatic Aberrations色差Fovea小凹Visual Acuity视觉灵敏度Contrast Sensitivity对比灵敏度Temporal (time) Response反应时间rendition表演,翻译animation活泼又生气ghost重影Parallax视差deficient缺乏的不足的Display panel显示板NG.( Narrow Gauge)窄轨距dichroic mirror二色性的双色性的Brewster Angle布鲁斯特角Polarized Light极化光Internal reflection内反射Birefringence 双折射Extinction Ratio 消光系数Misalignment 未对准Quarter Waveplates四分之一波片blemish污点瑕疵Geometric几何学的ripple波纹capacitor电容器parallel平行的他tantalum钽(金属元素)exsiccate使干燥exsiccate油管,软膏furnace炉子镕炉electrolytic电解的,由电解产生的module模数analog类似物out of the way不恰当pincushion针垫拉lateral侧面得rectangle长方形fixture固定设备control kit工具箱DVIconnector DVI数局线Vertical垂直的horizontal 水平的interlace隔行扫描mullion竖框直楞sawtooth锯齿[ˈsɔtuθ]toggle套索钉keypad数字按键键盘tangential切线diagnostic tool诊断工具sagittal direction径向的sagittal[ˈsædʒɪtl]cursor position光标位置3Yw'/#p3`ray aberration光线相差weighting factor权种因子variables变量for now暂时,目前.眼下check box复选框Airy disk艾里斑exit pupil出[射光]瞳optical path difference光称差with respect to关于diffraction limited衍射极限wavefront aberration波阵面相差spherical aberration球面象差paraxial focus傍轴焦点chromatic aberration象差local coordinate system局部坐标系统coordinate system坐标系orthogonal直角得,正交的conic sections圆锥截面account for解决,得分parabolic reflector拋物面反射镜radius of curvature曲率半径spherical mirror球面镜geometrical aberration几何相差incident radiation入射辐射global coordinate总体坐标in terms of根据按照reflected beam反射束FYI=for your information供参考Constructive interference相长干涉phase difference相差achromatic singlet消色差透镜Interferometer干涉仪boundary constraint边界约束,池壁效radii半径Zoom lenses变焦透镜Beam splitters分束器discrete不连续的,分离的objective/eye lens物镜/目镜mainframe主机rudimentary根本的,未发展的photographic照相得摄影得taxing繁重的,费力得algebra代数学trigonometry三角学geometry几何学calculus微积分学philosophy哲学lagrange invariant拉格朗日不变量spherical球的field information场信息Standard Lens标准透镜Refracting Surface折射面astigmatism散光HDTV高清晰度电视DLV ( Digital Light Valve)数码光路真空管,简称数字光阀diffraction grating衍射光珊field angle张角paraxial ray trace equations近轴光线轨迹方称back focal length后焦距principal plane主平面vertex顶点,最高点astigmatism散光,因偏差而造成的曲解或错判medial中间的,平均的variance不一致conic圆锥的,二次曲线field of view视野collimator瞄准仪convolution回旋.盘旋,卷积fuzzy失真,模糊aberrated异常的[ˈæbəˌretɪd]asymmetry不对称得[eˈsɪmɪtri]indicative可表示得[ɪnˈdɪkətɪv]parabolic拋物线得[ˌpærəˈbɑlɪk]suffice足够,使满足specification规格,说明书[ˌspɛsəfɪˈkeʃən]straightforward易懂的,直接了当的[stretˈfɔrwəd],solidify凝固,巩固.Constraints 约束,限制metrology度量衡field coverage视场,视野dictate口述, 口授, 使听写, 指令, 指示, 命令, 规定irradiance发光, 光辉,辐照度aerial空气得,空中得halide卤化物的monochromatic单色的,单频的polychromatic多色的aspherical非球面的spherical球面的alignment列队,结盟power(透镜)放大率equiconvergence 同等收敛EFL(effective focal length)有效焦距workhorse广为应用的设备biconvex两面凸的global optimization整体最优化concave凹得,凹面得cylindrical圆柱得solid model实体模型Modulation Transfer Function调制传递函数in the heat of在最激烈的时候protocol协议,规定triplet三重态sanity心智健全zinc锌,涂锌的selenide 硒化物,硒醚miscellaneous各色各样混在一起, 混杂的, 多才多艺的versus与...相对polynomial多项式的coefficient系数explicit function显函数" wYgi%distinct清楚的,截然不同的emanate散发, 发出, 发源rudimentary根本的,未发展的intersection角差点PRTE=paraxial ray trace equation旁轴光线轨迹方程achromats 消色差透镜cardinal points基本方位separations分色dashed虚线blow up放大overlay覆盖,覆盖图multiplayer 多层的humidity 湿度float glass浮法玻璃square one 出发点,端点square up to 准备开打,坚决地面对reflecting telescope 反射式望远镜diagnostic tools诊断工具Layout plots规划图Modulation transfer function调制转换功能FFT快速傅里叶变换Point spread function点传播功能wavelength波长angle角度absorption吸收system aperture系统孔径lens units透镜单位wavelength range波长范围singlet lens单业透镜spectrum光谱diffraction grating衍射光栅asphere半球的LDE=Lens data editor Surface radius of curvature表面曲率半径surface thickness表面厚度material type材料种类semi-diameter半径focal length焦距aperture type孔径类型aperture value孔径值field of view视场microns微米F, d, and C= blue hydrogen, yellow helium, red hydrogen lines, primary wavelength主波长sequential mode连续模式object surface物表面The front surface of the lens透镜的前表面stop光阑The back surface of the lens透镜的后表面The image surface像表面symmetric相对称的biconvex两面凸的The curvature is positive if the center of curvature of the surface is to the right of the vertex. It is negative if the center of curvature is to the left of the vertex.如果曲率中心在最高点的右边,曲率值为正,如果曲率中心在最高点的左边,则曲率为负image plane像平面Ray Aberration光线相差tangential direction切线方向sagittal direction径向paraxial focus旁轴的Marginal边缘的spherical aberration球面像差Optimization Setup最优化调整variable变量mathematical sense数学角度MFE= Merit Function Editor, Adding constraints增加约束focal length焦矩长度operand操作数the effective focal length有效焦矩primary wavelength主波长initiate开始spot diagram位图表Airy disk艾里斑axial chromatic aberration轴向色差with respect to关于至于exit pupil出射光瞳OPD=optical path difference光学路径差diffraction limited衍射极限chromatic aberration色差chromatic focal shift色焦距变换paraxial focus傍轴焦点axial spherical aberration轴向球差(longitudinal spherical aberration 纵向球差:沿光轴方向度量的球差) lateral spherical aberration垂轴球差(在过近轴光线像点A‵的垂轴平面内度量的球差)coma、comatic aberration彗差meridional coma子午彗差sagittal coma弧矢彗差astigmatism像散local coordinate system本地坐标系统meridional curvature of field子午场曲sagittal curvature of field弧矢场曲decentered lens偏轴透镜orthogonal直角的垂直的conic section圆锥截面account for说明,占有,得分stigmatic optical system无散光的光学系统Newtonian telescope牛顿望远镜parabolic reflector抛物面镜foci焦距chromatic aberration,色差superpose重迭parabola抛物线spherical mirror球面镜RMS=Root Mean Square均方根wavefront波阵面spot size光点直径Gaussian quadrature高斯积分rectangular array矩阵列grid size磨粒度PSF=Point Spread Function点扩散函数FFT=Fast Fourier Transform Algorithm快速傅里叶变换Cross Section横截面Obscurations昏暗local coordinates局部坐标系统vignette把…印为虚光照Arrow key键盘上的箭头键refractive折射reflective反射in phase同相的协调的Ray tracing光线追迹diffraction principles衍射原理order effect式样提出的顺序效果energy distribution能量分配Constructive interference相长干涉dispersive色散的Binary optics二元光学phase advance相位提前achromatic single消色差单透镜diffractive parameter衍射参数Zoom lenses变焦透镜Athermalized lenses绝热透镜Interferometers干涉计Beam splitter分束器Switchable component systems可开关组件系统common application通用symmetry对称boundary constraint边界约束multi-configuration (MC) MC Editor (MCE) perturbation动乱,动摇index accuracy折射率准确性index homogeneity折射率同种性index distribution折射率分配abbe number离差数Residual剩余的Establishing tolerances建立容差figure of merit质量因子tolerance criteria公差标准Modulation Transfer Function (MTF)调制传递函数boresight视轴,瞄准线Monte Carlo蒙特卡洛Tolerance operands误差操作数conic constant ]MC1"{_qT 圆锥常数astigmatic aberration像散误差Mechanical tilt机械倾斜,机械倾角Tolerance Data Editor (TDE)公差资料编辑器compensator补偿棱镜estimated system performance预估了的系统性能iteratively反复的,重迭的statistical dependence统计相关性sequential ray trace model连续光线追迹模型imbed埋葬,埋入multiple多样的,多重的,若干的Non-Sequential Components不连续的组件Corner cube角隅棱镜,三面直角透镜Sensitivity Analysis灵敏度分析Faceted reflector有小面的反射镜emit发射,发出nest嵌套overlap交迭outer lens外透镜brute force强力seidel像差系数aspect ratio长宽比MRA边缘光线角MRH边缘光线高度asynchronous不同时的,异步Apodization factor变迹因子hexapolar六角形dithered高频脉冲衍射调制传递函数(DMTF),衍射实部传递函数(DRTF),衍射虚部传递函数(DITF),衍射相位传递函数(DPTF),方波传递函数(DSWM)logarithmic对数的parity奇偶% Uc,I e longitudinal aberrations 纵向像差赛得系数:球差(SPHA,SI)彗差(COMA,S2),像散(ASTI,S3),场曲(FCUR,S4),畸变(DIST,S5),轴向色差(CLA,CL)和横向色差(CTR,CT).横向像差系数:横向球差(TSPH),横向弧矢彗差(TSCO),横向子午彗差(TTCO),横向弧矢场曲(TSFC),横向子午场曲(TTFC),横向畸变(TDIS)横向轴上色差(TLAC)。
Gamma-ray detection and measurement equipment
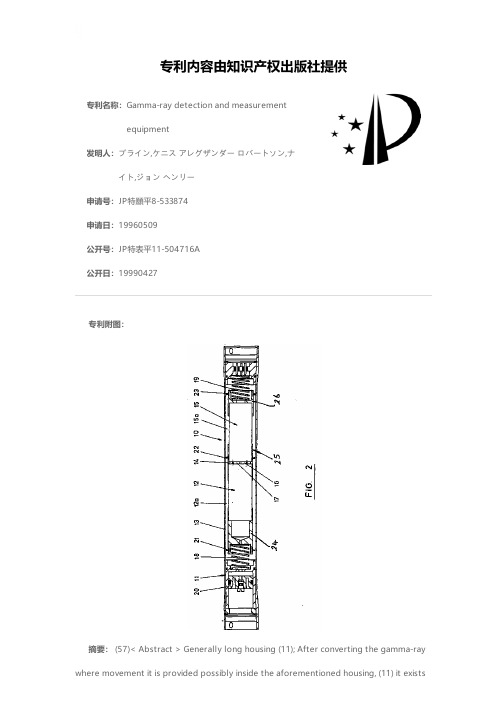
专利名称:Gamma-ray detection and measurementequipment发明人:プライン,ケニス アレグザンダー ロバートソン,ナイト,ジョン ヘンリー申请号:JP特願平8-533874申请日:19960509公开号:JP特表平11-504716A公开日:19990427专利内容由知识产权出版社提供专利附图:摘要: (57)< Abstract > Generally long housing (11); After converting the gamma-ray where movement it is provided possibly inside the aforementioned housing, (11) it existsin the local environment where the device is installed and passes the wall (13) and of the aforementioned housing in order to react to the gamma-ray which arrives, is constituted, aforementioned arrives in inside the scintillator module which possesses the optical output (14) which transmits the optical signal; In the aforementioned housing (11) movement it is provided possibly, in order to receive the aforementioned optical output from aforementioned scintillator module, is formed the entry (16) which, possesses at aforementioned scintillator module it was detected arrives according to the energy and the flux of the gamma emission which converting instantaneous optical output to electric output possible optical converter module (15); To have, aforementioned output (14) of aforementioned scintillator module (12) and aforementioned entry of aforementioned converter module (15) approaching mutually and be alienated, between both, the space (17) where in order to improve the transmission Characteristic of the aforementioned optical signal to aforementioned entry of aforementioned converter module it is filled up in the optical fluid the picture being the gamma-ray detector and the measurement equipment which are formed; In order to restrict the flow of the fluid with the aforementioned chamber and the aforementioned space in order inside the aforementioned housing (11), aforementioned output (14) of aforementioned scintillator module (12) and the aforementioned space (17) with aforementioned entry (16) of aforementioned converter module (15) and the communication possible housing chamber (12a and 15a), the flow limiter the aforementioned chamber and/or communicate with the aforementioned space while the picture forming and use, to be attenuated one side or both motions of aforementioned module inside the aforementioned housing, the gamma-ray detector which features that it is constitutedAnd measurement equipment.申请人:ジオリンク (ユーケー) リミテッド地址:イギリス国,アバディーン エイビー2 0ジーゼッド,ダイス,カークヒル・インダストリアル・エステイト,ウォールトン・ロード(番地なし)国籍:GB代理人:伊東 忠彦 (外1名)更多信息请下载全文后查看。
散发光 成为光英语作文
散发光成为光英语作文Radiating Light: The Luminary of the Universe.In the vast expanse of the cosmos, countless celestial bodies emit radiant energy, illuminating the darkness and illuminating our understanding of the universe. Among these luminous celestial objects, stars reign supreme as the primary source of light, energy, and awe for observers both on Earth and beyond.Stars, the building blocks of galaxies, are incandescent beacons of plasma held together by their own gravitational forces. Within their nuclear furnaces, the fusion of hydrogen atoms into helium releases prodigious amounts of energy, a process that sustains their brilliance for billions of years. This energy manifests as electromagnetic radiation, which travels through space as a spectrum of light waves.The light emitted by stars encompasses a vast range ofwavelengths, from short-wavelength gamma rays to long-wavelength radio waves. However, the human eye is only capable of perceiving a narrow band within this spectrum, known as visible light. Visible light ranges from violet to red, with each wavelength corresponding to a different color.Stars exhibit a remarkable diversity in their light output, ranging from faint and barely visible to dazzling and brilliant. The brightness of a star, as perceived by an observer on Earth, depends on several factors, includingits size, temperature, and distance from Earth.Large stars, with greater masses and hence more fuel to burn, typically emit more light than smaller stars. Temperature also plays a crucial role in determining astar's luminosity. Hotter stars emit blue and white light, while cooler stars radiate yellow or red light.The distance between a star and Earth also influences its apparent brightness. Stars that are closer to Earth appear brighter than those that are farther away. This isbecause the inverse square law of light dictates that the intensity of light decreases with the square of the distance from the source.The light of stars serves as a valuable tool for astronomers and astrophysicists. By analyzing the spectrum of light emitted by stars, scientists can determine their temperature, chemical composition, and other physical characteristics. This information helps us understand the evolution of stars, the nature of stellar populationswithin galaxies, and the history of the universe itself.Moreover, the light of stars provides a celestial beacon for navigators and explorers. For centuries, seafarers relied on the positions of stars to guide their ships across vast oceans. Even today, spacecraft venturing into the depths of space utilize star charts and celestial navigation to determine their location and trajectory.Beyond its practical applications, the light of stars also holds profound aesthetic and philosophical significance. Throughout human history, stars have capturedthe imagination of poets, artists, and philosophers. Their twinkling radiance has inspired countless works of art, literature, and music. Stars have also been associated with spirituality, divinity, and the pursuit of knowledge and enlightenment.In conclusion, the light of stars permeates our existence, providing both practical and profound benefits. It illuminates the darkness, guides our paths, and fuels our understanding of the universe. As we continue to explore the cosmos and unravel its mysteries, the light of stars will forever remain a constant and awe-inspiring source of wonder and inspiration.。
中子与物质的相互作用
10-8 – 10-9
65Cu
31%
10-9 – 10-10
121Sb
57%
10-9 – 10-10
* 测量1小时 放射性计数100 探测效率10%
应用2:中子测井
中子—中子
中子—伽马
中子 测井
中子寿命
中子活化
利用中子与物质相互作 用的各种效应
研究钻井剖面岩层性质 的一组方法
中子-中子测井
中子源放出快中子,经过一系列碰撞而减弱到热能状态, 最后被吸收 中子的空间分布与物质的减速及吸收性质密切相关。
裂变碎片的总动能为150~170MeV,形成的脉 冲幅度比 本底脉冲幅度大得多,可用于强辐 射场内中子的测量。
热中子可引起的核裂变核:233U,235U,239Pu。 如235U的热中子截面为580b。对慢中子满足1/v 规律,仅适用于热中子的注量率测量。
一些重核只有当中子能量大于某一阈能才能 发生核裂变,可用此判断中子的能量。
2 中子的分类与性质
(1)中子的分类 1) 慢中子:0~1KeV。包括冷中子、热 中子、超热中子、共振中子。
热中子:与吸收物质原子处于热平衡状态, 能量为0.0253eV,中子速度~2.2×10³m/s.
2) 中能中子:1KeV~0.5MeV。
3) 快中子:0.5MeV~10MeV。
4) 特快中子:>10MeV。
24He
01n
17.6MeV (Q-value)
Notes :
1) 1 mA D (accelerated potentiao 100~300keV) → 109n/s (D-D), 1011n/s(D-T). 2) Other neutron generators (higher energy): 9Be(d,n), 7Li(p,n), 3H(p,n)
光学效应英语作文
光学效应英语作文In the realm of physics, optical phenomena are thecaptivating interactions between light and matter that shape our visual experiences. These phenomena are not only fundamental to our understanding of the world but also play a crucial role in various technologies and applications we encounter daily.Reflection and Refraction: The most common optical effects are reflection and refraction. Reflection occurs when light bounces off a surface, as seen in mirrors that create images. Refraction, on the other hand, happens when light passes through a medium with a different density, causing it to change direction. This is the principle behind lenses used in eyeglasses and cameras.Dispersion: Dispersion is the separation of light into its constituent colors when it passes through a prism. Thiseffect is responsible for the beautiful rainbows we see after a rain shower, as sunlight is refracted and dispersed by raindrops.Diffraction: Diffraction is the bending of light around obstacles or through slits. It is the reason why we can see shadows with sharp edges and why light can spread out to illuminate areas behind an object, even though the object blocks a direct line of sight.Polarization: Polarization is the alignment of light waves in a specific direction. It is used in sunglasses to reduce glare from reflective surfaces like water or glass, making it easier to see in bright conditions.Total Internal Reflection: This occurs when light traveling from a denser medium to a less dense medium hits the boundary at an angle greater than the critical angle. Instead of passing through, the light is completely reflected back into the denser medium. This is the principle behind fiber optics, which is used for high-speed data transmission.Lenses and Optical Instruments: Lenses are the heart of many optical devices, from microscopes to telescopes. They use refraction to magnify, focus, or disperse light, allowing us to see objects at different scales and distances.Laser Technology: Lasers, which produce highly concentrated beams of light, are a product of optical phenomena. They have a wide range of applications, from medical procedures to industrial manufacturing and even in everyday items likelaser pointers.Optical Illusions: Optical illusions exploit the way our eyes and brain process visual information, often playing with perspective, contrast, and color to create images that trick our senses.Conclusion: Optical phenomena are not just scientific curiosities; they are integral to our daily lives. From the way we see the world around us to the technologies thatenhance our experiences, the study of light and its interactions with matter is a fascinating field that continues to inspire innovation and discovery.。
光谱学英语
光谱学英语一、单词1. spectrum(复数:spectra)- 英语释义:A band of colors, as seen in a rainbow, produced by separation of theponents of light by their different degrees of refraction according to wavelength.- 用法:可以用作名词,如“The spectrum of light includes colors f rom red to violet.”(光谱包括从红色到紫色的颜色。
) - 双语例句:The visible spectrum is just a small part of the electromagnetic spectrum.(可见光谱只是电磁光谱的一小部分。
)2. spectroscopy- 英语释义:The study of the interaction between matter and radiated energy, especially in terms of the frequencies present in a spectrum of the radiation.- 用法:作名词,例如“Spectroscopy is widely used in chemical analysis.”(光谱学在化学分析中被广泛应用。
)- 双语例句:Infrared spectroscopy can be used to identify different chemicalpounds.(红外光谱学可用于识别不同的化合物。
)3. wavelength- 英语释义:The distance between successive crests of a wave, especially points in a sound wave or electromagnetic wave.- 用法:名词,如“Each color has a different wavelength.”(每种颜色都有不同的波长。
[指南]专业词汇(天体物理)
![[指南]专业词汇(天体物理)](https://img.taocdn.com/s3/m/28d39093bdeb19e8b8f67c1cfad6195f312be84a.png)
专业词汇(天体物理)1、Galactic background γ-ray radiation 银河γ背景辐射2、active galactic nuclei 活动星系核3、radio survey 射电巡天4、ultraviolet fluxes 紫外流量5、Roche-lobe overflow 洛希瓣超流6、abnormal redshift 反常红移7、absorption cross section 吸收截面8、acceleration mechanism 加速机制9、general electric synchrotron 广义电同步加速10、screening effect 屏蔽效应11、visible spectrum 可见光谱12、celestial matter 宇宙物质13、broad emission-line 宽发射线14、narrow emission-line 窄发射线15、planetary nebulae 行星状星云16、isotropic antenna 各向同性天线17、Seyfert galaxy 赛弗特星系18、ultraviolet continuum 紫外连续谱19、bolometric luminosity 光度20、variable time scale 可变时标21、continuum emission 连续辐射22、power law 幂率23、non-thermal 非热24、blazar spectra blazar光谱25、polarization 偏振26、doppler broadened 多普勒展宽27、碰撞激发 collisional excitation28、photoionization 光致电离29、horizon of the universe 宇宙视界30、Coulomb collision 库仑碰撞31、Coulomb coupling 库仑耦合32、Born approximation 玻恩近似33、absolute magnitude 绝对星等34、absolute parallax 绝对视差35、overmassive object 超大质量天体36、gravitational wave 引力波37、gravitational-wave astronomy 引力波天文学38、error distribution 误差分布39、chromatic aberration 色差40、characteristic function 特征函数41、CGRO 康普顿γ射线天文台(Compton Gamma-Ray Observatory)42、central lobe 中心瓣43、Rayleigh criterion 瑞利判据44、Rayleigh limit 瑞利极限45、quasi-stellar object 类星体(QSO)46、quiescent radiation 宁静辐射47、quiescent spectrum 宁静光谱48、radial-velocity survey 视向速度巡天49、absorption frequency 吸收频率50、background radiation 背景辐射51、light illumination 光照度52、radiant power 辐射功率53、anisotropic medium 各向异性介质54、plasma jet instability 各向异性等离子体喷流不稳定性55、cosmic rays 宇宙线56、Zeeman effect 塞曼效应57、annihilation radiation 湮灭辐射58、radiometric magnitude 辐射星等59、proton flux 质子流量60、Abell cluster 阿贝尔星系团61、autocorrelation coefficient 自相关系数62、dark matter 暗物质63、Maxwellion distribution 麦克斯韦分布64、black hole binary 黑洞双星65、blanketing factor 覆盖因子66、radio galaxy 射电星系67、Cauchy's dispersion formula 柯西色散公式68、intergalactic medium 星系际介质69、shock wave 激波70、background Compton scattering 背景康普顿散射71、dark energy 暗能量72、multiple galaxy 多重星系73、current density 流密度74、thermodynamic equilibrium 热动平衡75、thermal excitation 热激发76、synchrotron radiation 同步加速辐射77、synchro-cyclotron radiation 同步-回旋加速辐射78、center of curvature 曲率中心79、super-relativistic effect 极端相对论性效应80、active binary 活动双星81、compact binary 致密双星82、compact galaxy nucleus 致密星系核83、supernova explosion 超新星爆发84、supernova ejecta 超新星喷射物85、deflection angle 偏转角86、cosmic noise absorption 宇宙噪声吸收87、string theory 宇宙弦理论88、stripped plasma 全电离等离子体89、close binary star 密近双星90、stellar-mass black hole 恒星质量黑洞91、ultraviolet radiation 紫外辐射92、aberration 光行差93、spontaneous emission 自发发射94、curvature radiation 曲率辐射95、spontaneous transition 自发跃迁96、peculiar spectrum 特殊光谱97、particle horizon 粒子视界98、stimulated radiation 受激辐射99、stimulated emission 受激发射100、circular polarization 圆偏振101、damping radiation 阻尼辐射102、spherical harmonics 球谐函数103、parity nonconservation 宇称不守恒104、drifting zebras 漂移带105、parallax second 秒差距(parsec) (pc)106、geometric aberration 几何象差107、electric multipole radiation 电多极辐射108、Voigt effect 佛克特效应109、monotonic model 单调宇宙模型110、isochronous correspondence 等时对应111、gas nebula 气体星云112、cepheid parallax 造父视差113、diffusion equation 扩散方程114、advancing shock front 前进激波前115、advection dominated accretion 径移吸积流116、spherical potential 球对称势117、luminous emittance 发光度118、cosmic gusher 宇宙喷射源119、microwave background 微波背景120、herpolhode 空间极迹121、heat of desorption 退吸热122、termination shock 终端激波123、very hard binary 甚硬双星124、weak turbulence theory 弱湍流理论125、nova-like X-ray source 类新星 X 射线源126、longitudinal chromatic aberration 纵向色差127、statistical equilibrium 统计平衡128、Compton cross-section 康普顿截面129、irregular nebula 不规则星云130、stellar astrophysics 恒星天体物理131、background radiation intensity 背景辐射强度132、optical binary 光学双星133、astronomical coordinate system 天文坐标系统134、orbital inclination 轨道倾角135、critical mass 临界质量136、Kerr-Newman black hole 克尔-纽曼黑洞137、Kerr-Newman metric 克尔-纽曼度规138、chromatism 色差139、reflection at critical angle 临界角反射140、source brightness distribution 源亮度分布141、Laplace's nebular hypothesis 拉普拉斯星云假说142、photoionized plasma 光电离等离子体143、photoluminescence 光致发光144、relaxation time 弛豫时间145、cross-correlation function 互相关函数146、relaxed cluster 驰豫星团147、disk-like structure 盘状结构148、fast-spinning black hole 快自旋黑洞149、Fermi Gamma-ray Space Telescope 费米γ射线空间望远镜150、time reversal 时间反演。
光学效应 英语作文
光学效应英语作文1. The optical effect of a rainbow is truly mesmerizing, with its vibrant colors stretching across the sky in a beautiful arc.2. When light passes through a prism, it is refracted and dispersed into its component colors, creating astunning display of the visible spectrum.3. The phenomenon of total internal reflection occurs when light travels from a medium with a higher refractive index to one with a lower refractive index, causing thelight to reflect back into the original medium.4. Mirages are another fascinating optical effect,where hot air near the ground causes light to bend and create illusions of water or objects that are not actually there.5. Diffraction is a phenomenon where light waves bendaround obstacles, creating patterns of light and dark fringes that can be observed in everyday life, such as when light passes through a narrow slit.6. The concept of polarization involves aligning light waves in a specific orientation, which can be seen in polarized sunglasses that reduce glare and improvevisibility in bright conditions.7. Holography is a unique optical effect that uses interference patterns to create three-dimensional images, adding depth and realism to photographs and other visual media.8. The optical effect of fluorescence occurs when a substance absorbs light at one wavelength and emits light at a longer wavelength, producing a glowing or fluorescent appearance.。
optic wave(final)
nr
[3] Phase difference:
2
a n · x
b ·
Example
S1
r1 n d r2
P ·
Find the phase difference at point P between light S1 and S2.
S2
NOTE
The lens does not change the optical path difference of light lines passed through it.
P202:
E2
Wave train
t 10-8s
E1
= (E2-E1)/h
L=tc
(2) General Method to Obtain Coherent Light
If we could divide each light wave train in a light beam (no matter whether the light beam is monochromatic or composite light) into two light wave trains, then each couple of light wave trains is coherent light.
In this chapter we will mainly investigate the optical interference, diffraction and polarization based on viewpoint that the light is a wave similar to mechanical wave.
The humankind started very early to study the light. “Mo jingo” is a Chinese ancient classic book written in over 400 years B. C. The book may be the earliest record in world about the light propagation along a straight line and the object image for lenses. However, the systematic optical theory, specially the wave optics is produced in the later half of 17 century. Newton, Huygens and other physicists have made great contributions to the modern optics.
光的衍射英语作文
光的衍射英语作文如下:Title: The Phenomenon of Light DiffractionLight diffraction is a fascinating optical phenomenon that has captivated scientists and laypeople alike for centuries. At its core, diffraction refers to the bending of light waves around an obstacle or through an aperture, resulting in a deviation from the expected straight-line path. This intriguing behavior of light not only challenges our intuitive understanding of how light should behave but also plays a crucial role in various applications, from fiber optics to medical imaging.To delve into the world of light diffraction, it's essential to grasp the basic principles of wave optics. Light, as described by the wave theory, consists of oscillating electromagnetic fields that travel in waves. When these waves encounter an obstacle or aperture whose dimensions are comparable to the wavelength of light, they cannot maintain their original direction of propagation. Instead, they spread out and interfere with one another, leading to the characteristic patterns associated with diffraction, such as the bright and dark bands observed in diffraction gratings.One classic experiment that demonstrates light diffraction is the double-slit experiment. Here, a beam of light is directed towards a screen with two closely spaced slits. Rather than producing two distinct lines on the screen, corresponding to each slit, the result is a series of alternating light and dark bands. This pattern arises because the waves passing through each slit interfere with one another, constructively in the bright bands and destructively in the dark ones.The mathematical description of diffraction involves complex wave equations, which can be solved using techniques from physics and mathematics. These solutions allow us to predict the intensity distribution of light after diffraction and have been instrumental in the design of optical instruments such as telescopes and microscopes. Moreover, the principles of diffraction have found application in technologies like holography, where interference patterns are used to reconstruct three-dimensional images.Despite its utility, light diffraction also presents challenges in certain contexts, such as in the resolution limits of optical systems. The diffractive spreading of light can blur images, making it difficult to achieve high resolution in imaging devices. However, by understanding and manipulating diffraction effects, scientists have developed methods to enhance image quality, such as phase-contrast microscopy and adaptive optics.In conclusion, light diffraction is a profound natural phenomenon that reveals the wave-like nature of light and has significant implications for both pure science and technological innovation. Its study has led to a deeper understanding of the behavior of light and has inspired countless advancements in optics and photonics. As we continue to explore the properties of light and its interaction with matter, the concept of diffraction remains a cornerstone of modern physics, offering endless opportunities for discovery and application.。
伽马辐照对掺镱硅酸盐玻璃光学性能的影响
伽马辐照对掺镱硅酸盐玻璃光学性能的影响盛于邦;邢瑞先;栾怀训;刘自军;李进延;戴能利【摘要】A series of Yb-doped silicate glasses were prepared by a conventional melting method under normal processing conditions. The effects of gamma-ray (from a 60Co γ source) radiation on the absorption and emission properties of all glass samples were investigated. The radiation exposure leaded to the formation of color centers in glass samples. Such radiation-induced photodarkening caused a strong broad optical absorption band, which had a maximum wavelength centered at around 400 nm and the tail extended into the near infrared region. In addition, a minor part of the Yb3+ ions were converted into Yb2+ by trapping free electrons during irradiation based on the radiation induced absorption (RIA) spectra. The excitation energy could be transferred from Yb3+ ions to radiation-induced defects through cooperative upconversion or multiphoton absorption processes under 960 nm LD pumping. Such energy transfer processes resulted in a decrease of the upper state lifetime of Yb ion which was accompanied by an increase in oxygen deficient center ODC(Ⅱ) defect fluorescence at around 476 nm. Photobleaching effect was observed in irradiated Yb-doped glasses during the fluorescence measurement at room temperature.%采用传统的高温熔融法熔制了一系列掺镱硅酸盐玻璃,并测试了这些样品经总剂量为5 kGy的钴-60伽马射线辐射源辐照前后的吸收谱、荧光谱和上转换发光光谱.实验结果表明:辐致暗化效应导致玻璃样品在400 nm附近出现一个非常强的宽吸收带,其尾端可延伸至近红外区.经辐致损耗谱分析可知,部分Yb3+离子在辐照过程中通过俘获电离自由电子转变成了Yb2+离子,导致掺杂样品的辐致损耗明显比基质材料的要大.在960 nm LD泵浦下辐照过的样品荧光强度、上转换发光强度及荧光寿命均有所下降,且在476 nm附近出现了氧缺陷ODC(Ⅱ)的荧光.室温下辐照过的样品在荧光测试过程中温度明显升高并出现漂白现象.【期刊名称】《无机材料学报》【年(卷),期】2012(027)008【总页数】5页(P860-864)【关键词】掺镱硅酸盐玻璃;辐致损耗;价态转变;色心荧光【作者】盛于邦;邢瑞先;栾怀训;刘自军;李进延;戴能利【作者单位】华中科技大学武汉光电国家实验室,光电子科学与工程学院,武汉430074;华中科技大学武汉光电国家实验室,光电子科学与工程学院,武汉430074;华中科技大学武汉光电国家实验室,光电子科学与工程学院,武汉430074;华中科技大学武汉光电国家实验室,光电子科学与工程学院,武汉430074;华中科技大学武汉光电国家实验室,光电子科学与工程学院,武汉430074;华中科技大学武汉光电国家实验室,光电子科学与工程学院,武汉430074【正文语种】中文【中图分类】TQ171随着科技的发展, 掺镱光纤(YDF)已经被广泛用于光纤激光器和放大器中, 可产生非常高的激光功率和脉冲能量[1-3]. 由于 Yb3+离子的能级结构非常简单(只有基态2F5/2和激发态2F7/2两个能级), 不存在激发态吸收和浓度淬灭效应, 故掺镱光纤具有很高的能量转换效率和量子效率[4]. Yb3+离子还可以作为敏化剂, 吸收并将泵浦能量传递给其他发光离子, 比如 Er3+离子, 可以极大地提高后者的发光效率[5-6]. 此外, 较长的上能级寿命和较小量子缺陷等优势更使得掺镱光纤成为低功耗调Q激光器的理想材料[7].掺镱光纤激光器具有高可靠性、高效率、高光束质量、重量轻及体积小等优势, 可做为空间通信、地球观测和深空探测等系统中信息获取与传输的理想器件, 因此得到了世界各国众多航天机构的青睐.但是在太空中石英基有源光纤及其器件难免要受到恶劣的辐射环境影响. 地球轨道天然空间辐射带由范•艾伦(Van Allen)辐射带粒子和宇宙射线(包括太阳宇宙射线和银河宇宙射线)组成, 处于其中的光纤器件所受到的长时间、低剂量率的空间辐照是导致其性能降低甚至失效的主要因素[8-11]. 近几十年来, 辐照对无源及有源光纤的影响已得到各国科研人员的广泛研究. 一般认为光纤性能下降的主要原因在于辐照在基质材料中电离出的自由电子和空穴对被材料中的杂质或初始原子缺陷俘获形成了色心,从而导致在 400 nm附近出现一个非常强的宽吸收带, 其尾端可延伸至近红外区[8,12-14]. 实际上, 太空中辐照剂量率非常低, 即使经过长达十年的时间光纤所受到的总剂量也不超过 2 kGy, 这个剂量对普通光纤的性能影响并不严重.但是对掺镱光纤来说,为了改善光纤性能通常还会共掺一些其他元素, 如铝或磷, 这些共掺剂极大地提高了有源光纤的辐照敏感性[15]. 此外近红外光泵浦下镱离子通过离子间相互作用可以在 500 nm附近产生协同上转换发光[16], 这个波长恰好处在辐致损耗的强吸收范围内;同时由于Yb在硅酸盐玻璃中可以存在Yb2+和Yb3+两种价态, 因此在辐照过程中部分 Yb3+离子有可能俘获电离自由电子转变成Yb2+[17]. 所有这些因素使得辐照对掺镱光纤的影响变得非常复杂.截止目前, 关于掺镱光纤辐照特性的研究多集中在辐致损耗上, 因此有必要就高能辐照对掺镱玻璃材料光学性能的影响机理进行更深入地研究.考虑到辐照会导致玻璃材料在紫外光及可见光区出现新的吸收和荧光带, 实验中选择吸收谱和荧光谱测试作为研究辐照影响的两个主要手段[18]. 通过分析辐致损耗谱和荧光谱发现伽马射线辐照使得玻璃材料中形成了大量的色心, 这些色心具有新的能级结构, 使得基质对泵浦光的损耗明显增大. 实验还研究了960 nm LD泵浦下色心对Yb3+离子的发光特性影响, 并对其机理进行了讨论.1.1 玻璃样品的制备实验所有样品均采用传统高温熔融法制备所得.玻璃组成为 65SiO2-10Al2O3-25CaO-xYb2O3(x=0、0.2mol%、0.5mol%、1.0mol%、2.0mol%). 所用原料均为分析纯级, 其中 CaO以 CaCO3形式引入.按化学计量比准确称取所需的各原料, 然后放在玛瑙研钵中充分研磨均匀, 再装入刚玉坩埚, 整体放入用程序控制的电阻炉中. 在1580℃熔融2 h后, 将熔体浇铸在预热过的垫板上淬冷成型, 为了消除样品中存在的残余应力, 接着在退火炉中600℃退火2 h. 退火后的样品经切割和光学抛光后加工成尺寸为15 mm×15 mm×2 mm的玻璃片供测试.为研究辐照对掺镱硅酸盐玻璃的光学性能影响, 每种样品均用60Co γ辐射源进行了总剂量约为5 kGy的辐照处理.1.2 测试方法掺镱硅酸盐玻璃样品的吸收谱是用PYbkinElmYb-Lambda35紫外可见分光光度计测得,测量波长范围为200~1100 nm. 在960 nm LD泵浦下的荧光谱由ZOLIX SBP300光谱仪测得: 940~1140 nm范围的荧光由InGaAs探测器测得, 400~700 nm范围的由光电倍增管测得. 荧光寿命由 TRIAX550光谱仪测得.所有测试均在室温环境下进行.2.1 伽马辐照对掺镱硅酸盐玻璃吸收光谱的影响基质及Yb2O3掺杂浓度为1.0mol%的样品在伽马射线辐照前后的吸收系数谱如图1(a)所示.由图可知, 经 5 kGy剂量伽马射线辐照后, 所有样品在可见光范围内吸收系数都有明显地增大, 而 Yb3+离子本身的吸收峰值波长、半高宽和吸收系数在辐照前后却基本没有发生变化, 这说明镱离子的周围配位场环境基本没有受到影响, 伽马辐照只是在玻璃基质材料中产生了附加损耗.辐致损耗是衡量辐照对光学材料性能影响的一个关键指标[8,15], 能够反映出材料对高能辐照的敏感性.辐致损耗谱可通过相应各样品在辐照前后的吸收系数相减得到, 计算结果如图1(b)所示. 显然辐照后的样品在400 nm附近出现一个非常强的宽吸收带, 其尾端可延伸到近红外区. 前人的研究表明: 在高能辐射下玻璃材料电离出自由电子与空穴对, 被材料中缺陷俘获形成色心从而产生附加损耗. 这些辐致色心主要包括过氧连接(吸收峰为3.8 eV), DOS环(Dioxasilyrane Ring,~3 eV), 过氧基(2.3 eV)以及非桥氧空穴心(2.0 eV)[19-21].此外高能辐照还可以产生一些吸收带处在深紫外区的色心, 如氧空位ODC(Ⅰ)(7.6 eV), E'类心(5~6 eV),以及氧空位ODC(Ⅱ)(5.0 eV)等[18-20].有必要说明的是, 辐照后掺有 Yb元素的玻璃在可见光区的辐致损耗都要明显大于基质玻璃, 且其吸收强度随 Yb浓度增加而增大. 同时 Yb3+离子在980 nm附近的本征吸收则有所减小, 如图1(b)中插图所示.这可能是因为在辐照过程中材料电离出了自由电子和空穴对, 部分 Yb3+离子通过俘获自由电子而转变成了Yb2+离子, Yb2+离子的4f-5d跃迁引起的吸收带在 22000~55000 cm−1处, 且 f-d振子强度远远大于Yb3+离子的f-f振子强度(约数百倍)[17],故少量三价镱离子变成二价即可导致在紫外光至可见光区出现明显的附加吸收.2.2 伽马辐照对掺镱硅酸盐玻璃发光特性的影响图2为960 nm LD泵浦下, 不同Yb2O3掺杂浓度玻璃在辐照前后的荧光峰值强度. 从图中可知,玻璃的荧光强度随Yb2O3掺杂浓度增加先增大后减弱, 即出现了所谓的“浓度淬灭”现象. 虽然 Yb3+离子只有简单的两个能级, 但在高浓度掺杂时会出现团簇效应而形成 Yb3+离子对, 离子间相互作用可以导致镱离子激发态寿命淬灭, 从而影响样品的发光效率. 辐照后所有的掺镱硅酸盐玻璃荧光强度均明显下降, 且在较高Yb离子掺杂浓度样品中, 辐照后的荧光强度下降幅度较大. 从图 1(b)中可以看出,掺杂浓度越高的样品中, 辐照后 Yb3+离子的吸收下降幅度就越大, 即有越多的 Yb3+离子俘获了电离电子变成了 Yb2+离子. 虽然该过程能够减少辐致色心的数量, 但考虑到 Yb2+离子在 200~500 nm 范围内有较强的吸收, 因此高浓度掺杂样品总的辐致暗化效应就反而更加明显, 荧光强度下降幅度也就更大.但是所有样品荧光谱的峰值波长及半高宽都没有发生明显变化(未给出), 进一步说明了辐照并没有改变Yb3+离子的配位场环境.考虑到掺稀土玻璃在近红外激光泵浦下可能出现上转换现象, 产生位于500 nm附加的上转换荧光, 我们测试了辐照前后各样品在960 nm LD泵浦下的协同上转换荧光谱, 如图 3所示, 以深入研究伽马辐照对掺镱硅酸盐玻璃光学特性的影响.荧光谱在488和500 nm处有两个较明显的波峰, 荧光强度随 Yb2O3掺杂浓度增加而线性增大, 没有出现淬灭现象. 同近红外的荧光谱类似, 辐照后各样品协同上转换荧光强度也都有所减弱(Yb2O3浓度为2.0mol%的样品辐照后上转换荧光谱由于样品损坏没有给出). 协同发光是由两个处于激发态的近邻镱离子同时去激产生的, 荧光谱呈多峰值结构, 每个峰值分别对应两个能级对之间的跃迁:2F5/2(m)+2F5/2(m')→2F7/2(n)+2F7/2(n'), m, m'=1, 2, 3; n, n'=1, 2, 3,4.实际上, 掺镱硅酸盐玻璃协同上转换荧光谱还可以通过对其在近红外的荧光谱自卷积得到[16], 协同发光谱形函数F(E)与Yb3+的2F5/2→2F7/2跃迁自发辐射谱f(E)关系可由下式所示:Yb2O3掺杂浓度为 1.0mol%的样品未辐射上转换荧光谱计算结果如图 3中虚线所示. 由图可知,同测试结果一致计算所得上转换荧光谱也是在 488和500 nm附近有两个较明显的波峰, 只是后者荧光强度相对更大一些. 这或许跟测试荧光谱和上转换荧光谱时使用的探测器不同有关. 对比辐照后样品上转换荧光谱还可以发现, 500 nm附近的荧光强度下降幅度明显比488 nm处的要大一些, 这跟吸收测试中观察到的现象是矛盾的, 如图 1显示短波长处的辐致损耗相对更大, 可以猜测这可能跟某些能级结构之间的能量传递机制有关. 同时辐照过的样品在476 nm附近出现了一个新的荧光峰, 虽然在这个波长处有很强的辐致损耗, 该荧光峰强度仍高于未辐照的样品. 根据前人对辐致色心的研究, 此荧光峰应归结为ODC(Ⅱ)色心[22].该色心的吸收带在 5.0 eV(249 nm)处, 可以通过对协同上转换荧光进行双光子吸收激发, 在2.6 eV(478 nm)处产生一个荧光峰,当然具体的相关能量传递机理还需要后续进行更加深入的研究.结合辐致损耗谱可以看出, 镱离子的协同发光中心恰好处在辐致色心的强吸收带范围内, 因此推测泵浦光可经多光子吸收或协同上转换传递给了材料缺陷, 再经后者通过无辐射跃迁可转变成大量热能. 实际上辐照过的玻璃在测试过程中由于温度明显升高而出现漂白现象, 即在激光泵浦下辐致色心被还原而褪色. 这个过程不仅使掺镱硅酸盐玻璃的荧光强度下降, 同时还降低了样品的损伤阈值, 其中Yb2O3掺杂浓度为2.0mol%的样品由于测试过程中温度过高而被损坏. 为了研究 Yb3+离子与色心结构的能量传递, 本课题组还测试了 Yb2O3掺杂浓度为 0.5mol%的玻璃在辐照前后的荧光寿命. 如图 4所示, 样品的荧光寿命经5 kGy剂量伽马射线辐照后由1.33 ms减小为1.18 ms. 由于Yb3+离子只有两个能级, 且激发态2F5/2与基态2F7/2之间的能隙约为10000 cm−1, 无辐射多声子弛豫对激发态的影响可以忽略, 故激发态寿命基本不会受到声子环境变化的影响.因此导致 Yb3+离子的激发态寿命减小的最可能原因是能量从上能级转移给了辐致缺陷(包括Yb2+), 再经后者通过辐射跃迁或无辐射跃迁释放出来. 这种能量传递最终导致了辐照后掺镱硅酸盐玻璃的荧光强度下降.采用传统的高温熔融法熔制了一系列掺镱硅酸盐玻璃, 并测试了这些样品经5 kGy 伽马射线辐照前后的吸收、荧光和上转换发光光谱, 同时利用荧光谱计算 Yb3+离子的上转换发光光谱并与测试结果进行了对比. 实验结果表明高能辐照导致样品基质在400 nm附近出现一个非常强的宽吸收带, 其尾端可延伸至近红外区; 部分Yb3+离子在辐照过程中通过俘获电离自由电子变成 Yb2+离子. 辐照后, 样品在960 nm LD泵浦下荧光及上转换发光强度均有所下降, 且在476 nm附近出现ODC(Ⅱ)色心荧光峰,同时 Yb3+离子的激发态寿命也有所减小, 表明泵浦能量经过复杂的传递机理可从 Yb3+离子上能级传递给辐致色心. 部分泵浦能量最终经色心无辐射跃迁转换成了热能, 使得样品的温度明显升高并出现漂白现象.【相关文献】[1] Lu K, Dutta N K. Spectroscopic properties of Yb-doped silica glass.Journal of Applied Physics, 2002, 91(2): 576−581.[2] Jeong Y, Sahu J, Payne D, et al. Ytterbium-doped large-core fiber laser with 1.36 kW continuous-wave output power. Optics Express,2004, 12(25): 6088−6092.[3] Brooks C, Di Teodoro F. 1-mJ energy, 1-MW peak-power, 10-W average-power, spectrally narrow, diffraction-limited pulses from a photonic-crystal fiber amplifier. Optics Express, 2005, 13(22):8999−9002.[4] Paschotta R, Nilsson J, Tropper A C, et al. Ytterbium-doped fiber amplifiers. IEEE Journal of Quantum Electronics, 1997, 33(7):1049−1056.[5] Liu Z, Qi C, Dai S, et al. Spectra and laser properties of Er3+, Yb3+:phosphate glasses. Optical Materials, 2003, 21(4): 789−794.[6] Spiegelberg C, Geng J, Hu Y, et al. Low-noise narrow-linewidth fiber laser at 1550 nm. Journal of Lightwave Technology, 2004,22(1): 57−62.[7] Chernikov S V, Zhu Y, Taylor J R, et al. Supercontinuum self-Q-switched ytterbium fiber laser. Optics Letters, 1997, 22(5):298−300.[8] Fox B P, Simmons-Potter K, Thomes W J, et al.Gamma-radiation-induced photodarkening in unpumped optical fibers doped with rare-earth constituents. IEEE Transactions on Nuclear Science, 2010, 57(3): 1618−1625.[9] Tortech B, Ouerdane Y, Girard S, et al. Radiation effects on Yb-and Er/Yb-doped optical fibers: a micro-luminescence study.Journal of Non-Crystalline Solids, 2009, 355(18-21): 1085−1088.[10] Fox B P, Schneider Z V, Simmons-Potter K, et al. Spectrally resolved transmission loss in gamma irradiated Yb-doped optical fibers. IEEE Journal of Quantum Electronics, 2008, 44(6):581−586.[11] Taylor E W, Liu J. Ytterbium-doped Fiber Laser Behavior in a Gamma-ray Environment. Photonics for Space Environments X,San Diego, CA, USA, 2005: 58970E.[12] Fox B P, Simmons-Potter K, Simmons J H, et al. Radiation Damage Effects in Doped Fiber Materials. Fiber Lasers V: Technology,Systems, and Applications, San Jose, CA, USA, 2008: 68731F.[13] Girard S, Ouerdane Y, Origlio G, et al. Radiation effects on silicabased preforms and optical fibers—I: experimental study with canonical samples. IEEE Transactions on Nuclear Science, 2009,55(6): 3473−3482.[14] Dicks B M, Heine F, Petermann K, et al. Characterization of a radiation-hard single-mode Yb-doped fiber amplifier at 1064 ser Physics, 2001, 11(1): 134−137.[15] Henschel H, Kohn O, Schmidt H U, et al. Radiation-induced loss of rare earth doped silica fibres. IEEE Transactions on Nuclear Science, 1998, 45(3): 1552−1557.[16] Choi Y G, Shin Y B, Seo H S, et al. Spectral evolution of cooperative luminescence in an Yb3+-doped silica optical fiber. Chemical Physics Letters, 2002, 364(1/2): 200−205. [17] Engholm M, Norin L, Berg D. Strong UV absorption and visible luminescence in ytterbium-doped aluminosilicate glass under UV excitation. Optics Letters, 2007, 32(22): 3352−3354.[18] Raghavachari K, Ricci D, Pacchioni G. Optical properties of point defects in SiO2from time-dependent density functional theory. The Journal of Chemical Physics, 2002, 116(2): 825−831.[19] Skuja L, Hirano M, Hosono H, et al. Defects in oxide glasses.Physica Status Solidi C, 2005, 2(1): 15−24.[20] Griscom D L. Optical properties and structure of defects in silica glass. Journal of the Ceramic Society of Japan, 1991, 99(1154):923−942.[21] Raghavachari K, Pacchioni G. Photoabsorption of dioxasilyrane and silanone groups at the surface of silica. The Journal of Chemical Physics, 2001, 114(10): 4657−4662. [22] Carlson C G, Keister K E, Dragic P D, et al. Photoexcitation of Yb-doped aluminosilicate fibers at 250 nm: evidence for excitation transfer from oxygen deficiency centers to Yb3+. Journal of the Optical Society of America B, 2010, 27(10): 2087−2094.。
钴60工业探伤机在DR无损检测系统中的应用
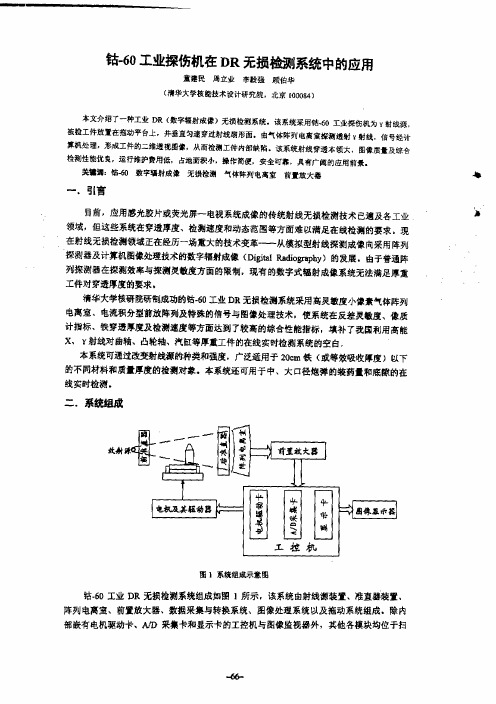
钴_60工业探伤机在DR无损检测系统中的应用童建民周立业李毅强顾伯华(清华丈学拔能拄术设计研究院.北京100084)本文介绍了一种工业DR(数字辐射成像)无损检测系统.该系统采用钴.60工业探伤机为Y射线源.被捡工件放置在描动平台上t并垂直匀速穿过射线扇形面.由气体阵列电离室撵测透射Y射线,信号经计算机处理一彤成工件的二维透视图像,从而检测工件内部缺陷.该系统射线穿透本领丈,图像质量及综台检测性能优良-运行维护费用低,占地面积小.操作简便,安全可靠,具有广阔的虚甩前景.美t调:钴—60数字辐射威像无损检测气体阵列电离室前置放大嚣一.引言目前,应用感光胶片或荧光屏一电视系统成像的传统射线无掼检测技术已遍及各工业J 领域,但这些系统在穿透厚度、检测速度和动态范围等方面难以满足在线检测的要求。
现在射线无损检测领域正在经历一场重大的技术变革——从模拟型射线探测成像向采用阵列:探铡器及计算机图像处理技术的数字辐射成像(Digital Radiography)的发展.由于普通阵列探测器在探铡效率与探测灵敏度方面的限制,现有的数字式辐射成像系统无法满足厚重工件对穿透厚度的要求,清华大学核研院研制成功的钴一60工业DR无损检测系统采用高灵敏度小像素气体阵列电离室、电流积分型前放阵列及特殊的信号与图像处理技术.使系统在反差灵敏度、像质计指标、铁穿透厚度及检测速度等方面达到了较高的综台性能指标.填补了我国利用高能 X、Y射线对曲辅、凸轮轴、汽缸等厚重工件的在线实时检剥系统的空白.本系统可通过改变射线源的种类和强度,广泛适用于20cm铁(或等效吸收厚度j以下的不同材料和质量厚度的检测对象.本系统还可用于中、大口径炮弹的装药量和底隙的在线实时检测.二.系统组成敢鼾圈l系统组成示意圈钻.60工业DR无损检测系统组成如图l所示,该系统由射线源装置、准直罂装置、阵列电离室、前置放丈器、数据采集与转换系统、图像处理系统以及拖动系统组成·除内部嵌有电机驱动卡、A11)采集卡和显示卡的工控机与图像监视器外,其他各模块均位于扫描现场.扫描现场与控制台的工控机之间的数据信号和控制倍号通过屏蔽电缆传送。
- 1、下载文档前请自行甄别文档内容的完整性,平台不提供额外的编辑、内容补充、找答案等附加服务。
- 2、"仅部分预览"的文档,不可在线预览部分如存在完整性等问题,可反馈申请退款(可完整预览的文档不适用该条件!)。
- 3、如文档侵犯您的权益,请联系客服反馈,我们会尽快为您处理(人工客服工作时间:9:00-18:30)。
a r X i v :a s t r o -p h /0607410v 1 18 J u l 2006Astronomy &Astrophysics manuscript no.MCcrab cESO 2008February 5,2008The optical to γ-ray emission of the Crab pulsar:a multicomponent modelE.Massaro 1,R.Campana 1,G.Cusumano 2,and T.Mineo 21Dipartimento di Fisica,Universit`a di Roma “La Sapienza”,Piazzale A.Moro 2,I-00185,Roma,Italy 2INAF-IASF,Sezione di Palermo,Via Ugo La Malfa 153,I-90146,Palermo,ItalyReceived:.;accepted:.ABSTRACTWe present a multicomponent model to explain the features of the pulsed emission and spectrum of the Crab Pulsar,on the basis of X and γ-ray observations obtained with BeppoSAX,INTEGRAL and CGRO.This model explains the evolution of the pulse shape and of the phase-resolved spectra,ranging from the optical /UV to the GeV energy band,on the assumption that the observed emission is due to more components.The first component,C O ,is assumed to have the pulsed double-peaked profile observed at the optical frequencies,while the second component,C X ,is dominant in the interpeak and second peak phase regions.The spectra of these components are modelled with log-parabolic laws and their spectral energy distributions have peak energies at 12.2and 178keV ,respectively.To explain the properties of the pulsed emission in the MeV-GeV band,we introduce two more components,C O γand C X γ,with phase distributions similar to those of C O and C X and log-parabolic spectra with the same curvature but peak energies at about 300MeV and 2GeV .This multicomponent model is able to reproduce both the broadband phase-resolved spectral behaviour and the changes of the pulse shape with energy.We also propose some possible physical interpretations in which C O and C X are emitted by secondary pairs via a synchrotron mechanism while C O γand C X γcan originate either from Compton scattered or primary curvature photons.Key words.Stars:neutron –pulsars:individual:Crab pulsar (PSR B0531+21)–X-rays:stars –Gamma-rays:observations1.IntroductionThe origin of the high energy emission of rotation-powered pulsars is still an unsolved problem.One of the main di fficul-ties is related to the description of the phase and energy distri-butions of the pulsed signal,which depends on both a physical and geometrical modelling of the magnetosphere.It is still un-clear,for example,whether electrons (or positrons)are acceler-ated and radiate streaming out the polar cap regions (Ruderman &Sutherland 1975,Salvati &Massaro 1978,Sturner &Dermer 1994,Daugherty &Harding 1994,1996;Muslimov &Harding 2003)or in the outer gaps (Cheng,Ho &Ruderman 1986a,b;Chiang &Romani 1994,Romani &Yadigaroglu 1995,Cheng,Ruderman &Zhang 2000;Zhang &Cheng 2002,Hirotani,Harding &Shibata 2003).Another important problem con-cerns how quantum processes,like magnetic pair production (Erber 1966)and photon splitting (Adler 1971),modify the high energy γ-ray spectrum.The Crab pulsar (PSR B0531+21)has been the best studied object of this class since its discovery (Staelin &Reifenstein 1968)and the amount of data collected is rich enough to search for a detailed physical picture of its emission properties.It is2 E.Massaro et al.:A multicomponent model of the CrabpulsarFig.1.The pulse profile and the phase dependent photon index of the Crab pulsar observed with the four Narrow Field Instruments of BeppoSAX and with ISGRI-INTEGRAL experiment.The respective energy ranges are indicated in the upper panels.All the profiles are normalized to unity at the maximum of P1.Note the change of relative intensity of P2and Ip with respect to P1and the increase of the photon indices.In a subsequent paper Kuiper et al.(2001)introduced three components to describe the spectrum up to the γ-ray data ob-tained with COMPTEL and EGRET on board ComptonGRO.These authors based the analysis mainly on finding best fits of the spectral distributions in rather narrow phase intervals and found that the spectral variation of the pulsed emission with phase can be modelled by two log-parabolic components with a relative normalization changing with phase.A further third power law component,having a photon index equal to 2.07,was necessary for the emission of P1and P2to to match the EGRET data at energies higher than about 10MeV .In this paper we develop a model able to describe the phase and spectral distributions of the emission over a frequency interval from the optical frequencies to GeV range.This model is an ex-tension of that presented in MCLM and it based on the results of a new detailed data analysis of many BeppoSAX observa-tions which includes PDS data from March 1999to April 2001not considered by MCLM.The timing accuracy has been veri-fied using detailed pulse profiles obtained from RXTE archive data.Moreover,to extend the energy range,we analysed several more recent observations performed with the IBIS-ISGRI ex-periment on board the INTEGRAL satellite and considered the results of Kuiper et al.(2001)on the COMPTEL and EGRET observations up to a few GeV .The main goal of our work isthe definiton of a scenario that can be used to develop more detailed physical models of the Crab pulsar high-energy emis-sion.2.Observations and data reduction2.1.BeppoSAXBeppoSAX observed the Crab Nebula and its pulsar on several occasions during its lifetime,because this very bright source was used to monitor the responses of the four Narrow Field Instruments (NFI).All the data collected up to 1998were used in MCLM and a complete description of their reduction is pre-sented in that work.In the new analysis presented in this pa-per we did not consider some early PDS observations,partic-ularly those performed on 31August 1996,during the Science Verification Phase,and on 6April 1998because the detector gain was found to be not precisely set,whereas additional PDS data were obtained from other observations performed between 1999and 2001,corresponding to an increase of the exposure time of about 12%with respect to MCLM.The complete log of all BeppoSAX pointings used in the present work is given in Table 1.E.Massaro et al.:A multicomponent model of the Crab pulsar3For the imaging instruments we selected all the eventswithin circular regions centered on the source position and hav-ing radii of4′(MECS)and8′(LECS).This choice correspondsto using about90%of the total source signal in both instru-ments,but it allows us to apply the best tested spectral responsematrices.Phase histograms of the Crab pulsar were evaluated foreach NFI and each pointing using the period folding technique. The UTC arrival times of all selected events were converted to the Solar System Barycentre with the DE200ephemeris.Thevalues of P and˙P for each observation epoch were derived from the Jodrell Bank Crab Pulsar Monthly Ephemeris1.Weconstructed a large set of300bin phase histograms for each energy channel of each NFI.The zero phase wasfixed at the centre of thefirst peak,evaluated by Gaussianfits.All the his-tograms for the same energy channel of each NFI were then added.Before this operation we verified that all the profiles of the various observation epochs had fully compatible shapesand therefore similar folding accuracy.A summary of all these phase histograms is shown in the upper panels of Fig.1.A relevant point we stress when working with spectra ob-tained with several instruments is that a proper evaluation of theinter-calibration factors is required.For the BeppoSAX NFIs, the accurate ground and in-flight calibrations were used to es-tablish the admissible ranges for the factors between the MECSand the other three instruments:k ML for the LECS,k MH for the HPGSPC and k MP for the PDS(Fiore et al.1999).When per-forming the spectral analysis,we left these three parametersfree and found the values k ML=0.74and k MH=0.88,within the ranges given by Fiore et al.(1999).For point sources these au-thors gave0.77≤k MP≤0.93,reduced to0.86±0.03for sources with a PDS count rate higher than2ct/s.We found in our best fits k MP=0.82,very close to the above prescription,and that weconsidered fully satisfactory because it was derived with the log-parabolic model instead of the simple power law used by Fiore et al.(1999).2.2.RossiXTETo verify the accuracy of BeppoSAX timing,we compared the pulse profiles as observed by MECS with that obtained by the PCA instrument(Jahoda et al.1996)on board of the Rossi X-Ray Timing Explorer.The latter instrument has a timing ac-curacy of2µs(Rots et al.2004)with respect to the space-craft clock and an absolute time accuracy of5-8µs with re-spect to UTC.We used the RXTE observation of Crab per-formed on December3,2004.PCA data were obtained in an ”event mode”that provided128energy channels with250µs time resolution.PCA data were screened following stan-dard selection criteria excluding time intervals corresponding to South Atlantic Anomaly passages,Earth limb closer than 10degrees and with angular distance between the source and pointing direction larger than0◦.02.The total exposure time after all screening criteria was709s.After the conversion of the arrival times to the Solar System Barycentre by using the DE200ephemeris,phase histograms were obtained by foldingObservation Exposure Times(s)Date LECS MECS a HPGSPC PDS Total exposure2781611937059618102373 Start–Stop day Exposure Times(s)Total exposure3620004 E.Massaro et al.:A multicomponent model of the Crab pulsarFig.2.The comparison of the normalized pulse profiles in the 2.6–4.1keV energy range of BeppoSAX-MECS(solid his-togram)and RossiXTE-PCA(dashed histogram)(upper panel). The difference plot in the lower panel has an amplitude of only a few percent and no sign of systematic effects on the timing.In the upper panel we also show the phase intervals of P1,Ip and P2used in our spectral analysis(solid vertical lines-black) and according to Kuiper et al.(2001)(dotted vertical lines-red)used to compute the broad-band spectral distributions and the P2/P1and Ip/P1ratios(see Sect.4).(Lebrun et al.2003)on board the INTEGRAL satellite.In our analysis we considered only the IBIS observations havingan off-axis angle not larger than1◦which are listed in Table2. Phase histograms with100bins were obtained for each point-ing using,as before,the period folding technique(see Fig.1). The accuracy of INTEGRAL timing with respect to RXTE has been verified by Kuiper et al.(2003)The zero phase was shifted at the centre of thefirst peak,coherently with the as-sumption for the other instruments.A more complete spectral analysis of these data,together with those obtained using other INTEGRAL instruments,can be found in Mineo et al.(2006).3.The interstellar absorption in the Crab direction 3.1.X-ray absorptionAn important piece of information for the study of the intrin-sic shape of the soft X-ray spectral distribution is the value of the equivalent hydrogen column density and the composition of the interstellar matter in the Crab direction.In MCLM we as-sumed N H=3.2×1021cm−2and a mean solar composition.This value is higher than those considered in previous papers,usu-ally lower than3×1021cm−2(see,for instance,Toor&Seward 1977,Ride&Walker1977,Pravdo&Serlemitsos1981)and in agreement with the analysis of ASCA data by Fukuzawa Fig.3.The energy dependence of the photon indices of P1,Ip and P2,evaluated in the ranges of the LECS,MECS,HPGSPC, two PDS bands(15–80,80–200keV)and INTEGRAL-ISGRI (50–500keV,large symbols).The off-pulse photon index,rep-resentative of the nebular emission,is also shown.Best-fit lin-ear interpolations of BeppoSAX photon indices of P1,Ip and P2are plotted.et al.(1997)and with the result of Sollerman et al.(2000) who estimated N H=3.2±0.5×1021cm−2from STIS/HST observations of the Lyαline.This column density,however, was not confirmed by subsequent studies that indicated an even larger N H and different chemical abundances.Willingale et al. (2001)on the basis of EPIC-MOS data found a column den-sity of3.45×1021cm−2with an underabundance of oxygen and iron of63%with respect to the solar composition.Weisskopf et al.(2004)obtained N H=4.2×1021cm−2with the abundances given by Wilms et al.(2000)and using a photoelectric absorp-tion model that includes the scattering due to interstellar grains.In order to use a more precise estimate of N H and the most suited chemical composition we performed a new analy-sis of the X-ray spectrum of the DC emission of Crab(pulse phases0.60–0.83)using LECS and MECS data combined. Background,estimated from archive blankfields,was sub-tracted from the events.We adopted a simple power law (F(E)=K(E/E0)−Γ)as the bestfitting model because in this band there is no evidence of a change of the nebular spectral in-dex with energy(see next Section).The considered abundances and photoelectric cross sections were those of the models aneb+wabs(Anders&Ebihara1982,Morrison&McCammon 1983)and angr+bcmc(Anders&Grevesse1989,Balucinska-Church&McCammon1992,vphabs)all implemented in the XSPEC package.The results are reported in Table3,where for each model we give the bestfit values of N H and of the photon indexΓ,the fraction of oxygen and iron with respect to the default value and the reducedχ2.All thefits were ac-ceptable(reducedχ2<1)and the column densities were sys-tematically higher than3.2×1021cm−2.Photon index values were found to be very stable with a mean value of2.124.We also found(see Sect.6.2)that the residuals at energies lowerE.Massaro et al.:A multicomponent model of the Crab pulsar5than0.8keV had a systematic deviation which disappeared us-ing column density values around3.6×1021cm−2.We decided, therefore,to adopt in our analysis this N H value together with the angr+bcmc model,as indicated by other instruments with higher spectral capabilities.3.2.Optical-UV extinctionThe high estimate of the equivalent column density and the possible difference of the chemical composition with respect to the solar one could also affect the optical-UV extinction in the direction of Crab.The analysis of Sollerman et al.(2000) converges around a value of E(B−V)=0.50mag and indi-cates that the extinction curve closely follows the standard one. Thus the N H/E(B−V)ratio is equal to6.9×1021cm−2mag−1, about30%higher than the value reported by Predehl&Schmitt (1995).Such a relevant optical-UV intrinsic extinction makes the evaluation of the pulsedflux and spectrum quite difficult at these frequencies.Several authors(e.g.Percival et al.1993, Sollerman et al.2000)agree that the dereddened spectrum is a power law with a spectral index close to zero.The difference to uncorrected data is quite large:in fact,the observed spec-tral index is around−2,and small differences in the values of E(B−V)or A V can modify the dereddened slope andflux.Of course,the extrapolation of UV data in the X-ray range may be affected by large uncertainties.4.Phase resolved X-ray spectroscopyIn MCLM we showed that a simple power law does not pro-vide an acceptable representation of the spectral distribution of the central bins of P1,corresponding to the narrow phase in-terval0.99–0.01667.This is not a specific property of P1but can be extended to the entire pulsed signal as apparent from the phase resolved spectroscopy ofFig.1,where pulse profiles and bestfit photon indices evaluated in the energy bands of the four NFIs of BeppoSAX and of ISGRI-INTEGRAL are shown. Upper panels show the pulse profiles while lower panels show the phase evolution of the photon indices:note the well known increase of Ip and P2with respect to P1and that photon indices are also increasing with energy:that of P1changes from about 1.6to2.4and that of the Ip from1.3to1.95.The power law fit was applied to the events after the subtraction of a DC level, estimated from the phase interval0.60–0.83,and assumed to be representative of the nebular continuum.High resolution X-ray images obtained with Chandra(Tennant et al.2001)showed that there is a weak emission from the pulsar also in this phase interval.Its mean intensity is of the order of few percent than that of the peaks and becomes negligible compared to the neb-ular emission when considering data extracted from wider an-gular beams,as in our case.To study the behaviour of the photon index with energy in detail we considered the following three phase intervals rep-resentative of P1(0.9833–0.0167),the Interpeak(Ip)region (0.14–0.25)and P2(0.3833–0.4137).This choice was made to have intervals wide enough to obtain estimates ofΓwith small statistical uncertainties and sufficiently narrow to consider the Fig.4.The shape of P1in three energy ranges.Maxima have been normalized to unity for a better comparison.Note the broadening of the peak with a marked asymmetry on the right side.Solid lines represent the P1profiles derived using the two component model(see Sect.6.3).emission of P1mainly due to one of the components introduced by MCLM.In subsequent analysis,when comparing the results of our multicomponent model with literature data(see Sect.7),it was necessary to consider for P1and P2phase intervals broader than those given above and we adopted the same def-inition given by Kuiper et al.(2001).The phase interval of Ip was the same.Fig.2shows the differences between these two sets.The resulting values ofΓin the narrow phase intervals are shown in Fig.3,together with those of the off-pulse,as-sumed originating in the nebula.The values of the P1pho-ton index vary from1.72±0.02in the0.1–4keV range to 2.30±0.05at(80–200keV);correspondingly,those of Ip vary from1.31±0.10to1.98±0.10and those of P2from1.51±0.03 to2.14±0.05.We considered also INTEGRAL-ISGRI data in the rather broad interval50–500keV and obtained photon in-dices fully consistent with the increasing trend of BeppoSAX values.The nebular spectrum has a remarkably constant value equal to2.131±0.002,up to the PDS range where it slightly in-creases to2.172±0.006(15–80keV)and to2.23±0.02(80–200 keV).Note that the last value agrees very well with that ob-tained by Kuiper et al.(2001)from COMPTEL data between 0.75and30MeV.The very good consistency of the nebular photon index measured in LECS,MECS and HPGSPC is an indication of the high accuracy of their calibration and of the correct choice of the intercalibration constants.It is clear from these results that a law more complex than a simple power law must be used to describe the broad-band spectral properties of the Crab pulsar when the data of all the NFIs are considered.A simple power law must be rejcted be-6 E.Massaro et al.:A multicomponent model of the Crab pulsarTable3.Estimates of the equivalent hydrogen column density N H,from combined LECS(0.1–4keV)and MECS(1.6–10keV) observations with various absorption models and chemical abundances.aneb+wabs 3.54±0.01 2.124±0.001––0.89angr+bcmc 3.33±0.01 2.124±0.001––0.99angr+bcmc 3.62±0.04 2.125±0.0010.81±0.02–0.90angr+bcmc 3.63±0.04 2.124±0.0010.83±0.030.87±0.050.88angr+bcmc 3.42±0.02 2.123±0.001–0.74±0.040.93d Log E=a+2b Log(E/E0).(2)This law implies then a linear relation betweenΓand Log E like that apparent for the bestfit lines plotted inFig.3,which have remarkably similar slopes corresponding to a curvature parameter b between0.13and0.16,the former corresponding to P2and the latter to Ip.We are also interested in the spectral energy distribution,defined as E2F(E),which for a log-parabolic law has a maxi-mum at the energy:E p=10(2−a)/2b.(3)Mineo et al.(2006)used a log-parabola for the phase re-solved spectroscopy of the INTEGRAL observations of Crab and found a significant curvature which was found stable across the entire phase interval of the pulsed signal with a mean value of0.14±0.02.We apply this law to each of the two components introduced by MCLM,as described in detail in Sect.6.2.5.Shape and spectrum of thefirst peakFig.4shows the normalized profiles of P1in the three energy bands1.6–3keV,16–32keV and87–300keV.As noticed by Mineo et al.(1997),there is an evident broadening which in-creases with energy.In the lowest energy range the peak pro-file is asymmetric with a leading side higher than the trailing one,as observed at optical frequencies(see,e.g.,Kanbach et al. 2003).This asymmetry changes in the hard X-rays as the trail-ing side becomes progressively higher.The broadening,how-ever,can be safely detected also on the leading side.We verified that this effect is also present to the same extent in the RXTE Fig.5.Fine phase resolved photon index across P1in the1.6–10keV(MECS)and20–100keV(PDS)energy ranges.Solid lines are the photon indices derived using the two-component model as explained in Sect6.4.data and therefore it cannot be due to possible phase misaligne-ments of the various BeppoSAX data sets.Pravdo,Angelini&Harding(1997),using a RXTE obser-vation of the Crab pulsar,found that the central part of P1has a spectrum softer than the wings.In MCLM we confirmed this result from MECS data,but it was after questioned by Vivekanand(2002),who in a new analysis of the RXTE data in the range5–60keV obtained a stable value ofΓacross P1.We performed a detailed analysis with afiner phase resolution and confirmed the previous results:the photon index in the MECS range changes from∼1.7in the wings of P1to1.82in the core, as shown in the plot of Fig.5.The same effect is also apparent in the PDS data.As it will be clearer in the following section this result is relevant to explain the total pulsed emission as due to the superposition of two components with different spectra.E.Massaro et al.:A multicomponent model of the Crab pulsar7Fig.6.Upper panel:phase distributions of the components C O and C X with the proper normalizations.C O is derived from OPTIMA lightcurve(Kanbach et al.2003).The four vertical bars indicate the phases from f1to f4used in the analytical model of C X.Lower panel:comparison between the observed pulse profile in the energy interval(8.0–10.0)keV(MECS data)and that obtained using the two component model com-puted for the mean energy of8.85keV.6.The two component modelTo explain at the same time the change of the pulse profile and the phase evolution of the photon index,in MCLM we pro-posed a simple model in which the observed pulsed emission is considered as the superposition of two components having different phase distributions and energy spectra.Thefirst com-ponent was assumed to have the same pulsed profile observed at optical frequencies(Smith et al.1988),with P1much more prominent than P2and a very low intensity in the Ip region. The reason for this choice is that a similar shape is also ob-served at energies higher than30MeV,despite the profile of P2being slightly different(Fierro et al.1998).This component was called‘optical’(shortly C O).The other‘X-ray’component C X reaches the greatest relative intensity in the hard X to low-energyγ-rays and it is necessary to explain the change of the P2/P1ratio.We derived its phase profile to reproduce the ob-served one when it is added to C O:we found that C X increases monotonically up to the phase0.4and then it has a rather sharp cut-off(Fig.6).The main properties of the latter component were then estimated from the BeppoSAX data,with afitting procedure of several pulse profiles at different energies,as ex-plained in detail in MCLM.In this new analysis we followed the same approach and considered again the same two components with only slight changes,as explained in the following subsections.6.1.The components’shapesWe obtained the phase profile of C O from the recent light curve observed with the high speed photo-polarimeter OPTIMA with a time binning of112µs(Kanbach et al.2003),comparable to that used for the BeppoSAX profiles.We used a high res-olution digital scanner to convert the OPTIMA data and then we applied a rebinning to have thefinal phase profile with300 bins,the same used for the X-ray data.This profile is shown in the upper panel of Fig.6.The pulse shape of C X can be obtained by the difference between the observed profiles and C O.However,using the same approach as in MCLM we preferred to model C X by means of an analytical expression to make simpler computations.C X was factorized in two functions:F X(E,f)=Y(E)g(f,E),(4) where Y(E)is assumed to depend only on the photon energy E and represents the spectral distribution of the component to be derived from the data as in MCLM,while g(f,E)describes the phase behaviour and depends on both variables.In MCLM we found that the assumption that g is only a function of the phase was not fully satisfied and a moderate change of the phase pro-file with the energy will be considered in this paper for a more precise description of the data.The whole phase interval of C X is denoted by(f1,f4)and it is divided by two inner points at the phases f2and f3into three segments:in(f1,f2)the C X shape is given by a power law,in(f2,f3)by an exponential function joining thefirst one at f2,andfinally a linearly descending branch from f3to f4that connects the maximum to the zero level of the off-pulse.We have then:g(f,E)=exp{p(E)(f2−f3)} f−f18 E.Massaro et al.:A multicomponent model of the Crabpulsar Fig.7.Spectral bestfit of the four BeppoSAX-NFI data sets ofIp with the log-parabolic law of Eq.(9).that we used in our calculations.An example of how these twocomponents combine to reproduce the observed profile in theenergy range8–10keV is shown in Fig.6.Even though this model has some minor defects of accu-racy,it gives an acceptable picture of the broad-band spectraland phase properties of the pulsed emission of Crab,as we willshow in the following sections.This model is not only a usefultool to represent a limited data set and it can be successfullyused to extrapolate the pulse shape and spectra outside the en-ergy range in which it is established.Note that Kuiper et al.(2001)derived a seven-bin phase profile of their componentnecessary to explain the spectral difference between Ip and thepeaks and found a structure similar to C X.6.2.Spectral properties of the two componentsTo model the phase and spectral properties of the total emissionas the superposition of C O and C X we had to estimate theirspectral distributions.The low intensity of C O in the Ip intervalcan be used to represent its X-rayflux as due only to the C X,while in thefirst and second peaks both components contributeto the total emission,although with different relative intensities.Assuming that the spectrum of each component is given by alog-parabolic law,we have for P1,Ip and P2:F(E)P1=(A O)P1E−(a O+b O Log E)+(A X)P1E−(a X+b X Log E)(8)F(E)Ip=(A X)Ip E−(a X+b X Log E)(9)F(E)P2=(A O)P2E−(a O+b O Log E)+(A X)P2E−(a X+b X Log E)(10)The parameters to be determined are thus a O,b O,a X and b X,besides the normalization factors(A O)P1,(A O)P2and(A X)Ip.The constants(A X)P1and(A X)P2can be obtained from(A X)Ipand from the shape g(f,E)of C X.Let F X(E,f)be theflux ofC X component;we have:Ip F X(E,f)d f(A X)P1,P2.(11)Fig.8.Spectral bestfit of the four BeppoSAX-NFI data sets ofP1with the combined log-parabolic model of Eq.(8)and withthe UV constraint ofEq.(12).Fig.9.Spectral bestfit of the four BeppoSAX-NFI data sets ofP2with the combined log-parabolic model of Eq.(10)and withthe UV constraint of Eq.(13).With the factorization of Eq.(4),we obtain:(A X)P1,P2=(A X)Ip P1,P2g(f,E)d fE.Massaro et al.:A multicomponent model of the Crab pulsar9 Table4.Parameters of the two-component,log-parabolic spectral modelfits of BeppoSAX data(LECS,0.1–4.0keV;MECS 1.6–10.0keV;HPGSPC10–34keV;PDS15–300keV).a O 1.652±0.003— 1.670±0.008b O0.160±0.001—0.164±0.001a X— 1.28±0.04—b X—0.16±0.01—A O(∗)0.1660±0.0005—(4.72±0.06)·10−2A X(∗)—(2.3±0.1)·10−2—χ2r 1.02(867d.o.f)0.99(866d.o.f) 1.09(867d.o.f)+ΓO.(14)Log(E2/E1)Since we used normalised pulse profiles,this spectral indexwould be zero at the centre of P1and therefore we added theconstantsΓO=1.83and2.14for the MECS and PDS data,re-spectively,to match the measured values.In this case the agree-ment between the observed points and the model,shown in Fig.5,is generally satisfactory,in particular the asymmetric varia-tion ofΓ(f)with the softest value at the P1centre.Both theseresults are due to the C X contribution in the phase interval ofP1necessary to represent the pedestal apparent in the hard-Xto low-energyγrays.These results show that observations arewell reproduced if the spectrum of this pedestal is similar tothat of Ip,and therefore it is reasonable to consider them all asbelonging to the same component.6.4.The total pulse profile in the MeV rangeAnother important verification of the model is the compar-ison of pulse profiles and spectra at energies higher thanthe BeppoSAX-NFI range.In particular,we considered thelow-energyγ-ray data obtained by IBIS-PICsIT on board。