图像处理外文翻译 (2)
图像处理中值滤波器中英文对照外文翻译文献
中英文资料对照外文翻译一、英文原文A NEW CONTENT BASED MEDIAN FILTERABSTRACTIn this paper the hardware implementation of a contentbased median filter suitabl e for real-time impulse noise suppression is presented. The function of the proposed ci rcuitry is adaptive; it detects the existence of impulse noise in an image neighborhood and applies the median filter operator only when necessary. In this way, the blurring o f the imagein process is avoided and the integrity of edge and detail information is pre served. The proposed digital hardware structure is capable of processing gray-scale im ages of 8-bit resolution and is fully pipelined, whereas parallel processing is used to m inimize computational time. The architecturepresented was implemented in FPGA an d it can be used in industrial imaging applications, where fast processing is of the utm ost importance. The typical system clock frequency is 55 MHz.1. INTRODUCTIONTwo applications of great importance in the area of image processing are noise filtering and image enhancement [1].These tasks are an essential part of any image pro cessor,whether the final image is utilized for visual interpretation or for automatic an alysis. The aim of noise filtering is to eliminate noise and its effects on the original im age, while corrupting the image as little as possible. To this end, nonlinear techniques (like the median and, in general, order statistics filters) have been found to provide mo re satisfactory results in comparison to linear methods. Impulse noise exists in many p ractical applications and can be generated by various sources, including a number of man made phenomena, such as unprotected switches, industrial machines and car ign ition systems. Images are often corrupted by impulse noise due to a noisy sensor or ch annel transmission errors. The most common method used for impulse noise suppressi on n forgray-scale and color images is the median filter (MF) [2].The basic drawback o f the application of the MF is the blurringof the image in process. In the general case,t he filter is applied uniformly across an image, modifying pixels that arenot contamina ted by noise. In this way, the effective elimination of impulse noise is often at the exp ense of an overalldegradation of the image and blurred or distorted features[3].In this paper an intelligent hardware structure of a content based median filter (CBMF) suita ble for impulse noise suppression is presented. The function of the proposed circuit is to detect the existence of noise in the image window and apply the corresponding MFonly when necessary. The noise detection procedure is based on the content of the im age and computes the differences between the central pixel and thesurrounding pixels of a neighborhood. The main advantage of this adaptive approach is that image blurrin g is avoided and the integrity of edge and detail information are preserved[4,5]. The pro posed digital hardware structure is capable of processing gray-scale images of 8-bitres olution and performs both positive and negative impulse noise removal. The architectt ure chosen is based on a sequence of four basic functional pipelined stages, and parall el processing is used within each stage. A moving window of a 3×3 and 5×5-pixel im age neighborhood can be selected. However, the system can be easily expanded to acc ommodate windows of larger sizes. The proposed structure was implemented using fi eld programmable gate arrays (FPGA). The digital circuit was designed, compiled and successfully simulated using the MAX+PLUS II Programmable Logic Development S ystem by Altera Corporation. The EPF10K200SFC484-1 FPGA device of the FLEX1 0KE device family was utilized for the realization of the system. The typical clock fre quency is 55 MHz and the system can be used for real-time imaging applications whe re fast processing is required [6]. As an example,the time required to perform filtering of a gray-scale image of 260×244 pixels is approximately 10.6 msec.2. ADAPTIVE FILTERING PROCEDUREThe output of a median filter at a point x of an image f depends on the values of t he image points in the neighborhood of x. This neighborhood is determined by a wind ow W that is located at point x of f including n points x1, x2, …, xn of f, with n=2k+1. The proposed adaptive content based median filter can be utilized for impulse noisesu p pression in gray-scale images. A block diagram of the adaptive filtering procedure is depicted in Fig. 1. The noise detection procedure for both positive and negative noise is as follows:(i) We consider a neighborhood window W that is located at point x of the image f. Th e differences between the central pixel at point x and the pixel values of the n-1surr ounding points of the neighborhood (excluding thevalue of the central pixel) are co mputed.(ii) The sum of the absolute values of these differences is computed, denoted as fabs(x ). This value provides ameasure of closeness between the central pixel and its su rrounding pixels.(iii) The value fabs(x) is compared to fthreshold(x), which is anappropriately selected positive integer threshold value and can be modified. The central pixel is conside red to be noise when the value fabs(x) is greater than thethreshold value fthresho d(x).(iv) When the central pixel is considered to be noise it is substituted by the median val ue of the image neighborhood,denoted as fk+1, which is the normal operationof the median filter. In the opposite case, the value of the central pixel is not altered and the procedure is repeated for the next neighborhood window.From the noised etection scheme described, it should be mentioned that the noise detection level procedure can be controlled and a range of pixel values (and not only the fixedvalues of 0 and 255, salt and pepper noise) is considered asimpulse noise.In Fig. 2 the results of the application of the median filter and the CBMF in the gray-sca le image “Peppers” are depicted.More specifically, in Fig. 2(a) the original,uncor rupted image“Peppers” is depicted. In Fig. 2(b) the original imagedegraded by 5% both positive and negative impulse noise isillustrated. In Figs 2(c) and 2(d) the resultant images of the application of median filter and CBMF for a 3×3-pixel win dow are shown, respectively. Finally, the resultant images of the application of m edian filter and CBMF for a 5×5-pixelwindow are presented in Figs 2(e) and 2(f). It can be noticed that the application of the CBMF preserves much better edges a nddetails of the images, in comparison to the median filter.A number of different objective measures can be utilized forthe evaluation of these results. The most wi dely used measures are the Mean Square Error (MSE) and the Normalized Mean Square Error (NMSE) [1]. The results of the estimation of these measures for the two filters are depicted in Table I.For the estimation of these measures, the result ant images of the filters are compared to the original, uncorrupted image.From T able I it can be noticed that the MSE and NMSE estimatedfor the application of t he CBMF are considerably smaller than those estimated for the median filter, in all the cases.Table I. Similarity measures.3. HARDWARE ARCHITECTUREThe structure of the adaptive filter comprises four basic functional units, the mo ving window unit , the median computation unit , the arithmetic operations unit , and th e output selection unit . The input data of the system are the gray-scale values of the pi xels of the image neighborhood and the noise threshold value. For the computation of the filter output a3×3 or 5×5-pixel image neighborhood can be selected. Image input d ata is serially imported into the first stage. In this way,the total number of the inputpin s are 24 (21 inputs for the input data and 3 inputs for the clock and the control signalsr equired). The output data of the system are the resultant gray-scale values computed f or the operation selected (8pins).The moving window unit is the internal memory of the system,used for storing th e input values of the pixels and for realizing the moving window operation. The pixel values of the input image, denoted as “IMAGE_INPUT[7..0]”, areimported into this u nit in serial. For the representation of thethreshold value used for the detection of a no Filter Impulse noise 5% mse Nmse(×10-2) 3×3 5×5 3×3 5×5Median CBMF 57.554 35.287 130.496 84.788 0.317 0.194 0.718 0.467ise pixel 13 bits are required. For the moving window operation a 3×3 (5×5)-pixel sep entine type memory is used, consisting of 9 (25)registers. In this way,when the windoP1 P2 P3w is moved into the next image neighborhood only 3 or 5 pixel values stored in the memory are altered. The “en5×5” control signal is used for the selection of the size of th e image window, when“en5×5” is equal to “0” (“1”) a 3×3 (5×5)-pixel neighborhood is selected. It should be mentioned that the modules of the circuit used for the 3×3-pix el window are utilized for the 5×5-pixel window as well. For these modules, 2-to-1mu ltiplexers are utilized to select the appropriate pixel values,where necessary. The mod ules that are utilized only in the case of the 5×5-pixel neighborhood are enabled by th e“en5×5” control signal. The outputs of this unit are rows ofpixel values (3 or 5, respe ctively), which are the inputs to the median computation unit.The task of the median c omputation unit is to compute themedian value of the image neighborhood in order to substitutethe central pixel value, if necessary. For this purpose a25-input sorter is utili zeed. The structure of the sorter has been proposed by Batcher and is based on the use of CS blocks. ACS block is a max/min module; its first output is the maximumof the i nputs and its second output the minimum. The implementation of a CS block includes a comparator and two 2-to-1 multiplexers. The outputs values of the sorter, denoted a s “OUT_0[7..0]”…. “OUT_24[7..0]”, produce a “sorted list” of the 25 initial pixel val ues. A 2-to-1 multiplexer isused for the selection of the median value for a 3×3 or 5×5-pixel neighborhood.The function of the arithmetic operations unit is to computethe value fabs(x), whi ch is compared to the noise threshold value in the final stage of the adaptive filter.The in puts of this unit are the surrounding pixel values and the central pixelof the neighb orhood. For the implementation of the mathematical expression of fabs(x), the circuit of this unit contains a number of adder modules. Note that registers have been used to achieve a pipelined operation. An additional 2-to-1 multiplexer is utilized for the selec tion of the appropriate output value, depending on the “en5×5” control signal. From th e implementation point of view, the use of arithmetic blocks makes this stage hardwar e demanding.The output selection unit is used for the selection of the appropriateoutput value of the performed noise suppression operation. For this selection, the corresponding no ise threshold value calculated for the image neighborhood,“NOISE_THRES HOLD[1 2..0]”,is employed. This value is compared to fabs(x) and the result of the comparison Classifies the central pixel either as impulse noise or not. If thevalue fabs(x) is greater than the threshold value fthreshold(x) the central pixel is positive or negative impulse noise and has to be eliminated. For this reason, the output of the comparison is used as the selection signal of a 2-to-1 multiplexer whose inputs are the central pixel and the c orresponding median value for the image neighborhood. The output of the multiplexer is the output of this stage and the final output of the circuit of the adaptive filter.The st ructure of the CBMF, the computation procedure and the design of the four aforeme n tioned units are illustrated in Fig. 3.ImagewindoeFigure 1: Block diagram of the filtering methodFigure 2: Results of the application of the CBMF: (a) Original image, (b) noise corrupted image (c) Restored image by a 3x3 MF, (d) Restored image by a 3x3 CBMF, (e) Restored image by a 5x5 MF and (f) Restored image by a 5x5 CBMF.4. IMPLEMENTATION ISSUESThe proposed structure was implemented in FPGA,which offer an attractive com bination of low cost, high performance and apparent flexibility, using the software pa ckage+PLUS II of Altera Corporation. The FPGA used is the EPF10K200SFC484-1 d evice of the FLEX10KE device family,a device family suitable for designs that requir e high densities and high I/O count. The 99% of the logic cells(9965/9984 logic cells) of the device was utilized to implement the circuit . The typical operating clock frequ ency of the system is 55 MHz. As a comparison, the time required to perform filtering of a gray-scale image of 260×244 pixelsusing Matlab® software on a Pentium 4/2.4 G Hz computer system is approximately 7.2 sec, whereas the corresponding time using h ardware is approximately 10.6 msec.The modification of the system to accommodate windows oflarger sizes can be done in a straightforward way, requiring onlya small nu mber of changes. More specifically, in the first unit the size of the serpentine memory P4P5P6P7P8P9SubtractorarryMedianfilteradder comparatormuitiplexerf abc(x)valueand the corresponding number of multiplexers increase following a square law. In the second unit, the sorter module should be modified,and in the third unit the number of the adder devicesincreases following a square law. In the last unit no changes are requ ired.5. CONCLUSIONSThis paper presents a new hardware structure of a content based median filter, ca pable of performing adaptive impulse noise removal for gray-scale images. The noise detection procedure takes into account the differences between the central pixel and th e surrounding pixels of a neighborhood.The proposed digital circuit is capable ofproce ssing grayscale images of 8-bit resolution, with 3×3 or 5×5-pixel neighborhoods as op tions for the computation of the filter output. However, the design of the circuit is dire ctly expandableto accommodate larger size image windows. The adaptive filter was d eigned and implemented in FPGA. The typical clock frequency is 55 MHz and the sys tem is suitable forreal-time imaging applications.REFERENCES[1] W. K. Pratt, Digital Image Processing. New York: Wiley,1991.[2] G. R. Arce, N. C. Gallagher and T. Nodes, “Median filters:Theory and applicat ions,” in Advances in ComputerVision and Image Processing, Greenwich, CT: JAI, 1986.[3] T. A. Nodes and N. C. Gallagher, Jr., “The output distributionof median type filte rs,” IEEE Transactions onCommunications, vol. COM-32, pp. 532-541, May1984.[4] T. Sun and Y. Neuvo, “Detail-preserving median basedfilters in imageprocessing,” Pattern Recognition Letters,vol. 15, pp. 341-347, Apr. 1994.[5] E. Abreau, M. Lightstone, S. K. Mitra, and K. Arakawa,“A new efficient approachfor the removal of impulsenoise from highly corrupted images,” IEEE Transa ctionson Image Processing, vol. 5, pp. 1012-1025, June 1996.[6] E. R. Dougherty and P. Laplante, Introduction to Real-Time Imaging, Bellingham:SPIE/IEEE Press, 1995.二、英文翻译基于中值滤波的新的内容摘要在本设计中的提出了基于中值滤波的硬件实现用来抑制脉冲噪声的干扰。
图像处理-毕设论文外文翻译(翻译+原文)
英文资料翻译Image processing is not a one step process.We are able to distinguish between several steps which must be performed one after the other until we can extract the data of interest from the observed scene.In this way a hierarchical processing scheme is built up as sketched in Fig.The figure gives an overview of the different phases of image processing.Image processing begins with the capture of an image with a suitable,not necessarily optical,acquisition system.In a technical or scientific application,we may choose to select an appropriate imaging system.Furthermore,we can set up the illumination system,choose the best wavelength range,and select other options to capture the object feature of interest in the best way in an image.Once the image is sensed,it must be brought into a form that can be treated with digital computers.This process is called digitization.With the problems of traffic are more and more serious. Thus Intelligent Transport System (ITS) comes out. The subject of the automatic recognition of license plate is one of the most significant subjects that are improved from the connection of computer vision and pattern recognition. The image imputed to the computer is disposed and analyzed in order to localization the position and recognition the characters on the license plate express these characters in text string form The license plate recognition system (LPSR) has important application in ITS. In LPSR, the first step is for locating the license plate in the captured image which is very important for character recognition. The recognition correction rate of license plate is governed by accurate degree of license plate location. In this paper, several of methods in image manipulation are compared and analyzed, then come out the resolutions for localization of the car plate. The experiences show that the good result has been got with these methods. The methods based on edge map and frequency analysis is used in the process of the localization of the license plate, that is to say, extracting the characteristics of the license plate in the car images after being checked up forthe edge, and then analyzing and processing until the probably area of license plate is extracted.The automated license plate location is a part of the image processing ,it’s also an important part in the intelligent traffic system.It is the key step in the Vehicle License Plate Recognition(LPR).A method for the recognition of images of different backgrounds and different illuminations is proposed in the paper.the upper and lower borders are determined through the gray variation regulation of the character distribution.The left and right borders are determined through the black-white variation of the pixels in every row.The first steps of digital processing may include a number of different operations and are known as image processing.If the sensor has nonlinear characteristics, these need to be corrected.Likewise,brightness and contrast of the image may require improvement.Commonly,too,coordinate transformations are needed to restore geometrical distortions introduced during image formation.Radiometric and geometric corrections are elementary pixel processing operations.It may be necessary to correct known disturbances in the image,for instance caused by a defocused optics,motion blur,errors in the sensor,or errors in the transmission of image signals.We also deal with reconstruction techniques which are required with many indirect imaging techniques such as tomography that deliver no direct image.A whole chain of processing steps is necessary to analyze and identify objects.First,adequate filtering procedures must be applied in order to distinguish the objects of interest from other objects and the background.Essentially,from an image(or several images),one or more feature images are extracted.The basic tools for this task are averaging and edge detection and the analysis of simple neighborhoods and complex patterns known as texture in image processing.An important feature of an object is also its motion.Techniques to detect and determine motion are necessary.Then the object has to be separated from the background.This means that regions of constant features and discontinuities must be identified.This process leads to alabel image.Now that we know the exact geometrical shape of the object,we can extract further information such as the mean gray value,the area,perimeter,and other parameters for the form of the object[3].These parameters can be used to classify objects.This is an important step in many applications of image processing,as the following examples show:In a satellite image showing an agricultural area,we would like to distinguish fields with different fruits and obtain parameters to estimate their ripeness or to detect damage by parasites.There are many medical applications where the essential problem is to detect pathologi-al changes.A classic example is the analysis of aberrations in chromosomes.Character recognition in printed and handwritten text is another example which has been studied since image processing began and still poses significant difficulties.You hopefully do more,namely try to understand the meaning of what you are reading.This is also the final step of image processing,where one aims to understand the observed scene.We perform this task more or less unconsciously whenever we use our visual system.We recognize people,we can easily distinguish between the image of a scientific lab and that of a living room,and we watch the traffic to cross a street safely.We all do this without knowing how the visual system works.For some times now,image processing and computer-graphics have been treated as two different areas.Knowledge in both areas has increased considerably and more complex problems can now be treated.Computer graphics is striving to achieve photorealistic computer-generated images of three-dimensional scenes,while image processing is trying to reconstruct one from an image actually taken with a camera.In this sense,image processing performs the inverse procedure to that of computer graphics.We start with knowledge of the shape and features of an object—at the bottom of Fig. and work upwards until we get a two-dimensional image.To handle image processing or computer graphics,we basically have to work from the same knowledge.We need to know the interaction between illumination and objects,how a three-dimensional scene is projected onto an image plane,etc.There are still quite a few differences between an image processing and a graphics workstation.But we can envisage that,when the similarities and interrelations between computergraphics and image processing are better understood and the proper hardware is developed,we will see some kind of general-purpose workstation in the future which can handle computer graphics as well as image processing tasks[5].The advent of multimedia,i. e. ,the integration of text,images,sound,and movies,will further accelerate the unification of computer graphics and image processing.In January 1980 Scientific American published a remarkable image called Plume2,the second of eight volcanic eruptions detected on the Jovian moon by the spacecraft Voyager 1 on 5 March 1979.The picture was a landmark image in interplanetary exploration—the first time an erupting volcano had been seen in space.It was also a triumph for image processing.Satellite imagery and images from interplanetary explorers have until fairly recently been the major users of image processing techniques,where a computer image is numerically manipulated to produce some desired effect-such as making a particular aspect or feature in the image more visible.Image processing has its roots in photo reconnaissance in the Second World War where processing operations were optical and interpretation operations were performed by humans who undertook such tasks as quantifying the effect of bombing raids.With the advent of satellite imagery in the late 1960s,much computer-based work began and the color composite satellite images,sometimes startlingly beautiful, have become part of our visual culture and the perception of our planet.Like computer graphics,it was until recently confined to research laboratories which could afford the expensive image processing computers that could cope with the substantial processing overheads required to process large numbers of high-resolution images.With the advent of cheap powerful computers and image collection devices like digital cameras and scanners,we have seen a migration of image processing techniques into the public domain.Classical image processing techniques are routinely employed bygraphic designers to manipulate photographic and generated imagery,either to correct defects,change color and so on or creatively to transform the entire look of an image by subjecting it to some operation such as edge enhancement.A recent mainstream application of image processing is the compression of images—either for transmission across the Internet or the compression of moving video images in video telephony and video conferencing.Video telephony is one of the current crossover areas that employ both computer graphics and classical image processing techniques to try to achieve very high compression rates.All this is part of an inexorable trend towards the digital representation of images.Indeed that most powerful image form of the twentieth century—the TV image—is also about to be taken into the digital domain.Image processing is characterized by a large number of algorithms that are specific solutions to specific problems.Some are mathematical or context-independent operations that are applied to each and every pixel.For example,we can use Fourier transforms to perform image filtering operations.Others are“algorithmic”—we may use a complicated recursive strategy to find those pixels that constitute the edges in an image.Image processing operations often form part of a computer vision system.The input image may be filtered to highlight or reveal edges prior to a shape detection usually known as low-level operations.In computer graphics filtering operations are used extensively to avoid abasing or sampling artifacts.中文翻译图像处理不是一步就能完成的过程。
数字图像处理英文文献翻译参考
…………………………………………………装………………订………………线…………………………………………………………………Hybrid Genetic Algorithm Based Image EnhancementTechnologyMu Dongzhou Department of the Information Engineering XuZhou College of Industrial TechnologyXuZhou, China ****************.cnXu Chao and Ge Hongmei Department of the Information Engineering XuZhou College of Industrial TechnologyXuZhou, China ***************.cn,***************.cnAbstract—in image enhancement, Tubbs proposed a normalized incomplete Beta function to represent several kinds of commonly used non-linear transform functions to do the research on image enhancement. But how to define the coefficients of the Beta function is still a problem. We proposed a Hybrid Genetic Algorithm which combines the Differential Evolution to the Genetic Algorithm in the image enhancement process and utilize the quickly searching ability of the algorithm to carry out the adaptive mutation and searches. Finally we use the Simulation experiment to prove the effectiveness of the method.Keywords- Image enhancement; Hybrid Genetic Algorithm; adaptive enhancementI. INTRODUCTIONIn the image formation, transfer or conversion process, due to other objective factors such as system noise, inadequate or excessive exposure, relative motion and so the impact will get the image often a difference between the original image (referred to as degraded or degraded) Degraded image is usually blurred or after the extraction of information through the machine to reduce or even wrong, it must take some measures for its improvement.Image enhancement technology is proposed in this sense, and the purpose is to improve the image quality. Fuzzy Image Enhancement situation according to the image using a variety of special technical highlights some of the information in the image, reduce or eliminate the irrelevant information, to emphasize the image of the whole or the purpose of local features. Image enhancement method is still no unified theory, image enhancement techniques can be divided into three categories: point operations, and spatial frequency enhancement methods Enhancement Act. This paper presents an automatic adjustment according to the image characteristics of adaptive image enhancement method that called hybrid genetic algorithm. It combines the differential evolution algorithm of adaptive search capabilities, automatically determines the transformation function of the parameter values in order to achieve adaptive image enhancement.…………………………………………………装………………订………………线…………………………………………………………………II. IMAGE ENHANCEMENT TECHNOLOGYImage enhancement refers to some features of the image, such as contour, contrast, emphasis or highlight edges, etc., in order to facilitate detection or further analysis and processing. Enhancements will not increase the information in the image data, but will choose the appropriate features of the expansion of dynamic range, making these features more easily detected or identified, for the detection and treatment follow-up analysis and lay a good foundation.Image enhancement method consists of point operations, spatial filtering, and frequency domain filtering categories. Point operations, including contrast stretching, histogram modeling, and limiting noise and image subtraction techniques. Spatial filter including low-pass filtering, median filtering, high pass filter (image sharpening). Frequency filter including homomorphism filtering, multi-scale multi-resolution image enhancement applied [1].III. DIFFERENTIAL EVOLUTION ALGORITHMDifferential Evolution (DE) was first proposed by Price and Storn, and with other evolutionary algorithms are compared, DE algorithm has a strong spatial search capability, and easy to implement, easy to understand. DE algorithm is a novel search algorithm, it is first in the search space randomly generates the initial population and then calculate the difference between any two members of the vector, and the difference is added to the third member of the vector, by which Method to form a new individual. If you find that the fitness of new individual members better than the original, then replace the original with the formation of individual self.The operation of DE is the same as genetic algorithm, and it conclude mutation, crossover and selection, but the methods are different. We suppose that the group size is P, the vector dimension is D, and we can express the object vector as (1):xi=[xi1,xi2,…,xiD] (i =1,…,P)(1) And the mutation vector can be expressed as (2):()321rrriXXFXV-⨯+=i=1,...,P (2) 1rX,2rX,3rX are three randomly selected individuals from group, and r1≠r2≠r3≠i.F is a range of [0, 2] between the actual type constant factor difference vector is used to control the influence, commonly referred to as scaling factor. Clearly the difference between the vector and the smaller the disturbance also smaller, which means that if groups close to the optimum value, the disturbance will be automatically reduced.DE algorithm selection operation is a "greedy " selection mode, if and only if the new vector ui the fitness of the individual than the target vector is better when the individual xi, ui will be retained to the next group. Otherwise, the target vector xi individuals remain in the original group, once again as the next generation of the parent vector.…………………………………………………装………………订………………线…………………………………………………………………IV. HYBRID GA FOR IMAGE ENHANCEMENT IMAGEenhancement is the foundation to get the fast object detection, so it is necessary to find real-time and good performance algorithm. For the practical requirements of different systems, many algorithms need to determine the parameters and artificial thresholds. Can use a non-complete Beta function, it can completely cover the typical image enhancement transform type, but to determine the Beta function parameters are still many problems to be solved. This section presents a Beta function, since according to the applicable method for image enhancement, adaptive Hybrid genetic algorithm search capabilities, automatically determines the transformation function of the parameter values in order to achieve adaptive image enhancement.The purpose of image enhancement is to improve image quality, which are more prominent features of the specified restore the degraded image details and so on. In the degraded image in a common feature is the contrast lower side usually presents bright, dim or gray concentrated. Low-contrast degraded image can be stretched to achieve a dynamic histogram enhancement, such as gray level change. We use Ixy to illustrate the gray level of point (x, y) which can be expressed by (3).Ixy=f(x, y) (3) where: “f” is a linear or nonline ar function. In general, gray image have four nonlinear translations [6] [7] that can be shown as Figure 1. We use a normalized incomplete Beta function to automatically fit the 4 categories of image enhancement transformation curve. It defines in (4):()()()()10,01,111<<-=---⎰βαβαβαdtttBufu(4) where:()()⎰---=1111,dtttBβαβα(5) For different value of α and β, we can get response curve from (4) and (5).The hybrid GA can make use of the previous section adaptive differential evolution algorithm to search for the best function to determine a value of Beta, and then each pixel grayscale values into the Beta function, the corresponding transformation of Figure 1, resulting in ideal image enhancement. The detail description is follows:Assuming the original image pixel (x, y) of the pixel gray level by the formula (4),denoted byxyi,()Ω∈yx,, here Ω is the image domain. Enhanced image is denoted by Ixy. Firstly, the image gray value normalized into [0, 1] by (6).minmaxminiiiig xyxy--=(6)where:maxi andm ini express the maximum and minimum of image gray relatively.Define the nonlinear transformation function f(u) (0≤u≤1) to transform source image…………………………………………………装………………订………………线…………………………………………………………………Finally, we use the hybrid genetic algorithm to determine the appropriate Beta function f (u) the optimal parameters αand β. Will enhance the image Gxy transformed antinormalized.V. EXPERIMENT AND ANALYSISIn the simulation, we used two different types of gray-scale images degraded; the program performed 50 times, population sizes of 30, evolved 600 times. The results show that the proposed method can very effectively enhance the different types of degraded image.Figure 2, the size of the original image a 320 × 320, it's the contrast to low, and some details of the more obscure, in particular, scarves and other details of the texture is not obvious, visual effects, poor, using the method proposed in this section, to overcome the above some of the issues and get satisfactory image results, as shown in Figure 5 (b) shows, the visual effects have been well improved. From the histogram view, the scope of the distribution of image intensity is more uniform, and the distribution of light and dark gray area is more reasonable. Hybrid genetic algorithm to automatically identify the nonlinear…………………………………………………装………………订………………线…………………………………………………………………transformation of the function curve, and the values obtained before 9.837,5.7912, from the curve can be drawn, it is consistent with Figure 3, c-class, that stretch across the middle region compression transform the region, which were consistent with the histogram, the overall original image low contrast, compression at both ends of the middle region stretching region is consistent with human visual sense, enhanced the effect of significantly improved.Figure 3, the size of the original image a 320 × 256, the overall intensity is low, the use of the method proposed in this section are the images b, we can see the ground, chairs and clothes and other details of the resolution and contrast than the original image has Improved significantly, the original image gray distribution concentrated in the lower region, and the enhanced image of the gray uniform, gray before and after transformation and nonlinear transformation of basic graph 3 (a) the same class, namely, the image Dim region stretching, and the values were 5.9409,9.5704, nonlinear transformation of images degraded type inference is correct, the enhanced visual effect and good robustness enhancement.Difficult to assess the quality of image enhancement, image is still no common evaluation criteria, common peak signal to noise ratio (PSNR) evaluation in terms of line, but the peak signal to noise ratio does not reflect the human visual system error. Therefore, we use marginal protection index and contrast increase index to evaluate the experimental results.Edgel Protection Index (EPI) is defined as follows:…………………………………………………装………………订………………线…………………………………………………………………(7)Contrast Increase Index (CII) is defined as follows:minmaxminmax,GGGGCCCEOD+-==(8)In figure 4, we compared with the Wavelet Transform based algorithm and get the evaluate number in TABLE I.Figure 4 (a, c) show the original image and the differential evolution algorithm for enhanced results can be seen from the enhanced contrast markedly improved, clearer image details, edge feature more prominent. b, c shows the wavelet-based hybrid genetic algorithm-based Comparison of Image Enhancement: wavelet-based enhancement method to enhance image detail out some of the image visual effect is an improvement over the original image, but the enhancement is not obvious; and Hybrid genetic algorithm based on adaptive transform image enhancement effect is very good, image details, texture, clarity is enhanced compared with the results based on wavelet transform has greatly improved the image of the post-analytical processing helpful. Experimental enhancement experiment using wavelet transform "sym4" wavelet, enhanced differential evolution algorithm experiment, the parameters and the values were 5.9409,9.5704. For a 256 × 256 size image transform based on adaptive hybrid genetic algorithm in Matlab 7.0 image enhancement software, the computing time is about 2 seconds, operation is very fast. From TABLE I, objective evaluation criteria can be seen, both the edge of the protection index, or to enhance the contrast index, based on adaptive hybrid genetic algorithm compared to traditional methods based on wavelet transform has a larger increase, which is from This section describes the objective advantages of the method. From above analysis, we can see…………………………………………………装………………订………………线…………………………………………………………………that this method.From above analysis, we can see that this method can be useful and effective.VI. CONCLUSIONIn this paper, to maintain the integrity of the perspective image information, the use of Hybrid genetic algorithm for image enhancement, can be seen from the experimental results, based on the Hybrid genetic algorithm for image enhancement method has obvious effect. Compared with other evolutionary algorithms, hybrid genetic algorithm outstanding performance of the algorithm, it is simple, robust and rapid convergence is almost optimal solution can be found in each run, while the hybrid genetic algorithm is only a few parameters need to be set and the same set of parameters can be used in many different problems. Using the Hybrid genetic algorithm quick search capability for a given test image adaptive mutation, search, to finalize the transformation function from the best parameter values. And the exhaustive method compared to a significant reduction in the time to ask and solve the computing complexity. Therefore, the proposed image enhancement method has some practical value.REFERENCES[1] HE Bin et al., Visual C++ Digital Image Processing [M], Posts & Telecom Press,2001,4:473~477[2] Storn R, Price K. Differential Evolution—a Simple and Efficient Adaptive Scheme forGlobal Optimization over Continuous Space[R]. International Computer Science Institute, Berlaey, 1995.[3] Tubbs J D. A note on parametric image enhancement [J].Pattern Recognition.1997,30(6):617-621.[4] TANG Ming, MA Song De, XIAO Jing. Enhancing Far Infrared Image Sequences withModel Based Adaptive Filtering [J] . CHINESE JOURNAL OF COMPUTERS, 2000, 23(8):893-896.[5] ZHOU Ji Liu, LV Hang, Image Enhancement Based on A New Genetic Algorithm [J].Chinese Journal of Computers, 2001, 24(9):959-964.[6] LI Yun, LIU Xuecheng. On Algorithm of Image Constract Enhancement Based onWavelet Transformation [J]. Computer Applications and Software, 2008,8.[7] XIE Mei-hua, WANG Zheng-ming, The Partial Differential Equation Method for ImageResolution Enhancement [J]. Journal of Remote Sensing, 2005,9(6):673-679.…………………………………………………装………………订………………线…………………………………………………………………基于混合遗传算法的图像增强技术Mu Dongzhou 徐州工业职业技术学院信息工程系 XuZhou, China****************.cnXu Chao and Ge Hongmei 徐州工业职业技术学院信息工程系 XuZhou,********************.cn,***************.cn摘要—在图像增强之中,塔布斯提出了归一化不完全β函数表示常用的几种使用的非线性变换函数对图像进行研究增强。
CCD图像图像处理外文文献翻译、中英文翻译、外文翻译
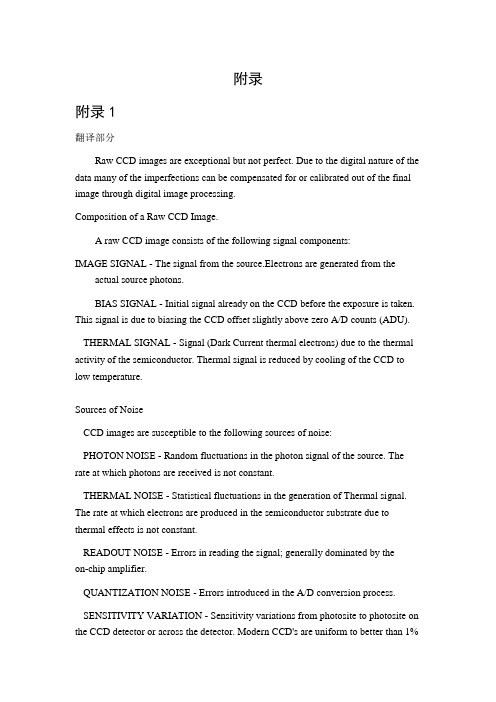
附录附录1翻译部分Raw CCD images are exceptional but not perfect. Due to the digital nature of the data many of the imperfections can be compensated for or calibrated out of the final image through digital image processing.Composition of a Raw CCD Image.A raw CCD image consists of the following signal components:IMAGE SIGNAL - The signal from the source.Electrons are generated from the actual source photons.BIAS SIGNAL - Initial signal already on the CCD before the exposure is taken. This signal is due to biasing the CCD offset slightly above zero A/D counts (ADU).THERMAL SIGNAL - Signal (Dark Current thermal electrons) due to the thermal activity of the semiconductor. Thermal signal is reduced by cooling of the CCD to low temperature.Sources of NoiseCCD images are susceptible to the following sources of noise:PHOTON NOISE - Random fluctuations in the photon signal of the source. The rate at which photons are received is not constant.THERMAL NOISE - Statistical fluctuations in the generation of Thermal signal. The rate at which electrons are produced in the semiconductor substrate due to thermal effects is not constant.READOUT NOISE - Errors in reading the signal; generally dominated by theon-chip amplifier.QUANTIZATION NOISE - Errors introduced in the A/D conversion process.SENSITIVITY VARIATION - Sensitivity variations from photosite to photosite on the CCD detector or across the detector. Modern CCD's are uniform to better than 1%between neighboring photosites and uniform to better than 10% across the entire surface.Noise CorrectionsREDUCING NOISE - Readout Noise and Quantization Noise are limited by the construction of the CCD camera and can not be improved upon by the user. Thermal Noise, however, can be reduced by cooling of the CCD (temperature regulation). The Sensitivity Variations can be removed by proper flat fielding.CORRECTING FOR THE BIAS AND THERMAL SIGNALS - The Bias and Thermal signals can be subtracted out from the Raw Image by taking what is called a Dark Exposure. The dark exposure is a measure of the Bias Signal and Thermal Signal and may simply be subtracted from the Raw Image.FLAT FIELDING -A record of the photosite to photosite sensitivity variations can be obtained by taking an exposure of a uniformly lit 'flat field". These variations can then be divided out of the Raw Image to produce an image essentially free from this source of error. Any length exposure will do, but ideally one which saturates the pixels to the 50% or 75% level is best.The Final Processed ImageThe final Processed Image which removes unwanted signals and reduces noise as best we can is computed as follows:Final Processed Image = (Raw - Dark)/FlatAll of the digital image processing functions described above can be accomplished by using CCDOPS software furnished with each SBIG imaging camera. The steps to accomplish them are described in the Operating Manual furnished with each SBIG imaging camera. At SBIG we offer our technical support to help you with questions on how to improve your images.HOW TO SELECT THE CORRECT CCD IMAGING CAMERA FOR YOUR TELESCOPEWhen new customers contact SBIG we discuss their imaging camera application. We try to get an idea of their interests. We have found this method is an effective way of insuring that our customers get the right imaging camera for their purposes. Someof the questions we ask are as follows:What type of telescope do you presently own? Having this information allows us to match the CCD imaging Camera's parameters, pixel size and field of view to your telescope. We can also help you interface the CCD imaging camera's automatic guiding functions to your telescope.Are you a MAC or PC user? Since our software supports both of these platforms we can insure that you receive the correct software. We can also answer questions about any unique functions in one or the other. We can send you a demonstration copy of the appropriate software for your review.Do you have a telescope drive base with an autoguider port? Do you want to operate from a remote computer? Companies like Software Bisque fully support our products with telescope control and imaging camera software.Do you want to take photographic quality images of deep space objects, image planets, or perform wide field searches for near earth asteroids or supernovas? In learning about your interests we can better guide you to the optimum CCD pixel size and imaging area for the application.Do you want to make photometric measurements of variable stars or determine precise asteroid positions? From this information we can recommend a CCD imaging camera model and explain how to use the specific analysis functions to perform these tasks. We can help you characterize your imaging camera by furnishing additional technical data.Do you want to automatically guide long uninterrupted astrophotographs? As the company with the most experience in CCD autoguiding we can help you install and operate a CCD autoguider on your telescope. The Model STV has a worldwide reputation for accurate guiding on dim guide stars. No matter what type of telescope you own we can help you correctly interface it and get it working properly.SBIG CCD IMAGING CAMERASThe SBIG product line consists of a series of thermoelectrically cooled CCD imaging cameras designed for a wide range of applications ranging from astronomy, tricolor imaging, color photometry, spectroscopy, medical imaging, densitometry, to chemiluminescence and epifluorescence imaging, etc. This catalog includes information on astronomical imaging cameras, scientific imaging cameras,autoguiding, and accessories. We have tried to arrange the catalog so that it is easy to compare products by specifications and performance. The tables in the product section compare some of the basic characteristics on each CCD imaging camera in our product line. You will find a more detailed set of specifications with each individual imaging camera description.HOW TO GET STARTED USING YOUR CCD IMAGING CAMERAIt all starts with the software. If there's any company well known for its outstanding imaging camera software it's SBIG. Our CCDOPS Operating Software is well known for its user oriented camera control features and stability. CCDOPS is available for free download from our web site along with sample images that you can display and analyze using the image processing and analysis functions of the CCDOPS software. You can become thoroughly familiar with how our imaging cameras work and the capabilities of the software before you purchase an imaging camera. We also include CCDSoftV5 and TheSky from Software Bisque with most of our cameras at no additional charge. Macintosh users receive a free copy of EquinoX planetarium and camera control software for the MacOS-X operating system. No other manufacturer offers better software than you get with SBIG cameras. New customers receiving their CCD imaging camera should first read the installation section in their CCDOPS Operating Manual. Once you have read that section you should have no difficulty installing CCDOPS software on your hard drive, connecting the USB cable from the imaging camera to your computer, initiating the imaging camera and within minutes start taking your first CCD images. Many of our customers are amazed at how easy it is to start taking images. Additional information can be found by reading the image processing sections of the CCDOPS and CCDSoftV5 Manuals. This information allows you to progress to more advanced features such as automatic dark frame subtraction of images, focusing the imaging camera, viewing, analyzing and processing the images on the monitor, co-adding images, taking automatic sequences of images, photometric and astrometric measurements, etc.A PERSONAL TOUCH FROM SBIGAt SBIG we have had much success with a program in which we continually review customer's images sent to us on disk or via e-mail. We can often determine the cause of a problem from actual images sent in by a user. We review the images and contacteach customer personally. Images displaying poor telescope tracking, improper imaging camera focus, oversaturated images, etc., are typical initial problems. We will help you quickly learn how to improve your images. You can be assured of personal technical support when you need it. The customer support program has furnished SBIG with a large collection of remarkable images. Many customers have had their images published in SBIG catalogs, ads, and various astronomy magazines. We welcome the chance to review your images and hope you will take advantage of our trained staff to help you improve your images.TRACK AND ACCUMULATE (U.S. Patent # 5,365,269)Using an innovative engineering approach SBIG developed an imaging camera function called Track & Accumulate (TRACCUM) in which multiple images are automatically registered to create a single long exposure. Since the long exposure consists of short images the total combined exposure significantly improves resolution by reducing the cumulative telescope periodic error. In the TRACCUM mode each image is shifted to correct guiding errors and added to the image buffer. In this mode the telescope does not need to be adjusted. The great sensitivity of the CCD virtually guarantees that there will be a usable guide star within the field of view. This feature provides dramatic improvement in resolution by reducing the effect of periodic error and allowing unattended hour long exposures. SBIG has been granted U.S. Patent # 5,365,269 for Track & Accumulate.DUAL CCD SELF-GUIDING (U.S. Patent # 5,525,793)In 1994 with the introduction of Models ST-7 and ST-8 CCD Imaging Cameras which incorporate two separate CCD detectors, SBIG was able to accomplish the goal of introducing a truly self-guided CCD imaging camera. The ability to select guide stars with a separate CCD through the full telescope aperture is equivalent to having a thermoelectrically cooled CCD autoguider in your imaging camera. This feature has been expanded to all dual sensor ST series cameras (ST-7/8/9/10/2000) and all STL series cameras (STL-1001/1301/4020/6303/11000). One CCD is used for guiding and the other for collecting the image. They are mounted in close proximity, both focused at the same plane, allowing the imaging CCD to integrate while the PC uses the guiding CCD to correct the telescope. Using a separate CCD for guiding allows 100% of the primary CCD's active area to be used to collect the image. The telescope correction rate and limiting guide star magnitude can be independentlyselected. Tests at SBIG indicated that 95% of the time a star bright enough for guiding will be found on a TC237 tracking CCD without moving the telescope, using an f/6.3 telescope. The self-guiding function quickly established itself as the easiest and most accurate method for guiding CCD images. Placing both detectors in close proximity at the same focal plane insures the best possible guiding. Many of the long integrated exposures now being published are taken with this self-guiding method, producing very high resolution images of deep space objects. SBIG has been granted U.S. Patent # 5,525,793 for the dual CCD Self-Guiding function.COMPUTER PLATFORMSSBIG has been unique in its support of both PC and Macintosh platforms for our cameras. The imaging cameras in this catalog communicate with the host computer through standard serial or USB ports depending on the specific models. Since there are no external plug-in boards required with our imaging camera systems we encourage users to operate with the new family of high resolution graphics laptop computers. We furnish Operating Software for you to install on your host computer. Once the software is installed and communication with the imaging camera is set up complete control of all of the imaging camera functions is through the host computer keyboard. The recommended minimum requirements for memory and video graphics are as shown below.GENERAL CONCLUSION(1) of this item from the theoretical analysis of the use of CCD technology for real-time non-contact measuring the diameter of the feasibility of measuring it is fast, efficient, accurate, high degree of automation, off-production time and so on.(2) projects to test the use of CCD technology to achieve real-time, online non-contact measurement, developed by the CCD-line non-contact diameter measurement system has a significant technology advanced and practical application of significance. (3) from the theoretical and experimental project on the summary of the utilization of CCD technology developed by SCM PV systems improve the measurement accuracy of several ways: improving crystal, a multi-pixel CCD devices and take full advantage of CCD-like device Face width.译文原料CCD图像是例外,但并非十全十美。
图像处理外文翻译
英文资料翻译Image processing is not a one step process.We are able to distinguish between several steps which must be performed one after the other until we can extract the data of interest from the observed scene.In this way a hierarchical processing scheme is built up as sketched in Fig.The figure gives an overview of the different phases of image processing.Image processing begins with the capture of an image with a suitable,not necessarily optical,acquisition system.In a technical or scientific application,we may choose to select an appropriate imaging system.Furthermore,we can set up the illumination system,choose the best wavelength range,and select other options to capture the object feature of interest in the best way in an image.Once the image is sensed,it must be brought into a form that can be treated with digital computers.This process is called digitization.With the problems of traffic are more and more serious. Thus Intelligent Transport System (ITS) comes out. The subject of the automatic recognition of license plate is one of the most significant subjects that are improved from the connection of computer vision and pattern recognition. The image imputed to the computer is disposed and analyzed in order to localization the position and recognition the characters on the license plate express these characters in text string form The license plate recognition system (LPSR) has important application in ITS. In LPSR, the first step is for locating the license plate in the captured image which is very important for character recognition. The recognition correction rate of license plate is governed by accurate degree of license plate location. In this paper, several of methods in image manipulation are compared and analyzed, then come out the resolutions for localization of the car plate. The experiences show that the good result has been got with these methods. The methods based on edge map and frequency analysis is used in the process of the localization of the license plate, that is to say, extracting the characteristics of the license plate in the car images after being checked up for the edge, and then analyzing and processing until the probably area of license plate is extracted.The automated license plate location is a part of the image processing ,it’s also an important part in the intelligent traffic system.It is the key step in the Vehicle License Plate Recognition(LPR).A method for the recognition of images of different backgrounds and different illuminations is proposed in the paper.the upper and lower borders are determined through the gray variation regulation of the character distribution.The left and right borders are determined through the black-white variation of the pixels in every row.The first steps of digital processing may include a number of different operations and are known as image processing.If the sensor has nonlinear characteristics, these need to be corrected.Likewise,brightness and contrast of the image may require improvement.Commonly,too,coordinate transformations are needed torestore geometrical distortions introduced during image formation.Radiometric and geometric corrections are elementary pixel processing operations.It may be necessary to correct known disturbances in the image,for instance caused by a defocused optics,motion blur,errors in the sensor,or errors in the transmission of image signals.We also deal with reconstruction techniques which are required with many indirect imaging techniques such as tomography that deliver no direct image.A whole chain of processing steps is necessary to analyze and identify objects.First,adequate filtering procedures must be applied in order to distinguish the objects of interest from other objects and the background.Essentially,from an image (or several images),one or more feature images are extracted.The basic tools for this task are averaging and edge detection and the analysis of simple neighborhoods and complex patterns known as texture in image processing.An important feature of an object is also its motion.Techniques to detect and determine motion are necessary.Then the object has to be separated from the background.This means that regions of constant features and discontinuities must be identified.This process leads to a label image.Now that we know the exact geometrical shape of the object,we can extract further information such as the mean gray value,the area,perimeter,and other parameters for the form of the object[3].These parameters can be used to classify objects.This is an important step in many applications of image processing,as the following examples show:In a satellite image showing an agricultural area,we would like to distinguish fields with different fruits and obtain parameters to estimate their ripeness or to detect damage by parasites.There are many medical applications where the essential problem is to detect pathologi-al changes.A classic example is the analysis of aberrations in chromosomes.Character recognition in printed and handwritten text is another example which has been studied since image processing began and still poses significant difficulties.You hopefully do more,namely try to understand the meaning of what you are reading.This is also the final step of image processing,where one aims to understand the observed scene.We perform this task more or less unconsciously whenever we use our visual system.We recognize people,we can easily distinguish between the image of a scientific lab and that of a living room,and we watch the traffic to cross a street safely.We all do this without knowing how the visual system works.For some times now,image processing and computer-graphics have been treated as two different areas.Knowledge in both areas has increased considerably and more complex problems can now be treated.Computer graphics is striving to achieve photorealistic computer-generated images of three-dimensional scenes,while image processing is trying to reconstruct one from an image actually taken with a camera.In this sense,image processing performs the inverse procedure to that of computer graphics.We start with knowledge of the shape and features of an object—at the bottom of Fig. and work upwards until we get a two-dimensional image.To handle image processing or computer graphics,we basically have to work from the sameknowledge.We need to know the interaction between illumination and objects,how a three-dimensional scene is projected onto an image plane,etc.There are still quite a few differences between an image processing and a graphics workstation.But we can envisage that,when the similarities and interrelations between computergraphics and image processing are better understood and the proper hardware is developed,we will see some kind of general-purpose workstation in the future which can handle computer graphics as well as image processing tasks[5].The advent of multimedia,i. e. ,the integration of text,images,sound,and movies,will further accelerate the unification of computer graphics and image processing.In January 1980 Scientific American published a remarkable image called Plume2,the second of eight volcanic eruptions detected on the Jovian moon by the spacecraft V oyager 1 on 5 March 1979.The picture was a landmark image in interplanetary exploration—the first time an erupting volcano had been seen in space.It was also a triumph for image processing.Satellite imagery and images from interplanetary explorers have until fairly recently been the major users of image processing techniques,where a computer image is numerically manipulated to produce some desired effect-such as making a particular aspect or feature in the image more visible.Image processing has its roots in photo reconnaissance in the Second World War where processing operations were optical and interpretation operations were performed by humans who undertook such tasks as quantifying the effect of bombing raids.With the advent of satellite imagery in the late 1960s,much computer-based work began and the color composite satellite images,sometimes startlingly beautiful, have become part of our visual culture and the perception of our planet.Like computer graphics,it was until recently confined to research laboratories which could afford the expensive image processing computers that could cope with the substantial processing overheads required to process large numbers of high-resolution images.With the advent of cheap powerful computers and image collection devices like digital cameras and scanners,we have seen a migration of image processing techniques into the public domain.Classical image processing techniques are routinely employed by graphic designers to manipulate photographic and generated imagery,either to correct defects,change color and so on or creatively to transform the entire look of an image by subjecting it to some operation such as edge enhancement.A recent mainstream application of image processing is the compression of images—either for transmission across the Internet or the compression of moving video images in video telephony and video conferencing.Video telephony is one of the current crossover areas that employ both computer graphics and classical image processing techniques to try to achieve very high compression rates.All this is part of an inexorable trend towards the digital representation of images.Indeed that most powerful image form of the twentieth century—the TV image—is also about to be taken into the digital domain.Image processing is characterized by a large number of algorithms that are specific solutions to specific problems.Some are mathematical or context-independent operations that are applied to each and every pixel.For example,we can use Fourier transforms to perform image filtering operations.Others are“algorithmic”—we may use a complicated recursive strategy to find those pixels that constitute the edges in an image.Image processing operations often form part of a computer vision system.The input image may be filtered to highlight or reveal edges prior to a shape detection usually known as low-level operations.In computer graphics filtering operations are used extensively to avoid abasing or sampling artifacts.中文翻译图像处理不是一步就能完成的过程。
matlab图像处理外文翻译外文文献
matlab图像处理外文翻译外文文献附录A 英文原文Scene recognition for mine rescue robotlocalization based on visionCUI Yi-an(崔益安), CAI Zi-xing(蔡自兴), WANG Lu(王璐)Abstract:A new scene recognition system was presented based on fuzzy logic and hidden Markov model(HMM) that can be applied in mine rescue robot localization during emergencies. The system uses monocular camera to acquire omni-directional images of the mine environment where the robot locates. By adopting center-surround difference method, the salient local image regions are extracted from the images as natural landmarks. These landmarks are organized by using HMM to represent the scene where the robot is, and fuzzy logic strategy is used to match the scene and landmark. By this way, the localization problem, which is the scene recognition problem in the system, can be converted into the evaluation problem of HMM. The contributions of these skills make the system have the ability to deal with changes in scale, 2D rotation and viewpoint. The results of experiments also prove that the system has higher ratio of recognition and localization in both static and dynamic mine environments.Key words: robot location; scene recognition; salient image; matching strategy; fuzzy logic; hidden Markov model1 IntroductionSearch and rescue in disaster area in the domain of robot is a burgeoning and challenging subject[1]. Mine rescue robot was developed to enter mines during emergencies to locate possible escape routes for those trapped inside and determine whether it is safe for human to enter or not. Localization is a fundamental problem in this field. Localization methods based on camera can be mainly classified into geometric, topological or hybrid ones[2]. With its feasibility and effectiveness, scene recognition becomes one of the important technologies of topological localization.Currently most scene recognition methods are based on global image features and have two distinct stages: training offline and matching online.。
图像制版术语英语翻译(2)_新闻传媒英语词汇
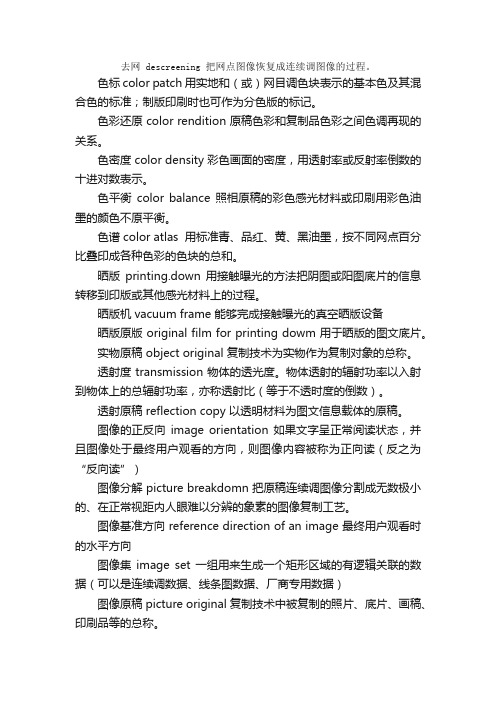
去网 descreening 把网点图像恢复成连续调图像的过程。
色标 color patch 用实地和(或)网目调色块表示的基本色及其混合色的标准;制版印刷时也可作为分色版的标记。
色彩还原 color rendition 原稿色彩和复制品色彩之间色调再现的关系。
色密度 color density 彩色画面的密度,用透射率或反射率倒数的十进对数表示。
色平衡color balance 照相原稿的彩色感光材料或印刷用彩色油墨的颜色不原平衡。
色谱 color atlas 用标准青、品红、黄、黑油墨,按不同网点百分比叠印成各种色彩的色块的总和。
晒版printing.down 用接触曝光的方法把阴图或阳图底片的信息转移到印版或其他感光材料上的过程。
晒版机 vacuum frame 能够完成接触曝光的真空晒版设备晒版原版 original film for printing dowm 用于晒版的图文底片。
实物原稿 object original 复制技术为实物作为复制对象的总称。
透射度 transmission 物体的透光度。
物体透射的辐射功率以入射到物体上的总辐射功率,亦称透射比(等于不透时度的倒数)。
透射原稿 reflection copy 以透明材料为图文信息载体的原稿。
图像的正反向image orientation 如果文字呈正常阅读状态,并且图像处于最终用户观看的方向,则图像内容被称为正向读(反之为“反向读”)图像分解 picture breakdomn 把原稿连续调图像分割成无数极小的、在正常视距内人眼难以分辨的象素的图像复制工艺。
图像基准方向 reference direction of an image 最终用户观看时的水平方向图像集image set 一组用来生成一个矩形区域的有逻辑关联的数据(可以是连续调数据、线条图数据、厂商专用数据)图像原稿 picture original 复制技术中被复制的照片、底片、画稿、印刷品等的总称。
图像处理外文翻译

附录A3 Image Enhancement in the Spatial DomainThe principal objective of enhancement is to process an image so that the result is more suitable than the original image for a specific application. The word specific is important, because it establishes at the outset than the techniques discussed in this chapter are very much problem oriented. Thus, for example, a method that is quite useful for enhancing X-ray images may not necessarily be the best approach for enhancing pictures of Mars transmitted by a space probe. Regardless of the method used .However, image enhancement is one of the most interesting and visually appealing areas of image processing.Image enhancement approaches fall into two broad categories: spatial domain methods and frequency domain methods. The term spatial domain refers to the image plane itself, and approaches in this category are based on direct manipulation of pixels in an image. Fourier transform of an image. Spatial methods are covered in this chapter, and frequency domain enhancement is discussed in Chapter 4.Enhancement techniques based on various combinations of methods from these two categories are not unusual. We note also that many of the fundamental techniques introduced in this chapter in the context of enhancement are used in subsequent chapters for a variety of other image processing applications.There is no general theory of image enhancement. When an image is processed for visual interpretation, the viewer is the ultimate judge of how well a particular method works. Visual evaluation of image quality is a highly is highly subjective process, thus making the definition of a “good image” an elusive standard by which to compare algorithm performance. When the problem is one of processing images for machine perception, the evaluation task is somewhat easier. For example, in dealing with a character recognition application, and leaving aside other issues such as computational requirements, the best image processing method would be the one yielding the best machine recognition results. However, even in situations when aclear-cut criterion of performance can be imposed on the problem, a certain amount of trial and error usually is required before a particular image enhancement approach is selected.3.1 BackgroundAs indicated previously, the term spatial domain refers to the aggregate of pixels composing an image. Spatial domain methods are procedures that operate directly on these pixels. Spatial domain processes will be denotes by the expression()[]=(3.1-1)g x y T f x y,(,)where f(x, y) is the input image, g(x, y) is the processed image, and T is an operator on f, defined over some neighborhood of (x, y). In addition, T can operate on a set of input images, such as performing the pixel-by-pixel sum of K images for noise reduction, as discussed in Section 3.4.2.The principal approach in defining a neighborhood about a point (x, y) is to use a square or rectangular subimage area centered at (x, y).The center of the subimage is moved from pixel to starting, say, at the top left corner. The operator T is applied at each location (x, y) to yield the output, g, at that location. The process utilizes only the pixels in the area of the image spanned by the neighborhood. Although other neighborhood shapes, such as approximations to a circle, sometimes are used, square and rectangular arrays are by far the most predominant because of their ease of implementation.The simplest from of T is when the neighborhood is of size 1×1 (that is, a single pixel). In this case, g depends only on the value of f at (x, y), and T becomes a gray-level (also called an intensity or mapping) transformation function of the form=(3.1-2)s T r()where, for simplicity in notation, r and s are variables denoting, respectively, the grey level of f(x, y) and g(x, y)at any point (x, y).Some fairly simple, yet powerful, processing approaches can be formulates with gray-level transformations. Because enhancement at any point in an image depends only on the grey level at that point, techniques in this category often are referred to as point processing.Larger neighborhoods allow considerably more flexibility. The general approach is to use a function of the values of f in a predefined neighborhood of (x, y) to determine the value of g at (x, y). One of the principal approaches in this formulation is based on the use of so-called masks (also referred to as filters, kernels, templates, or windows). Basically, a mask is a small (say, 3×3) 2-Darray, in which the values of the mask coefficients determine the nature of the type of approach often are referred to as mask processing or filtering. These concepts are discussed in Section 3.5.3.2 Some Basic Gray Level TransformationsWe begin the study of image enhancement techniques by discussing gray-level transformation functions. These are among the simplest of all image enhancement techniques. The values of pixels, before and after processing, will be denoted by r and s, respectively. As indicated in the previous section, these values are related by an expression of the from s = T(r), where T is a transformation that maps a pixel value r into a pixel value s. Since we are dealing with digital quantities, values of the transformation function typically are stored in a one-dimensional array and the mappings from r to s are implemented via table lookups. For an 8-bit environment, a lookup table containing the values of T will have 256 entries.As an introduction to gray-level transformations, which shows three basic types of functions used frequently for image enhancement: linear (negative and identity transformations), logarithmic (log and inverse-log transformations), and power-law (nth power and nth root transformations). The identity function is the trivial case in which out put intensities are identical to input intensities. It is included in the graph only for completeness.3.2.1 Image NegativesThe negative of an image with gray levels in the range [0, L-1]is obtained by using the negative transformation show shown, which is given by the expression=--(3.2-1)s L r1Reversing the intensity levels of an image in this manner produces the equivalent of a photographic negative. This type of processing is particularly suited for enhancing white or grey detail embedded in dark regions of an image, especiallywhen the black areas are dominant in size.3.2.2 Log TransformationsThe general from of the log transformation is=+(3.2-2)log(1)s c rWhere c is a constant, and it is assumed that r ≥0 .The shape of the log curve transformation maps a narrow range of low gray-level values in the input image into a wider range of output levels. The opposite is true of higher values of input levels. We would use a transformation of this type to expand the values of dark pixels in an image while compressing the higher-level values. The opposite is true of the inverse log transformation.Any curve having the general shape of the log functions would accomplish this spreading/compressing of gray levels in an image. In fact, the power-law transformations discussed in the next section are much more versatile for this purpose than the log transformation. However, the log function has the important characteristic that it compresses the dynamic range of image characteristics of spectra. It is not unusual to encounter spectrum values that range from 0 to 106 or higher. While processing numbers such as these presents no problems for a computer, image display systems generally will not be able to reproduce faithfully such a wide range of intensity values .The net effect is that a significant degree of detail will be lost in the display of a typical Fourier spectrum.3.2.3 Power-Law TransformationsPower-Law transformations have the basic froms crϒ=(3.2-3) Where c and y are positive constants .Sometimes Eq. (3.2-3) is written as to account for an offset (that is, a measurable output when the input is zero). However, offsets typically are an issue of display calibration and as a result they are normally ignored in Eq. (3.2-3). Plots of s versus r for various values of y are shown in Fig.3.6. As in the case of the log transformation, power-law curves with fractional values of y map a narrow range of dark input values into a wider range of output values, with theopposite being true for higher values of input levels. Unlike the log function, however, we notice here a family of possible transformation curves obtained simply by varying y. As expected, we see in Fig.3.6 that curves generated with values of y>1 have exactly the opposite effect as those generated with values of y<1. Finally, we note that Eq.(3.2-3) reduces to the identity transformation when c = y = 1.A variety of devices used for image capture, printing, and display respond according to as gamma[hence our use of this symbol in Eq.(3.2-3)].The process used to correct this power-law response phenomena is called gamma correction.Gamma correction is important if displaying an image accurately on a computer screen is of concern. Images that are not corrected properly can look either bleached out, or, what is more likely, too dark. Trying to reproduce colors accurately also requires some knowledge of gamma correction because varying the value of gamma correcting changes not only the brightness, but also the ratios of red to green to blue. Gamma correction has become increasingly important in the past few years, as use of digital images for commercial purposes over the Internet has increased. It is not Internet has increased. It is not unusual that images created for a popular Web site will be viewed by millions of people, the majority of whom will have different monitors and/or monitor settings. Some computer systems even have partial gamma correction built in. Also, current image standards do not contain the value of gamma with which an image was created, thus complicating the issue further. Given these constraints, a reasonable approach when storing images in a Web site is to preprocess the images with a gamma that represents in a Web site is to preprocess the images with a gamma that represents an “average” of the types of monitors and computer systems that one expects in the open market at any given point in time.3.2.4 Piecewise-Linear Transformation FunctionsA complementary approach to the methods discussed in the previous three sections is to use piecewise linear functions. The principal advantage of piecewise linear functions over the types of functions we have discussed thus far is that the form of piecewise functions can be arbitrarily complex. In fact, as we will see shortly, a practical implementation of some important transformations can be formulated onlyas piecewise functions. The principal disadvantage of piecewise functions is that their specification requires considerably more user input.Contrast stretchingOne of the simplest piecewise linear functions is a contrast-stretching transformation. Low-contrast images can result from poor illumination, lack of dynamic range in the imaging sensor, or even wrong setting of a lens aperture during image acquisition. The idea behind contrast stretching is to increase the dynamic range of the gray levels in the image being processed.Gray-level slicingHighlighting a specific range of gray levels in an image often is desired. Applications include enhancing features such as masses of water in satellite imagery and enhancing flaws in X-ray images. There are several ways of doing level slicing, but most of them are variations of two basic themes. One approach is to display a high value for all gray levels in the range of interest and a low value for all other gray levels.Bit-plane slicingInstead of highlighting gray-level ranges, highlighting the contribution made to total image appearance by specific bits might be desired. Suppose that each pixel in an image is represented by 8 bits. Imagine that the image is composed of eight 1-bit planes, ranging from bit-plane 0 for the least significant bit to bit-plane 7 for the most significant bit. In terms of 8-bit bytes, plane 0 contains all the lowest order bits in the bytes comprising the pixels in the image and plane 7 contains all the high-order bits.3.3 Histogram ProcessingThe histogram of a digital image with gray levels in the range [0, L-1] is a discrete function , where is the kth gray level and is the number of pixels in the image having gray level . It is common practice to pixels in the image, denoted by n. Thus, a normalized histogram is given by , for , Loosely speaking, gives an estimate of the probability of occurrence of gray level . Note that the sum of all components of a normalized histogram is equal to 1.Histograms are the basis for numerous spatial domain processing techniques.Histogram manipulation can be used effectively for image enhancement, as shown in this section. In addition to providing useful image statistics, we shall see in subsequent chapters that the information inherent in histograms also is quite useful in other image processing applications, such as image compression and segmentation. Histograms are simple to calculate in software and also lend themselves to economic hardware implementations, thus making them a popular tool for real-time image processing.附录B第三章空间域图像增强增强的首要目标是处理图像,使其比原始图像格式和特定应用。
图像处理专业英语词汇
FFT 滤波器FFT filtersVGA 调色板和许多其他参数VGA palette and many others 按名称排序sort by name包括角度和刻度including angle and scale保持目标keep targets保存save保存和装载save and load饱和度saturation饱和加法和减法add and subtract with saturate背景淡化background flatten背景发现find background边缘和条纹测量Edge and Stripe/Measurement边缘和条纹的提取find edge and stripe编辑Edit编辑edit编辑或删除相关区域edit or delete relative region编码Code编码条Coda Bar变换forward or reverse fast Fourier transformation变量和自定义的行为variables and custom actions变量检测examine variables变形warping变形系数warping coefficients标题tile标注和影响区域label and zone of influence标准normal标准偏差standard deviation表面弯曲convex并入图像merge to image采集栏digitizer bar采集类型grab type菜单形式menu item参数Preferences参数轴和角度reference axis and angle测量measurement测量方法提取extract measurements from测量结果显示和统计display measurement results and statistics测量转换transfer to measurement插入Insert插入条件检查Insert condition checks查找最大值find extreme maximum长度length超过50 个不同特征的计算calculate over 50 different features area 撤销次数number of undo levels乘multiply尺寸size处理Processing处理/采集图像到一个新的窗口processed/grabbed image into new window 窗口window窗口监视watch window窗位window leveling创建create垂直边沿vertical edge从表格新建new from grid从工具条按钮from toolbar button从用户窗口融合merge from user form粗糙roughness错误纠正error correction错误匹配fit error打开open打开近期的文件或脚本open recent file or script打印print打印设置print setup打印预览print preview大小和日期size and date带通band pass带有调色板的8- bit带有动态预览的直方图和x, y 线曲线椭圆轮廓histogram and x, y line curve ellipse profiles with dynamic preview带阻band reject代码类型code type单步single step单一simple单帧采集snap shot导入VB等等etc.低通low pass第一帧first点point调色板预览palette viewer调试方式debug mode调用外部的DLL调整大小resize调整轮廓滤波器的平滑度和轮廓的最小域值adjust smoothness of contour filter and minimum threshold for contours定点除fixed point divide定位精度positional accuracy定义一个包含有不相关的不一致的或无特征区域的模板define model including mask for irrelevant inconsistent or featureless areas定制制定-配置菜单Customize - configure menus动态预览with dynamic preview读出或产生一个条形或矩阵码read or generate bar and matrix codes读取和查验特征字符串erify character strings断点break points对比度contrast对比度拉伸contrast stretch对称symmetry对模板应用“不关心的”像素标注apply don't care pixel mask to model 多边形polygon二进制binary二进制分离separate binary二值和灰度binary and grayscale翻转reverse返回return放大或缩小7 个级别zoom in or out 7 levels分类结果sort results分水岭Watershed分析Analysis分组视图view components浮点float腐蚀erode复合视图view composite复合输入combined with input复制duplicate复制duplicateselect all傅立叶变换Fourier transform改变热点值change hotspot values感兴趣区域ROI高级几何学Advanced geometry高通high pass格式栏formatbar更改默认的搜索参数modify default search parameters 工具Utilities工具栏toolbar工具属性tool properties工具条toolbar工作区workspace bar共享轮廓shared contours构件build构造表格construct grid关闭close和/或and/or和逆FFT画图工具drawing tools缓存buffer换算convert灰度grayscale恢复目标restore targets回放playback绘图连结connect map获得/装载标注make/load mask获取选定粒子draw selected blobs或从一个相关区域创建一个ROI or create an ROI from a relative region基线score基于校准映射的畸变校正distortion correction based on calibration mapping 极性polarity极坐标转换polar coordinate transformation几何学Geometry记录record加粗thick加法add间隔spacing间距distance兼容compatible简洁compactness剪切cut减法subtract减小缩进outdent交互式的定义字体参数包括搜索限制ine font parameters including search constraints 脚本栏script bar角度angle角度和缩放范围angle and scale range接收和确定域值acceptance and certainty thresholds结果栏result bar解开目标unlock targets精确度和时间间隔accuracy and timeout interval矩形rectangle矩形rectangular绝对差分absolute difference绝对值absolute value均匀uniform均值average拷贝copy拷贝序列copy sequence可接收的域值acceptance threshold克隆clone控制control控制controls快捷健shortcut key宽度breadth宽度width拉普拉斯Laplacians拉伸elongation蓝blue类型type粒子blob粒子标注label blobs粒子分离segment blobs粒子内的孔数目number of holes in a blob 亮度brightness亮度luminance另存为save as滤波器filters绿green轮廓profile overlay轮廓极性contour polarity逻辑运算logical operations面积area模板编辑edit model模板覆盖model coverage模板和目标覆盖model and target coverage 模板索引model index模板探测器Model Finder模板位置和角度model position and angle 模板中心model center模糊mask模块import VB module模块modules模式匹配Pattern matching默认案例default cases目标Targets目标分离separate objects目标评价target score欧拉数Euler number盆basins膨胀dilate匹配率match scores匹配数目number of matches平方和sum of the squares平滑smooth平均average平均averaged平均值mean平移translation前景色foreground color清除缓冲区为一个恒量clear buffer to a constant清除特定部分delete special区域增长region-growing ROI取反negate全部删除delete all缺省填充和相连粒子分离fill holes and separate touching blobs任意指定位置的中心矩和二阶矩central and ordinary moments of any order location: X, Y 锐化sharpen三维视图view 3D色度hue删除delete删除帧delete frame设置settings设置相机类型enable digitizer camera type设置要点set main示例demos事件发现数量number of occurrences事件数目number of occurrences视图View收藏collectionDICOM手动manually手绘曲线freehand输出选项output options输出选择结果export selected results输入通道input channel属性页properties page数据矩阵DataMatrix数字化设置Digitizer settings双缓存double buffer双域值two-level水平边沿horizontal edge搜索find搜索和其他应用Windows Finder and other applications 搜索角度search angle搜索结果search results搜索区域search area搜索区域search region搜索速度search speed速度speed算法arithmetic缩放scaling缩放和偏移scale and offset锁定目标lock destination锁定实时图像处理效果预览lock live preview of processing effects on images 锁定预览Lock preview锁定源lock source特定角度at specific angle特定匹配操作hit or miss梯度rank替换replace添加噪声add noise条带直径ferret diameter停止stop停止采集halt grab同步synchronize同步通道sync channel统计Statistics图像Image图像大小image size图像拷贝copy image图像属性image properties图形graph退出exit椭圆ellipse椭圆ellipses外形shape伪彩pseudo-color位置position文本查看view as text文件File文件MIL MFO font file文件load and save as MIL MMF files文件load and save models as MIL MMO files OCR文件中的函数make calls to functions in external DLL files文件转换器file converterActiveMIL Builder ActiveMIL Builder 无符号抽取部分Extract band -细化thin下一帧next显示表现字体的灰度级ayscale representations of fonts显示代码show code线line线lines相对起点relative origin像素总数sum of all pixels向前或向后移动Move to front or back向上或向下up or down校准Calibration校准calibrate新的/感兴趣区域粘贴paste into New/ROI新建new信息/ 图形层DICOM information/overlay形态morphology行为actions修改modify修改路径modify paths修改搜索参数modify default search parameters 序列采集sequence旋转rotation旋转模板rotate model选择select选择selector循环loops移动move移动shift应用过滤器和分类器apply filters and classifiers 影响区域zone of influence映射mapping用户定义user defined用基于变化上的控制实时预览分水岭转化结果阻止过分切割live preview of resulting watershed transformations with control over variation to prevent over segmentation用某个值填充fill with value优化和编辑调色板palette optimization/editor有条件的conditional域值threshold预处理模板优化搜索速度循环全部扫描preprocess model to optimize search speed circular over-scan预览previous元件数目和开始(自动或手动)number of cells and threshold auto or manual元件最小/最大尺寸cell size min/max源source允许的匹配错误率和加权fit error and weight运行run在目标中匹配数目number of modelmatches in target暂停pause增大缩进indent整数除integer divide正FFT正常连续continuous normal支持象征学supported symbologies: BC 412直方图均衡histogram equalization执行execute执行外部程序和自动完成VBA only execute external programs and perform Automation VBA only指定specify指数exponential Rayleigh中值median重复repeat重建reconstruct重建和修改字体restore and modify fonts重新操作redo重心center of gravity周长perimeter注释annotations转换Convert转换convert装载load装载和保存模板为MIL MMO装载和另存为MIL MFO装载和另存为MIL MMF状态栏status bar资源管理器拖放图像drag-and-drop images from Windows ExplorerWindows自动或手动automatic or manual自动或手动模板创建automatic or manual model creation字符产大小string size字符串string字体font最大maximum最大化maximum最大数maxima最后一帧last frame最小minimum最小化minimum最小间隔标准minimum separation criteria最小数minima坐标盒的范围bounding box coordinates图像数据操作Image data manipulation内存分配与释放allocation release图像复制copying设定和转换setting and conversion图像/视频的输入输出Image and video I/O支持文件或摄像头的输入file and camera based input图像/视频文件的输出image/video file output矩阵/向量数据操作及线性代数运算Matrix and vector manipulation and linear algebra routines 矩阵乘积products矩阵方程求解solvers特征值eigenvalues奇异值分解SVD支持多种动态数据结构Various dynamic data structures 链表lists队列queues数据集sets树trees图graphs基本图像处理Basic image processing去噪filtering边缘检测edge detection角点检测corner detection采样与插值sampling and interpolation色彩变换color conversion形态学处理morphological operations直方图histograms图像金字塔结构image pyramids结构分析Structural analysis连通域/分支connected components轮廓处理contour processing距离转换distance transform图像矩various moments模板匹配template matching霍夫变换Hough transform多项式逼近polygonal approximation曲线拟合line fitting椭圆拟合ellipse fitting狄劳尼三角化Delaunay triangulation摄像头定标Camera calibration寻找和跟踪定标模式finding and tracking calibration patterns 参数定标calibration,基本矩阵估计fundamental matrix estimation单应矩阵估计homography estimation立体视觉匹配stereo correspondence)运动分析Motion analysis光流optical flow动作分割motion segmentation目标跟踪tracking目标识别Object recognition特征方法eigen-methodsHMM模型HMM基本的GUI Basic GUI显示图像/视频display image/video键盘/鼠标操作keyboard and mouse handling滑动条scroll-bars图像标注Image labeling直线line曲线conic多边形polygon、文本标注text drawing梯度方向gradient directions系数coefficient空间频率spatial frequencies串级过滤cascade filtering卷积运算convolution operation有限差分近似the finite difference approximation 对数刻度logarithmic scale仿射参数affine parameters斑点Blob差距disparityAlgebraic operation 代数运算;一种图像处理运算,包括两幅图像对应像素的和、差、积、商。
数字图像处理英文原版及翻译
Digital Image Processing and Edge DetectionDigital Image ProcessingInterest in digital image processing methods stems from two principal application areas: improvement of pictorial information for human interpretation; and processing of image data for storage, transmission, and representation for autonomous machine perception.An image may be defined as a two-dimensional function, f(x, y), where x and y are spatial (plane) coordinates, and the amplitude of f at any pair of coordinates (x, y) is called the intensity or gray level of the image at that point. When x, y, and the amplitude values of f are all finite, discrete quantities, we call the image a digital image. The field of digital image processing refers to processing digital images by means of a digital computer. Note that a digital image is composed of a finite number of elements, each of which has a particular location and value. These elements are referred to as picture elements, image elements, pixels, and pixels. Pixel is the term most widely used to denote the elements of a digital image.Vision is the most advanced of our senses, so it is not surprising that images play the single most important role in human perception. However, unlike humans, who are limited to the visual band of the electromagnetic (EM) spec- trum, imaging machines cover almost the entire EM spectrum, ranging from gamma to radio waves. They can operate on images generated by sources that humans are not accustomed to associating with images. These include ultra- sound, electron microscopy, and computer-generated images. Thus, digital image processing encompasses a wide and varied field of applications.There is no general agreement among authors regarding where image processing stops and other related areas, such as image analysis and computer vi- sion, start. Sometimes a distinction is made by defining image processing as a discipline in which both the input and output of a process are images. We believe this to be a limiting and somewhat artificial boundary. For example, under this definition, even the trivial task of computing the average intensity of an image (which yields asingle number) would not be considered an image processing operation. On the other hand, there are fields such as computer vision whose ultimate goal is to use computers to emulate human vision, including learning and being able to make inferences and take actions based on visual inputs. This area itself is a branch of artificial intelligence (AI) whose objective is to emulate human intelligence. The field of AI is in its earliest stages of infancy in terms of development, with progress having been much slower than originally anticipated. The area of image analysis (also called image understanding) is in be- tween image processing and computer vision.There are no clearcut boundaries in the continuum from image processing at one end to computer vision at the other. However, one useful paradigm is to consider three types of computerized processes in this continuum: low-, mid-, and high level processes. Low-level processes involve primitive opera- tions such as image preprocessing to reduce noise, contrast enhancement, and image sharpening. A low-level process is characterized by the fact that both its inputs and outputs are images. Mid-level processing on images involves tasks such as segmentation (partitioning an image into regions or objects), description of those objects to reduce them to a form suitable for computer processing, and classification (recognition) of individual objects. A midlevel process is characterized by the fact that its inputs generally are images, but its outputs are attributes extracted from those images (e.g., edges, contours, and the identity of individual objects). Finally, higher level processing involves “making sense” of an ensemble of recognized objects, as in image analysis, and, at the far end of the continuum, performing the cognitive functions normally associated with vision.Based on the preceding comments, we see that a logical place of overlap between image processing and image analysis is the area of recognition of individual regions or objects in an image. Thus, what we call in this book digital image processing encompasses processes whose inputs and outputs are images and, in addition, encompasses processes that extract attributes from images, up to and including the recognition of individual objects. As a simple illustration to clarify these concepts, consider the area of automated analysis of text. The processes of acquiring an image of the area containing the text, preprocessing that image, extracting(segmenting) the individual characters, describing the characters in a form suitable for computer processing, and recognizing those individual characters are in the scope of what we call digital image processing in this book. Making sense of the content of the page may be viewed as being in the domain of image analysis and even computer vision, depending on the level of complexity implied by the statement “making sense.”As will become evident shortly, digital image processing, as we have defined it, is used successfully in a broad range of areas of exceptional social and economic value.The areas of application of digital image processing are so varied that some form of organization is desirable in attempting to capture the breadth of this field. One of the simplest ways to develop a basic understanding of the extent of image processing applications is to categorize images according to their source (e.g., visual, X-ray, and so on). The principal energy source for images in use today is the electromagnetic energy spectrum. Other important sources of energy include acoustic, ultrasonic, and electronic (in the form of electron beams used in electron microscopy). Synthetic images, used for modeling and visualization, are generated by computer. In this section we discuss briefly how images are generated in these various categories and the areas in which they are applied.Images based on radiation from the EM spectrum are the most familiar, especially images in the X-ray and visual bands of the spectrum. Electromagnet- ic waves can be conceptualized as propagating sinusoidal waves of varying wavelengths, or they can be thought of as a stream of massless particles, each traveling in a wavelike pattern and moving at the speed of light. Each massless particle contains a certain amount (or bundle) of energy. Each bundle of energy is called a photon. If spectral bands are grouped according to energy per photon, we obtain the spectrum shown in fig. below, ranging from gamma rays (highest energy) at one end to radio waves (lowest energy) at the other. The bands are shown shaded to convey the fact that bands of the EM spectrum are not distinct but rather transition smoothly from one to theother.Image acquisition is the first process. Note that acquisition could be as simple as being given an image that is already in digital form. Generally, the image acquisition stage involves preprocessing, such as scaling.Image enhancement is among the simplest and most appealing areas of digital image processing. Basically, the idea behind enhancement techniques is to bring out detail that is obscured, or simply to highlight certain features of interest in an image. A familiar example of enhancement is when we increase the contrast of an image because “it looks better.” It is important to keep in mind that enhancement is a very subjective area of image processing. Image restoration is an area that also deals with improving the appearance of an image. However, unlike enhancement, which is subjective, image restoration is objective, in the sense that restoration techniques tend to be based on mathematical or probabilistic models of image degradation. Enhancement, on the other hand, is based on human subjective preferences regarding what constitutes a “good”enhancement result.Color image processing is an area that has been gaining in importance because of the significant increase in the use of digital images over the Internet. It covers a number of fundamental concepts in color models and basic color processing in a digital domain. Color is used also in later chapters as the basis for extracting features of interest in an image.Wavelets are the foundation for representing images in various degrees of resolution. In particular, this material is used in this book for image data compression and for pyramidal representation, in which images are subdivided successively into smaller regions.Compression, as the name implies, deals with techniques for reducing the storage required to save an image, or the bandwidth required to transmit it.Although storage technology has improved significantly over the past decade, the same cannot be said for transmission capacity. This is true particularly in uses of the Internet, which are characterized by significant pictorial content. Image compression is familiar (perhaps inadvertently) to most users of computers in the form of image , such as the jpg used in the JPEG (Joint Photographic Experts Group) image compression standard.Morphological processing deals with tools for extracting image components that are useful in the representation and description of shape. The material in this chapter begins a transition from processes that output images to processes that output image attributes.Segmentation procedures partition an image into its constituent parts or objects. In general, autonomous segmentation is one of the most difficult tasks in digital image processing. A rugged segmentation procedure brings the process a longway toward successful solution of imaging problems that require objects to be identified individually. On the other hand, weak or erratic segmentation algorithms almost always guarantee eventual failure. In general, the more accurate the segmentation, the more likely recognition is to succeed.Representation and description almost always follow the output of a segmentation stage, which usually is raw pixel data, constituting either the boundary of a region (i.e., the set of pixels separating one image region from another) or all the points in the region itself. In either case, converting the data to a form suitable for computer processing is necessary. The first decision that must be made is whether the data should be represented as a boundary or as a complete region. Boundary representation is appropriate when the focus is on external shape characteristics, such as corners and inflections. Regional representation is appropriate when the focus is on internal properties, such as texture or skeletal shape. In some applications, these representations complement each other. Choosing a representation is only part of the solution for trans- forming raw data into a form suitable for subsequent computer processing. A method must also be specified for describing the data so that features of interest are highlighted. Description, also called feature selection, deals with extracting attributes that result in some quantitative information of interest or are basic for differentiating one class of objects from another.Recognition is the process that assigns a label (e.g., “vehicle”) to an object based on its descriptors. As detailed before, we conclude our coverage of digital image processing with the development of methods for recognition of individual objects.So far we have said nothing about the need for prior knowledge or about the interaction between the knowledge base and the processing modules in Fig 2 above. Knowledge about a problem domain is coded into an image processing system in the form of a knowledge database. This knowledge may be as simple as detailing regions of an image where theinformation of interest is known to be located, thus limiting the search that has to be conducted in seeking that information. The knowledge base also can be quite complex, such as an interrelated list of all major possible defects in a materials inspection problem or an image database containing high-resolution satellite images of a region in connection with change-detection applications. In addition to guiding the operation of each processing module, the knowledge base also controls the interaction between modules. This distinction is made in Fig 2 above by the use of double-headed arrows between the processing modules and the knowledge base, as opposed to single-headed arrows linking the processing modules.Edge detectionEdge detection is a terminology in image processing and computer vision, particularly in the areas of feature detection and feature extraction, to refer to algorithms which aim at identifying points in a digital image at which the image brightness changes sharply or more formally has discontinuities.Although point and line detection certainly are important in any discussion on segmentation,edge detection is by far the most common approach for detecting meaningful discounties in gray level.Although certain literature has considered the detection of ideal step edges, the edges obtained from natural images are usually not at all ideal step edges. Instead they are normally affected by one or several of the following effects:1.focal blur caused by a finite depth-of-field and finite point spread function; 2.penumbral blur caused by shadows created by light sources of non-zero radius; 3.shading at a smooth object edge; 4.local specularities or interreflections in the vicinity of object edges.A typical edge might for instance be the border between a block of red color and a block of yellow. In contrast a line (as can be extracted by a ridge detector) can be a small number of pixels of a different color on an otherwise unchanging background. For a line, there maytherefore usually be one edge on each side of the line.To illustrate why edge detection is not a trivial task, let us consider the problem of detecting edges in the following one-dimensional signal. Here, we may intuitively say that there should be an edge between the 4th and 5th pixels.If the intensity difference were smaller between the 4th and the 5th pixels and if the intensity differences between the adjacent neighbouring pixels were higher, it would not be as easy to say that there should be an edge in the corresponding region. Moreover, one could argue that this case is one in which there are several edges.Hence, to firmly state a specific threshold on how large the intensity change between two neighbouring pixels must be for us to say that there should be an edge between these pixels is not always a simple problem. Indeed, this is one of the reasons why edge detection may be a non-trivial problem unless the objects in the scene are particularly simple and the illumination conditions can be well controlled.There are many methods for edge detection, but most of them can be grouped into two categories,search-based and zero-crossing based. The search-based methods detect edges by first computing a measure of edge strength, usually a first-order derivative expression such as the gradient magnitude, and then searching for local directional maxima of the gradient magnitude using a computed estimate of the local orientation of the edge, usually the gradient direction. The zero-crossing based methods search for zero crossings in a second-order derivative expression computed from the image in order to find edges, usually the zero-crossings of the Laplacian of the zero-crossings of a non-linear differential expression, as will be described in the section on differential edge detection following below. As a pre-processing step to edge detection, a smoothing stage, typically Gaussian smoothing, is almost always applied (see also noise reduction).The edge detection methods that have been published mainly differ in the types of smoothing filters that are applied and the way the measures of edge strength are computed. As many edge detection methods rely on the computation of image gradients, they also differ in the types of filters used for computing gradient estimates in the x- and y-directions.Once we have computed a measure of edge strength (typically the gradient magnitude), the next stage is to apply a threshold, to decide whether edges are present or not at an image point. The lower the threshold, the more edges will be detected, and the result will be increasingly susceptible to noise, and also to picking out irrelevant features from the image. Conversely a high threshold may miss subtle edges, or result in fragmented edges.If the edge thresholding is applied to just the gradient magnitude image, the resulting edges will in general be thick and some type of edge thinning post-processing is necessary. For edges detected with non-maximum suppression however, the edge curves are thin by definition and the edge pixels can be linked into edge polygon by an edge linking (edge tracking) procedure. On a discrete grid, the non-maximum suppression stage can be implemented by estimating the gradient direction using first-order derivatives, then rounding off the gradient direction to multiples of 45 degrees, and finally comparing the values of the gradient magnitude in the estimated gradient direction.A commonly used approach to handle the problem of appropriate thresholds for thresholding is by using thresholding with hysteresis. This method uses multiple thresholds to find edges. We begin by using the upper threshold to find the start of an edge. Once we have a start point, we then trace the path of the edge through the image pixel by pixel, marking an edge whenever we are above the lower threshold. We stop marking our edge only when the value falls below our lower threshold. This approach makes the assumption that edges are likely to be in continuous curves, and allows us to follow a faint section of an edge we have previously seen, without meaning that every noisy pixel in the image is marked down as an edge. Still, however, we have the problem of choosing appropriate thresholdingparameters, and suitable thresholding values may vary over the image.Some edge-detection operators are instead based upon second-order derivatives of the intensity. This essentially captures the rate of change in the intensity gradient. Thus, in the ideal continuous case, detection of zero-crossings in the second derivative captures local maxima in the gradient.We can come to a conclusion that,to be classified as a meaningful edge point,the transition in gray level associated with that point has to be significantly stronger than the background at that point.Since we are dealing with local computations,the method of choice to determine whether a value is “significant” or not id to use a threshold.Thus we define a point in an image as being as being an edge point if its two-dimensional first-order derivative is greater than a specified criterion of connectedness is by definition an edge.The term edge segment generally is used if the edge is short in relation to the dimensions of the image.A key problem in segmentation is to assemble edge segments into longer edges.An alternate definition if we elect to use the second-derivative is simply to define the edge ponits in an image as the zero crossings of its second derivative.The definition of an edge in this case is the same as above.It is important to note that these definitions do not guarantee success in finding edge in an image.They simply give us a formalism to look for them.First-order derivatives in an image are computed using the gradient.Second-order derivatives are obtained using the Laplacian.数字图像处理和边缘检测数字图像处理在数字图象处理方法的兴趣从两个主要应用领域的茎:改善人类解释图像信息;和用于存储,传输,和表示用于自主机器感知图像数据的处理。
数字图像处理英文原版及翻译
数字图象处理英文原版及翻译Digital Image Processing: English Original Version and TranslationIntroduction:Digital Image Processing is a field of study that focuses on the analysis and manipulation of digital images using computer algorithms. It involves various techniques and methods to enhance, modify, and extract information from images. In this document, we will provide an overview of the English original version and translation of digital image processing materials.English Original Version:The English original version of digital image processing is a comprehensive textbook written by Richard E. Woods and Rafael C. Gonzalez. It covers the fundamental concepts and principles of image processing, including image formation, image enhancement, image restoration, image segmentation, and image compression. The book also explores advanced topics such as image recognition, image understanding, and computer vision.The English original version consists of 14 chapters, each focusing on different aspects of digital image processing. It starts with an introduction to the field, explaining the basic concepts and terminology. The subsequent chapters delve into topics such as image transforms, image enhancement in the spatial domain, image enhancement in the frequency domain, image restoration, color image processing, and image compression.The book provides a theoretical foundation for digital image processing and is accompanied by numerous examples and illustrations to aid understanding. It also includes MATLAB codes and exercises to reinforce the concepts discussed in each chapter. The English original version is widely regarded as a comprehensive and authoritative reference in the field of digital image processing.Translation:The translation of the digital image processing textbook into another language is an essential task to make the knowledge and concepts accessible to a wider audience. The translation process involves converting the English original version into the target language while maintaining the accuracy and clarity of the content.To ensure a high-quality translation, it is crucial to select a professional translator with expertise in both the source language (English) and the target language. The translator should have a solid understanding of the subject matter and possess excellent language skills to convey the concepts accurately.During the translation process, the translator carefully reads and comprehends the English original version. They then analyze the text and identify any cultural or linguistic nuances that need to be considered while translating. The translator may consult subject matter experts or reference materials to ensure the accuracy of technical terms and concepts.The translation process involves several stages, including translation, editing, and proofreading. After the initial translation, the editor reviews the translated text to ensure its coherence, accuracy, and adherence to the target language's grammar and style. The proofreader then performs a final check to eliminate any errors or inconsistencies.It is important to note that the translation may require adapting certain examples, illustrations, or exercises to suit the target language and culture. This adaptation ensures that the translated version resonates with the local audience and facilitates better understanding of the concepts.Conclusion:Digital Image Processing: English Original Version and Translation provides a comprehensive overview of the field of digital image processing. The English original version, authored by Richard E. Woods and Rafael C. Gonzalez, serves as a valuable reference for understanding the fundamental concepts and techniques in image processing.The translation process plays a crucial role in making this knowledge accessible to non-English speakers. It involves careful selection of a professional translator, thoroughunderstanding of the subject matter, and meticulous translation, editing, and proofreading stages. The translated version aims to accurately convey the concepts while adapting to the target language and culture.By providing both the English original version and its translation, individuals from different linguistic backgrounds can benefit from the knowledge and advancements in digital image processing, fostering international collaboration and innovation in this field.。
matlab图像处理中英文翻译文献
附录A 英文原文Scene recognition for mine rescue robotlocalization based on visionCUI Yi-an(崔益安), CAI Zi-xing(蔡自兴), WANG Lu(王璐)Abstract:A new scene recognition system was presented based on fuzzy logic and hidden Markov model(HMM) that can be applied in mine rescue robot localization during emergencies. The system uses monocular camera to acquire omni-directional images of the mine environment where the robot locates. By adopting center-surround difference method, the salient local image regions are extracted from the images as natural landmarks. These landmarks are organized by using HMM to represent the scene where the robot is, and fuzzy logic strategy is used to match the scene and landmark. By this way, the localization problem, which is the scene recognition problem in the system, can be converted into the evaluation problem of HMM. The contributions of these skills make the system have the ability to deal with changes in scale, 2D rotation and viewpoint. The results of experiments also prove that the system has higher ratio of recognition and localization in both static and dynamic mine environments.Key words: robot location; scene recognition; salient image; matching strategy; fuzzy logic; hidden Markov model1 IntroductionSearch and rescue in disaster area in the domain of robot is a burgeoning and challenging subject[1]. Mine rescue robot was developed to enter mines during emergencies to locate possible escape routes for those trapped inside and determine whether it is safe for human to enter or not. Localization is a fundamental problem in this field. Localization methods based on camera can be mainly classified into geometric, topological or hybrid ones[2]. With its feasibility and effectiveness, scene recognition becomes one of the important technologies of topological localization.Currently most scene recognition methods are based on global image features and have twodistinct stages: training offline and matching online.During the training stage, robot collects the images of the environment where it works and processes the images to extract global features that represent the scene. Some approaches were used to analyze the data-set of image directly and some primary features were found, such as the PCA method [3]. However, the PCA method is not effective in distinguishing the classes of features. Another type of approach uses appearance features including color, texture and edge density to represent the image. For example, ZHOU et al[4] used multidimensional histograms to describe global appearance features. This method is simple but sensitive to scale and illumination changes. In fact, all kinds of global image features are suffered from the change of environment.LOWE [5] presented a SIFT method that uses similarity invariant descriptors formed by characteristic scale and orientation at interest points to obtain the features. The features are invariant to image scaling, translation, rotation and partially invariant to illumination changes. But SIFT may generate 1 000 or more interest points, which may slow down the processor dramatically.During the matching stage, nearest neighbor strategy(NN) is widely adopted for its facility and intelligibility[6]. But it cannot capture the contribution of individual feature for scene recognition. In experiments, the NN is not good enough to express the similarity between two patterns. Furthermore, the selected features can not represent the scene thoroughly according to the state-of-art pattern recognition, which makes recognition not reliable[7].So in this work a new recognition system is presented, which is more reliable and effective if it is used in a complex mine environment. In this system, we improve the invariance by extracting salient local image regions as landmarks to replace the whole image to deal with large changes in scale, 2D rotation and viewpoint. And the number of interest points is reduced effectively, which makes the processing easier. Fuzzy recognition strategy is designed to recognize the landmarks in place of NN, which can strengthen the contribution of individual feature for scene recognition. Because of its partial information resuming ability, hidden Markov model is adopted to organize those landmarks, which can capture the structure or relationship among them. So scene recognition can be transformed to the evaluation problem of HMM, which makes recognition robust.2 Salient local image regions detectionResearches on biological vision system indicate that organism (like drosophila) often pays attention to certain special regions in the scene for their behavioral relevance or local image cues while observing surroundings [8]. These regions can be taken as natural landmarks to effectively represent and distinguish different environments. Inspired by those, we use center-surround difference method to detect salient regions in multi-scale image spaces. The opponencies of color and texture are computed to create the saliency map.Follow-up, sub-image centered at the salient position in S is taken as the landmark region. The size of the landmark region can be decided adaptively according to the changes of gradient orientation of the local image [11].Mobile robot navigation requires that natural landmarks should be detected stably when environments change to some extent. To validate the repeatability on landmark detection of our approach, we have done some experiments on the cases of scale, 2D rotation and viewpoint changes etc. Fig.1 shows that the door is detected for its saliency when viewpoint changes. More detailed analysis and results about scale and rotation can be found in our previous works[12].3 Scene recognition and localizationDifferent from other scene recognition systems, our system doesn’t need training offline. In other words, our scenes are not classified in advance. When robot wanders, scenes captured at intervals of fixed time are used to build the vertex of a topological map, which represents the place where robot locates. Although the map’s geometric layout is ignored by the localization system, it is useful for visualization and debugging[13] and beneficial to path planning. So localization means searching the best match of current scene on the map. In this paper hidden Markov model is used to organize the extracted landmarks from current scene and create the vertex of topological map for its partial information resuming ability.Resembled by panoramic vision system, robot looks around to get omni-images. FromFig.1 Experiment on viewpoint changeseach image, salient local regions are detected and formed to be a sequence, named as landmark sequence whose order is the same as the image sequence. Then a hidden Markov model is created based on the landmark sequence involving k salient local image regions, which is taken as the description of the place where the robot locates. In our system EVI-D70 camera has a view field of ±170°. Considering the overlap effect, we sample environment every 45° to get 8 images.Let the 8 images as hidden state Si (1≤i≤8), the created HMM can be illustrated by Fig.2. The parameters of HMM, aij and bjk, are achieved by learning, using Baulm-Welch algorithm[14]. The threshold of convergence is set as 0.001.As for the edge of topological map, we assign it with distance information between twovertices. The distances can be computed according to odometry readings.Fig.2 HMM of environmentTo locate itself on the topological map, robot must run its ‘eye’ on environment and extract a landmark sequence L1′ −Lk′ , then search the map for the best matched vertex (scene). Different from traditional probabilistic localization[15], in our system localization problem can be converted to the evaluation problem of HMM. The vertex with the greatest evaluation value, which must also be greater than a threshold, is taken as the best matched vertex, which indicates the most possible place where the robot is.4 Match strategy based on fuzzy logicOne of the key issues in image match problem is to choose the most effective features or descriptors to represent the original image. Due to robot movement, those extracted landmark regions will change at pixel level. So, the descriptors or features chosen should be invariant to some extent according to the changes of scale, rotation and viewpoint etc. In this paper, we use 4 features commonly adopted in the community that are briefly described as follows.GO: Gradient orientation. It has been proved that illumination and rotation changes are likely to have less influence on it[5].ASM and ENT: Angular second moment and entropy, which are two texture descriptors.H: Hue, which is used to describe the fundamental information of the image.Another key issue in match problem is to choose a good match strategy or algorithm. Usually nearest neighbor strategy (NN) is used to measure the similarity between two patterns. But we have found in the experiments that NN can’t adequately exhibit the individual descriptor or feature’s contribution to similarity measurement. As indicated in Fig.4, the input image Fig.4(a) comes from different view of Fig.4(b). But the distance between Figs.4(a) and (b) computed by Jefferey divergence is larger than Fig.4(c).To solve the problem, we design a new match algorithm based on fuzzy logic for exhibiting the subtle changes of each features. The algorithm is described as below.And the landmark in the database whose fused similarity degree is higher than any others is taken as the best match. The match results of Figs.2(b) and (c) are demonstrated by Fig.3. As indicated, this method can measure the similarity effectively between two patterns.Fig.3 Similarity computed using fuzzy strategy5 Experiments and analysisThe localization system has been implemented on a mobile robot, which is built by our laboratory. The vision system is composed of a CCD camera and a frame-grabber IVC-4200. The resolution of image is set to be 400×320 and the sample frequency is set to be 10 frames/s. The computer system is composed of 1 GHz processor and 512 M memory, which is carried by the robot. Presently the robot works in indoor environments.Because HMM is adopted to represent and recognize the scene, our system has the ability to capture the discrimination about distribution of salient local image regions and distinguish similar scenes effectively. Table 1 shows the recognition result of static environments including 5 laneways and a silo. 10 scenes are selected from each environment and HMMs are created for each scene. Then 20 scenes are collected when the robot enters each environment subsequently to match the 60 HMMs above.In the table, “truth” m eans that the scene to be localized matches with the right scene (the evaluation value of HMM is 30% greater than the second high evaluation). “Uncertainty” means that the evaluation value of HMM is greater than the second high evaluation under 10%. “Error match” means that the scene to be localized matches with the wrong scene. In the table, the ratio of error match is 0. But it is possible that the scene to be localized can’t match any scenes and new vertexes are created. Furthermore, the “ratio of truth” about silo is lower because salient cues arefewer in this kind of environment.In the period of automatic exploring, similar scenes can be combined. The process can be summarized as: when localization succeeds, the current landmark sequence is added to the accompanying observation sequence of the matched vertex un-repeatedly according to their orientation (including the angle of the image from which the salient local region and the heading of the robot come). The parameters of HMM are learned again.Compared with the approaches using appearance features of the whole image (Method 2, M2), our system (M1) uses local salient regions to localize and map, which makes it have more tolerance of scale, viewpoint changes caused by robot’s movement and higher ratio of recognition and fewer amount of vertices on the topological map. So, our system has better performance in dynamic environment. These can be seen in Table 2. Laneways 1, 2, 4, 5 are in operation where some miners are working, which puzzle the robot.6 Conclusions1) Salient local image features are extracted to replace the whole image to participate in recognition, which improve the tolerance of changes in scale, 2D rotation and viewpoint of environment image.2) Fuzzy logic is used to recognize the local image, and emphasize the individual feature’s contribution to recognition, which improves the reliability of landmarks.3) HMM is used to capture the structure or relationship of those local images, which converts the scene recognition problem into the evaluation problem of HMM.4) The results from the above experiments demonstrate that the mine rescue robot scene recognition system has higher ratio of recognition and localization.Future work will be focused on using HMM to deal with the uncertainty of localization.附录B 中文翻译基于视觉的矿井救援机器人场景识别CUI Yi-an(崔益安), CAI Zi-xing(蔡自兴), WANG Lu(王璐)摘要:基于模糊逻辑和隐马尔可夫模型(HMM),论文提出了一个新的场景识别系统,可应用于紧急情况下矿山救援机器人的定位。
数字图像处理 外文翻译 外文文献 英文文献 数字图像处理
数字图像处理外文翻译外文文献英文文献数字图像处理Digital Image Processing1 IntroductionMany operators have been proposed for presenting a connected component n a digital image by a reduced amount of data or simplied shape. In general we have to state that the development, choice and modi_cation of such algorithms in practical applications are domain and task dependent, and there is no \best method". However, it isinteresting to note that there are several equivalences between published methods and notions, and characterizing such equivalences or di_erences should be useful to categorize the broad diversity of published methods for skeletonization. Discussing equivalences is a main intention of this report.1.1 Categories of MethodsOne class of shape reduction operators is based on distance transforms. A distance skeleton is a subset of points of a given component such that every point of this subset represents the center of a maximal disc (labeled with the radius of this disc) contained in the given component. As an example in this _rst class of operators, this report discusses one method for calculating a distance skeleton using the d4 distance function which is appropriate to digitized pictures. A second class of operators produces median or center lines of the digitalobject in a non-iterative way. Normally such operators locate critical points _rst, and calculate a speci_ed path through the object by connecting these points.The third class of operators is characterized by iterative thinning. Historically, Listing [10] used already in 1862 the term linear skeleton for the result of a continuous deformation of the frontier of a connected subset of a Euclidean space without changing the connectivity of the original set, until only a set of lines and points remains. Many algorithms in image analysis are based on this general concept of thinning. The goal is a calculation of characteristic properties of digital objects which are not related to size or quantity. Methods should be independent from the position of a set in the plane or space, grid resolution (for digitizing this set) or the shape complexity of the given set. In the literature the term \thinning" is not used - 1 -in a unique interpretation besides that it always denotes a connectivity preserving reduction operation applied to digital images, involving iterations of transformations of speci_ed contour points into background points. A subset Q _ I of object points is reduced by ade_ned set D in one iteration, and the result Q0 = Q n D becomes Q for the next iteration. Topology-preserving skeletonization is a special case of thinning resulting in a connected set of digital arcs or curves.A digital curve is a path p =p0; p1; p2; :::; pn = q such that pi is a neighbor of pi?1, 1 _ i _ n, and p = q. A digital curve is called simpleif each point pi has exactly two neighbors in this curve. A digital arc is a subset of a digital curve such that p 6= q. A point of a digital arc which has exactly one neighbor is called an end point of this arc. Within this third class of operators (thinning algorithms) we may classify with respect to algorithmic strategies: individual pixels are either removed in a sequential order or in parallel. For example, the often cited algorithm by Hilditch [5] is an iterative process of testing and deleting contour pixels sequentially in standard raster scan order. Another sequential algorithm by Pavlidis [12] uses the de_nition of multiple points and proceeds by contour following. Examples of parallel algorithms in this third class are reduction operators which transform contour points into background points. Di_erences between these parallel algorithms are typically de_ned by tests implemented to ensure connectedness in a local neighborhood. The notion of a simple point is of basic importance for thinning and it will be shown in this reportthat di_erent de_nitions of simple points are actually equivalent. Several publications characterize properties of a set D of points (to be turned from object points to background points) to ensure that connectivity of object and background remain unchanged. The report discusses some of these properties in order to justify parallel thinning algorithms.1.2 BasicsThe used notation follows [17]. A digital image I is a functionde_ned on a discrete set C , which is called the carrier of the image.The elements of C are grid points or grid cells, and the elements (p;I(p)) of an image are pixels (2D case) or voxels (3D case). The range of a (scalar) image is f0; :::Gmaxg with Gmax _ 1. The range of a binary image is f0; 1g. We only use binary images I in this report. Let hIi be the set of all pixel locations with value 1, i.e. hIi = I?1(1). The image carrier is de_ned on an orthogonal grid in 2D or 3D - 2 -space. There are two options: using the grid cell model a 2D pixel location p is a closed square (2-cell) in the Euclidean plane and a 3D pixel location is a closed cube (3-cell) in the Euclidean space, where edges are of length 1 and parallel to the coordinate axes, and centers have integer coordinates. As a second option, using the grid point model a 2D or 3D pixel location is a grid point.Two pixel locations p and q in the grid cell model are called 0-adjacent i_ p 6= q and they share at least one vertex (which is a 0-cell). Note that this speci_es 8-adjacency in 2D or 26-adjacency in 3D if the grid point model is used. Two pixel locations p and q in the grid cell model are called 1- adjacent i_ p 6= q and they share at least one edge (which is a 1-cell). Note that this speci_es 4-adjacency in 2D or 18-adjacency in 3D if the grid point model is used. Finally, two 3Dpixel locations p and q in the grid cell model are called 2-adjacent i_ p 6= q and they share at least one face (which is a 2-cell). Note that this speci_es 6-adjacency if the grid point model is used. Any of these adjacency relations A_, _ 2 f0; 1; 2; 4; 6; 18; 26g, is irreexive andsymmetric on an image carrier C. The _-neighborhood N_(p) of a pixel location p includes p and its _-adjacent pixel locations. Coordinates of 2D grid points are denoted by (i; j), with 1 _ i _ n and 1 _ j _ m; i; j are integers and n;m are the numbers of rows and columns of C. In 3Dwe use integer coordinates (i; j; k). Based on neighborhood relations wede_ne connectedness as usual: two points p; q 2 C are _-connected with respect to M _ C and neighborhood relation N_ i_ there is a sequence of points p = p0; p1; p2; :::; pn = q such that pi is an _-neighbor of pi?1, for 1 _ i _ n, and all points on this sequence are either in M or all in the complement of M. A subset M _ C of an image carrier is called _-connected i_ M is not empty and all points in M are pairwise _-connected with respect to set M. An _-component of a subset S of C is a maximal _-connected subset of S. The study of connectivity in digital images has been introduced in [15]. It follows that any set hIi consists of a number of _-components. In case of the grid cell model, a component is the union of closed squares (2D case) or closed cubes (3D case). The boundary of a 2-cell is the union of its four edges and the boundary of a 3-cell is the union of its six faces. For practical purposes it iseasy to use neighborhood operations (called local operations) on adigital image I which de_ne a value at p 2 C in the transformed image based on pixel- 3 -values in I at p 2 C and its immediate neighbors in N_(p).2 Non-iterative AlgorithmsNon-iterative algorithms deliver subsets of components in specied scan orders without testing connectivity preservation in a number of iterations. In this section we only use the grid point model.2.1 \Distance Skeleton" AlgorithmsBlum [3] suggested a skeleton representation by a set of symmetric points.In a closed subset of the Euclidean plane a point p is called symmetric i_ at least 2 points exist on the boundary with equal distances to p. For every symmetric point, the associated maximal discis the largest disc in this set. The set of symmetric points, each labeled with the radius of the associated maximal disc, constitutes the skeleton of the set. This idea of presenting a component of a digital image as a \distance skeleton" is based on the calculation of a speci_ed distance from each point in a connected subset M _ C to the complement of the subset. The local maxima of the subset represent a \distance skeleton". In [15] the d4-distance is specied as follows. De_nition 1 The distance d4(p; q) from point p to point q, p 6= q, is the smallest positive integer n such that there exists a sequence of distinct grid points p = p0,p1; p2; :::; pn = q with pi is a 4-neighbor of pi?1, 1 _ i _ n.If p = q the distance between them is de_ned to be zero. Thedistance d4(p; q) has all properties of a metric. Given a binary digital image. We transform this image into a new one which represents at each point p 2 hIi the d4-distance to pixels having value zero. The transformation includes two steps. We apply functions f1 to the image Iin standard scan order, producing I_(i; j) = f1(i; j; I(i; j)), and f2in reverse standard scan order, producing T(i; j) = f2(i; j; I_(i; j)), as follows:f1(i; j; I(i; j)) =8><>>:0 if I(i; j) = 0minfI_(i ? 1; j)+ 1; I_(i; j ? 1) + 1gif I(i; j) = 1 and i 6= 1 or j 6= 1- 4 -m+ n otherwisef2(i; j; I_(i; j)) = minfI_(i; j); T(i+ 1; j)+ 1; T(i; j + 1) + 1g The resulting image T is the distance transform image of I. Notethat T is a set f[(i; j); T(i; j)] : 1 _ i _ n ^ 1 _ j _ mg, and let T_ _ T such that [(i; j); T(i; j)] 2 T_ i_ none of the four points in A4((i; j)) has a value in T equal to T(i; j)+1. For all remaining points (i; j) let T_(i; j) = 0. This image T_ is called distance skeleton. Now weapply functions g1 to the distance skeleton T_ in standard scan order, producing T__(i; j) = g1(i; j; T_(i; j)), and g2 to the result of g1 in reverse standard scan order, producing T___(i; j) = g2(i; j; T__(i; j)), as follows:g1(i; j; T_(i; j)) = maxfT_(i; j); T__(i ? 1; j)? 1; T__(i; j ? 1) ? 1gg2(i; j; T__(i; j)) = maxfT__(i; j); T___(i + 1; j)? 1; T___(i; j + 1) ? 1gThe result T___ is equal to the distance transform image T. Both functions g1 and g2 de_ne an operator G, with G(T_) = g2(g1(T_)) = T___, and we have [15]: Theorem 1 G(T_) = T, and if T0 is any subset of image T (extended to an image by having value 0 in all remaining positions) such that G(T0) = T, then T0(i; j) = T_(i; j) at all positions of T_with non-zero values. Informally, the theorem says that the distance transform image is reconstructible from the distance skeleton, and it is the smallest data set needed for such a reconstruction. The useddistance d4 di_ers from the Euclidean metric. For instance, this d4-distance skeleton is not invariant under rotation. For an approximation of the Euclidean distance, some authors suggested the use of di_erent weights for grid point neighborhoods [4]. Montanari [11] introduced a quasi-Euclidean distance. In general, the d4-distance skeleton is a subset of pixels (p; T(p)) of the transformed image, and it is not necessarily connected.2.2 \Critical Points" AlgorithmsThe simplest category of these algorithms determines the midpointsof subsets of connected components in standard scan order for each row. Let l be an index for the number of connected components in one row of the original image. We de_ne the following functions for 1 _ i _ n: ei(l) = _ j if this is the lth case I(i; j) = 1 ^ I(i; j ? 1) = 0 in row i, counting from the left, with I(i;?1) = 0 ,oi(l) = _ j if this is the lth case I(i; j) = 1- 5 -^ I(i; j+ 1) = 0 ,in row i, counting from the left, with I(i;m+ 1)= 0 ,mi(l) = int((oi(l) ?ei(l)=2)+ oi(l) ,The result of scanning row i is a set ofcoordinates (i;mi(l)) ofof the connected components in row i. The set of midpoints of all rows midpoints ,constitutes a critical point skeleton of an image I. This method is computationally eÆcient.The results are subsets of pixels of the original objects, and these subsets are not necessarily connected. They can form \noisy branches" when object components are nearly parallel to image rows. They may be useful for special applications where the scanning direction is approximately perpendicular to main orientations of object components.References[1] C. Arcelli, L. Cordella, S. Levialdi: Parallel thinning ofbinary pictures. Electron. Lett. 11:148{149, 1975}.[2] C. Arcelli, G. Sanniti di Baja: Skeletons of planar patterns. in: Topolog- ical Algorithms for Digital Image Processing (T. Y. Kong, A. Rosenfeld, eds.), North-Holland, 99{143, 1996.}[3] H. Blum: A transformation for extracting new descriptors of shape. in: Models for the Perception of Speech and Visual Form (W. Wathen- Dunn, ed.), MIT Press, Cambridge, Mass., 362{380, 1967.19} - 6 -数字图像处理1引言许多研究者已提议提出了在数字图像里的连接组件是由一个减少的数据量或简化的形状。
介绍数字图像处理外文翻译
附录1 外文原文Source: "the 21st century literature the applied undergraduate electronic communication series of practical teaching planThe information and communication engineering specialty in English ch02_1. PDF 120-124Ed: HanDing ZhaoJuMin, etcText A: An Introduction to Digital Image Processing1. IntroductionDigital image processing remains a challenging domain of programming for several reasons. First the issue of digital image processing appeared relatively late in computer history. It had to wait for the arrival of the first graphical operating systems to become a true matter. Secondly, digital image processing requires the most careful optimizations especially for real time applications. Comparing image processing and audio processing is a good way to fix ideas. Let us consider the necessary memory bandwidth for examining the pixels of a 320x240, 32 bits bitmap, 30 times a second: 10 Mo/sec. Now with the same quality standard, an audio stereo wave real time processing needs 44100 (samples per second) x 2 (bytes per sample per channel) x 2(channels) = 176Ko/sec, which is 50 times less.Obviously we will not be able to use the same techniques for both audio and image signal processing. Finally, digital image processing is by definition a two dimensions domain; this somehow complicates things when elaborating digital filters.We will explore some of the existing methods used to deal with digital images starting by a very basic approach of color interpretation. As a moreadvanced level of interpretation comes the matrix convolution and digital filters. Finally, we will have an overview of some applications of image processing.The aim of this document is to give the reader a little overview of the existing techniques in digital image processing. We will neither penetrate deep into theory, nor will we in the coding itself; we will more concentrate on the algorithms themselves, the methods. Anyway, this document should be used as a source of ideas only, and not as a source of code. 2. A simple approach to image processing(1) The color data: Vector representation①BitmapsThe original and basic way of representing a digital colored image in a computer's memory is obviously a bitmap. A bitmap is constituted of rows of pixels, contraction of the word s “Picture Element”. Each pixel has a particular value which determines its appearing color. This value is qualified by three numbers giving the decomposition of the color in the three primary colors Red, Green and Blue. Any color visible to human eye can be represented this way. The decomposition of a color in the three primary colors is quantified by a number between 0 and 255. For example, white will be coded as R = 255, G = 255, B = 255; black will be known as (R,G,B)= (0,0,0); and say, bright pink will be : (255,0,255). In other words, an image is an enormous two-dimensional array of color values, pixels, each of them coded on 3 bytes, representing the three primary colors. This allows the image to contain a total of 256×256×256 = 16.8 million different colors. This technique is also known as RGB encoding, and is specifically adapted to human vision. With cameras or other measure instruments we are capable of “seeing”thousands of other “colors”, in which cases the RG B encoding is inappropriate.The range of 0-255 was agreed for two good reasons: The first is that the human eye is not sensible enough to make the difference between more than 256 levels of intensity (1/256 = 0.39%) for a color. That is to say, an image presented to a human observer will not be improved by using more than 256 levels of gray (256shades of gray between black and white). Therefore 256 seems enough quality. The second reason for the value of 255 is obviously that it is convenient for computer storage. Indeed on a byte, which is the computer's memory unit, can be coded up to 256 values.As opposed to the audio signal which is coded in the time domain, the image signal is coded in a two dimensional spatial domain. The raw image data is much more straightforward and easy to analyze than the temporal domain data of the audio signal. This is why we will be able to do lots of stuff and filters for images without transforming the source data, while this would have been totally impossible for audio signal. This first part deals with the simple effects and filters you can compute without transforming the source data, just by analyzing the raw image signal as it is.The standard dimensions, also called resolution, for a bitmap are about 500 rows by 500 columns. This is the resolution encountered in standard analogical television and standard computer applications. You can easily calculate the memory space a bitmap of this size will require. We have 500×500 pixels, each coded on three bytes, this makes 750 Ko. It might not seem enormous compared to the size of hard drives, but if you must deal with an image in real time then processing things get tougher. Indeed rendering images fluidly demands a minimum of 30 images per second, the required bandwidth of 10 Mo/sec is enormous. We will see later that the limitation of data access and transfer in RAM has a crucial importance in image processing, and sometimes it happens to be much more important than limitation of CPU computing, which may seem quite different from what one can be used to in optimization issues. Notice that, with modern compression techniques such as JPEG 2000, the total size of the image can be easily reduced by 50 times without losing a lot of quality, but this is another topic.②Vector representation of colorsAs we have seen, in a bitmap, colors are coded on three bytes representing their decomposition on the three primary colors. It sounds obvious to a mathematician to immediately interpret colors as vectors in athree-dimension space where each axis stands for one of the primary colors. Therefore we will benefit of most of the geometric mathematical concepts to deal with our colors, such as norms, scalar product, projection, rotation or distance. This will be really interesting for some kind of filters we will see soon. Figure 1 illustrates this new interpretation:Figure 1(2) Immediate application to filters① Edge DetectionFrom what we have said before we can quantify the 'difference' between two colors by computing the geometric distance between the vectors representing those two colors. Lets consider two colors C1 = (R1,G1,B1) and C2 = (R2,B2,G2), the distance between the two colors is given by the formula :D(C1, C2) =(R1+This leads us to our first filter: edge detection. The aim of edge detection is to determine the edge of shapes in a picture and to be able to draw a resultbitmap where edges are in white on black background (for example). The idea is very simple; we go through the image pixel by pixel and compare the color of each pixel to its right neighbor, and to its bottom neighbor. If one of these comparison results in a too big difference the pixel studied is part of an edge and should be turned to white, otherwise it is kept in black. The fact that we compare each pixel with its bottom and right neighbor comes from the fact that images are in two dimensions. Indeed if you imagine an image with only alternative horizontal stripes of red and blue, the algorithms wouldn't see the edges of those stripes if it only compared a pixel to its right neighbor. Thus the two comparisons for each pixel are necessary.This algorithm was tested on several source images of different types and it gives fairly good results. It is mainly limited in speed because of frequent memory access. The two square roots can be removed easily by squaring the comparison; however, the color extractions cannot be improved very easily. If we consider that the longest operations are the get pixel function and put pixel functions, we obtain a polynomial complexity of 4*N*M, where N is the number of rows and M the number of columns. This is not reasonably fast enough to be computed in realtime. For a 300×300×32 image I get about 26 transforms per second on an Athlon XP 1600+. Quite slow indeed.Here are the results of the algorithm on an example image:A few words about the results of this algorithm: Notice that the quality of the results depends on the sharpness of the source image. Ifthe source image is very sharp edged, the result will reach perfection. However if you have a very blurry source you might want to make it pass through a sharpness filter first, which we will study later. Another remark, you can also compare each pixel with its second or third nearest neighbors on the right and on the bottom instead of the nearest neighbors. The edges will be thicker but also more exact depending on the source image's sharpness. Finally we will see later on that there is another way to make edge detection with matrix convolution.②Color extractionThe other immediate application of pixel comparison is color extraction.Instead of comparing each pixel with its neighbors, we are going to compare it with a given color C1. This algorithm will try to detect all the objects in the image that are colored with C1. This was quite useful for robotics for example. It enables you to search on streaming images for a particular color. You can then make you robot go get a red ball for example. We will call the reference color, the one we are looking for in the image C0 = (R0,G0,B0).Once again, even if the square root can be easily removed it doesn't really improve the speed of the algorithm. What really slows down the whole loop is the NxM get pixel accesses to memory and put pixel. This determines the complexity of this algorithm: 2xNxM, where N and M are respectively the numbers of rows and columns in the bitmap. The effective speed measured on my computer is about 40 transforms per second on a 300x300x32 source bitmap.3.JPEG image compression theory(一)JPEG compression is divided into four steps to achieve:(1) Color mode conversion and samplingRGB color system is the most common ways that color. JPEG uses a YCbCr colorsystem. Want to use JPEG compression method dealing with the basic full-color images, RGB color mode to first image data is converted to YCbCr color model data. Y representative of brightness, Cb and Cr represents the hue, saturation. By the following calculation to be completed by data conversion. Y = 0.2990R +0.5870 G+0.1140 B Cb =- 0.1687R-0.3313G +0.5000 B +128 Cr = 0.5000R-0.4187G-0.0813B+128 of human eyes on the low-frequency data than high-frequency data with higher The sensitivity, in fact, the human eye to changes in brightness than to color changes should be much more sensitive, ie Y component of the data is more important. Since the Cb and Cr components is relatively unimportant component of the data comparison, you can just take part of the data to deal with. To increase the compression ratio. JPEG usually have two kinds of sampling methods: YUV411 and YUV422, they represent is the meaning of Y, Cb and Cr data sampling ratio of three components.(2)DCT transformationThe full name is the DCT-discrete cosine transform (Discrete Cosine Transform), refers to a group of light intensity data into frequency data, in order that intensity changes of circumstances. If the modification of high-frequency data do, and then back to the original form of data, it is clear there are some differences with the original data, but the human eye is not easy to recognize. Compression, the original image data is divided into 8 * 8 matrix of data units. JPEG entire luminance and chrominance Cb matrix matrix, saturation Cr matrix as a basic unit called the MCU. Each MCU contains a matrix of no more than 10. For example, the ratio of rows and columns Jie Wei 4:2:2 sampling, each MCU will contain four luminance matrix, a matrix and a color saturation matrix. When the image data is divided into an 8 * 8 matrix, you must also be subtracted for each value of 128, and then a generation of formula into the DCT transform can be achieved by DCT transform purposes. The image data value must be reduced by 128, because the formula accepted by the DCT-figure range is between -128 to +127.(3)QuantizationImage data is converted to the frequency factor, you still need to accept a quantitative procedure to enter the coding phase. Quantitative phase requires two 8 * 8 matrix of data, one is to deal specifically with the brightness of the frequency factor, the other is the frequency factor for the color will be the frequency coefficient divided by the value of quantization matrix to obtain the nearest whole number with the quotient, that is completed to quantify. When the frequency coefficients after quantization, will be transformed into the frequency coefficients from the floating-point integer This facilitate the implementation of the final encoding. However, after quantitative phase, all the data to retain only the integer approximation, also once again lost some data content.(4)CodingHuffman encoding without patent issues, to become the most commonly used JPEG encoding, Huffman coding is usually carried out in a complete MCU. Coding, each of the DC value matrix data 63 AC value, will use a different Huffman code tables, while the brightness and chroma also require a different Huffman code tables, it needs a total of four code tables, in order to successfully complete the JPEG coding. DC Code DC is a color difference pulse code modulation using the difference coding method, which is in the same component to obtain an image of each DC value and the difference between the previous DC value to encode. DC pulse code using the main reason for the difference is due to a continuous tone image, the difference mostly smaller than the original value of the number of bits needed to encode the difference will be more than the original value of the number of bits needed to encode the less. For example, a margin of 5, and its binary representation of a value of 101, if the difference is -5, then the first changed to a positive integer 5, and then converted into its 1's complement binary number can be. The so-called one's complement number, that is, if the value is 0 for each Bit, then changed to 1; Bit is 1, it becomes 0. Difference between the five should retain the median 3, the following table that lists the difference between the Bit to be retained and the difference between the number of content controls.In the margin of the margin front-end add some additional value Hoffman code, such as the brightness difference of 5 (101) of the median of three, then the Huffman code value should be 100, the two connected together shall be 100101. The following two tables are the brightness and chroma DC difference encoding table. According to these two forms content, you can add the difference for the DC value Huffman code to complete the DC coding.4. ConclusionsDigital image processing is far from being a simple transpose of audiosignal principles to a two dimensions space. Image signal has its particular properties, and therefore we have to deal with it in a specificway. The Fast Fourier Transform, for example, which was such a practical tool in audio processing, becomes useless in image processing. Oppositely, digital filters are easier to create directly, without any signal transforms, in image processing.Digital image processing has become a vast domain of modern signal technologies. Its applications pass far beyond simple aesthetical considerations, and they include medical imagery, television and multimedia signals, security, portable digital devices, video compression,and even digital movies. We have been flying over some elementarynotions in image processing but there is yet a lot more to explore. Ifyou are beginning in this topic, I hope this paper will have given you thetaste and the motivation to carry on.附录2 外文翻译文献出处:《21 世纪全国应用型本科电子通信系列实用规划教材》之《信息与通信工程专业英语》ch02_1.pdf 120-124页主编:韩定定、赵菊敏等正文:介绍数字图像处理1.导言有几个原因使数字图像处理仍然是一个具有挑战性的领域。
图像处理专业英语词汇

图像处理专业英语词汇图像处理是计算机科学领域中的一个重要分支,它涉及到数字图像的获取、处理、分析和展示。
在图像处理领域,有许多专业的英语词汇需要掌握。
本文将介绍一些常用的图像处理专业英语词汇,帮助读者更好地理解和运用这些术语。
一、数字图像获取数字图像获取是指通过传感器或者扫描仪等设备获取图像的过程。
在这个过程中,有一些常用的英语词汇需要了解。
1. Sensor(传感器)- 一种用于检测和测量环境变化的装置,常用于捕捉图像中的光线信息。
2. Scanner(扫描仪)- 一种设备,用于将纸质图像或照片转换为数字图像。
3. Resolution(分辨率)- 衡量图像细节的能力,通常以像素为单位表示。
4. Pixel(像素)- 图像的最小单位,每个像素代表一个颜色值。
5. Color depth(颜色深度)- 表示每个像素可以显示的颜色数量,通常以位数表示。
二、图像处理基础图像处理的基础是对图像进行各种操作和处理,以改善图像质量或提取有用的信息。
以下是一些常用的英语词汇。
1. Enhancement(增强)- 通过调整图像的对比度、亮度或者颜色等参数来改善图像质量。
2. Filtering(滤波)- 通过应用滤波器来改变图像的频率特性或去除噪声。
3. Segmentation(分割)- 将图像分成不同的区域或对象,以便更好地进行分析和处理。
4. Edge detection(边缘检测)- 识别图像中的边缘或轮廓。
5. Histogram(直方图)- 表示图像中不同灰度级的像素数量的统计图。
三、图像分析与识别图像分析和识别是图像处理的重要应用之一,它涉及到从图像中提取和识别有用的信息。
以下是一些常用的英语词汇。
1. Feature extraction(特征提取)- 从图像中提取有用的特征,用于分类和识别。
2. Pattern recognition(模式识别)- 通过比较图像中的模式和已知的模式,来识别图像中的对象或场景。
数字图像处理中英文对照外文翻译文献

(文档含英文原文和中文翻译)中英文翻译原文To image edge examination algorithm researchAbstract :Digital image processing took a relative quite young discipline, is following the computer technology rapid development, day by day obtains the widespread application.The edge took the image one kind of basic characteristic, in the pattern recognition, the image division, the image intensification as well as the image compression and so on in the domain has a more widespread application.Image edge detection method many and varied, in which based onbrightness algorithm, is studies the time to be most long, the theory develops the maturest method, it mainly is through some difference operator, calculates its gradient based on image brightness the change, thus examines the edge, mainly has Robert, Laplacian, Sobel, Canny, operators and so on LOG。
图像处理专业英语词汇
图像处理专业英语词汇Introduction:As a professional in the field of image processing, it is important to have a strong command of the relevant technical terminology in English. This will enable effective communication with colleagues, clients, and stakeholders in the industry. In this document, we will provide a comprehensive list of commonly used English vocabulary related to image processing, along with their definitions and usage examples.1. Image Processing:Image processing refers to the manipulation and analysis of digital images using computer algorithms. It involves various techniques such as image enhancement, restoration, segmentation, and recognition.2. Pixel:A pixel, short for picture element, is the smallest unit of a digital image. It represents a single point in an image and contains information about its color and intensity.Example: The resolution of a digital camera is determined by the number of pixels it can capture in an image.3. Resolution:Resolution refers to the level of detail that can be captured or displayed in an image. It is typically measured in pixels per inch (PPI) or dots per inch (DPI).Example: Higher resolution images provide sharper and more detailed visuals.4. Image Enhancement:Image enhancement involves improving the quality of an image by adjusting its brightness, contrast, sharpness, and color balance.Example: The image processing software offers a range of tools for enhancing photographs.5. Image Restoration:Image restoration techniques are used to remove noise, blur, or other distortions from an image and restore it to its original quality.Example: The image restoration algorithm successfully eliminated the noise in the scanned document.6. Image Segmentation:Image segmentation is the process of dividing an image into multiple regions or objects based on their characteristics, such as color, texture, or intensity.Example: The image segmentation algorithm accurately separated the foreground and background objects.7. Image Recognition:Image recognition involves identifying and classifying objects or patterns in an image using machine learning and computer vision techniques.Example: The image recognition system can accurately recognize and classify different species of flowers.8. Histogram:A histogram is a graphical representation of the distribution of pixel intensities in an image. It shows the frequency of occurrence of different intensity levels.Example: The histogram analysis revealed a high concentration of dark pixels in the image.9. Edge Detection:Edge detection is a technique used to identify and highlight the boundaries between different objects or regions in an image.Example: The edge detection algorithm accurately detected the edges of the objects in the image.10. Image Compression:Image compression is the process of reducing the file size of an image without significant loss of quality. It is achieved by removing redundant or irrelevant information from the image.Example: The image compression algorithm reduced the file size by 50% without noticeable loss of image quality.11. Morphological Operations:Morphological operations are a set of image processing techniques used to analyze and manipulate the shape and structure of objects in an image.Example: The morphological operations successfully removed small noise particles from the image.12. Feature Extraction:Feature extraction involves identifying and extracting relevant features or characteristics from an image for further analysis or classification.Example: The feature extraction algorithm extracted texture features from the image for cancer detection.Conclusion:This comprehensive list of English vocabulary related to image processing provides a solid foundation for effective communication in the field. By familiarizing yourself with these terms and their usage, you will be better equipped to collaborate, discuss, andpresent ideas in the context of image processing. Remember to continuously update your knowledge as the field evolves and new techniques emerge.。
图像处理外文翻译

杭州电子科技大学毕业设计(论文)外文文献翻译毕业设计(论文)题目基于遗传算法的自动图像分割软件开发翻译(1)题目Image Segmentation by Using ThresholdTechniques翻译(2)题目A Review on Otsu Image Segmentation Algorithm学院计算机学院专业计算机科学与技术姓名刘xx班级11xxxxxx学号1115xxxx指导教师孔xx使用阈值技术的图像分割 1摘要本文试图通过5阈值法作为平均法,P-tile算法,直方图相关技术(HDT),边缘最大化技术(EMT)和可视化技术进行了分割图像技术的研究,彼此比较从而选择合的阈值分割图像的最佳技术。
这些技术适用于三个卫星图像选择作为阈值分割图像的基本猜测。
关键词:图像分割,阈值,自动阈值1 引言分割算法是基于不连续性和相似性这两个基本属性之一的强度值。
第一类是基于在强度的突然变化,如在图像的边缘进行分区的图像。
第二类是根据预定义标准基于分割的图像转换成类似的区域。
直方图阈值的方法属于这一类。
本文研究第二类(阈值技术)在这种情况下,通过这项课题可以给予这些研究简要介绍。
阈分割技术可分为三个不同的类:首先局部技术基于像素和它们临近地区的局部性质。
其次采用全局技术分割图像可以获得图像的全局信息(通过使用图像直方图,例如;全局纹理属性)。
并且拆分,合并,生长技术,为了获得良好的分割效果同时使用的同质化和几何近似的概念。
最后的图像分割,在图像分析的领域中,常用于将像素划分成区域,以确定一个图像的组成[1][2]。
他们提出了一种二维(2-D)的直方图基于多分辨率分析(MRA)的自适应阈值的方法,降低了计算的二维直方图的复杂而提高了多分辨率阈值法的搜索精度。
这样的方法源于通过灰度级和灵活性的空间相关性的多分辨率阈值分割方法中的阈值的寻找以及效率由二维直方图阈值分割方法所取得的非凡分割效果。
实验的结果表明,这种方法可以得到的分割结果与详尽二维直方图方法相类似,而计算复杂度与分辨率等级的增加而呈指数下降[3]。
- 1、下载文档前请自行甄别文档内容的完整性,平台不提供额外的编辑、内容补充、找答案等附加服务。
- 2、"仅部分预览"的文档,不可在线预览部分如存在完整性等问题,可反馈申请退款(可完整预览的文档不适用该条件!)。
- 3、如文档侵犯您的权益,请联系客服反馈,我们会尽快为您处理(人工客服工作时间:9:00-18:30)。
附录一英文原文Illustrator software and Photoshop software difference Photoshop and Illustrator is by Adobe product of our company, but as everyone more familiar Photoshop software, set scanning images, editing modification, image production, advertising creative, image input and output in one of the image processing software, favored by the vast number of graphic design personnel and computer art lovers alike.Photoshop expertise in image processing, and not graphics creation. Its application field, also very extensive, images, graphics, text, video, publishing various aspects have involved. Look from the function, Photoshop can be divided into image editing, image synthesis, school tonal color and special effects production parts. Image editing is image processing based on the image, can do all kinds of transform such as amplifier, reducing, rotation, lean, mirror, clairvoyant, etc. Also can copy, remove stain, repair damaged image, to modify etc. This in wedding photography, portrait processing production is very useful, and remove the part of the portrait, not satisfied with beautification processing, get let a person very satisfactory results.Image synthesis is will a few image through layer operation, tools application of intact, transmit definite synthesis of meaning images, which is a sure way of fine arts design. Photoshop provide drawing tools let foreign image and creative good fusion, the synthesis of possible make the image is perfect.School colour in photoshop with power is one of the functions of deep, the image can be quickly on the color rendition, color slants adjustment and correction, also can be in different colors to switch to meet in different areas such as web image design, printing and multimedia application.Special effects production in photoshop mainly by filter, passage of comprehensive application tools and finish. Including image effects of creative and special effects words such as paintings, making relief, gypsum paintings, drawings, etc commonly used traditional arts skills can be completed by photoshop effects. And all sorts of effects of production aremany words of fine arts designers keen on photoshop reason to study.Users in the use of Photoshop color function, will meet several different color mode: RGB, CMY K, HSB and Lab. RGB and CMYK color mode will let users always remember natural color, users of color and monitors on the printed page color is a totally different approach to create. The monitor is by sending red, green, blue three beams to create color: it is using RGB (red/green/blue) color mode. In order to make a complex color photographs on a continuous colour and lustre effect, printing technology used a cyan, the red, yellow and black ink presentation combinations from and things, reflect or absorb all kinds of light wavelengths. Through overprint) this print (add four color and create color is CMYK (green/magenta/yellow/black) yan color part of a pattern. HSB (colour and lustre/saturation/brightness) color model is based on the way human feelings, so the color will be natural color for customer computer translation of the color create provides an intuitive methods. The Lab color mode provides a create "don't rely on equipment" color method, this also is, no matter use what monitors.Photoshop expertise in image processing, and not graphics creation. It is necessary to distinguish between the two concepts. Image processing of the existing bitmap image processing and use edit some special effects, the key lies in the image processing processing; Graphic creation software is according to their own idea originality, using vector graphics to design graphics, this kind of software main have another famous company Adobe Illustrator and Macromedia company software Freehand.As the world's most famous Adobe Illustrator, feat graphics software is created, not graphic image processing. Adobe Illustrator is published, multimedia and online image industry standard vector illustration software. Whether production printing line draft of the designers and professional Illustrator, production multimedia image of artists, or Internet page or online content producers Illustrator, will find is not only an art products tools. This software for your line of draft to provide unprecedented precision and control, is suitable for the production of any small design to large complex projects.Adobe Illustrator with its powerful function and considerate user interface has occupied most of the global vector editing software share. With incomplete statistics global 37% of stylist is in use Adobe Illustrator art design. Especially the patent PostScript Adobe companybased on the use of technology, has been fully occupied professional Illustrator printed fields. Whether you're line art designers and professional Illustrator, production multimedia image of artists, or Internet page or online content producers, had used after Illustrator, its formidable will find the function and concise interface design style only Freehand to compare. (Macromedia Freehand is launched vector graphics software company, following the Macromedia company after the merger by Adobe Illustrator and will decide to continue the development of the software have been withdrawn from market).Adobe company in 1987 when they launched the Illustrator1.1 version. In the following year, and well platform launched 2.0 version. Illustrator really started in 1988, should say is introduced on the Mac Illustrator 88 version. A year after the upgrade to on the Mac version3.0 in 1991, and spread to Unix platforms. First appeared on the platform in the PC version4.0 version of 1992, this version is also the earliest Japanese transplant version. And in the MAC is used most is5.0/5.5 version, because this version used Dan Clark's do alias (anti-aliasing display) display engine is serrated, make originally had been in graphic display of vector graphics have a qualitative leap. At the same time on the screen making significant reform, style and Photoshop is very similar, so for the Adobe old users fairly easy to use, it is no wonder that did not last long, and soon also popular publishing industry launched Japanese. But not offering PC version. Adobe company immediately Mac and Unix platforms in launched version6.0. And by Illustrator real PC users know is introduced in 1997, while7.0 version of Mac and Windows platforms launch. Because the 7.0 version USES the complete PostScript page description language, make the page text and graphics quality got again leap. The more with her and Photoshop good interchangeability, won a good reputation. The only pity is the support of Chinese 7.0 abysmal. In 1998 the company launched landmark Adobe Illustrator8.0, making version - Illustrator became very perfect drawing software, is relying on powerful strength, Adobe company completely solved of Chinese characters and Japanese language support such double byte, more increased powerful "grid transition" tool (there are corresponding Draw9.0 Corel, but the effect the function of poor), text editing tools etc function, causes its fully occupy the professional vector graphics software's supremacy.Adobe Illustrator biggest characteristics is the use of beisaier curve, make simpleoperation powerful vector graphics possible. Now it has integrated functions such as word processing, coloring, not only in illustrations production, in printing products (such as advertising leaflet, booklet) design manufacture aspect is also widely used, in fact has become desktop publishing or (DTP) industry default standard. Its main competitors are in 2005, but MacromediaFreehand Macromedia had been Adobe company mergers.So-called beisaier curve method, in this software is through "the pen tool" set "anchor point" and "direction line" to realize. The average user in the beginning when use all feel not accustomed to, and requires some practice, but once the master later can follow one's inclinations map out all sorts of line, and intuitive and reliable.It also as Creative Suite of software suit with important constituent, and brother software - bitmap graphics software Photoshop have similar interface, and can share some plug-ins and function, realize seamless connection. At the same time it also can put the files output for Flash format. Therefore, can pass Illustrator let Adobe products and Flash connection.Adobe Illustrator CS5 on May 17, 2010 issue. New Adobe Illustrator CS5 software can realize accurate in perspective drawing, create width variable stroke, use lifelike, make full use of paint brush with new Adobe CS Live online service integration. AI CS5 has full control of the width zoom along path variable, and stroke, arrows, dashing and artistic brushes. Without access to multiple tools and panel, can directly on the sketchpad merger, editing and filling shape. AI CS5 can handle a file of most 100 different size, and according to your sketchpad will organize and check them.Here in Adobe Illustrator CS5, for example, briefly introduce the basic function: Adobe IllustratorQuick background layerWhen using Illustrator after making good design, stored in Photoshop opens, if often pattern is in a transparent layer, and have no background ground floor. Want to produce background bottom, are generally add a layer, and then executed merge down or flatten, with background ground floor. We are now introducing you a quick method: as long as in diagram level on press the upper right version, choose new layer, the arrow in the model selection and bottom ", "background can quickly produce. However, in Photoshop 5 after the movementmerged into one instruction, select menu on the "new layer is incomplete incomplete background bottom" to finish.Remove overmuch type clothWhen you open the file, version 5 will introduce the Illustrator before Illustrator version created files disused zone not need. In order to remove these don't need in the zone, click on All Swatches palette Swatches icon and then Select the Select clause in the popup menu, and Trash Unused. Click on the icon to remove irrelevant type cloth. Sometimes you must repeat selection and delete processes to ensure that clear palette. Note that complex documents will take a relatively long time doing cleanup.Put the fabric to define the general-screeningIn Illustrator5 secondary color and process color has two distinct advantages compared to establish for easy: they provide HuaGan tonal; And when you edit the general-screening prescription, be filled some of special color objects will be automatically updated into to the new color. Because process color won't let you build tonal and provides automatic updates, you may want to put all the fabric is defined as the general-screening. But to confirm Illustrator, when you are in QuarkXPress or when PageMaker quaclrochramatic must keep their into process of color.Preferred using CMYKBecause of Illustrator7 can let you to CMYK, RGB and HSB (hue, saturation, bright) color mode, so you want to establish color the creation of carefully, you can now contains the draft with the combination of these modes created objects. When you do, they may have output various kinds of unexpected things will happen. Printing output file should use CMYK; Only if you don't use screen display manuscript RGB. If your creation draft will also be used for printing and screen display, firstly with CMYK create printing output file, then use to copy it brings As ordered the copy and modify to the appropriate color mode.Information source:" Baidu encyclopedia "附录二中文译文Illustrator软件与Photoshop软件的区别Photoshop与Illustrator都是由Adobe公司出品的,而作为大家都比较熟悉的Photoshop软件,集图像扫描、编辑修改、图像制作、广告创意,图像输入与输出于一体的图形图像处理软件,深受广大平面设计人员和电脑美术爱好者的喜爱。