安捷伦公司--如何进行保留时间锁定
(精选文档)安捷伦_7890A气相色谱仪使用说明书
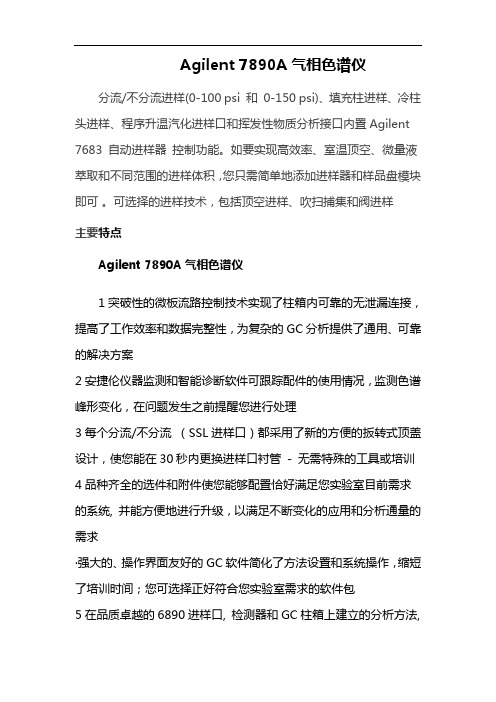
Agilent 7890A气相色谱仪分流/不分流进样(0-100 psi 和 0-150 psi)、填充柱进样、冷柱头进样、程序升温汽化进样口和挥发性物质分析接口内置的 Agilent 7683 自动进样器控制功能。
如要实现高效率、室温顶空、微量液萃取和不同范围的进样体积,您只需简单地添加进样器和样品盘模块即可可选择的进样技术,包括顶空进样、吹扫捕集和阀进样主要特点Agilent 7890A气相色谱仪1突破性的微板流路控制技术实现了柱箱内可靠的无泄漏连接,提高了工作效率和数据完整性,为复杂的GC分析提供了通用、可靠的解决方案2安捷伦仪器监测和智能诊断软件可跟踪配件的使用情况,监测色谱峰形变化,在问题发生之前提醒您进行处理3每个分流/不分流(SSL进样口)都采用了新的方便的扳转式顶盖设计,使您能在30秒内更换进样口衬管 - 无需特殊的工具或培训4品种齐全的选件和附件使您能够配置恰好满足您实验室目前需求的系统, 并能方便地进行升级,以满足不断变化的应用和分析通量的需求²强大的、操作界面友好的GC软件简化了方法设置和系统操作,缩短了培训时间;您可选择正好符合您实验室需求的软件包5在品质卓越的6890进样口, 检测器和GC柱箱上建立的分析方法, 您可以完全放心地将其转移到7890A GC上6其它功能和详细信息请参看仪器样本和资料库中的技术规格文件7填充柱进样、冷柱头进样、程序升温汽化进样口和挥发性物质分析接口内置的 Agilent 7683 自动进样器控制功能进样口两个进样口三个检测器(第三个检测器是TCD)四个检测器信号柱温箱最大升温速率:120°C/min(如使用120 V 电源最大升温速率75°C/min,参见表1)。
•最长运行时间: 999.99 min(16.7 h)。
•柱箱冷却降温( 22°C 室温),从450°C 到50°C 需要4.0 min (采用柱箱插入附件时为3.5 min)电子压力控制范围:0 到100 psig每个EPC单元都使用专用的进样口和检测器选项进行了优化。
安捷伦Intuvo 9000气相色谱仪产品说明书
Agilent Intuvo 9000 气相色谱仪Agilent Intuvo 9000 气相色谱仪是来自气相色谱技术创新先锋的新一代气相色谱。
Intuvo 以令人惊叹的全新方式实现气相色谱分析,开辟了一条全面提高效率的新途径。
Intuvo 为您提供了一系列独特的关键技术:–直接加热,循环时间更短―盘式色谱柱设计–快速可靠的色谱柱更换―快速接头–告别色谱柱切割― Intuvo 芯片式保护柱技术–及时获取关键仪器信息―直观的触摸屏–节省更多实验室空间―台面占用空间仅为传统柱温箱气相色谱仪的一半请访问/chem/intuvo,了解小巧体积中凝聚了多少安捷伦的创新成果。
色谱性能*–保留时间重复性 < 0.008% 或< 0.0008 分钟–峰面积重现性 < 1% RSD系统功能–支持:–进样口:SSL,MMI–检测器:F I D、T C D、E C D、NPD、FPD、SCD/NCD、质谱(单四极杆和三重四极杆)–四种检测器信号–先进的检测器电子元件和全量程的数字化数据输出能够在一次运行中对检测器整个浓度范围内(FID 为 107)的峰进行定量分析–对所有进样口和检测器实现全面 EPC 控制。
控制范围和分离度针对特定进样口或检测器模块进行了优化–压力设定值和控制精度达 0.001 psi,为低压应用提供了更高的保留时间锁定精度–EPC 支持四种色谱柱流量控制模式:恒定压力、梯度压力(三个梯度)、恒定流速或梯度流速(三个梯度)。
计算色谱柱平均线速度–标配大气压和温度补偿功能,即使实验室环境改变,分析结果也保持不变–用户可在每次运行中启动自动泄漏检查,也可以在维护或诊断工作中随时运行。
检测到泄漏时系统将提醒用户,以便立即采取措施进行纠正并大幅缩短停机时间–每次分析均生成运行时间偏差日志,以确保所有方法参数有效并且稳定–自动液体进样被全面集成到 GC 控制中–所有 GC 和 ALS 设定值均显示在 GC或数据系统中–彩色触摸屏界面内置了上下文相关的帮助功能–网页界面可用于查看状态、用户信息并监控运行气相色谱彩色触摸屏界面提供英语、中文和日语版本柱温箱–最多可容纳两根 30 m × 0.320 mm 内径毛细管柱或一根 60 m × 0.320 mm内径毛细管柱–支持内径 0.150 mm 至 0.320 mm 的色谱柱–操作温度范围适用于所有色谱柱和色谱分离应用。
安捷伦7890A操作规程
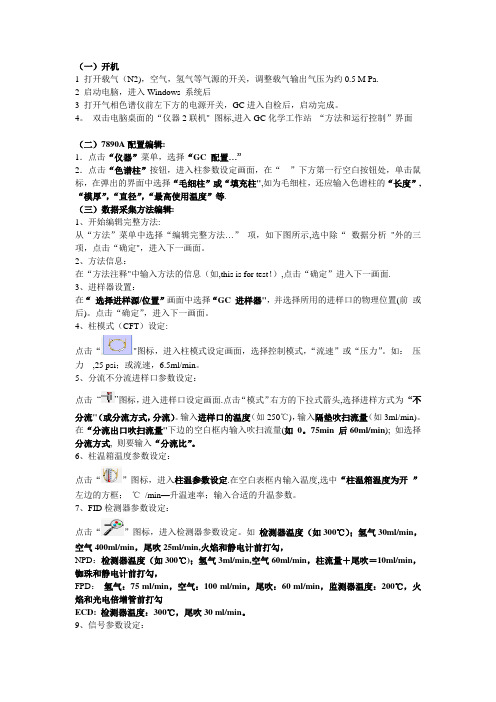
(一)开机1 打开载气(N2),空气,氢气等气源的开关,调整载气输出气压为约0.5 M Pa.2 启动电脑,进入Windows 系统后3 打开气相色谱仪前左下方的电源开关,GC进入自检后,启动完成。
4。
双击电脑桌面的“仪器2联机" 图标,进入GC化学工作站“方法和运行控制”界面(二)7890A配置编辑:1.点击“仪器”菜单,选择“GC 配置…”2.点击“色谱柱”按钮,进入柱参数设定画面,在“”下方第一行空白按钮处,单击鼠标,在弹出的界面中选择“毛细柱”或“填充柱",如为毛细柱,还应输入色谱柱的“长度”,“模厚”,“直径”,“最高使用温度”等.(三)数据采集方法编辑:1、开始编辑完整方法:从“方法”菜单中选择“编辑完整方法…”项,如下图所示,选中除“数据分析"外的三项,点击“确定",进入下一画面。
2、方法信息:在“方法注释"中输入方法的信息(如,this is for test!),点击“确定”进入下一画面.3、进样器设置:在“选择进样源/位置”画面中选择“GC 进样器",并选择所用的进样口的物理位置(前或后)。
点击“确定”,进入下一画面。
4、柱模式(CFT)设定:点击“"图标,进入柱模式设定画面,选择控制模式,“流速”或“压力”。
如:压力,25 psi;或流速,6.5ml/min。
5、分流不分流进样口参数设定:点击“”图标,进入进样口设定画面.点击“模式”右方的下拉式箭头,选择进样方式为“不分流"(或分流方式,分流)。
输入进样口的温度(如250℃),输入隔垫吹扫流量(如3ml/min)。
在“分流出口吹扫流量"下边的空白框内输入吹扫流量(如0。
75min 后60ml/min); 如选择分流方式, 则要输入“分流比”。
6、柱温箱温度参数设定:点击“”图标,进入柱温参数设定.在空白表框内输入温度,选中“柱温箱温度为开”左边的方框;℃/min—升温速率;输入合适的升温参数。
安捷伦气相色谱历史介绍
安捷伦气相色谱历史介绍
安捷伦气相色谱(Agilent Gas Chromatography)是一种用于食品科学技术、环境科学技术及资源科学技术领域的分析仪器。
安捷伦公司(Agilent Technologies)作为全球领先的测量仪器制造商,致力于为客户提供创新的技术和服务。
安捷伦气相色谱仪在2008年12月11日正式启用。
安捷伦气相色谱仪具有高质量设计和可靠性,其先进功能可帮助用户在更短的时间内获得更多的分析结果。
安捷伦气相色谱仪在食品、环境、资源等多个领域得到了广泛的应用,成为许多实验室的重要分析工具。
安捷伦气相色谱仪的系统性能非常出色,支持同时安装两个进样口、三个检测器(第三个检测器是TCD),并具有四个检测器信号。
先进的检测器电子线路和全量程的数字化数据输出,使得一次进样中可以对检测器的整个浓度范围的峰实现定量分析。
所有的进样口和检测器使用EPC,对特殊的进样口和检测器部件的控制范围和分离性能进行了优化。
此外,安捷伦气相色谱仪还可以安装多达六个EPC模块,提供多达16个通道的EPC控制。
压力设定值和控制精度达到0.001psi,对于低压力的分析提供了保留时间锁定。
用于毛细管柱的EPC具有四种色谱柱流量控制模式:恒压模式和梯度压力(三阶梯度)模式,恒流模式或梯度流量(三阶梯度)模式。
可计算色谱柱的平均线流速。
安捷伦气相色谱仪在技术上的不断创新和优化,使其在气相色谱领域一直保持着领先地位。
以上就是安捷伦气相色谱历史介绍。
安捷伦1100使用步骤
Agilent 1100型高效液相色谱仪操作规程1. 开机1.1开机前准备:流动相使用前必须过0.45μm的滤膜(有机相的流动相必须为色谱纯;水相必须用新鲜注射用水,不能使用超过3天的注射用水,以防止长菌或长藻类);把流动相放入溶剂瓶中。
A瓶[棕色瓶]:为水相;B瓶:为有机相。
超声去除瓶内液体中气泡。
1.2打开电脑,进入Windows XP界面。
1.3从上到下打开液相各部件电源开关。
1.4在打开液相主机电源5分钟内双击桌面“联机”图标,仪器自检,进入工作站。
该页面主要由以下几部分组成:——最上方为命令栏,依次为“文件、运行控制、仪器……”等;——命令栏下方为快捷操作图标,如多个样品连续进行分析、单个样品进样分析、调用文件保存文件……等;——中部为工作站各部件的工作流程示意图;依次为进样器-输液泵-柱温箱-检测器-数据处理-报告;——中下部为动态监测信号;——右下部为色谱工作参数:进样体积、流速、分析停止时间、流动相比例、柱温、检测波长等。
1.5从“视图”菜单中选择“方法和运行控制”画面。
2. 编辑参数及方法2.1开始编辑完整方法:从“方法”菜单中选择DEF-LC.M,再从“方法”菜单中选择“编辑完整方法”,选择方法信息、仪器参数及收集参数、数据分析参数和运行时间表等各项,单击OK,进入下一画面。
2.2方法信息:在“方法注释”中加入方法的信息,如方法的用途等。
单击OK,进入下一画面。
2.3泵参数设定:进入“泵参数”画面,在“流量”处输入流量,如1.0mL/min;在“溶剂B”处输入有机相的比例如70.0,(A=100-B),也可在“插入”一行“时间表”,编辑梯度;输入保留时间;在“最大压力限”处输入柱子的最大耐高压,以保护柱子。
单击OK,进入下一画面。
2.4 DAD检测器参数设定:进入“DAD信号”画面,输入样品波长及其带宽、参比波长及其带宽(参比波长带宽默认值为100nm);选择“停止时间”输入相应的停止分析时间;在“光谱范围”中输入采集光谱方式“store”:选All;如只进行正常检测,则可选None;“范围”:可选范围为190~950nm;“步长”可选2.0nm;阀值:选择需要的灯;“峰宽”(响应时间)即响应值应尽可能接近要测的窄峰峰宽,可选“2s”或4s;Slit-:狭窄缝,光谱分辨率高;宽时,噪音低。
安捷伦GCMS 介绍
降低操作和维 修费用
“Backflush will save source cleaning on MSD, keep column cleaner, save time.” – USA (Forensics)
“R&D could use time savings, but less maintenance is more important.” - Japan (Food)
Peak #1 * RT (min) 9.0835 9.0835 9.0841 9.0846 9.0851 9.0849 9.0845 9.0849 9.0847 9.0853 9.0852 9.0851 9.0847 9.0848 9.0853
Ave Std Dev
9.0847 0.000527
* 两次不同切割
HP Founder: David Packard, 1972
Page 8
7890A GC Flexibility March, 2007
EPC 模块
6890N
7890A
Page 9ຫໍສະໝຸດ 7890A GC Flexibility March, 2007
1/1000 psi 压力调节精度!
-- 更好的实现保留时间锁定 (RTL)
可靠的性能
40年来安捷伦用户所期待的技 术和创新在7890A和5975C平 台上继续得到了体现
Page 5
LSCA Fast RGA 30 Jan, 2007
电子压力控制模块的发展 (EPC)
第一,二代 EPC -- 0.1 psi --复杂线路连接 -- 管线气体接口繁多 -- 相对较大体积
5890 GC
6.58 6.59 6.60 6.61 6.62 6.63
安捷伦 7000C GC MS MS 质谱仪说明书
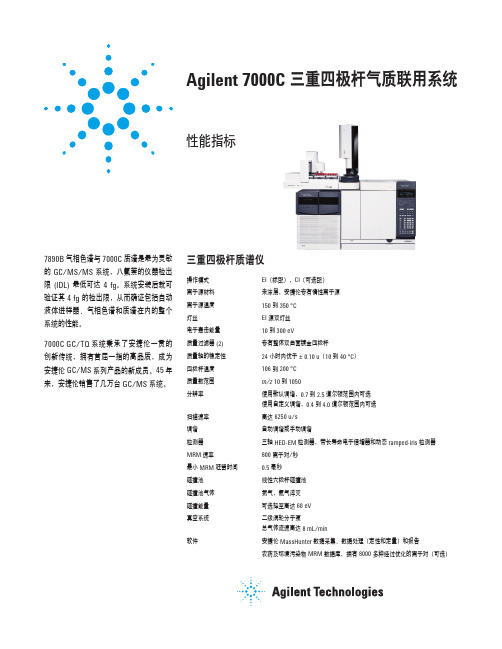
Agilent 7000C 三重四极杆气质联用系统7890B 气相色谱与7000C 质谱是最为灵敏的GC/MS/MS 系统,八氟萘的仪器检出限(IDL) 最低可达4 fg。
系统安装后就可验证其4 fg 的检出限,从而确证包括自动液体进样器、气相色谱和质谱在内的整个系统的性能。
7000C GC/TQ系统秉承了安捷伦一贯的创新传统,拥有首屈一指的高品质,成为安捷伦GC/MS系列产品的新成员。
45年来,安捷伦销售了几万台GC/MS 系统。
性能指标三重四极杆质谱仪操作模式EI(标配),CI(可选配)离子源材料未涂层,安捷伦专有惰性离子源离子源温度150 到350°C灯丝EI 源双灯丝电子轰击能量10 到300 eV质量过滤器(2)专有整体双曲面镀金四极杆质量轴的稳定性24 小时内优于± 0.10 u(10 到40°C)四极杆温度106 到200 °C质量数范围m/z 10 到1050分辨率使用默认调谐,0.7 到2.5 道尔顿范围内可选使用自定义调谐,0.4 到4.0 道尔顿范围内可选扫描速率高达6250 u/s调谐自动调谐或手动调谐检测器三轴HED-EM 检测器,带长寿命电子倍增器和动态ramped-iris 检测器MRM 速率800 离子对/秒最小MRM 驻留时间0.5 毫秒碰撞池线性六极杆碰撞池碰撞池气体氮气,氦气淬灭碰撞能量可选择至高达60 eV真空系统二级涡轮分子泵总气体流速高达8 mL/min软件安捷伦MassHunter 数据采集、数据处理(定性和定量)和报告农药及环境污染物MRM 数据库,拥有8000多种经过优化的离子对(可选)/chem/cn安捷伦对本资料可能存在的错误或由于提供、展示或使用本资料所造成的间接损失不承担任何责任。
本文中的信息、说明和技术指标如有变更,恕不另行通知。
© 安捷伦科技(中国)有限公司,2013中国印刷2013 年8 月20日5991-2972CHCN 安装验收技术指标仪器检出限(IDL)比信噪比(S/N)更能准确衡量仪器的真实灵敏度(最低检测量),尤其是只使用标样对MS/MS进行检测背景噪音非常低的情况下。
安捷伦7890A气相色谱仪使用说明书

Agilent 7890A气相色谱仪分流/不分流进样(0-100 psi 和 0-150 psi)、填充柱进样、冷柱头进样、程序升温汽化进样口和挥发性物质分析接口内置Agilent 7683 自动进样器控制功能。
如要实现高效率、室温顶空、微量液萃取和不同范围的进样体积,您只需简单地添加进样器和样品盘模块即可。
可选择的进样技术,包括顶空进样、吹扫捕集和阀进样主要特点Agilent 7890A气相色谱仪1突破性的微板流路控制技术实现了柱箱内可靠的无泄漏连接,提高了工作效率和数据完整性,为复杂的GC分析提供了通用、可靠的解决方案2安捷伦仪器监测和智能诊断软件可跟踪配件的使用情况,监测色谱峰形变化,在问题发生之前提醒您进行处理3每个分流/不分流(SSL进样口)都采用了新的方便的扳转式顶盖设计,使您能在30秒内更换进样口衬管 - 无需特殊的工具或培训4品种齐全的选件和附件使您能够配置恰好满足您实验室目前需求的系统, 并能方便地进行升级,以满足不断变化的应用和分析通量的需求·强大的、操作界面友好的GC软件简化了方法设置和系统操作,缩短了培训时间;您可选择正好符合您实验室需求的软件包5在品质卓越的6890进样口, 检测器和GC柱箱上建立的分析方法,您可以完全放心地将其转移到7890A GC上6其它功能和详细信息请参看仪器样本和资料库中的技术规格文件7填充柱进样、冷柱头进样、程序升温汽化进样口和挥发性物质分析接口内置的Agilent 7683 自动进样器控制功能进样口两个进样口三个检测器(第三个检测器是TCD)四个检测器信号柱温箱最大升温速率:120°C/min(如使用120 V 电源最大升温速率75°C/min,参见表1)。
•最长运行时间: 999.99 min(16.7 h)。
•柱箱冷却降温( 22°C 室温),从450°C 到50°C 需要4.0 min(采用柱箱插入附件时为3.5 min)电子压力控制范围:0 到100 psig每个EPC单元都使用专用的进样口和检测器选项进行了优化。
安捷伦icpmas操作规程
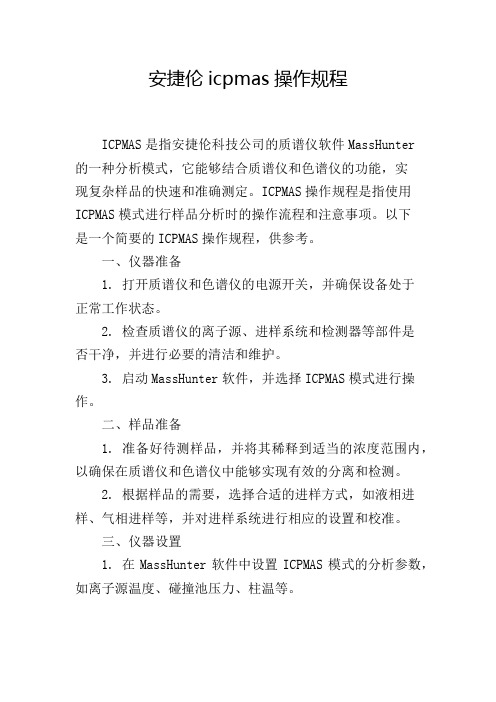
安捷伦icpmas操作规程ICPMAS是指安捷伦科技公司的质谱仪软件MassHunter的一种分析模式,它能够结合质谱仪和色谱仪的功能,实现复杂样品的快速和准确测定。
ICPMAS操作规程是指使用ICPMAS模式进行样品分析时的操作流程和注意事项。
以下是一个简要的ICPMAS操作规程,供参考。
一、仪器准备1. 打开质谱仪和色谱仪的电源开关,并确保设备处于正常工作状态。
2. 检查质谱仪的离子源、进样系统和检测器等部件是否干净,并进行必要的清洁和维护。
3. 启动MassHunter软件,并选择ICPMAS模式进行操作。
二、样品准备1. 准备好待测样品,并将其稀释到适当的浓度范围内,以确保在质谱仪和色谱仪中能够实现有效的分离和检测。
2. 根据样品的需要,选择合适的进样方式,如液相进样、气相进样等,并对进样系统进行相应的设置和校准。
三、仪器设置1. 在MassHunter软件中设置ICPMAS模式的分析参数,如离子源温度、碰撞池压力、柱温等。
2. 配置色谱仪的分离柱和流动相,并进行柱平衡和流动相排气等预处理工作。
四、方法建立1. 根据样品的特点和分析要求,在MassHunter软件中建立相应的方法,包括进样方式、离子源设置、色谱柱温度控制等。
五、仪器调试1. 进行质量控制的检测,如质量校验物质的标定、内标物质的校正等,以确保仪器的稳定和准确性。
2. 调整离子源、碰撞池和雾化气流等参数,以获得最佳的信号强度和质谱峰形。
六、样品分析1. 将样品注入进样器中,并设置相应的进样体积和进样速度。
2. 在MassHunter软件中启动样品分析,并监控离子信号和离子图谱的变化情况。
3. 检查色谱峰形和保留时间的稳定性,以判断分析结果的准确性和可靠性。
七、数据处理1. 使用MassHunter软件对得到的离子图谱进行数据处理和峰面积计算。
2. 针对不同的分析结果,进行数据解释和报告生成。
八、仪器维护1. 在操作结束后,按照仪器的维护要求对质谱仪和色谱仪进行清理和保养。
使用保留时间锁定方法和保留时间锁定数据库分析香精油
6—hexalactone
1—甲基—2,3—cyclohexadione
沉香萜醇
甲基—安息香酸盐
沉香萜醇
9 48.728
二氢黄蒿萜醇 甲基水杨酸盐 草蒿脑 正癸醛 醋酸辛酯
14.750 正癸醛
10 71.366
Anisylproprionate
27.134
朱栾倍半萜
3,4 亚甲二氧苄基(胡椒基)醋酸
峰
GC/FID 保留时间
保留时间确证
GC/MS 保留时间
MS+保留时间确证
1 26.793
α—松萜
5.172
α—松萜
2 30.042
1—辛烯—3—醇(蘑菇醇) 3—methylthio—1—propanol 桧萜
6.181
桧萜
3 30.539
己酸 β—松萜 6—甲基—5—庚烯—2—one
6.282
β—松萜
盐
朱栾倍半萜
GC/FID 方法的另一个例子见图 2,分析印度尼西亚肉豆蔻油。获得一张详细的色谱图。用 保留时间锁定数据库,大部分成分得到确证。例如,67.468min 处的小峰确证为异丁子香酚, 是一个重要的香料化合物。
安捷伦7890B气相色谱仪说明书
成就您对可靠性的追寻成就您对气相色谱技术变革的追寻最新推出 Agilent 7890B 气相色谱仪制造世界上最值得信赖的气相色谱系统一直是我们不断努力的方向。
我们在每个环节都注重提高速度、改善功能并融入新的分析能力,同时永远不会忽略最重要的目标:卓越的分析结果。
如今,安捷伦已将 GC 性能与 GC/MSD 系统的集成提升到了一个新的高度安捷伦全新的 7890B 旗舰气相色谱系统具备您所需要的一切,助您提高分析效率、通过更好的资源管理保护环境、生成可靠性更高的数据。
此外,它与 Agilent 5977A 系列 GC/MSD 之间的直接通信可以加快放空速度,在氢气作载气时有利于保护系统。
的“智能”功能,将气相色谱平台的性能提升到了业界领先的水平久经考验的可靠性满足性能改进的需求安捷伦第五代电子气路控制 (EPC) 和数字电路以及改进的检测器性能,使 Agilent 7890B 气相色谱的可靠性及分析性能达到了前所未有的高度。
更高的样品分析通量快速柱箱降温、新的反吹功能和先进的自动化性能使分析时间更短,使每个样品分析的成本降到最低。
所有这些都能容易地整合到您现有的方法中。
新的集成智能化功能早期维护反馈功能可使您快速更换部件,在小问题导致停机前就加以解决。
内置的计算器和方法转换软件同时也被集成到数据系统软件中,使方法建立和系统运行得以简化。
更重要的是,改进的 GC MSD 间直接通讯将放空时间缩短了高达 40%,并可防止停机事件中由于载气断流对系统造成的 损坏。
扩展的色谱功能灵活的 EPC 设计可进行复杂的分析,可选择第三台检测器(TCD 或 ECD )实现一机多用。
更快速、更直观的软件新的 Agilent OpenLAB CDS 高了 40 倍,并增添了更多工具和向导,助您将结果更快地转变成答案。
第从始至终保护活性化合物安捷伦现已将专有的去活化技术应用到新型分流分流进样口选件、超高惰性衬管柱以及改进的检测器中,从而确保从进样口到检测器的全流路惰性。
安捷伦7890A气相色谱仪使用说明
Agilent 7890A气相色谱仪分流/不分流进样(0-100 psi 和0-150 psi)、填充柱进样、冷柱头进样、程序升温汽化进样口和挥发性物质分析接口内置Agilent 7683 自动进样器控制功能。
如要实现高效率、室温顶空、微量液萃取和不同范围的进样体积,您只需简单地添加进样器和样品盘模块即可。
可选择的进样技术,包括顶空进样、吹扫捕集和阀进样主要特点Agilent 7890A气相色谱仪1突破性的微板流路控制技术实现了柱箱内可靠的无泄漏连接,提高了工作效率和数据完整性,为复杂的GC分析提供了通用、可靠的解决方案2安捷伦仪器监测和智能诊断软件可跟踪配件的使用情况,监测色谱峰形变化,在问题发生之前提醒您进行处理3每个分流/不分流(SSL进样口)都采用了新的方便的扳转式顶盖设计,使您能在30秒内更换进样口衬管- 无需特殊的工具或培训4品种齐全的选件和附件使您能够配置恰好满足您实验室目前需求的系统, 并能方便地进行升级,以满足不断变化的应用和分析通量的需求·强大的、操作界面友好的GC软件简化了方法设置和系统操作,缩短了培训时间;您可选择正好符合您实验室需求的软件包5在品质卓越的6890进样口, 检测器和GC柱箱上建立的分析方法,您可以完全放心地将其转移到7890A GC上6其它功能和详细信息请参看仪器样本和资料库中的技术规格文件7填充柱进样、冷柱头进样、程序升温汽化进样口和挥发性物质分析接口内置的 Agilent 7683 自动进样器控制功能进样口两个进样口三个检测器(第三个检测器是TCD)四个检测器信号柱温箱最大升温速率:120°C/min(如使用120 V 电源最大升温速率75°C/min,参见表1)。
•最长运行时间:999.99 min(16.7 h)。
•柱箱冷却降温(22°C 室温),从450°C 到50°C 需要4.0 min (采用柱箱插入附件时为3.5 min)电子压力控制范围:0 到100 psig每个EPC单元都使用专用的进样口和检测器选项进行了优化。
GC--保留时间、死时间、调整保留时间、分离度、容量因子
保留时间、死时间、调整保留时间、分离度、容量因子
我们在使用色谱仪器时,经常会遇到一些专业术语,很多使用者对它们并不是非常的了解,今天,我们就带大家解读一些常用的色谱术语。
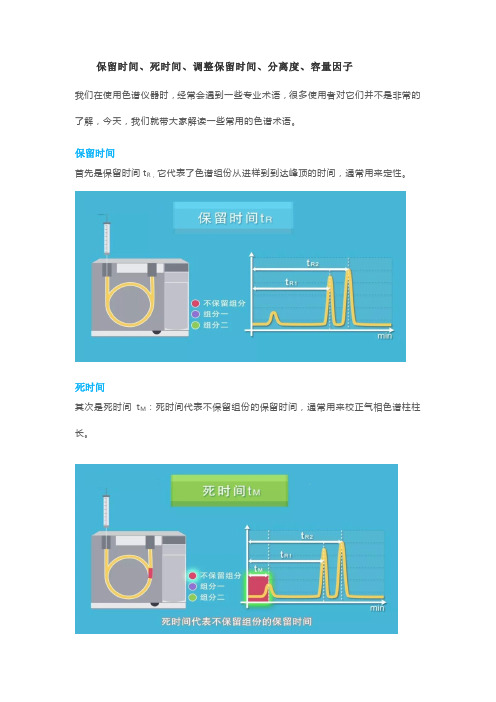
保留时间
首先是保留时间t R,它代表了色谱组份从进样到到达峰顶的时间,通常用来定性。
死时间
其次是死时间t M:死时间代表不保留组份的保留时间,通常用来校正气相色谱柱柱长。
调整保留时间
而调整保留时间t R’指的是保留时间减去死时间
分离度R
分离度R代表两个峰相对其峰宽的分离程度,公式如下:
当R=1时,两个峰的峰面积有5%的重叠,即两个峰的分开程度是95%;
R=1.5时,两个峰的分开程度是99.7%,我们认为此时实现了基线分离;
容量因子k
还有一个术语叫容量因子k,它指的是在一定的温度和压力下,组分在固定相和流动相中分配达到平衡时,分配在固定相和流动相中的质量比, 代表了样品与填料的作用强度。
公式如下:
当k=0时,代表化合物全部存在于流动相中,在固定相中不保留,此时调整保留时间为0;
当k越大,就说明固定相对此组分的容量越大,出柱越慢,保留时间也越长。
安捷伦GC-MS培训总结
安捷伦GC-MS脱产培训总结Aglient GCMS 6890-5975培训期间的学习内容一、GCMS的基础理论简介、Aglient GCMS开机和关机以及仪器调谐:重点1. 理解TIC色谱图上数据点产生的方法:质谱扫描一次就可以得到某时刻的一张质谱图,然后把这张质谱图上所有的峰的绝对丰度之和看作为一个检测值,再对应上这一时刻,就可以得到TIC上一个点。
当把所有时刻的检测值都对时间做图时,就得到了一张完整的TIC。
重点 2.怎样根据实际需要选择不同的调谐方法?如何用调谐文件上的参数判断仪器状态?如何根据质谱峰的状态修改调谐参数,手动调谐使仪器达到检测的最佳状态?GCMS调谐就是调谐MS,调谐的内容主要包括3个部分:A.离子源:调谐离子源就是调整离子源内各部件的电压,包括:推斥极电压(Repeller)、离子聚焦(Ion focus)电压、入口透镜(Entlens)电压、入口透镜补偿(Entoffs)电压,以保证得到良好的检测灵敏度;B.四极杆:调谐四极杆就是调节原子质量单位增溢(Amu gain)和原子质量单位补偿(Amu offset),以得到正确的峰宽;调节质量轴增溢(Mass gain )和质量轴补偿(Mass offset),以保证正确的质量分配;C.检测器:检测器调谐就是调节电子倍增管电压(EM voltage),以保证每个碎片离子的丰度在20-50万,保证检测的灵敏度。
Agilent GCMS 提供的调谐方法:A.自动调谐(ATune):调节仪器使在整个扫描范围内的灵敏度最大,ATune不理会离子的丰度比例关系,所以有时候调谐完会发现和标准谱图有区别,适用于痕量组分或者要求高灵敏度的组分的分析。
ATune方便快速、能提供详细的系统性能诊断信息。
B.标准谱图自动调谐(Standard Spectra AutoTune,STune):在整个扫描范围内标准响应调节,适应于定性分析以及检索商品谱图谱库,如果需要经常检索谱库,最好采用STune。
Agilent 7890A 气相色谱仪说明书
Agilent 7890A 网络化气相色谱仪性能指标安捷伦的专利微板流路控制技术为色谱分析开创了新的篇章,可靠、无泄漏、柱箱内的毛细管连接可以长期承受GC 柱温箱程序升降温往复循环。
7890A GC 具有增强的固件可以扩展微板流路控制的功能,以及增强的数据系统软件可简化设置并操作反吹。
这些新的技术使得复杂基质和未知物的分析更为容易,而且通过二维中心切割、检测器分流和色谱柱反吹为常规分析带来了个更高的工作效率和数据的完整性。
7890A GC 有先进的监控系统资源(计数、电子记录和诊断)的内置功能。
众所周知Agilent GC 系统具有可靠、耐用和寿命长的特点,安捷伦承诺保证仪器使用十年,使仪器在使用期间低成本运行。
系统性能•支持同时安装:- 两个进样口- 三个检测器(第三个检测器是TCD )- 四个检测器信号•先进的检测器电子线路和全量程的数字化数据输出,使得一次进样中可以对检测器的整个浓度范围(FID 为107)的峰实现定量分析。
•所有的进样口和检测器全面使用EPC ,对特殊的进样口和检测器部件的控制范围和分离性能进行了优化。
•可以安装多达六个EPC 模块,提供多达16个通道的EPC 控制。
•压力设定值和控制精度达到0.001 psi ,对于低压力的分析提供了更精确的保留时间锁定。
•用于毛细管柱的EPC 具有四种色谱柱流量控制模式:恒压模式和梯度压力(三阶梯度)模式,恒流模式或梯度流量(三阶梯度)模式。
可计算色谱柱的平均线流速。
•标准化的大气压和温度补偿,即使实验室环境有变化时,检测结果也不会有改变。
2分流/不分流进样口(S/SL)•适用于所有毛细管柱(内径从50 µm 到530 µm)。
•分流比可达7500:1,避免色谱柱超载。
•不分流模式用于痕量分析,压力脉冲不分流模式易于获得最佳的性能。
•最高使用温度:400°C。
•EPC 可在两个压力范围下使用:0 –100 psig(0 至680 kPa),对£ 0.200 mm 直径的色谱柱可获得极好的控制;0 –150 psig 对<0.200 mm直径的色谱柱可获得极好的控制。
安捷伦5973MSD实验室练习保留时间锁定__RTL
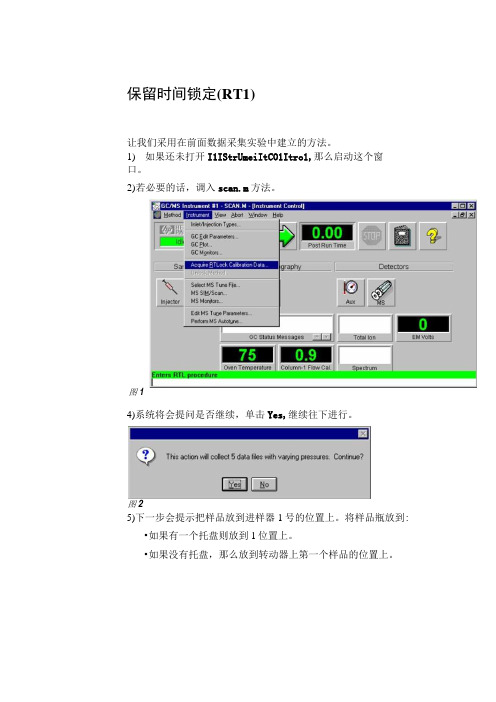
保留时间锁定(RT1)让我们采用在前面数据采集实验中建立的方法。
1) 如果还未打开I1IStrUmeiItCO1Itro1,那么启动这个窗口。
2)若必要的话,调入scan.m方法。
3)选择Instrument/AcquireRT1ockCa1ibrationData图14)系统将会提问是否继续,单击Yes,继续往下进行。
图25)下一步会提示把样品放到进样器1号的位置上。
将样品瓶放到:•如果有一个托盘则放到1位置上。
•如果没有托盘,那么放到转动器上第一个样品的位置上。
Samp1eMUSTbeinposition16)单击OK继续进行。
如果前面有任何保留锁定的数据存在,你会收到警告。
前面的校准会被清除或你可以停止向下进行。
这时系统会自动创建一个5个样品和采集的序列。
在此实验中,大约会用将近1小时的时间。
5个数据文件会保存在方法目录中(在此例中为scan.m),此目录在名为RT1oCK的文件夹下,文件夹中有RT10CK1-RT10CK5五个文件名。
随数据收集,开始新的一段数据分析,并且调用常规运行(没有压力变化),所以可以执行数据评估和锁定设定的实际过程。
图47)注意窗口底部的命令行,提示你通过“integrating”峰来定位要锁定的峰。
“Integrate”第三个峰,氯联苯。
8)氯联苯峰的保留时间是多少?9)积分后,提示是否在剩余运行中自动搜索同样的峰。
单击Yes。
图5RT1计算压力曲线的修正因子(goodnessfactor)并显示数据。
单击Yes继续完成RT1的设置。
注意:用自动进样器时相关系数会比手动进样器的高一些,这要归功于自动进样器的重现性。
这并不意味着RT1不能或不应该采用手动进样器。
图610)现在出来提示让输入一个名称以识别锁定的化合物。
输入Ch1orobiphenyb单击OK继续进行。
图711)提示你删除5个执行保留时间锁定而自动采集的数据文件。
如果保留该数据,会提示你在再校准压力/保留时间曲线时清除它们。
安捷伦气相色谱仪8860操作规程
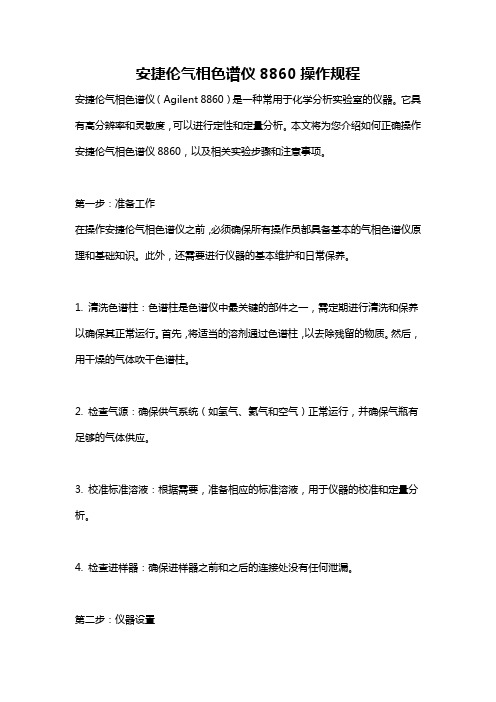
安捷伦气相色谱仪8860操作规程安捷伦气相色谱仪(Agilent 8860)是一种常用于化学分析实验室的仪器。
它具有高分辨率和灵敏度,可以进行定性和定量分析。
本文将为您介绍如何正确操作安捷伦气相色谱仪8860,以及相关实验步骤和注意事项。
第一步:准备工作在操作安捷伦气相色谱仪之前,必须确保所有操作员都具备基本的气相色谱仪原理和基础知识。
此外,还需要进行仪器的基本维护和日常保养。
1. 清洗色谱柱:色谱柱是色谱仪中最关键的部件之一,需定期进行清洗和保养以确保其正常运行。
首先,将适当的溶剂通过色谱柱,以去除残留的物质。
然后,用干燥的气体吹干色谱柱。
2. 检查气源:确保供气系统(如氢气、氦气和空气)正常运行,并确保气瓶有足够的气体供应。
3. 校准标准溶液:根据需要,准备相应的标准溶液,用于仪器的校准和定量分析。
4. 检查进样器:确保进样器之前和之后的连接处没有任何泄漏。
第二步:仪器设置在进行任何实验之前,必须进行仪器设置和调整。
下面是一些关键设置步骤。
1. 仪器开机:按下仪器的电源按钮,等待仪器自检完成并运行到待机状态。
2. 连接计算机:通过串口或网络接口将仪器连接到计算机,并确保与色谱数据处理软件的通信正常。
3. 设置温度:根据实验要求,设置色谱柱和进样器的温度。
注意,不同的样品和分析方法可能需要不同的温度条件。
4. 设置流速:调整气体的流速,以确保样品在色谱柱中的适当保留时间。
这可以通过调整流量计或气体压力来实现。
5. 校准仪器:使用已知浓度的标准样品进行仪器的校准。
这可以通过进样已知浓度的标准溶液并测量峰面积来完成。
第三步:样品处理和进样在进行样品分析之前,需要对样品进行适当的处理和准备。
1. 样品准备:根据实验要求,采用适当的方法对样品进行提取、纯化或预处理。
这可以包括固相萃取、液液萃取或其他样品处理方法。
2. 进样方式:根据样品类型和目标分析,选择适当的进样方式。
进样可以是液体进样、气体进样或固体进样。
气相色谱-质谱联用仪检测农残时化合物保留时间的确定
2.1 使用总离子流图(TIC)确定保留时间 对于部分电 离效果好、干扰少的化合物,可以用直接标准储备溶液进
样 ,进 行 全 扫 描 ,得 到 总 离 子 流 图(TIC)确 定 其 保 留 时 间[3]。如特丁硫磷,其总离子流图如图1所示。特丁硫磷
作者简介:周曙光(1989—),男,安徽临泉人,助理工程师,研究方向:农药残留检测。 收稿日期:2020-12-29
114
安徽农学通报,Anhui Agri,Sci,Bull,2021,27(04)
气相色谱-质谱联用仪检测农残时化合物保留时间的确定
周曙光
(阜阳市农产品质量安全监测中心,安徽阜阳 236000)
摘 要:在使用气相色谱-质谱联用仪进行农药残留检测时,首先要确定的是目标化合物的保留时间。对于
部分电离效果好、干扰少的化合物,可以直接用高浓度标准溶液进行全扫描,得到总离子流图(TIC)确定其保
留时间。对于电离效果较差、干扰较大的化合物,可以使用提取离子流图(EIC)或 SIM/MRM 色谱图排除干扰
并确定其保留时间。
关键词:气相色谱-质谱联用;气相色谱-质谱保留时间;农药残留
中图分类号 S481.8
文献标识码 A 文章编号 1007-7731(2021)04-0114-03
Several Methods for Determining the Retention TiMe of CoMpounds when Using Gas ChroMatog⁃ raphy-Mass SpectroMetry to Detect Pesticide Residues
梯度 1
40
120
0
2.5
安捷伦GPC软件培训
Agilent GPC软件 现场培训教材 安捷伦科技有限公司 化学分析仪器部 一. 仪器配置: ? 单元泵 (G1310A)? 在线脱气机 (G1379A )? 自动进样器 (G1313A )? 柱温箱 (G1316A)? 视差折光检测器 (G1362A)? 化学工作站 (G2170AA, G2182AA)? GPC-SEC 有机相起始套包(PN: 5064-8251) ? GPC-SEC 水相起始套包(PN: 5064-8252)注:如果使用二元泵或四元泵,千万不要使用泵的比例阀进行混合。
在使用二元泵情况下,严格使用100%通道A和0%通道B。
四元泵的连接应使梯度比例阀旁路,这需要一个转换接头(P/N 0100-1847)以便使溶剂直接到达主动阀而不是比例阀。
本培训操作以GPC-SEC 有机相起始套包为例:? 色谱柱:? 安捷伦PLgel Mixed-C, 300 x 7.5 mm, 5 μm (79911GP-MXC) 此 PLgel Mixed-C 色谱柱填料为5 μm 不同孔径的颗粒,因而可以使分子量范围很宽的高聚物得到分离(约200-3,000,000),这样宽的分子量范围一般需要几根(通常2到3根)传统意义上单一孔径的色谱柱串联完成。
另一方面,一根30 cm长混合gel 色谱柱不可能与一套串联色谱柱具有相同的柱效。
因此该混合柱通常用于方法的快速开发,其优化需要使用几根混合柱或单一柱串联来完成。
二.样品制备: ? 为节约时间,样品制备和仪器参数的设置最好在前一天的下午来完成,这样可以使日RI检测器和色谱柱有足够的时间平衡过夜。
1. 分别加入1.0 mL THF 到三个含有窄标聚苯乙烯标样混合物的小瓶中(红, 蓝和绿)以及一个宽标样品瓶(黄色)中,让其溶解60分钟,每10分钟摇动一次。
在样品加入溶剂后其使用不应超过2天。
2. 通电打开GPC系统各模块。
3. 确认系统在使用 THF时没有盐析出且没有溶剂不互溶的现象,否则用水或过渡溶剂异丙醇充分冲洗系统。
- 1、下载文档前请自行甄别文档内容的完整性,平台不提供额外的编辑、内容补充、找答案等附加服务。
- 2、"仅部分预览"的文档,不可在线预览部分如存在完整性等问题,可反馈申请退款(可完整预览的文档不适用该条件!)。
- 3、如文档侵犯您的权益,请联系客服反馈,我们会尽快为您处理(人工客服工作时间:9:00-18:30)。
AuthorMichael J. Szelewski, Kenneth R. Weiner, and Chin-Kai Meng Agilent Technologies, Inc.2850 Centerville RoadWilmington, Delaware 19808-1610USA IntroductionThe techniques of Retention Time Locking (RTL)[1], Target Compound Screening [2], and Deconvo-lution Reporting [3] all use retention times (RTs)for an additional level of compound confirmation.It is important that for maximum productivity and quality, RTs are constant/reproducible and embed-ded in mass spectral libraries [4]. However, not all compounds are in a commercially available mass spectral library, and most mass spectral libraries do not have RTs.This technical overview describes building andediting (for example, adding compounds) thefollowing:RTL Screener databases, RTL Quant databases, and Mass Spectral Libraries. These tasks are accom-plished using the GC/MSD ChemStation software and Microsoft Excel. RTL Quant databases andMass Spectral Libraries can also be used with Agilent's Deconvolution Reporting Software [3].Building and Editing RTL Screener/Quant Databases and Libraries Technical OverviewSoftware Requirements •GC/MSD revision D.01.01 (D.01.00 sp1) or higher •Microsoft ExcelFile Locations (File types: *.d, *.l, *.scd,and *.tab)•Data files (*.d) in C:\MSDchem\1\data\•Library files (*.l) in C:\Database\•Screener database files (*.scd) in C:\Database •TAB-delimited files (*.tab) in C:\Database2The columns B, C, D, E, F, and I are required. All other columns are left blank. Use one compound per row. See the example below: Note the first two lines (and only two lines) are for comment and header information.* Not used for original library creation.32.Make sure you save the spreadsheet file in .tab format in the Database folder. Go to File|Save as|and choose Text (Tab delimited)(*.txt). Put the file name in quotes with a .tab extension such as “original.tab”. This will save in a tab-delimited format with a .tab extension.3.Click Yes to keep the format.4.CLOSE the Excel file, otherwise you will get an error message (Could not open file: C:\database\original.tab) from MSD ChemStation.5.Click No .46.Go to Enhanced Data Analysis. On the com-mand line type rtl_import and then click Execute .7.Select Library only , click OK.8.You will be prompted for a file to select from the Database folder. Select the .tab you want,click Open.(The screener database can also be generated at the same time by selecting the “Library and SCD”option as seen in a later section.)9.Give the library a name (maximum eight char-acters), such as oxymix.L and click OK.Enhanced DA will call each of the files in Column Iof your .tab file. It will then go to the RT you speci-fied in Column F and create a Library entry usingthat spectrum and the information from ColumnsB, D, and E. You should see chromatograms flash-ing before your eyes. If you fill in column H of the*.tab file, you will get a .sav directory when thelibrary is built.The following screen shows the new library,Oxymix.L, the oxymix.tab file, and the .savdirectory.56What is the .sav directory? The .sav is a folder cre-ated in Database folder when you create a Library from a .tab. The .sav folder contains one .sav file for each entry in the Library you just created.Each .sav file contains the spectrum of the Library entry. The .sav file name is taken from Column H.If Column H is left blank you will get no usable .sav files. You can rebuild the Library using the .sav files if you lost the original data files. In the dia-logue box where you entered the Library name when you first created it, there is a “more” button.Clicking “more” gives you a field to specify whether you're using original data or .sav files.List the Content of a Library (*.l)1.After the library is built, type listlib on thecommand line and then click Execute .72.Choose the library name you just created then click OK.3.Click Noto the detailed graphics question.If all went well you will see a list of your libraryentries, compound names, MW, CAS, etc.If you see only a few lines of text at the top, the library was not built properly. Go back and follow the build-a-library steps again carefully, especially entering the correct datafile name and the data path in column I of the .tab file.8Create an SCD and a Library From a .tab FileThe best way to create an .scd is to create it when you create the Library. Do ALMOST exactly what you did to create a Library in the previous section.1.After you execute the rtl_import command,select “Library and SCD”.2.Click Yes . An .scd will be created with the same name you give the library.The largest ion will be the target ion, and then the next three largest ions will be the qualifiers.Uncertainty percent will be globally set to 20. Uncertainty type will be globally set to 0=relative.3.From the Tools menu item, select “List Screen…”.Database4.You will see a listing of your .scd. Select the .scdyou just created.9105.Close the window.The macro that does the .scd listing also creates a .tab file (in the c:\database folder) with the same name as the .scd. In this case, you will have oxymix.scd and oxymix.tab.6.Go into Excel and open the .tab file(oxymix.tab) of the same name as the .scd you just listed. Click Finish .Now you have a tab file with the proper headers in row 2. This is a .tab of your .scd NOT of your library.This also is NOT the original .tab from which you created the Library and .scd. You will notice the datafile paths (column I) are gone. Columns J-V are filled in. The software has associated each scd entry with a library name (column U) and library entry number (column V). Information depicted in Columns U and V is used for the XCR (cross correlation) on the screener report [2].Add Additional Entries to an Existing LibraryWhen you need to add spectra to an existinglibrary and you have not made changes to the cor-responding .scd file, you can rebuild your libraryand .scd using the procedures described above.Just add the new entries to the original.tab file,sort the RT, and save the file. Then use rtl_importcommand to build the library.If you have made changes to your .scd file, forexample, picked different target/qualifier ions orchanged ion ratios etc., you should follow thesesteps.1.Display the spectrum (preferably averaged overthe width at the half-height of the peak) to beadded to the library. Go to Spectrum | EditLibrary|, and select the library to add thecompound into.11123.Enter the information associated with eachentry. The Retention Index should be filled in with the RT converted to seconds. In this case,it is 4.36 × 60 = 261.62.After the library is chosen, select the “Add New Entry ” option.134.Repeat the steps to add all the entries. In this case, we have added a total of four new entries.5.Go to Enhanced DA and execute a listlib com-mand on the command line to list all the libraryentries.The entry numbers in the above picture (13, 14, 15,and 16) are needed in the .tab file for building the .scd file.Screener DatabaseCreate Only the SCD From Your .tabThis is used with an existing Library you edited (for example, entries added).1.In Excel, open your exisiting oxymix.tab (not original.tab) file for editing.2.Fill in columns B, C, D, E, F, U, and V (column H is optional). You will need to know the existing Library name (enter in column U) and entry number (enter in column V) for each compound.143.Sort the rows using the RT (column F).4.Save the .tab file and close Excel.5.Go to Enhanced DA and execute an rtl_import command on the command line.6.Select “SCD only ” and click OK . You will be prompted to select a .tab file from the Databasefolder.158.Give the scd a name (maximum eight charac-ters), such as oxymix.scd, and click OK.An .scd will be created using the spectra from the library. The largest ion will be the target ion, and then the next three largest ions will be the quali-fiers. Uncertainty percent will be globally set to 20.Uncertainty type will be globally set to 0=relative.Make an ASCII File of the Screener Database The information in a .scd can be saved in ASCII format (text) for sharing or for future reference. 1.From MSD software, enhanced DA, go to Tools | List Screen Database…|. A dialogue box comes up. 2.Choose an existing Screen Database(oxymix.scd) in the Database folder and click Open . You will get a text listing in a MultiVu window. The following graphic shows that the four com-pounds that were added to the library are success-fully added to the screener database in the proper RT order.7.Select the .tab you want and then click Open .16Save the MultiVu window to a file (File|Save as…|), for example, oxymix.txt, to be kept as a record.Edit a *.scd Using a *.tabIf you want to change individual ions, ion ratios,and/or uncertainties etc.e the “List Screener Database…” to generate a .tab file for the .scd to be edited.2.Open the .tab in Excel. Edit existing entries (select a different target ion, change the quali-fier ion ratios etc.). See the example below.Be very careful in columns U and V. Do not change anything in these two columns.3.Save the .tab file, then close Excel.4.Go to Enhanced DA, execute an rtl_importcommand on the command line.5.Select SCD only. The software preserves theedits you have made in the .tab for the .scd.6.Go to Tools | List Screen Databases…|toconfirm the changes.FAQWhen to Use "Set Other (via command)..." Function? Global changes to the *.scd can be made using the menu item1.Tools | Change Screen DatabaseParameters….The following will appear:The Set Other(via command) is used to make global changes not included in the list.For instance, if you want to use a specific Chem-Station Integrator Parameter file for target ion integration:2.Choose Set Other(via command) and click OK.3.Input the ChemStation Integrator Parameterfile you saved, in this case myfile.e, enclosed in quotation marks. 4.Click OK and you will see your currently speci-fied method screen database file updated bywatching the gray message line at the bottom.To update qualifier ion intergration parameter files, repeat the above procedure using q1events$, q2events$ and q3events$ for qualifier ion q1, q2 and q3 respectively.Caution: Global changes made using either one of the preset choices or Set Other will AFFECT ALL COMPOUNDS in the *.scd.How to Use the Integration Parameters with the Screener?The screener is always using the "AutoIntegrate Function" when the ChemStation integrator is selected. Because the "AutoIntegrate Function" does not use any of the events files, none of the integration events will be used in the screening process unless an event file was specified for a compound. The screener does not use the autoint.e parameter file. This file is NOT related to the "AutoIntegrate Function".The screener is integrating extracted ion chro-matograms (EICs), not total ion chromatograms (TIC). Therefore, the screener integration parame-ters should be determined by integrating the EICs. When the optimal parameters are found, save them in an event file (for example, myfile.e).To associate an event file to all the compounds, refer to the discussion above.Does RTE Integrator Use any Parameter File?Yes, the RTE integrator uses rteint.p from your method directory.1.After selecting the RTE integrator, go toChromatogram|MS Signal Integration Para-meter...|to change the integrator parameters.2.Click OK; the parameters are automaticallysaved to rteint.p.The screener will always use rteint.p for integra-tion unless you use Set Other (via command) to select another .p file.Different from the RTE integrator, the ChemSta-tion Integrator always uses the "AutoIntegrate Function" for integration. You have to associate an .e file to the compounds to specify the integration parameters.17How Can I Get the Screener Report to Show Just the Hits and Probable Hits?1.Go to |Quantitate|Report Options...|2.Check the box next to "Omit Target Com-pounds that Are Missed".How Can I Get the Screener Report to Show Just the Hits (x)?1.Go to |Quantitate|Report Options...|2.Check the box next to "Omit Target Com-pounds that Are Missed"and check the boxnext to "Have qualifiers Out of Range".What Does Tools|Exclude Zero Qualifiers Do?You get probable hits (designated by a ?) when one or more of the qualifiers do not meet criteria. Many times a qualifier will not meet criteria because its ion abundance is zero. If the ion abun-dance is zero, the compound probably is not pre-sent. Exclude Zero Qualifiers, when checked, eliminates probable hits from the report if any of the qualifiers is zero.Caution: If a qualifier is small, it could be absent even when the compound is present, so do not use small abundance qualifier ions.Can I Append Entries to the Library Using Excel?If you choose to create a Library only or a Library and SCD after executing the rtl_import command, your Library or Library and SCD will be created from scratch, with all counters set to zero. In other words, Excel .tab files can NOT be used to append Library entries to an existing library nor to edit existing Library entries.How Do I Get Screener Report of a GC Detector on the MS System?There is no GC mode screener report in the MSD DA, but, here is the work-around. After you load the MS and ECD signal into the ChemStation:1.Go to |File|Select Signals...|and uncheck theMS signal.2.Now, select |Tools|Create Screen Results forCurrent File|.This will create a screener report for the GC data and save the report to RTLPEST(2).RES. (Depend-ing on the pesticide library revision, you may or may not get the 2 in the file name.) 3.To generate a "pseudo" GC screener report, goback to |File|Select Signals...|and check the MS signal. Use |Tools|Generate ScreenerReport for Current File|to get a report.Note: The GC and MS screeners use the same RTLPEST.RES file. They overwrite each other when you screen. If you do not uncheck the MS signal, you will screen and then report the MS signal.Screen 0,1,"F"This command, when executed on the command line in Data Analysis View, produces a multipage Screener report for a data file that has already been screened. The first page of the report is a summary report identical to the report fromTools|Generate Screen Report for Current File. Each hit is then reported on a separate page, com-plete with all the graphics you normally see in Results Screener View. This multipage report is sent to the default printer and is not viewable on the monitor.What is "Subtraction Method" and Which Method Should I Use ?The subtraction method that is used is printed near the top of the Screener Report, on the right side. Under Tools | Change Screen Database para-meters, one of the choices is Set Subtraction Method. There are four methods from which to choose:Use Relative Areas- qualifier ion ratios are based on area comparisons to the target ion area. It is NOT recommended to use this method. Small areas may not be integrated or matrix may add signifi-cantly to an area. There is NO subtraction done when using this method.No Subtraction- qualifier ion ratios are based on ion abundances using the spectrum at the apex of the chromatographic peak. This method can be used if there are no interfering ion abundances from matrix. There is NO subtraction done using this method.Lower of First and Last- qualifier ion ratios are based on ion abundances using the spectrum at the apex of the chromatographic peak MINUS the ion abundances just before the start of the peak or just after the end of the peak. The ion abundances that are subtracted are those that are the lower of either the start or end of the peak. This subtrac-tion method can compensate for ions abundances due to matrix.18Average of First and Last- qualifier ion ratios are based on ion abundances using the spectrum at the apex of the chromatographic peak MINUS the average of the ion abundances just before the start of the peak and just after the end of the peak. This subtraction method can compensate for ion abun-dances due to matrix, and is the recommended subtraction method to use.How Do I Build a Quant Database from a Screener Database?A Quant database is used for quantitating identi-fied compounds and is calibrated. A Screener data-base is used for identifying compounds, without quantitating them. A Quant database (qdb.mth in the mymethod.m folder) has the same format as a Screener database (such as oxymix.scd in the Database directory). To convert a Screener database to a Quant database, do the following: 1.In the method folder, say mymethod.m, locatethe file qdb.mth.2.Rename qdb.mth to qdb.mth.ori(for original).3.Copy your Screener database, say oxymix.scdfrom C:\database, and paste it into yourmethod folder, mymethod.m.4.Rename oxymix.scd(in the mymethod.mfolder) to qdb.mth.5.Reload your method, mymethod.m, inEnhanced Data Anaylsis.6.Select Calibrate>Edit Compounds to view theQuant database.7.Calibrate the Quant database as you normallywould.What Else Can I Do with my Quant Database and Mass Spectral Library?Agilent introduced Deconvolution Reporting Soft-ware (DRS), product # G1716AA. Application Note 5989-1157EN describes the product, its use and performance in detail. DRS uses the results from Quant databases as part of its report. DRS also uses Mass Spectral Libraries in producing its reports. The DRS Help files provide detailed pro-cedures for converting Agilent format Mass Spec-tral Libraries for use with DRS. So the Quant databases and Libraries you have built using this technical overview have wider application. DRS is a powerful software tool to aid the analyst in find-ing trace compounds in complex matrices for dif-ferent industries, for example, forensic toxicology, food safety, flavor and fragrance (that is, allergens), environmental, and homeland security.Troubleshooting Questions"When I Execute a Listlib Command, I Only See the Header of the Report, No Entries Listed".Make sure the file name and the data path is entered correctly"Could Not Open File: C:\database\oxymix.tab"Close the file in Excel"Array Index 6 Out of Bounds"The TAB file is in Excel (not text tab delimited) format. Re-save the file in tab format."Index Out of Range"There is a mismatch between a library entry number in the *.scd and the library.The library entry with that number does not exist. To find which *.scd entry has the wrong number, screen a sample with the *scd. Go to View|Results Screener. Under the menu item Spectrum, select |Display Reference Spectra. The lower left panel should now display the unknown spectrum above the library reference spectrum for that compound. Double click through the compound list until no library reference spectrum is displayed. This com-pound(s) has an incorrect or missing spectrum in the library.References1.V. Giarocco, B. Quimby, and M. Klee, “RetentionTime Locking: Concepts and Applications”,Agilent Technologies, publication 5966-2469E/chem2.H. Prest, P. Wylie, K. Weiner, and D. Agnew,“Efficient Screening for Pesticides andEndocrine Disrupters Using the 6890/5973GC/MSD System”, Agilent Technologies,publication 5968-4884E/chem3.P. Wylie, M. Szelewski, and C.K. Meng, “Compre-hensive Pesticide Screening by GC/MSD usingDeconvolution Reporting Software”, AgilentTechnologies, publication 5989-1157EN/chem4.K. Weiner and H. Prest, “Retention Time Lock-ing: Creating Custom Retention Time LockedScreener Libraries", Agilent Technologies, pub-lication 5968-8657E /chem19/chemFor More InformationFor more information on our products and services, visit our Web site at /chem.Agilent shall not be liable for errors contained herein or for incidental or consequential damages in connection with the furnishing, performance, or use of this material.Information, descriptions, and specifications in this publication are subject to change without notice.© Agilent Technologies, Inc. 2004Printed in the USAJune 8, 20045989-0916EN。