香港地区社会经济发展统计年鉴指标数据:2.4 按职业划分的就业人数(2013-2018)
香港统计年鉴2020:2.9(续2)按行业主类划分的机构单位数目及就业人数(公务员除外)

Notes :
Figures refer to the end of December of the year.
(1) Establishments in construction sites refer to number of sites, while persons engaged refer to manual workers only.
175 623 326 296 501 919
177 729 330 223 507 952
178 948 338 425 517 373
184 482 343 177 527 659
184 685 355 064 539 749
1 254 931 1 397 127 1 411 295 1 423 171 1 434 524 1 434 863 1 399 829 1 249 719 1 392 077 1 396 721 1 406 599 1 423 376 1 444 452 1 420 173 2 504 650 2 789 204 2 808 016 2 829 770 2 857 900 2 879 315 2 820 002
(2) The industrial coverage is not complete. Figures for the individual industry sections and the total figures relate only to those selected inderly Survey of Employment and Vacancies and the Quarterly Employment Survey of Construction Sites.
香港特别行政区主要年份主要社会经济指标统计(1990-2019)(一)

香港特别行政区主要年份主要社会经济指标统计(1990-2019)(一)
1990年
2000年
2010年
人口
年中人口(万人)
570.4
666.5
702.4
粗出生率(‰)
12.0
8.1
12.6
粗死亡率(‰)
5.2
5.1
6.0
劳动.就业
劳动人口(万人)
274.8
337.4
363.1
劳动人口参与率(%)
63.2
61.4
59.6
失业率(%)
1.3
4.9
4.3
本地生产总值
按2017年环比物量计算①
本地生产总值年增长率(%)
3.8
7.7
6.8
本地生产总值(亿港元)
9876
14551
21687
人均本地生产总值(港元)
173120
218318
308753
按当年价格计算
本地生产总值年增长率(%)
11.7
4.0
7.1
本地生产总值(亿港元)
进口(亿港元)
6425
16580
33648
对外服务贸易②
服务出口(亿港元)
1307
2460
6257
服务进口(亿港元)
1330
3467
5469
国际收支平衡表
经常账户(亿港元)
588
1244
资本及金融账户(亿港元)
-613
-888
净误差及遗漏(亿港元)
25
-355
整体的国际收支(亿港元)
1002
ቤተ መጻሕፍቲ ባይዱ
591
香港社会经济发展统计数据:4.8 以环比物量计算按经济活动划分的本地生产总值(2008-2018)

表4以環T aCha in (in chai經濟E c 200820132014201520162017@農業A g 2,1042,1332,0041,8671,8301,736採m 製造M a 29,32927,83827,72627,30127,18127,299電力E l 35,46335,61935,89534,96734,68234,978自w 廢w 建造C o 73,521105,043118,707125,123131,468129,714服務S e 1,848,5402,135,6742,188,2332,226,1132,276,8152,359,065進出I m 431,646522,889529,323523,575526,604548,636批w 進出I 371,428417,921423,148419,149428,507446,683批發W 61,943104,721105,930104,21298,096101,954住宿A c 73,18881,18783,00481,42581,84283,507f 運輸T r 118,286133,635137,467142,049146,298153,359郵p 運輸T 111,382125,314129,019134,131138,225144,666郵政P 7,0368,5318,6347,9278,0718,694資訊I n 65,70974,24577,12780,23483,56386,891金融F i 306,198391,839412,725437,765456,262482,191地產R e 241,230255,130260,076261,850269,093274,822及a 地產R e 128,330121,088122,573119,763123,921126,979專業P r 113,939134,223137,664142,089145,175147,843s 公共P u 372,363417,273427,375438,193451,229465,492個p 樓宇O w 248,417256,569258,679260,216261,630264,166產品T a119,68094,619101,000108,18798,389110,698註釋: 以環比物量計算按經濟活動劃分的本地生產總值的參照年,已由2016年重訂為2017年。
香港地区社会经济发展统计年鉴指标数据:9.11 按房屋类型划分的家庭住户数目(2008-2018)

(3) 臨時房屋包括公營臨時房屋及私營臨時房屋。
Notes : Figures are compiled based on data collected in the General Household Survey from January to December of the year concerned as well as the mid-year population estimates.
(2) Figures include private housing blocks, flats built under the Urban Improvement Scheme of the Hong Kong Housing Society, villas/bungalows/modern village houses, simple stone structures and quarters in non-residential buildings. Subsidised sale flats that can be traded in open market are also put under this category.
(1) Subsidised home ownership housing includes flats built under the Home Ownership Scheme, Middle Income Housing Scheme, Private Sector Participation Scheme, Green Form Subsidised Home Ownership Scheme, Buy or Rent Option Scheme and Mortgage Subsidy Scheme, and flats sold under the Tenants Purchase Scheme of the Hong Kong Housing Authority. It also includes flats built under the Flat-for-Sale Scheme, Sandwich Class Housing Scheme and Subsidised Sale Flats Projects of the Hong Kong Housing Society; and flats in Urban Renewal Authority Subsidised Sale Flats Scheme. Subsidised sale flats that can be traded in open market are excluded.
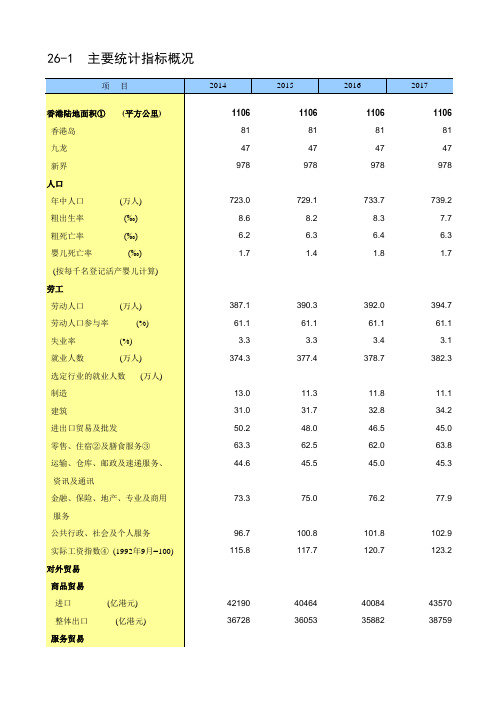
中国统计年鉴2019香港社会经济发展指标:主要统计指标概况

8914#
6353#
3.0
27428 368110
6.8
28429 381544
29845# 400551#
1416#
1219# -1840#
621#
76#
101399# 429335# 327936#
107.0
107.9
106.7
106.5
94.3 11081
1717
81.29 40.90 158.25 280.44
732
79.3
61.7
238
199
11709
5998
5318
72843 71194 144037 101.8
17543 10975
1960
410 6514.8
372465 327023 193632
14651
7409 40434
224603
223#
957595
393#
7334
久性房屋。
⑫数字包括住宅楼宇内用作非住
宅用途的实用楼面面积,例如:会所⑬数字是以相应的财政年度为根
据。
例如2018年的数字代表2018/19⑭2018/19年度的数字有待审计署署长核实。
⑮数字不包括“政府一般收入帐
目及各基金之间的转拨”。
⑯所列数字已包括外币掉期存款。
⑰所列数字已扣除外币掉期存款。
《中华人民共和国香港特别行政区 港元以外的其他货币,因而人民币亦视作外币。
⑱由2012年1月3日起公布的新系
列。
数字是指年内每日电汇或现钞收⑲访港旅客数字包括经澳门访港的非澳门居民。
⑳数字涵盖日、夜校。
中国统计年鉴2013香港按行业划分督导级

行业,包括并没有列出其统计数字的电力及燃气供应业、污水处理及废弃物
ห้องสมุดไป่ตู้
注:指有关年度12月份的数字。由2009年的统计期开始,工资统计数字是按“香港标准行业分类2.0版”编制,其数列已作 2004年3月。
2012
172.8 195.1 166.4 163.2 201.8 199.8 192.7 240.7 187.5
109.6 123.7 105.5 103.5 128.0 126.7 122.2 152.6 118.9
资统计数字是按“香港标准行业分类2.0版”编制,其数列已作出后向估计至
①住宿服务包括酒店、宾馆、旅舍及其他提供短期住宿服务的机构单位。
②指“劳工收入统计调查”内工资统计调查所涵盖的所有行业,包括并没有列出其统计数字的电力及燃气供应业、污水 管理业与出版活动业。 ③实际工资指数是以名义工资指数扣除以2009/10年为基期的甲类消费价格指数而计算出来。
实际工资指数③ 制造 进出口贸易、批发及零售 运输 住宿及餐饮服务活动① 金融及保险活动 地产租赁及保养管理 专业及商业服务 个人服务 所有选定行业② 117.8 121.6 109.8 96.9 125.4 119.3 112.7 138.5 115.3 111.6 119.5 109.0 94.4 125.1 117.9 112.5 135.1 113.5 107.0 120.7 107.1 94.5 123.8 116.3 112.8 136.6 113.5 112.4 124.3 106.9 99.6 125.8 123.3 122.8 146.7 117.9
按行业划分督导级 (不包括经理级与专业雇员)及以下雇员的工资指数
(1992年9月 = 100) 行业主类 2008 2009 2010 2011
香港特别行政区主要年份主要社会经济指标统计(1990-2019)

房屋及物业
已登记物业买卖合约涉及的价值 (亿港元)
住宅
非住宅
总计⑥
楼宇售价指数(1999年=100)
私人住宅单位
44.8
私人写字楼(甲级.乙级及丙级) 99.1
楼宇租金指数(1999年=100)
私人住宅单位
76.7
私人写字楼(甲级.乙级及丙级) 137.3
政府收支.货币.金融(亿港元)
政府储备结余⑦
79
83
87
89
摘编自《中国统计摘要2020》
10975 1960 410 6515 91
10236@ 1830 406@ 5591 79
3.8 9876 173120
7.7 14551 218318
6.8 21687 308753
2.9 27355 367130
-1.2 27030 360042
按当年价格计算 本地生产总值年增长率(%) 本地生产总值(亿港元) 人均本地生产总值(港元)
11.7 5993 105050
4.0 13375 200675
765
政府收入总额⑧
895
政府支出总额⑧
856
货币供应量m3
港元⑨
5712
外币⑩
7168
总计
12880
运输.通讯及旅游
进出香港的货物
总卸下(万吨)
6076
1642 1182 2434 1391
1684 541 2225
89.6 89.9
98.1 98.5
4303 2251 2329
20024 16904 36928
101.7 10815 1824
服务
增加价值(亿港元)
- 1、下载文档前请自行甄别文档内容的完整性,平台不提供额外的编辑、内容补充、找答案等附加服务。
- 2、"仅部分预览"的文档,不可在线预览部分如存在完整性等问题,可反馈申请退款(可完整预览的文档不适用该条件!)。
- 3、如文档侵犯您的权益,请联系客服反馈,我们会尽快为您处理(人工客服工作时间:9:00-18:30)。
類2008年版」編製,其數列已作出後向估計至2011年。 因此,2011年及以後的數字不能直接與較早前的數字
based on the International Standard Classification of Occupations 2008 (ISCO-08) and the series has been backcasted to 2011. Hence, figures for 2011 and onwards are not directly comparable
資料來源: 政府統計處住戶統計分析組
Source : Household Statistics Analysis Section, Census and Statistics Department
索引 Index
千人 Thousand
2008 353.5 254.2 672.2 548.8 550.9 257.5 212.7 654.1
3.6 3 724.0
2014
392.3 278.8 746.7 516.7 629.3 251.5 178.4 746.2
3.7 3 743.5
2015
409.8 303.4 743.8 520.4 621.1 249.4 175.0 747.4
3.5 3 773.8
2016
442.5 287.2 747.8 510.6 619.6 240.0 169.3 766.8
表
按
2T
職Em
a
plo
(A) 按 Bas
職
O
業經
cM
理專
aP
業輔
rA
助文
sC
員服
lS
務工
eC
藝機
rP
台非
lE
技其
lO
他總
tT
計
o
(
aP
業輔
rA
助文
sC
書服
lS
務工
eC
藝機
rP
台非
lE
技其
lO
他總
tT
計
o
2013
375.2 268.8 744.1 512.9 631.9 258.8 182.4 746.3
5.2 3 509.1
千人 Thousand
2018 448.9 304.2 797.7 495.8 620.3 244.9 169.8 782.4
3.0 3 867.0
3.5 3 787.1
2017
462.1 283.5 778.6 496.9 622.7 246.1 170.6 759.3
3.3 3 823.2
註釋: 由2012統計年開始,統計數字是按「國際標準職業分 Notes : Starting from the reference year 2012, the statistics are compiled
比較。
to earlier figures.
數字是根據該年1月至12月進行的「綜合住戶統計調 查」結果,以及年中人口估計數字而編製。
Figures are compiled based on data collected in the General Household Survey from January to December of the year concerned as well as the mid-year population estimates.
