Synchro 5.1进度模拟【官方教程】
ABRSLogix5000软件常用在线功能操作索引
AB RSLogix5000软件常用在线功能操作索引设备维修技术档案系列资料在线工作时,如下一些功能是常用的:一、强制可以如下方法对部分元件进行强制。
1.用翻转命令:1)在左上角强制窗口下,下拉下箭头。
2)选择强制使能“Enable All I/O Forces”。
3)用右键点击需要强制的元件,选择“toggle bit(位翻转)”。
4)每选择一次,状态将翻转一次。
2.用强制标记:1)鼠标左键选择指令。
2)用鼠标右键选择Force on(强制通)及Force off(强制断),做出强制标记。
此法可以对多点进行标记。
3)在左上角强制窗口下,下拉下箭头。
4)选择强制使能“Enable All I/O Forces”。
3.强制失效与删除:1)在左上角强制窗口下,下拉下箭头。
2)选择“Disable All I/O Forces(所有I/O强制失效)。
使强制失效,但强制标记不取消。
3)如果要取消所有强制及标记,在强制窗口下拉命令中,选择对应命令“Remove All I/O Forces(删除所有I/O强制)”。
注意强制后,要适时取消强制操作。
二、搜索1.搜索特定阶梯:1)按Ctrl+G。
2)在弹出的对话框左侧选择Rung(阶梯)。
3)在右侧方框内输入阶梯号。
4)按“Go To”,直接显示到要搜索的阶梯。
2.搜索特定指令:1) 按Ctrl+F 。
2) 在对话框中输入匹配条件。
3) 按“Go To ”。
显示到要搜索的阶梯。
3.搜索已知指令的其它所处位置:1) 光标放在要搜索的指令上。
2) 按鼠标右键。
3) 选择“Go To Cross Reference For …”,双击。
系统会列出所有搜索结果列表。
4) 在搜索结果列表中选择你要的阶梯,双击。
程序切换到对应阶梯。
注意,输出阶梯为OTE 、OTL 、OTU 等。
三、在线编辑可以按照如下过程进行程序的在线编辑。
1. 确认笔记本联机并处于程序在线联机方式。
2. PLC 处于远程/编程方式。
埃夫特 ER 系列机器人 操作手册说明书

2 手册使用 ........................................................................................................................................8
1.3 各工作过程中的安全注意事项 ...............................................................................................12
第 2 章 欢迎使用埃夫特机器人 ........................................................................................................... 20
相关活动的人员,在学习完毕埃夫特公司准备的培训课程前,请勿赋予其
对机器人的操作使用权限。
版本ቤተ መጻሕፍቲ ባይዱ:V 3.3.0.1
1
目录
概 述 ......................................................................................................................................................... 8
和谐万维XONE项目管理系统操作手册

和谐万维X-O N E项目管理系统操作手册深圳和谐万维信息技术有限公司二〇一二年一月二十日编写说明一、编写目的和谐万维X-ONE项目管理软件系统涉及的业务复杂繁多,为了使最终用户能够掌握该软件以及熟悉软件中涉及到的各项业务处理和查询分析,我们特地编写了本说明书,目的是使用户能够尽快的熟练掌握本软件的基本操作,同时能够使用户对涉及到的业务有所熟悉,提高工作效率。
二、面向读者本说明书主要面向和谐万维X-ONE项目管理软件系统的最终用户管理层,以及各相关业务的操作人员、IT系统管理员。
三、特别说明因和谐万维X-ONE项目管理软件系统会不断进行升级,故而此说明书中描述的操作方法并不一定是您当前软件的真实应用方式,目前这本操作手册对应的是软件版本号为如果您应用的软件版本超过此版本号,请向和谐万维咨询,获取相应版本操作说明或变动说明文档。
目录1软件基本介绍 (1)1.1软件的适用范围 (1)1.2软件的基本架构与特点 (1)1.3客户端计算机的运行要求 (1)2软件基础操作 (2)2.1进入系统准备事项 (2)2.1.1关闭IE弹出窗口阻止程序 (2)2.1.2设置信任站点 (2)2.2如何进入系统 (4)2.3系统主页基本情况 (4)2.3.1主菜单区 (5)2.3.2办公区 (5)2.3.3功能操作区 (6)2.3.4自助服务区 (6)3软件功能操作 (7)3.1系统管理子系统 (7)3.1.1组织结构设置; (7)3.1.2系统设置; (11)3.1.3基础设置: (14)3.1.4项目设置 (16)3.1.5财务设置 (17)3.1.6供应链设置 (20)3.1.7往来单位设置 (24)3.2客户关系管理子系统 (29)3.2.1计划管理; (29)3.2.2商机线索; (30)3.2.3方案管理 (32)3.2.4售后管理 (33)3.2.5报表管理 (36)3.3项目管理子系统 (37)3.3.1投标管理 (37)3.3.2合同管理; (43)3.3.3项目计划; (48)3.3.4预算管理: (52)3.3.5任务管理 (53)3.3.6项目统计 (59)3.3.7文档管理 (59)3.3.8问题管理 (61)3.3.9项目报表 (62)3.4供应链管理子系统 (63)3.4.1采购管理; (63)3.4.2销售管理; (66)3.4.3库存管理: (68)3.4.4价格管理 (73)3.4.5期未业务 (74)3.4.6报表管理 (76)3.5财务管理子系统 (77)3.5.1期初管理; (77)3.5.2资金管理; (78)3.5.3费用管理: (88)3.5.4发票管理: (90)3.5.5报表管理 (93)3.6OA管理子系统 (94)3.6.1日常办公; (94)1.1软件的适用范围1、适用于和谐万维X-ONE项目管理软件系统的最终正式用户;1.2软件的基本架构与特点1、软件基于三层B/S架构,服务器端运行于Windows 2000/2003 Server的上,数据库采用ORACLE10g,客户端通过浏览器连接服务器端的Web程序,实现系统的集中管理与部署;2、能够满足以项目方式运作企业的客户、项目、财务、办公、物资、资产等方面管理需要;3、系统是分层次的。
DELTA ASDA-A2系列 高性能通讯型伺服驱动器 应用技术手册

如果您在使用上仍有问题,请咨询经销商或者本公司客服中心。
Revision May, 2011
i
序言ASDA-A2 系列
安全注意事项
ASDA-A2 系列为一高解析开放型(Open type)的伺服驱动器,操作时须安装于屏蔽式的控 制箱内。 本驱动器利用精密的反馈控制及结合高速运算能力的数字信号处理器 (Digital Signal PRocessor, DSP),来控制 IGBT 产生精确的电流输出,用来驱动三相永磁式同步交流伺服 电机(PMSM)以达到精准的定位。 ASDA-A2 系列可使用于工业应用场合上,且建议安装于使用手册中的配线(电)箱环境(驱 动器、线材及电机都必须安装于符合 UL 环境等级 1 的安装环境最低要求规格)。 在接收检验、安装、配线、操作、维护及检查时,应随时注意以下安全注意事项。 标志「危险」、「警告」及「禁止」代表的涵义:
主电路配线
请不要将动力线和信号线从同一管道内穿过,也不要将其绑扎在一起。配线时, 请使动力线和信号线相隔 30 厘米(11.8 英寸)以上。 对于信号线、编码器(PG)反馈线,请使用多股绞合线以及多芯绞合整体屏蔽 线。对于配线长度,信号输入线最长为 3 米(9.84 英尺) ,PG 反馈线最长为 20 米(65.62 英尺) 。 即使关闭电源,伺服驱动器内部仍然可能会滞留高电压,请暂时(10 分钟)不 要触摸电源端子。并请确认「CHARGE」指示灯熄灭以后,再进行检查作业。 请不要频繁地开关电源。如果需要连续开关电源时,请控制在一分钟一次以下。
第三章
3.1
配线
周边装置与主电源回路连接............................................................................ 3-1
示教器操作手册最终版
如何运用simplicity studio5中的例程
Simplicity Studio5是一个集成开发环境(IDE),它提供了许多示例代码和项目模板,可以帮助开发人员快速创建应用程序。
以下是如何运用Simplicity Studio5中的例程的步骤:
1. 打开Simplicity Studio5并选择“File”>“New”>“Project”。
2. 在弹出的窗口中,选择所需的项目类型(例如:Android应用程序、iOS应用程序等)。
3. 点击“Next”按钮,然后选择所需的平台和配置选项。
4. 点击“Finish”按钮以创建新项目。
5. 在解决方案资源管理器中,右键单击“src”文件夹,然后选择“New”>“Folder”,输入文件夹名称(例如:“examples”)并按Enter键。
6. 将Simplicity Studio5提供的示例代码或项目模板复制到新创建的文件夹中。
7. 在解决方案资源管理器中,双击“examples”文件夹下的代码文件或项目文件以打开它们。
8. 根据需要修改代码或项目设置。
9. 点击工具栏上的“Build”按钮(或按F7键)以编译代码。
10. 如果编译成功,点击工具栏上的“Run”按钮(或按F5键)以运行程序。
11. 查看输出窗口以查看程序的输出结果。
交通仿真用synchro课程设计
交通仿真用synchro课程设计一、课程目标知识目标:1. 理解交通仿真的基本概念,掌握Synchro软件的操作流程;2. 学习交通流理论,了解不同交通信号控制方法对交通流的影响;3. 掌握基本的交通数据采集、处理和分析方法。
技能目标:1. 能够运用Synchro软件建立简单的交通仿真模型;2. 学会使用Synchro软件进行交通信号优化,提高交通流效率;3. 培养实际操作中解决问题的能力,包括数据分析、方案设计等。
情感态度价值观目标:1. 培养学生对交通工程领域的兴趣,激发其探索精神;2. 增强学生的团队合作意识,培养沟通、协作能力;3. 提高学生对我国交通事业发展的认识,培养其社会责任感和使命感。
课程性质:本课程为实践性较强的学科课程,结合理论教学与实际操作,旨在提高学生的实际应用能力。
学生特点:学生为高年级本科生,具备一定的专业知识,具有较强的学习能力和动手操作能力。
教学要求:课程要求学生在掌握基本理论知识的基础上,注重实践操作,培养解决实际问题的能力。
教师需关注学生的学习进度,提供个性化指导,确保课程目标的达成。
通过本课程的学习,使学生能够将所学知识应用于实际交通仿真项目中,为我国交通事业发展贡献自己的力量。
二、教学内容1. 交通仿真基本概念:介绍交通仿真的定义、分类及应用场景,使学生了解交通仿真的重要作用。
2. Synchro软件操作:讲解Synchro软件的界面、功能及基本操作方法,指导学生熟练使用软件。
- 软件安装与启动- 界面布局与功能介绍- 建立与编辑交通网络3. 交通流理论:学习交通流的基本参数、流量-密度关系以及交通波理论等,为后续仿真分析奠定基础。
4. 交通信号控制:介绍常见的交通信号控制方法,如定时控制、感应控制等,分析其对交通流的影响。
- 定时控制原理与设置- 感应控制原理与设置5. 数据采集与处理:学习如何采集交通数据,掌握数据处理和分析方法,为优化仿真模型提供支持。
Synchro_6_使用手册
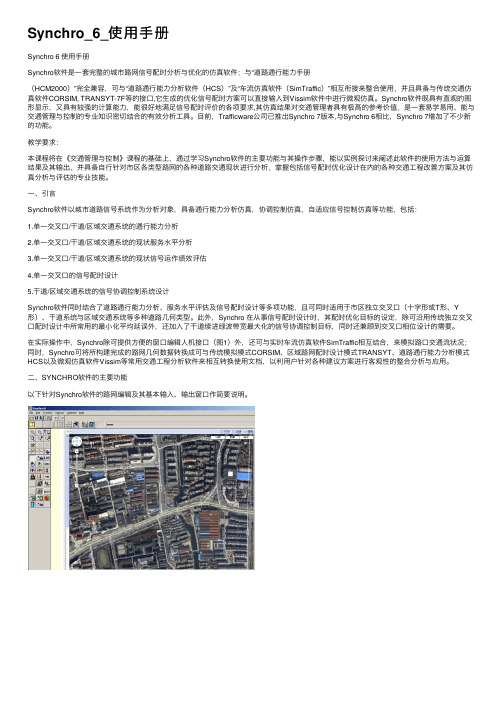
Synchro_6_使⽤⼿册Synchro 6 使⽤⼿册Synchro软件是⼀套完整的城市路⽹信号配时分析与优化的仿真软件;与“道路通⾏能⼒⼿册(HCM2000)”完全兼容,可与“道路通⾏能⼒分析软件(HCS)”及“车流仿真软件(SimTraffic)”相互衔接来整合使⽤,并且具备与传统交通仿真软件CORSIM, TRANSYT-7F等的接⼝,它⽣成的优化信号配时⽅案可以直接输⼊到Vissim软件中进⾏微观仿真。
Synchro软件既具有直观的图形显⽰,⼜具有较强的计算能⼒,能很好地满⾜信号配时评价的各项要求,其仿真结果对交通管理者具有极⾼的参考价值,是⼀套易学易⽤、能与交通管理与控制的专业知识密切结合的有效分析⼯具。
⽬前,Trafficware公司已推出Synchro 7版本,与Synchro 6相⽐,Synchro 7增加了不少新的功能。
教学要求:本课程将在《交通管理与控制》课程的基础上,通过学习Synchro软件的主要功能与其操作步骤,能以实例探讨来阐述此软件的使⽤⽅法与运算结果及其输出,并具备⾃⾏针对市区各类型路⽹的各种道路交通现状进⾏分析,掌握包括信号配时优化设计在内的各种交通⼯程改善⽅案及其仿真分析与评估的专业技能。
⼀、引⾔Synchro软件以城市道路信号系统作为分析对象,具备通⾏能⼒分析仿真,协调控制仿真,⾃适应信号控制仿真等功能,包括:1.单⼀交叉⼝/⼲道/区域交通系统的通⾏能⼒分析2.单⼀交叉⼝/⼲道/区域交通系统的现状服务⽔平分析3.单⼀交叉⼝/⼲道/区域交通系统的现状信号运作绩效评估4.单⼀交叉⼝的信号配时设计5.⼲道/区域交通系统的信号协调控制系统设计Synchro软件同时结合了道路通⾏能⼒分析、服务⽔平评估及信号配时设计等多项功能,且可同时适⽤于市区独⽴交叉⼝(⼗字形或T形、Y 形)、⼲道系统与区域交通系统等多种道路⼏何类型。
此外,Synchro 在从事信号配时设计时,其配时优化⽬标的设定,除可沿⽤传统独⽴交叉⼝配时设计中所常⽤的最⼩化平均延误外,还加⼊了⼲道续进绿波带宽最⼤化的信号协调控制⽬标,同时还兼顾到交叉⼝相位设计的需要。
TMPGEnc Video Mastering Works 5使用教程
TMPGEnc Video Mastering Works 5使用教程概论第一篇开始阶段第一章新建项目第一节以标准模式新建项目第二节以时间线模式新建项目第二章打开已有项目第三章素材编辑第一节素材特性编辑第二节素材剪切编辑第三节素材剪切编辑页面快捷键第四节效果(滤镜)设置第五节素材编辑结束第四章幻灯片制作第一节“静止画面设置”窗口第二节“音频设置”窗口第三节“效果设置”窗口第四节“预览”窗口第二篇编辑阶段第一章标准模式编辑第一节素材列表第二节功能按钮第二章时间线模式第一节进入时间线编辑页面第二节时间线模式编辑第一部分预览区第二部分时间线的构成第三部分素材属性的设置第四部分文本编辑第五部分音频编辑第六部分色彩校正第七部分遮罩第八部分资源管理器和属性第三节时间线编辑页面快捷键第三篇输出阶段第一章输出阶段概论第二章输出格式的设置第一节输出“DVD-Video 用MPEG文件”的设置第二节输出“XDVD规格MPEG文件”的设置第三节输出“VCD用MPEG文件”的设置第四节输出“SVCD用MPEG文件”的设置第五节输出“HDV用MPEG文件”的设置第六节输出“Blu-ray”的设置第七节输出“移动和便携设备用MPEG文件”的设置第八节输出“MPEG文件”的设置第九节输出“MPEG-4(AVC)文件”的设置第十节输出“MKV文件”的设置第十一节输出“AVI文件”的设置第十二节输出“Windows Media视频文件”的设置第十三节输出“Quick Time(MOV)文件”的设置第十四节输出“DivX文件”的设置第十五节输出“连续静止画像文件”的设置第十六节输出“WAVE文件”的设置第十七节输出“MPEG Audio声音文件”的设置第十八节输出“Dolby Digital声音文件”的设置第十九节输出“Windows Media音频文件格式”的设置第二十节输出“AIFF音频文件”的设置第三章输出非标准MPEG文件的设置第一节进入非标准MPEG文件设置页面第二节“视频设置”选项卡窗口第三节类型等级组合第四节“GOP结构”选项卡窗口第五节“量化”选项卡窗口第六节“音频设置”、“详细设置”和“其他”窗口第四篇编码阶段第一章编码预览区第二章功能按钮第三章状态显示区第五篇设置选项第六篇批处理编码工具第七篇高级工具第八篇滤镜的参数设置第一章默认运行的滤镜第一节解除隔行扫描(Deinterlace)第二节视频重置大小(Picture resize)第三节视频速度(Speed)第二章提高视频质量的滤镜第一节视频滤噪(Video denoise)第二节强调轮廓(Contour)第三节色调校正(Color correction)第四节色彩校正(Color phase correction)第五节减轻闪烁(Anti-flickering)第六节重影滤除(Ghost reduction)第七节图像柔化(Gaussian blur)第八节图像锐化(Sharpness)第九节智能锐化(Smart sharpness)第十节视频精确滤噪(Precision video denoise)第三章有关音频质量的滤镜第一节音频滤噪(Audio denoise)第二节音量调节(Volume adjustment)第三节音频淡入/淡出(Audio fade-in/fade-out)第四节双语声道(Bilingual audio)第四章特效滤镜第一节视频旋转(Picture rotation)第二节视频淡入/淡出(Video fade-in/fade-out)第三节马赛克(Mosaic)第四节遮罩(Mask)第五节视频仿旧(Vintage picture)第五章字幕(Subtitles)滤镜第一节文字输入和编辑第二节字幕管理第三节字幕布局设置第六章视频剪裁(Picture crop)滤镜TMPGEnc Video Mastering Works 5使用教程概论TMPGEnc Video Mastering Works 5(以下简称为Tvmw 5)可用于视频文件的编辑、视频格式的转换、视频的视、音频分割与合并。
Synchro使用说明
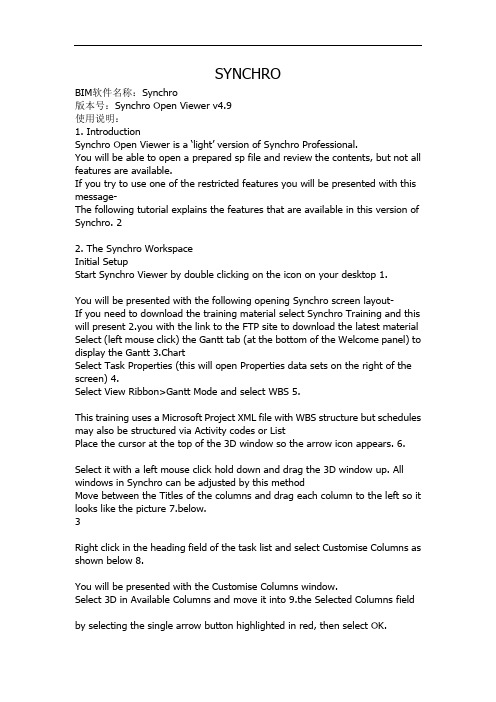
SYNCHROBIM软件名称:Synchro版本号:Synchro Open Viewer v4.9使用说明:1. IntroductionSynchro Open Viewer is a ‘light’ version of Synchro Professional.You will be able to open a prepared sp file and review the contents, but not all features are available.If you try to use one of the restricted features you will be presented with this message-The following tutorial explains the features that are available in this version of Synchro. 22. The Synchro WorkspaceInitial SetupStart Synchro Viewer by double clicking on the icon on your desktop 1.You will be presented with the following opening Synchro screen layout-If you need to download the training material select Synchro Training and this will present 2.you with the link to the FTP site to download the latest material Select (left mouse click) the Gantt tab (at the bottom of the Welcome panel) to display the Gantt 3.ChartSelect Task Properties (this will open Properties data sets on the right of the screen) 4.Select View Ribbon>Gantt Mode and select WBS 5.This training uses a Microsoft Project XML file with WBS structure but schedules may also be structured via Activity codes or ListPlace the cursor at the top of the 3D window so the arrow icon appears. 6. Select it with a left mouse click hold down and drag the 3D window up. All windows in Synchro can be adjusted by this methodMove between the Titles of the columns and drag each column to the left so it looks like the picture 7.below.3Right click in the heading field of the task list and select Customise Columns as shown below 8.You will be presented with the Customise Columns window.Select 3D in Available Columns and move it into 9.the Selected Columns field by selecting the single arrow button highlighted in red, then select OK.This will create an extra column which will show you how many 3D resources have been assigned to each task.NoteYou can rename the column titles if requiredYour workspace should now look like this-Tip: You can always reset your Synchro workspace to its default settings by selecting View Ribbon>Layout> Reset Layout. This also resets other presentation settings at the same time. 43. Screen LayoutThis training course will refer to different windows that you need to be aware of as shown below-Quick Access Toolbar contains commonly used icons (can be customised) Ribbon replaces the old feature ‘Main Menu’ from which you can access the commandsToolbars contain shortcuts and useful commands found in Synchro (can be customised)Gantt Chart window displays the list of Tasks3D View displays the modelled resources at any defined point in time. Navigator tabThe Navigator Window will be docked against the left hand side of the screen and is enabled using the tab towards the bottom of the screenIt contains useable datasets logically grouped by the categories shown above; for example Project details, Task and 3D filters, Viewpoints etc.The tab can be set to Auto Hide so if you hover over the Resource tab you will see the Resource Window appear. If you are using a laptop with one screen it is recommended to set this tab to Auto Hide although you can undock and repostion if required. 5NoteTo Auto Hide any window left click on Auto Hide icon3D Objects tab will be docked against the left hand side of the screen and is enabled using the tab towards the bottom of the screen-when populated this will contain the list of 3D objectsResource tab is located just above the 3D View and will be displayed in ‘Gantt Chart Window’ location initially (Can be relocated)- when populated this will contain the list of Resources. 6Resource Tab RelocationThe Resource tab can remain in the default location in the Main tab area but it is possible to move this to a new location.You can undock it then dock within the Navigator/3D Objects location as shown below1. Left click and hold on the Resources tab2. Keep holding the left mouse button then move the mouse (Resources tab will be undocked) then follow the explanation below.7Task Properties can be displayed by a left click of the mouse on the Task Properties tabTask Properties data sets present the properties of an individual task logically grouped in the categories shown below-Resource Properties can be displayed by a left click of the mouse on the Resource Properties tabResource Properties data sets present the properties of resources logically grouped in the categories shown below-3D Properties can be displayed by a left click of the mouse on the 3D Properties tab3D Properties data sets present the properties of 3D objects logically grouped in the categories shown below-3D Path Editor can be displayed by a left click of the mouse on the 3D Path Editor tab3D Path Editor data sets present the properties of 3D Paths logically grouped in the categories shown below-NoteIf you lose one of these windows (you may accidently hit the ‘X’ by mistake) you can reopen via the Windows Ribbon then select the one you require 8 4. Opening an sp fileOpening a Private Project1. Select File>Open> Private Project, then locate, select Synchro Training Project.sp, then Open2. You will be presented with the Login Window below, Name will be Administrator and the password will remain blank- select OKNote- The purpose of this login is you can set up users with different permissions if required (see Help)If you want to disable this message appearing, check the box for Always use this login on opening Private Projects. You can always change the settings later in Home Ribbon>Options>General>Login to Private ProjectYou will be presented with the following screen-This sp file has a Microsoft Project XML schedule and DWF files imported, resourced and assigned to task activities in the schedule. 95. The Gantt Chart5.1 Gantt Chart Display and manipulationTo manoeuvre within the Gantt chart move the cursor within the Gantt Chart- To PanHold down the middle mouse button then move the mouse up, down, left and right.To ZoomRoll the middle mouse button wheel forward and back to zoom in and out respectively.The Focused Time is indicated by the red dashed line with a triangle symbol on top.Left click and hold in the date field where the red triangle is and move the focus time left and right. This will move the focus time to any point in time in the schedule and reveals the current time below.The Data Date is indicated by a blue vertical dashed line.This defines the project scheduling date for progress reportingWBS Layout colours the summary bars- to modify or disable select Home> WBS Layout-The WBS Layout will be displayed-Here you can:- Enable/disable the WBS Layout- Modify colours/order of LevelsNoteIn Home Ribbon>Options>General you can1. Set Time Display/Format to Short date format and disable Display Time of Day2. Set Duration Display Format to Concise and Days/Hours/Minutes105.2 Gantt View Options1. Select View Ribbon>Gantt Details to display the Gantt Chart as required.2. Disable Show Hidden Link Warnings by left clicking116. 3D View6.1 3D Window NavigationZoom AllWithin the 3D window, right click and select Zoom> Zoom AllOr select 3D Ribbon> Zoom> Zoom AllThis will show all the objects from the front as the models have been created- itcan be used if the view becomes discombobulated.RotateHold down the left mouse button at a point in the 3D View that you want to rotate about, then move the mouseZoomScroll the middle mouse button forward and back to zoom in and out respectivelyPanHold down the middle mouse button and move the mouse left, right, up and down6.2 View CubeThe Axis Indicator that shows the X, Y and Z axis is displayed in the bottom left hand corner of the 3D View(Ensure that axis indicator is enabled by right click in 3D View>Visual Indicators> Axis Indicator)An alternative to the Axis Indicator in the 3D View is the View Cube.This enables the user to manipulate the view via the cubeTo enable-Select 3D from the Ribbon then enable View Cube ManipulatorLeft click on points or faces on the cube and the view will rotate to that viewpoint or hold down the left mouse button on the circle to rotateYou can also change the colour of the background for the selected and other views. 126.3 3D Filters6.3.1 Pre-Set FiltersWith the 3D Sets data set, 3D filters allows you to show or hide elements of the 3D model to make it easier to visualise and work with.Select Navigator> 3D Sets 1.Tick the box next to 3D Object Filter as shown below- 2.In Open Viewer you can change between the pre-set filters. Click on the box next to the name of the 3.filter to enable/disable.6.3.2 Isolate/Hide FiltersIsolate Selected Toggle1. Move the Focus Time to the end of the project so you can see all of the building installed2. In the 3D View hold down the Shift key on your keyboard and select the roof with a left mouse click (selected items turn red)3. In the 3D View right click and select Filters> Isolate Selected ToggleYou will see only that item in the 3D View 134. You can also select the objects in the 3D Objects or Resources tab, or in Navigator>Filters>3D Filter, and the object will be displayed in the 3D window5. Right click in the 3D View and deselect Filters> Isolate Selected Toggle or select Filters>Show All to disableHide Selected Toggle1. Move the Focus Time to the end of the project so you can see all of the building installed2. In the 3D View right click and select Filters> Hide Selected Toggle3. In the 3D View hold down the Shift key on your keyboard and select the roofThat item will be hidden in the 3D ViewYou can also select the objects in the 3D Objects or Resources tab, or in Navigator>Filters>3D Filter, and the object will be hidden in the 3D window 4. Right click in the 3D View and deselect Filters> Hide Selected Toggle or select Filters>Show All to disable147. Reviewing the sp file7.1 Moving the Focus Time1. Move the cursor over the red triangle (in the date area of the Gantt Chart), left click and hold, then move the cursor to the left so the Focus Time moves to the start of the project.You will see that the project in the 3D View has moved to the start-2. Continue to hold the left click and move the cursor to the right and as the focus time moves over the tasks in the schedule you will see the relevant operations occur relative to each task that 3D Resources has been assigned to.When you reach the end of the project in the Gantt Chart you will see- 157.2 Use ProfilesYou will notice that as the Focus Time is moving over each task that the Resources assigned to them will change colour.When 3D Resources are assigned to a task they must use a Use Profile which designates the operation used.In Navigator> Use Profiles you will see 4 predefined options which are used when assigning to tasks. The functions of these are shown in the table below: With the profile highlighted, open the General tabYou will see the colours/transparency for Start Appearance, Active Appearance and End Appearance.If an appearance is not necessary (for example, Install has no Start Appearance), they will be greyed out.You will also see user defined Use Profiles such as Roof Trans etc. 16Tutorial L1 Formatted: Heading2,Article,H2,SubHeading2,b,TSBTWO,Apt2,h2,h,(Alt+2),(Alt+2)1,(Alt+2,Subh eadA,H21,H22,H23,H211,H221,L2,Heading 2-no#,Attribute Heading2,HD2,Heading 2Char1,Heading 2 Char Char,Heading 2 Char1Char,Heading 2 Char Char Char,Heading 2 CharCha7.3 Review and Investigate Assignments7.3.1 Review1. In the 3D View, right click and select Zoom> Zoom All2. Rotate in the 3D window so the road is facing you.3. Drag the Focus Time back to the start and drag along to the right at your own discretion though time.4. From the Ribbon Play select Move to Start5. Select Play6. The speed can be adjusted by selecting from the Play Ribbon>Play Speed then chose an option, for example 1 Week7. Select Stop7.3.2 Select Assigned Resources from a Task1. Move the Focus Time after the task Main Site Clearance [ST00130] as shown below so the initial main site excavation has been removed.2. Select task Excavation 3 [ST00110] from the task list, right click then select Select Assigned ResourceYou will see all the objects assigned to that task are highlighted.3. Left click in the 3D Window then press Escape to cancel all.7.3.3 Select ‘Assigned To’ Tasks from an ObjectSelect one of the excavation objects in the main 3D window, right click then 1.select Display ‘Assigned to’ Task(s)This will automatically find the task to which this object has been assigned 2. Open Task Properties>Resources (right of the screen) and you will see 3.the 3D model resource that is assigned to that task.177.4 Focus Time on TaskYou can move the Focus Time so it is located at the start, centre or end of a task barSelect & highlight a task then select Centre from Task Ribbon>Focus(The Focus time will move directly theof the selected task’s duration)7.5 Focused Time1. Select Windows Ribbon> Focused Time and the following window appears-2. You can then enter a specified time and date you want the Focus Time to move to.3. This window also includes buttons for Play, Stop, Move to Start, etc.7.6 Selecting 3D Items within the 3D WindowWhen you select a 3D item in the 3D window it will change colour to red (or custom defined selection colour in Tools>Options>3D View>Colours)Shift SelectHolding down the shift button on the keyboard and a single left click of the mouse will select an item in the main 3D window. Using shift will continue to pick items and not deselect.Ctrl SelectHolding down Ctrl on the keyboard will work similar to using the Shift selection except it will deselect any item that you pick twice.Navigator ListsYou can highlight the name of the 3D Object/Resource in the 3D Objects or Resources tabs or in Navigator> 3D Sets.Cancelling SelectionIf you left click anywhere within the 3D Window then press Escape on your keyboard the selection will be cancelled. 188. Information BalloonAs you move over the objects in the 3D Window, Synchro will present an Information Balloon in the bottom right hand corner of the 3D Window Move the Focus Time so you can see the excavation taking place (Orange Active colour in the 3D View) then move the cursor in the 3D View so you hover over the excavation object.The information window will appear for a few seconds as shown belowThe Information Balloon displays:- Name of the 3D object- Name of the 3D Resource- The tasks which it is assigned toTo modify the Information Balloon; select Home Ribbon>Options>3D View>Advanced>Information Balloon and you will presented with the following optionsYou can also modify the Output Information to control what is displayed in the Information Balloon.RecommendationsDelay before raising- 0.1 secondsShow duration- 15 secondsTransparency- 0%You can set these options to suit 199. Measure Distance9.1 Measurement settingsFirstly, ensure snapping is enabled. Right click in blue area near the tools and select Snapping 1.(also available in 3D Ribbon).Click the leftmost icon to turn on Snapping. 2.Select Home Ribbon>Options>3D View>Distance Measurement to modifyColour, 3.Projection and Size of Text and ArrowsTo modify the measurement settings select Home Ribbon>Options>3D4.View>Measurement Display allows you to modify the presentation and parameters.The settings below are recommended for this tutorial-Select OK 5.209.2 Measuring9.2.1 Point to PointTo measure the distance between 2 points-In the Snapping toolbar, disable all Snapping types except Snap to Vertex 1. Right click in the 3D View, and select Measure Distance 2.Move the cursor to the end point of an object until a red dot appears 3. Remain over this point a pop up bubble appears with the coordinates of this point from the origin 4.Left click at this point 5.Move the other end. Left click when the red dot appears 6.Zoom out and you will see the measurement 7.You can continue to make other measurements if required.To cancel the measurement-Right click in the 3D View then select Measure Distance again to deactivate 8.2110. Cutting PlanesTo view the predefined Cutting Planes, select 3D Properties>Cutting Planes. You cannot create 1.new Cutting Planes in Synchro ViewerSelect Cutting Plane Z 2.You will see that there are no cutting faces so the items appear hollow where it cuts through models 3.(Fig 1)To show the cutting face select Home Ribbon>Options>3D View>Cutting Plane and activate Show Cutting Faces. There are options to change thecolour/transparency of the face and edge here.To deactivate the cutting plane select 3D Properties>Cutting Planes> Cutting Plane Z 4.2211. Playing AnimationsYou can view animations that have been prepared within the Synchro file Select Animations in the Navigator to see the animations created. Select and highlight the one 1.you want to viewSelect Windows Ribbon, then Animation Editor 2.To use the Play, Stop, Move to Start etc items ensure that Play Animations is enabledYou can then either use the icons from the Play Ribbon or select the icons from the Focused 3.Time windowClose the animation editor by clicking on the ‘x’ in the top right hand corner 4.2312. PrintingBefore printing, set the required view and aspect ratio in the 3D Window, for example to suit a landscape print. Also you can move the focus time in order to take a snap shot at a particular date.Select File> Print Set Up and set the options as required (Portrait/Landscape etc) 1.Select File> Print 2.Select the required printer from the list and edit the preferences accordingly 3. Select the Layout tab 4.Here you can choose what to print in the View to Print drop down. When this is set to 3D the page options are not available since Fit to exactly is assumed. 24 Select the Legend tab 5.Here you have to option to put a legend at the bottom of the print by selecting the Show Legend box.You also have the option of which date to show as well as placing a logo in the legend.Select Print or Preview then Print 6.The PDF will look as belowDouble click on top bar of 3D View to re-dock 7.ScreenshotIf you need a quick screenshot you can always select the Print Screen key onyour keyboard then paste into software such as Paint, Photoshop etc 25 13. Reporting Review13.1 Baselining in SynchroA baseline (or snapshot) can be created to compare the planned against actual schedule in SynchroSelect the Navigator Baselines button and change Show to All 1.The predefined Baselines are listed- select and highlight the Baseline that you want to see in the 2.Gantt ChartIn the Gantt Chart you will see the Baseline tasks are shown in blue whereas the Planned are shown 3.in red as shown below-13.2 Compare Baseline (using 3D views)You can compare the current baseline with the proposed new schedule, by following these steps:Select Windows Ribbon>3D: to create another 3D View (which is typically positioned above 1.the first 3D View)Select (in the new 3D View yellow title bar shown) and drag the new 3D View over the first 3D View, 2.and release the left mouse button over the right side smart window placement icon.A preview of where the view will be placed will be shown before you drop the view in place. 26Modify the new 3D View to present a viewpoint similar to the first 3D View 3.Right-click in the first 3D View and select Dates To Use> Baseline from the context menu 4.Move the Focused Time through the project to review how the new schedule falls behind the baselineThe Focused Time for the Baseline is behind that of the new schedule as the excavation has yet to be completed compared with the updated schedule which is part way through construction13.3 Earned Value Analysis (EVA) GraphSelect Windows Ribbon > EVA Graph 1.The EVA will appear below the Gantt Chart although you may have to resize it. Select a task with cost assigned (in this case Task 14 Main Site Clearance) you will see the follow 2.result-27Tip- The EVA Graph manipulation is governed by pan and zoom in the Gantt Chart.To view a combination of cost resources/direct cost assigned to tasksYou can see the EVA results for combined tasks by selecting multiple tasks, summary tasks or the whole project.Right click in the task list then right click and choose Select All 3.Ensure Select All Tasks is select on the prompt window then select OK 4. You will see the following result-You will see the graph appear which contains-BCWS (The Budgeted Cost of Work Scheduled) in red which quantifies the value of tasks originally planned.BCWP (The Budgeted Cost of Work Performed) in grey which quantifies the value of tasks started but not yet finished.ACWP (The Actual Cost of Work Performed) in blue which quantifies the value of tasks that are finishedTip- You can show/hide BCWS, BCWP and/or ACWP using the tick boxes Move the Focus Time in the Gantt Chart to the left and right and you will see that the EVA graph 5.gives a forecast value at that moment in time (the red number).Select Task Properties >Cost Totals & Statistics to view further reports 6. Print your results for the EVA by File> Print and changing the Layout to EVA Graph + required 7.settingsSelect Windows Ribbon > EVA Graph to deactivate. 8.13.4 User Field GraphThe User Field Graph displays the assignment of user field values over time.For the purpose of this training we will show Space Allocation against time. The user fields were either populated from the imported schedule or created in SynchroSelect Windows> User Field Graph 1.28The User Field Graph manipulation is governed by pan and zoom in the Gantt Chart.The coloured bars are the result of values applied to tasks for element displayed in the legend-- 5m Work Margin- Structural Steel- Concrete CrewThe black line is a summary total of these elements on tasksThe red line is the set limit (This was applied in Synchro)Select Home Ribbon>Options>Gantt Chart>Colours>Gantt Graphs and ensure that 2.Incremental limit is selected. This will add/subtract the user field values of the limits rather than as a set figure. The settings should look as below:Moving the Focus Time in the Gantt Chart gives a reading for the summary and limits as you move it 3.When the Limit is exceeded the arrows may be used to navigate to the First, Next and Last over-allocationSingle arrow moves to next clash; double takes start or finishThe graph can be printed by the selecting File>Print and changing the Layout to User Field 4.GraphSelect Windows> User Field Graph to deactivate.。
(完整版)中文版LOGIX5000仿真快速讲解
RSLogix5000仿真快速讲解RSLogix Emulator 5000是一个软件模拟5000 Logix控制器的软件。
其目的是在没有硬件的情况下,模拟的真实功能PLC,. 并进行调试。
更多的信息可以参考LGEM5K-GR015A-EN-P AB出版。
As a quick introduction we’ll go through a simple example of setting up a simulation. 作为一个快速的介绍,我们通过过一个简单的例子建立的仿真。
三个主要步骤。
1.建立一个主机监控。
2.RSLinx.创建一个连接RSLinx。
3.构建一个项目相关的仿真硬件。
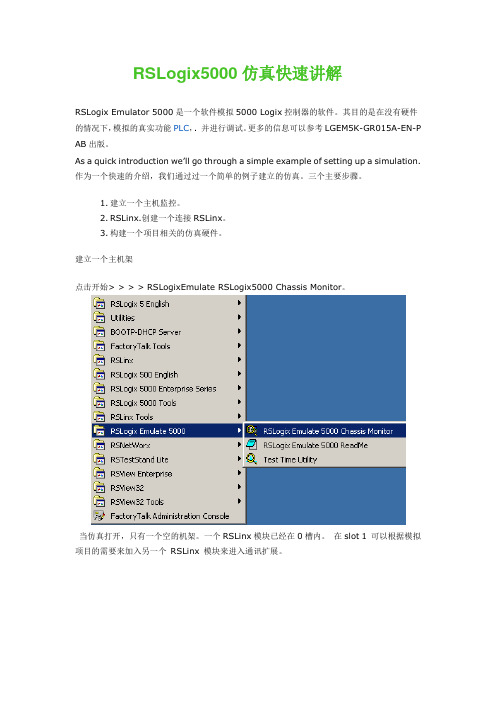
建立一个主机架点击开始> > > > RSLogixEmulate RSLogix5000 Chassis Monitor。
当仿真打开,只有一个空的机架。
一个RSLinx模块已经在0槽内。
在slot 1 可以根据模拟项目的需要来加入另一个RSLinx 模块来进入通讯扩展。
在这里我们搭建项目相关的硬件配置。
第一步将会增加CPU模块。
这是一个叫做Emulation Controller模块。
点击槽>创建模块。
1.选择模拟器RSLogix模仿5000控制器。
2.槽号选择23.点击加入4.在这一点上,你可能会出现一个讯息配置对话框。
配置默认值并单击“下一步”。
5.接下来的两个对话框设置,是控制器的细节。
点击“下一步”并完成对接受所有的默认值。
接下来我们将加入一些输入/输出的模块。
1.点击槽>创建模块。
2.选择1789 -SIM 32点输入/输出模拟器。
3.槽号选择3,然后点击OK。
4.A.接受缺省设置,点击下结束。
机架上将现在有两个仿真模块。
RSLinxRSLinx创建一个连接1.开始>程序下RSLinx > > >罗克韦尔软件RSLinx专业版2.点击Communications > 配置Configure Drivers.3.选择the Virtual Backplane (SoftLogix 58xx) driver现有的驱动类型列表。
Synchro学习手册
Synchro一、软件简介美国Synchro交通信号协调配时软件是根据美国交通部标准《公路容量分析手册》(HCM)规范编制的,可与“公路容量分析软件”(HCS)及“车流仿真软件”(Sim Traffic)相互衔接整合使用。
他是一套完整的城市路网信号配时绩效分析与配时设计最佳化的优化软件。
其所具备的主要功能包括:(1)单一路口/干道/网络系统的容量分析;(2)单一路口/干道/网络系统的现状服务水平分析;(3)单一路口/干道/网络系统的现状信号运作绩效评估;(4)单一路口的信号配时设计;(5)干道/网络系统的信号连锁配时设计。
Synchro软件由于同时结合了道路容量分析、服务水平评估及信号配时设计等多项功能,且可以同时使用与城市独立路口、干道系统与网络系统等多种道路几何类型,故收到了世界各国交通工程师的广泛使用。
因此,Synchro在从事信号配时设计时,其配时最佳化的目标的设定,除可沿用传统独立路口配时设计所常用的最小化平均延滞外,更加入了干道续进绿灯带宽最大化的信号连锁目标,同时还兼顾到路口相位设计的需要,属多元性能设计。
Synchro在实际操作使用方面,除可以提供方便操作的窗口编辑式接口,也可以与现实吃了方针软件Sim Traffic相互结合,来展示模拟结果;同时Synchro更可将所构建完成的路网几何数据转换成可与传统方针模式Corsiom、路网设计模式TRANSYT以及容量分析模式HCS等三个常用交通工程分析软件来相互转换使用档案,以利使用者对各种建议方案进行客观性的整合分析应用。
虽然Synchro软件所依据的HCM标准中的参数是根据美国的情况(如汽车性能、驾驶员的行为习惯、交通法规等)设定的,并且没有计入非机动车对交通的影响,故不能较准确地描述中国交通状况,计算得出的某些结果(如延误时间、服务水平、排放废气等),可能有误差,但是作为方案比较的相对参数,还是具有很高的参考价值,信号配时也应该是合理的。
isight参数优化理论与实例详解
前言●Isight 5.5简介笔者自2000年开始接触并采用Isight软件开展多学科设计优化工作,经过12年的发展,我们欣喜地看到优化技术已经深深扎根到众多行业,帮助越来越多的中国企业提高产品性能和品质、降低成本和能耗,取得了可观的经济效益和社会效益。
作为工程优化技术的优秀代表,Isight 5.5软件由法国Dassault/Simulia公司出品,能够帮助设计人员、仿真人员完成从简单的零部件参数分析到复杂系统多学科设计优化(MDO, Multi-Disciplinary Design Optimization)工作。
Isight将四大数学算法(试验设计、近似建模、探索优化和质量设计)融为有机整体,能够让计算机自动化、智能化地驱动数字样机的设计过程,更快、更好、更省地实现产品设计。
毫无疑问,以Isight为代表的优化技术必将为中国经济从“中国制造”到“中国创造”的转型做出应有的贡献!●本书指南Isight功能强大,内容丰富。
本书力求通过循序渐进,图文并茂的方式使读者能以最快的速度理解和掌握基本概念和操作方法,同时提高工程应用的实践水平。
全书共分十五章,第1章至第7章为入门篇,介绍Isight的界面、集成、试验设计、数值和全局优化算法;第8章至第13章为提高篇,全面介绍近似建模、组合优化策略、多目标优化、蒙特卡洛模拟、田口稳健设计和6Sigma品质设计方法DFSS(Design For 6Sigma)的相关知识。
●本书约定在本书中,【AA】表示菜单、按钮、文本框、对话框。
如果没有特殊说明,则“单击”都表示用鼠标左键单击,“双击”表示用鼠标左键双击。
在本书中,有许多“提示”和“试一试”,用于强调重点和给予读者练习的机会,用户最好详细阅读并亲身实践。
本书内容循序渐进,图文并茂,实用性强。
适合于企业和院校从事产品设计、仿真分析和优化的读者使用。
在本书出版过程中,得到了Isight发明人唐兆成(Siu Tong)博士、Dassault/Simulia(中国)公司负责人白锐、陈明伟先生的大力支持,工程师张伟、李保国、崔杏圆、杨浩强、周培筠、侯英华、庞宝强、胡月圆、邹波等参与撰写,李鸽、杨新龙也为本书提供了宝贵的建议和意见,在此向所有关心和支持本书出版的人士表示感谢。
BIM施工阶段教程—Synchro4D模拟_1

BIM施⼯阶段教程—Synchro4D模拟_1⽬录 CONTENTS01 Learn about 4D02 Synchro Introduction03 Basic Methodology01 Learn about 4DBIM概念⾏为:Buliding Information Modeling○观念、⾏为、过程结果:Buliding Information Model○三维信息模型⽬标:Buliding Lifecycle Managerment(BLM)○建筑全⽣命周期管理贯穿建筑⼯程项⽬全⽣命周期的信息数据库,通过协作⽅式建⽴模型和仿真模拟等载体进⾏项⽬信息的存储、传递和阅读。
What is 4D ?传统进度管理传统进度流程BIM-4D进度流程02 Synchro IntroductionSynchro是⼀款具有成熟的施⼯进度计划管理功能的可视化4D施⼯模拟软件。
通过同步设计、计划、供应链管理、风险管理和挣值分析,客户⼀个真正不同的项⽬管理⽅法。
Synchro管理流程施⼯准备阶段:模型与基准计划关联,实现前期的准备⼯作;施⼯计划阶段:完成成本概算、进度细化和优化;现场控制阶段:对任务变更、模型变更、调度管理、进度控制、成本控制等的管理。
Synchro功能介绍【+】模型整合平台○采⽤CAD专业级别3D浏览引擎,迅速浏览模型;○⽀持⼤部分主流三维模型格式;○导⼊模型定位信息保持⼀致;03 Basic Methodology制定项⽬执⾏策略 | 项⽬⽬标》进度计划的制定与管理、装配过程的设定与验证,以及多⽅案的对⽐优化》配合施⼯进⾏四维空间静态和动态分析和冲突解决》利⽤EVA(挣得值分析)等结合Gantt进⾏成本分析及控制实现更有效的沟通、合作和项⽬管理,更直观了解计划和安排,快速应对突发事件》……制定项⽬执⾏策略 | 组织架构制定项⽬执⾏策略 | 硬件环境制定项⽬执⾏策略 | 软件环境编制标准作业流程 | LOD标准BIM模型内容详细程度取决于在⼯程⽣命周期的哪个阶段,该阶段对模型资讯的需求。
SYNCHRO中文简体教程
SYNCHRO 时制分析软件之教学与应用何志宏11.成功大学交通管理科学系教授联络电话:06-2090740,传真:06-2090741,电子邮件信箱:1.单一路口/干道/网络系统之容量分析作业 chho@.tw摘要SYNCHRO 软件乃是目前风行于国际上的一套完整的都市路网信号配时绩效分析与时制设计最佳化的优异软件;它既可与最新的”公路容量分析手册〈HCM 〉”完全兼容,又可与”公路容量分析软件〈HCS 〉”及车流仿真软件〈SimTraffic 〉”相互衔接来整合使用,故诚为一套不可多得的交通工程实务从业人员的有效分析工具。
有鉴于国内政府单位之交通工程业务承办人员往往必须经常面对层出不穷的市区路网交通运作绩效不彰与系统信号配时绩效低落等诸多疑难课题,却常苦无便利可用之分析评估工具起见;本课程之规划即在于搭配其它相关之信号配时设计课程,自SYNCHRO 软件之简介开始,深入浅出的介绍SYNCHRO 软件的各种功能与其操作步骤,最后再以实例探讨来阐述此软件之使用方法与运算结果之输出与呈现。
深切期望参训学员于研习完成后,得以具备自行针对市区各类型路网的各种道路交通实务课题从事现况运作绩效之分析,以及包括信号配时最佳化设计在内之各种交通工程改善方案之仿真分析与评估的专业技能。
一、引言近数年来,风行国际交通工程与交通控制实务界的SYNCHRO 软件,乃是一套以市区号志化路网作为分析对象之多功能先进号志运作绩效分析与时制设计软件;其所具备之主要功能包括:2.单一路口/干道/网络系统之现况服务水平分析作业3.单一路口/干道/网络系统之现况号志运作绩效评估作业4.单一路口之信号配时设计作业5.干道/网络系统之号志连锁时制设计作业SYNCHRO软件由于同时结合了道路容量分析、服务水平评估及信号配时设计等多项功能,且可同时适用于市区独立路口、干道系统与网络系统等多种道路几何类型,故问世迄今已广为世界各国的交通工程师所乐用。
VJC1.5仿真版使用手册
1.3 光盘的安装与启动 .................................................................................................... - 8 1.3.1...........................................................................................................................安装 - 8 1.3.2........................................................................................................................... 启动 - 8 -
制造企业仓储管理信息系统
大连民族大学制造企业仓储管理信息系统学院(系):机电信息工程学院专业:工业工程学生姓名:宋长红学号:2011*******评阅教师:完成日期:大连民族学院摘要.................................................................................................................................... . (3)Abstract ........................................................................................................................... .. (5)第一章绪论 (6)1.1 选题背景及研究意义 (6)1.2 国内外研究地发展状况 (7)1.2.1管理信息系统发展回顾 (7)1.2.2 国外近年来应用状况调查 (8)1.2.3国内企业管理信息系统地应用现状 (9)1.3 系统目标 (9)1.4 本章小结 (9)第二章系统支撑技术 (10)2.1 网络计算模式 (10)2.2 ASP技术 (11)2.3 Dreamweaver CS5 (13)2.4 IIS服务器 (14)2.5 Access2007 (16)2.6 Rational Rose2003 (16)第三章制造企业仓储管理信息系统需求及整体建模 (17)3.1 需求分析 (17)3.2 系统参与者 (19)3.2.1 构建系统用例模型 (19)3.3 创建系统地静态模型 (23)3.4 创建系统地动态模型 (24)3.4.1 创建序列图和协作图 (24)3.4.2 采购员登录管理系统地工作流程 (24)3.4.3采购员查询生产物料信息地工作流程 (25)3.4.4 仓库管理员登录仓储管理系统地工作流程 (27)3.4.5 仓库管理员添加产品入库信息地工作流程 (28)3.4.6 仓库管理员添加产品出库信息地工作流程 (30)3.4.7 仓库管理员设置管理信息(修改供应商信息、修改产品信息) (31)3.4.8 系统管理员管理员工信息地工作流程 (32)3.4.9 销售员销售商品地工作流程 (33)3.5 创建状态图 (34)3.5.1 系统管理员查询员工信息活动图 (34)3.5.2 系统管理员添加员工信息地活动图 (35)3.5.3 系统管理员修改员工信息活动图 (36)3.6 创建系统部署模型 (37)第四章系统数据库设计 (39)4.1 数据库需求分析 (39)4.2 数据库逻辑结构设计 (39)5.1 用户登录 (45)5.2 权限分配 (46)5.3 后台管理 (46)5.4 工程管理 (47)第六章论文总结 (49)致谢.......................................................................................................... 错误!未定义书签。
罗克韦尔RSLOGIX5000的使用方法之欧阳家百创编
罗克韦尔RSLOGIX 5000的使用方法欧阳家百(2021.03.07)摘要:通过示例项目讲解RSLOGIX 5000从项目的启动、实施到测试过程,深入浅出地软件的的编程方法关键词:PLC;软件;编程A description of ROCKWELL programming software RSLOGIX 5000 and its applicationAbstract:The programming method employing the ROCKWELLRSLOGIX 5000 software is briefly described with examples,includingthe start—up of an item,and execution and debugging of the item.1引言RSLOGIX5000是美国AB公司开发的用于对其公司PLC产品编程的软件。
它具有以下特点:1.统一的项目查看2.灵活的梯形图编辑器3.拖放式操作4.梯形图查看选项5.定制数据监视6.状态文件分类显示7.简易的通讯配置8.强大的数据库编辑器9.查找与替换10.直观的windows界面11.项目校验快捷地更正程序错误等。
2 创建工程下面介绍如何使用RSLogix5000,首先要创建新的RSLogix5000工程文件。
具体步骤如下:打开RSLogix5000,见图1-1图1-1打开后的窗口为RSLogix5000的工程,见图1-2:首先你要给PLC的处理器定义,定义的内容有名字、类型、机架的背扳所在槽号、创建的文件路径等。
这里处理器类型选1756 L1 controllogix 5550,名字定为PLC,description定为练习,背板定为13槽,槽号0槽,路径默认。
图 1-2点击ok完成设置,显示RSLogix5000工程界面首先提出tag(标签)的概念,标签:就是实际工程中的变量,有模拟量如水位、压力、温度。
- 1、下载文档前请自行甄别文档内容的完整性,平台不提供额外的编辑、内容补充、找答案等附加服务。
- 2、"仅部分预览"的文档,不可在线预览部分如存在完整性等问题,可反馈申请退款(可完整预览的文档不适用该条件!)。
- 3、如文档侵犯您的权益,请联系客服反馈,我们会尽快为您处理(人工客服工作时间:9:00-18:30)。
SynchroScheduler Training2015CONTENTS1.The Synchro Workspace (1)1.1.Screen Layout (1)1.2.Initial Setup (2)er Interface Set Up (3)2.1.Customise Columns (3)2.2.General Settings (4)2.3.Gantt Display (8)3.Setting up the Project (9)3.1.Project Date Zero (9)3.2.Data Date (9)3.3.Schedule (9)3.4.Schedule From/To (10)3.5.Gantt Chart Display Manipulation (10)4.Calendars (11)4.1.Project Calendar (11)4.2.Adding Calendars (11)4.3.Modifying Calendar Work Hours (12)5.Saving Template (14)6.Creating the Schedule (15)6.1.Creating Tasks (15)6.2.Creating Parent & Child Relationships (16)7.Linking Options (24)7.1.Link Tasks in a Chain with Automatic Rescheduling Enabled (24)7.2.Link Tasks in a Chain with Automatic Rescheduling Disabled (25)7.3.Introducing Delay to Links (26)7.4.Creating Links from Task Properties (27)7.5.Creating Links from Task Bars (28)7.6.Linking Completion (29)7.7.Schedule Sorting (31)8.Task Modification (32)8.1.Changing Duration (32)8.2.Changing Start Times (32)8.3.Changing Finish Times (33)9.Activity Codes (34)9.1.Creating Activity Codes (34)9.2.Assigning Activity Codes (35)10.Resources (37)panies (37)panies & Resources (38)10.3.Resources not Assigned to a Company (38)10.4.Sub-Resources (39)10.5.Assigning Resources to Individual Tasks (40)11.Task Costs (42)11.1.Assigning Cost Using Resource Properties (42)11.2.Assigning Direct Task Costs (43)11.3.Viewing the Project Budgeted Costs (47)12.Baselines (49)12.1.Create a Baseline Using the Task List (49)12.2.Baseline Comparison (50)13.Task Filters (52)13.1.Applying Pre-set Task Filters (52)13.2.Creating & Applying New Task Filters (53)14.Schedule Updating & Monitoring (61)14.1.Updating Tasks (61)er Defined Statuses (62)14.3.Earned Value Analysis (63)14.4.Monitoring (65)14.5.Exporting Cost Results (66)15.Printing (67)15.1.Printing the Gantt Chart (67)15.2.Printing EVA Results (69)16.Contact Details (70)This document is the copyright of Synchro Ltd, Birmingham Science Park Aston, Faraday Wharf, Holt Street, Birmingham, B7 4BB, United Kingdom, and may not be copied in part or in full, or distributed without written consent.1. The Synchro Workspace1.1.Screen LayoutThis training course will refer to different windows that you need to be aware of as shown below-∙ Quick Access Toolbar contains commonly used icons. The Quick Access toolbar can be customized by left clicking on the down arrow and selecting More Commands .∙ Ribbon contains commands, sorted by category. In the top right corner of the Ribbon is the Help menu which can be used to find more information about a particular feature∙ Toolbars contain shortcuts and useful commands found in Synchro. Right click in the blue space below the Ribbon to view and select available toolbars. Select Customise to create your own custom toolbar of commonly used commands ∙ Gantt Chart window displays the list of Tasks, which can be created, modified, linked, etc.∙ 3D Window displays the modelled resources at any defined point in time. This window is not available in Synchro Scheduler.∙ Navigator contains project-wide datasets logically grouped by the categories shown above; for example Project Details, Task and 3D Filters, Viewpoints∙ Resources contains the list of Resources (including those imported and those created in Synchro)∙ Task Properties contains data related to the selected Task(s) including Task Status (in the General panel), assigned Resources, and Budgeted Costs∙ Resource Propertiescontains data related to the selected Resource(s) including Costs, assigned to Tasks, and User FieldsQuick Access ToolbarRibbonToolbarsNavigator, Resources, & 3D ObjectsGantt Chart WindowProperties3D WindowResources tabNavigator tabTask Properties Resource Properties1.2.Initial Setup1.Start SynchroYou will be presented with the following opening Synchro screen layout–2.Select (left mouse click) the Gantt Tab to display the Gantt Chart3.Select the Navigator Tab4.If you are working in Synchro PRO, c lose the 3D View by selecting the ‘X’ in the top right corner of the 3D window. Ifyou are working in Scheduler, there is no 3D window, so skip this step.er Interface Set Up2.1.Customise ColumnsSynchro has the default columns ID, Name, Duration, Start and Finish, and 3D ResourcesYou can add more columns to the task list through Customise Columns1.Right click in the heading field of the task list and select Customise Columns as shown belowYou will be presented with the Customise Columns window.2.Under Task Parameters, select Planned Duration, Predecessors, Successors, and Downstream Total Float and movethem from Available Columns to Selected Columns by using the button. Remove the Duration and 3D Resources columns by using the button. Move the columns using the Up and Down buttons so the Customise Columnwindow looks as shown, and then select OK. This will create extra columns in the task list. You can Add or Remove other columns in a similar manner.3. To resize the columns, hover between the column titles until the double arrow icon appears then hold down the leftmouse button and drag to the left (the task list can also be resized in the same manner by hovering over the grey bar between the task list and Gantt chart)2.2. General Settings2.2.1. Display Settings1. In the Home Tab or on the Quick Access Toolbar , select Options , open General .Note: to reset any options to their default settings click the reset button in the bottom left of the option window2. Select Time Display Format from the menu. For this tutorial, set the Time Display Format to Short date format anddisable Display Time of Day3. The first day of the week to be displayed can also be chosen from the drop down menu – keep this as Sunday asshown above .Note: The Planned Duration is the original duration of the activity. The Planned Duration (original duration) can be revised until the task has been statused. The Duration is the current duration of a task based on the task ’s actual duration to date plus itsremaining duration.4.Select Duration Display Format from the menu. Set to Concise and Days/Hours/Minutes.Note: the difference between Verboseand Concise is that the Verbose displayformat does not abbreviate the timeunits5.The Number of working days per month and Duration default units can be also be set – the defaults will be used,as shown above.2.2.2.Auto Save1.Still in Options > General, select Auto Save.2.Activate the box next to Auto Save Project and designate 10minutes (optional).Whether you choose to enable Auto Save and the frequencyof the save will depend on the size of the file. The larger thefile the less frequently you will want to Auto Save since itslows down the program.3.If Auto Save is enabled, it is recommended to enable Deleteauto saved file on normal exit.ImportantAlways have Backup project file when opened enabledand select a convenient location (The folder where the backups are saved will need to be emptied from time to time.)2.2.3.Gantt Chart Settings1.Still in Options,expand Gantt Chart and select Rescheduling>Parameters.Enable Automatic Rescheduling, ConfirmRescheduling Results and Snap To Hour options should be set as shown for this tutorial.Note:∙When Enable Automatic Rescheduling is disabled:-Reschedule will not be proposed when a link is unscheduled.-Start As Soon As Possible constraints are not enforced.-Any “Cannot Reschedule” constraints are not enforced.∙“Snap To”defines how the tasks are rescheduled. When a task is rescheduled it will snap to the specified time increment. For example if “Snap To” is set to “day” and you have two tasks of 1.5 days linked in a chain with Finish toStart relationship, the second task will not be able to start immediately after the first task (half way through the day).Instead its start time will “snap” to the beginning of the next full day. Therefore the second task would finish 3.5 daysafter the start of the first. O n the other hand, if “Snap To”is set to “hour”, the second task can start at the beginningof the next hour after the first finishes. Therefore it will start immediately after the first and will finish 3 days after thestart of the first.∙The Confirm Rescheduling results option, when selected, will prompt the user to confirm that project rescheduling should take place whenever a change is made to the schedule that affects other tasks. This option only applies whenAutomatic Rescheduling is enabled.∙The Link Calendar to use during rescheduling options allows the user to choose how Synchro calculates the link delays each time the project is re-scheduled. When the Own option is selected, task link delays will be calculated using thecalendar assigned to that particular link. (See the Help in Synchro for a more thorough description of each option) ∙The On scheduling progressed Tasks use options allow the user to choose how Synchro calculates the schedule. Each scheduling calculation may produce different plann ed dates and/or float depending on the tasks’ actual dates and ifany tasks are out-of-sequence. (See the Help in Synchro for a more thorough description of each option)2.To reschedule manually, disable Automatic Rescheduling and press F9 (This will be used later in the tutorial.)3.The Critical Path default options can be viewed by selecting Rescheduling>Critical Path. The default settings areshown below along with a brief description of all the settings. The default settings will be used in this tutorial.Note:Critical Path update options determine when the Critical Path display will be updated:∙Don’t Update – The Critical Path is not displayed.∙Update Manually – Update the Critical Path displayed by selecting the Home Tab >Tools > Compute Critical Path or Ctrl + F5.∙Update Automatically (slowest) – The Critical Path displayed is updated automatically.Critical Path method options determine how the critical path is calculated:∙Longest path - the critical path is calculated as the longest chain of tasks with zero float.∙Least total float– the critical path is calculated as the longest chain of tasks that match the float criteria you define using the following:- Maximum for critical Tasks defines the maximum total float allowed for a task to be considered critical.- Maximum for subcritical Tasks defines the maximum total float allowed for a task to be considered near-critical.- Duration units define the units being specified in previous options.2.2.4.Task ID1.Still in Options open Defaults for New Objects2.Select Task ID3.The task ID settings are used on all new tasks that are created. Thesesettings can be edited. Keep the default settings displayed in thiswindow for this tutorial.2.3.Gantt Display2.3.1.WBS Layout1.The schedule in this training will be organized by Work Breakdown Structure (WBS). In the Task ribbon, ensurethat Gantt Mode is set to WBS. Schedules may also be structured via Activity Codes or List (no summaries or indent structure).2.To customize the WBS color scheme. Select Home >WBS Layout3.The WBS Layout window will be displayed. In thiswindow, you can:∙Enable/disable the Default WBS Layout colours∙Select New to design your own layout∙Modify colours/order of Levels for a layout2.3.2.Gantt View Options1.To manage which schedule details are displayed visually in theGantt Chart select the Task Tab > Gantt Details and use thedrop down arrows to access the Menu2.The commands act like a toggle button which can be turned onor off. Please refer to the Help for definition of terms.3.By default all Gantt details are displayed except Show Spotlight.Disable Show Hidden Link Warnings3.Setting up the Project3.1.Project Date Zero1.Select Navigator>Project2.Open up Details tab3.For the purpose of this training set the Project Date Zero to 12 Feb 12.∙Project Start–the date of the first (earliest) task∙Project Finish–the latest finish date∙Project Duration–the estimated project duration∙Project Date Zero–the actual progress start date used for progress monitoring. Itdefines the start of the 1st week of the project.3.2.Data DateThe Data Date is the date used to define the project reporting date when calculating the schedule. Parameters such as Percent Complete and Earned Value are computed using the Data Date. This date is typically not the current calendar date - it is typically set to the end of the current reporting period. This date can also bemodified to the required date for “what-if” analysis. The Data Date for calculation purposes can be set to-- Automatic- to use the current date when the project is opened- Manual- to enter your own date (Industry standard)For the purpose of this training set this to Manual and set the data date to 15 Feb 12The Blue dotted line displayed in the Gantt Chart is the Data DateThe Red dotted line with the red triangle is the Focus Time (Used in 4DProjects)3.3.ScheduleThis setting defines whether a task should be scheduled to its Early Dates (ASAP – As Soon as Possible) orscheduled to its Late Dates (ALAP – As Late as Possible)For the purpose of this training leave it set to the default - ASAP3.4.Schedule From/ToThese settings tell the software the time frame that you want the schedule calculations to pass through. Set the “Schedule From” to Data Date and the “Schedule To” to Early Project FinishNote:Schedule From defines the date to use when“Schedule” is set to ASAP and when scheduling taskswhich are constrained to "Start as soon as possible."Schedule To defines the date to use when “Schedule” isset to ALAP and when scheduling tasks which areconstrained to "Start as late as possible.”Note: It is NOT necessarily recommended thatconstraints be used, but if they are this is how theassociated tasks will be scheduled.3.5.Gantt Chart Display ManipulationTo manoeuvre within the Gantt chart move the cursor within the Gantt Chart-To Pan-Hold down the middle mouse button then move the mouse up, down, left and right.To Zoom-Roll the middle mouse button wheel forward and back to zoom in and out respectively.4.CalendarsCalendars are used to assign working time and non-working time to an activity. Every project will have a defaultcalendar that is used when new tasks are created or scheduled. Other calendars can be added to define different working periods for different tasks. For example, you can have one calendar that defines a 5 day work week forconcrete placement and another calendar that defines a 7 day work week for concrete curing.4.1.Project Calendar1.Select Navigator > Calendars2.You will see that Synchro creates a default calendar- Project Calendar3.Select and highlight Project Calendar, then open the General tab below.You will see the current month - the working days lightly shaded; and the working hours -This Project Calendar is a 5 day week with working hours between 09:00and 17:004.2.Adding Calendars1. A new calendar will be added for training. Move back up to the white window (at the top) then right click and selectAdd2.Rename the new calendar to7 day work week3.Select and highlight the 7 day work week and open the General tab4.Any day can be changed to a working day. Right click on any Saturday date and select Normal Working Day thenEvery Saturday. This will change all Saturdays to work days.5.Repeat this for Every SundayNon-working days can be assigned as well as specific day types that may be utilized on a project - for example, holidays or owner resticted work days.4.3.Modifying Calendar Work Hours1.To change the working hours in a day, right click on any day and select Edit day type.2.Once the edit window opens, the working hours can be changed. For this tutorial, a lunch break will be added to the7 day work week calendar. Adjust the morning work hours by selecting the working hours (09:00 to 17:00) thenchange the start and end times to 07:00 to 12:00 as shown below3.Multiple working blocks of time can be created for each working day. To create multiple working time blocks, selectCreate time block to enter another block of time. For the 7 day work week calendar enter the afternoon work hours 13:00 to 17:00 as shown below then select OK4.The Normal Working Day will be a 9 hour day with 2 work periods for the 7 day work week calendar for all dates asshown below5.Saving TemplateYou may want to save any calendars, filters, etc. that are created so they do not have to be created each time a new file is started.This is done by creating a .sp template file. Set up needed calendars, filters, etc., then either-∙Save as a .sp fil e (Synchro’s extension). Open this file when beginning a new project; save it with new file name;and then enter the new project information.∙Save as .sp file, and then import this file into another Synchro project with the required attributes that werecreated - such as calendars, filters etc. This method is explained below-1)Select File> Save As> Private Project .…Synchro Template (for example) then select Save2)Select File> New– (or alternatively exit and reopen Synchro)3)Prior to importing a template, rename the Project Calendar in the new Synchro file to XXX. If you do not, aduplicate Project Calendar will be created when the template calendar information is imported into the newSynchro file.4)When you have started a new project select File >Import> Synchro Project5)Browse and select Synchro Template.sp. Click Open,and then click Next.You will be presented with the Import Synchro Project Window6)Select Skip All7)Then change the Command next to the Objects- Calendars, Filters, etc. to Import for any object you wantto include from the template file. For this training select only Calendars as shown below-8)Select Import (you will see a report of what is importing) then select Finish9)Select File>Save As>Private Project … browse, name your file and save.6.Creating the ScheduleThe Work Breakdown Structure (WBS) will be used to create this training schedule. The WBS is a way oforganizing the data represented in the scheduleTo begin creating the schedule, open the Synchro template you created:-Select File> Open >Private Project….. browse and find your template fileModify your Project Date Zero and Data date as needed. For this training we will use the dates from thetemplate. Save it as a new file using:-Select File>Save As> Private Projec t … browse, name your file and save.There are various ways to create tasks, links etc. which will be covered in this section.6.1.Creating Tasks1.Open the Home Tab and use the Calendar dropdown box under the fast settings to select a calendar to use forall new tasks or use the Calendar dropdown box from the Fast Options. Select Project Calendar as shown2.In the Task List, select the first Name cell by left clicking on the cell so it is highlighted. This allows you enter a newactivity name. To edit a current activity name in a cell, highlight the cell and left click, or right click and chooseRename Task from the context menu. Selecting F2 on the keyboard when the cell is highlighted also enables editing of the cell.3.Type Construction Project in this Name cell then press Enter on the keyboard4.You will see the following cells populated-∙ID (derived from the values given in tools>Options>Default for New Objects>Task ID)∙Name (Construction Project)∙Duration (Defaults to 1 day)∙Start (Same as Data Date)∙Finish (As Above)∙Gantt bar created5.Repeat this process to create the 15 Activities and name them as shown below-6.2.Creating Parent & Child Relationshipsing IndentUsing indents allows the WBS structure to be created or Parent and Child tasks. The top level WBS for this project will be Construction Project1.Select the Site task and hold down the Shift button on your keyboard then select the Level 02 task so all the tasksbetween those two tasks are highlighted2.From the Task Tab select the dropdown on the Move Panel3.Select Indent. There are also options to Outdent or move tasks Up and Down. Now all the original tasks are childtasks to the Construction Project task. The schedule will now be displayed as shown below-4.Make sure the tasks are in order as shown above. Select the following tasks then Indent after each selection tocreate the secondary WBS level∙Tasks Mobilization; Site Prep; and Excavation will be subtasks to the Site task∙Tasks Footings and Slabs will be subtasks to the Foundation task.∙Tasks Level 00-01 and Level 01-02 will be subtasks to the Structure task.∙Tasks Level 00, Level 01, and Level 02 will be subtasks to the Interiors task.The schedule will now be displayed as shown below6.2.2.Adding Additional DetailThere are times when an activity needs to be broken down into a greater level of detail to create a betterunderstanding of the project. This detail can be added to the schedule by adding “child” or “detailed” activities below “parent” or “summary” activities. T wo methods of adding extra detail to your schedule are discussed below.When beginning, keep the original order of the original activities – task lines 1-15. As you add child tasks(subtasks) the task line number on the left will change based on the number of child tasks (subtasks) added.ing “As Child” Function1)Select & highlight task - Mobilization then from the Task Tab select the dropdown on the Create Paneland choose As Child2)You will see a New Task has been created which is a child (subtask) of its parent task, Mobilization.Rename as Mobilize Site Offices3)Select & highlight task - Mobilize Site Offices,then from the Task Tab select the dropdown on the CreatePanel and choose BelowRename as added task as Mobilize Equipment4)Left click (or double click) in the Duration Cell for Mobilize Site Offices then enter 2d (2 days)5)In the duration cell for Mobilize Site Offices hover over the grey box in the bottom right hand cornerand a crosshair icon will appear6)Select this crosshair icon with a left mouse click, hold and drag over the duration cell below until bothdurations read 2 days as shownNote- If you want to remove a task -∙Select Task(s), right click and select Delete Task(s)∙Select Task(s) then press Delete on your keyboardII.Creating a new task below then indenting1.Select & highlight task - Site Prep, then from the Task Tab select the dropdown on the Create Panel andchoose Below.A New Task is created below Site Prep. Rename the new activity to Site Fencing Install.2.With the new task Site Fencing Install selected, make sure you are still in the Task Tab. Choose CreatePanel making sure the Below is highlighted, then click Below twice to add two new activities below Site Fencing Install. (The toolbar command button remembers the last operation performed which wasBelow)3.Rename the two new activities below Site Fencing Install to Temp Power Install and Clear & Grub.4.Change the duration of Clear & Grub to 3 days.5.Select task - Site Fencing Install. Hold down the shift key and select task - Clear & Grub then selectIndent. You can also right click on the mouse and select Move > Indent.The display will be as shown below-ing one of the two methods, add the additional tasks as described:a.Add the following tasks and durations under the Excavation task as shownb.Add three new tasks under the Footings tasks with durations of 2 days eache the same method for renaming tasks as you used for copying duration values.-Type the first task name - FRP Footings 1, then hover over the grey box in the bottom righthand corner until a crosshair icon appears-Select this with a left mouse click, hold and drag over the name cells below and they will benamed in numerical order FRP Footings 1 to 3-The result should be as shownd.Add the following tasks and durations under the Slabs task as showne.Add the following tasks and durations under the Level 00-01 task as shownIII.Copying and Pasting Tasks1)Select task - Level 01-02 and create a child task below2)Select the previously created child tasks of Level 00-01,tasks - Erect Steel and Plumb, Bolt & Weld, rightclick and select Copy Task(s)3)Right click on the New Task under task - Level 01-02 and select Paste Task(s) . You will see -4)Use the same method to create the following tasks and durations as shown below6.2.3.Changing Task CalendarsThere may be tasks in a project schedule that need to utilize different work periods. For example concrete will placed during the normal 5 day work week but the curing of the concrete will occur over the 7 days (including weekends) following a concrete pour. In this case the concrete tasks would be assigned to the Project Calendar which is a 5 day normal work day calendar and the curing would be assigned to a 7 day – 24 hour calendar.In this training, it has been decided that the structure activties Level 00-01 and Level 01-02 will use a 7 day week calendar1.Hold Shift on your keyboard and select Structure followed by Plumb, Bolt & Weld of Level 01-02 so that all theStructure tasks are highlighted2.Select Navigator>Calendars3.Select 7 day working week calendar, hold down the left mouse button and drag and drop the calendar onto oneof the highlighted tasks4.To check that the correct calendar has been assigned- select one of the tasksthen open Task Properties>General (Right hand side of screen) and check the Calendar (as shown to the right)5.You will also see that the duration of these tasks has been altered because the 7 day working week has a normalworking day of 9 hours and the project calendar has a normal working day of 8 hours. The tasks will still take the same number hours thus the duration was converted.If you want the task to take the full day on the 7 day work week calendar, change the calendar under the Fast Settings to the 7 day work week calendar prior to creating the tasks or type in the duration in days for the tasks after changing the task calendar.For training we want the durations on these tasks to be in days so change the durations of the 4 tasks back to their original durations as shown6.2.4.Task Properties – GeneralThe Task Properties > General tab allows the task properties for a selected activtiy to be viewed and modified if needed.Under this tab you can-∙Edit the Task Name∙Change Planned Start/Finish∙Edit the Duration and Duration type∙Enter a Physical Volume (used to calculate durationand estimated rate when production rate Rules areapplied)∙Change the status of the Task∙Change the Assigned Calendar∙Add a Task Constraint∙Choose the Task Type(i.e. work, key dates, hammocks, etc.)∙Assign an additional description called a Category∙Connect a URL to the task (viewed in browser)∙Add Comments∙Review Upstream & Downstream Float。
