图表作文写作指导
图表式作文三步骤
图表式作文三步骤:1、开门见山:点明图表所反映的主题。
2、分析数据间的主要差异及趋势,然后描写(在描写数据间变化及总趋势特征时,可采用分类式或对比式以支持主题,并阐明必要的理由)。
注意层次。
3、归纳总结或发表评论。
现将常用词汇总结如下1. 用于点明主题的词如:table , chart, figure, graph等等。
2. 用于说明的动词如:describe, tell, show, represent等等。
3. 用于分析差异的词:在描写变化及总趋势特征时,可采用分类式或对比式以支持主题,并阐明必要的理由。
1)rise, increase, drop, reduce, decrease, fall, 升高降低2)while, but, on the contrary, however, 转折3)compare...to/with...,in contrast相比之下4)as...as, the same as, similar to, 相同5)be different from.. differ from 不同常用句式1.开头常用套语:1)The graph above shows that …2)As is shown by the graph / in the chart, …3)From the graph / chart above, we can see …4)From the figures given in the table, it can be seen / noticed that…5)As we can see clearly from the chart above, …2.数据说明常用套语:1)The number of …nearly doubled2)The number was 5 times as much as that of…3)Compared with 1997, it increased (rose / fell / dropped) from .. to ..4)It decreased twice than that of 1906.5)The total number was lowered by 10%.6)The number of …amount to/add up to/sum up to/reach …3. 原因说明常用套语:1)There are several reasons that account for it. /The changes can be explained for several reasons.2)From the increased number we can get that…3)The change in.... largely results from the fact that...4)Firstly/ First of all/ To begin with, .... Secondly, .... Besides/ In addition/ Furthermore/ Moreover,... Finally/ Last but not least/, .... 5)… are also the reason why the number is increasing so fast.4. 结尾常用套语:1)We can draw the conclusion that…2) In my opinion/Personally, …3)As far as I’m concerned, …4) In short/ in brief/ in a word, …5)It seems clear that …/It's clear from the chart that...6)We can know/learn that…8)The results of the survey seem to suggest that…图表作文要用文字来表述上升下降平稳发展等时,常可用如下词汇:总计: add up to, total上升: rise, increase, climb, improve, reach a peak下降: fall, decrease, decline, go down, drop, slip back平稳: remain stable回升: recover波动: fluctuate同时,可用如下副词修饰:Slowly, gradually, slightly, sharply, dramatically, steadily, suddenly图表类作文可以参考下面的模式:模式1:第一段:( 表述图表中的数字)--- is known as one of the most serious problems in today’s world. As is shown in the graph, / according to the figures shown in the graph,第二段:(陈述理由)Furthermore,As a result,(--- experiencing a decrease / an increase.)第三段:(总结呼吁)So I believe --- will be achieved through efforts of every person.例:Number of car accidents in a certain city ( months in 2005)Car accidents are known as one of the most serious problems in today’s world. As is shown in the graph, during the first three months in 2005, car accidents in that city increased from 20 in January to 32 in March. Then the number fell to 26 by the beginning of June. But, it rose again and reached the peak in August when there were 39 accidents. To our joy, from then on the number kept decreasing and in the last month of the year, only 16 accidents occurred.In the past several years, some new roads have been built and some marrow streets have been widened. The roads are not as crowded as before.Furthermore, new traffic laws have come into force. And people, especially drivers have realized the importance of keeping to the rules. As a result, the car accidents in that city are experiencing a decrease.So I believe a safe tomorrow of less car accidents will be achieved through efforts of every person.模式2:第一段:From --- we can see the increase / decrease ---(描述数字的句型)--- was / added up to (数字)in (时间), while it increased / decreased to (数字and 数字)in (时间and 时间)respectively. Therefore, it can be predicted that --- will furthermore increase / decrease ( is / are to be on the rise / decrease ) in the future.第二段:There are chiefly three reasons for the rise / decrease. Firstly , --- , Secondly, ---, Apart from the above reasons/ ---第三段:In spite of what is mentioned above, there are still --- .The graph / table indicates --- Hence, the situation is still serious and how to --- is still a challenging task.1. 下表提供了你所心仪的南、北两所大学的招生信息。
如何备考写作考试中的图表描述
如何备考写作考试中的图表描述在备考写作考试中,图表描述是一个常见的题型。
掌握好图表描述的技巧,能够让我们的作文更加有说服力和准确性。
本文将介绍如何备考写作考试中的图表描述,以帮助大家在考试中取得好成绩。
一、了解题目要求在备考写作考试中的图表描述题目时,首先要注意的是了解题目要求。
通常,题目会提供一张图表,要求我们描述图表中的主要趋势或者分析图表之间的联系。
因此,在备考时要仔细阅读题目,并确定要描述的内容是什么。
二、认真观察图表在备考写作考试中的图表描述题目时,第二步是认真观察图表。
我们需要仔细研究图表中的数据,理解图表所展示的信息。
同时,我们还需要注意图表的标题、坐标轴的刻度和单位等信息,这些信息都对我们的图表描述非常重要。
三、骨架搭建在备考写作考试中的图表描述题目时,第三步是搭建文章的骨架。
我们可以根据图表的不同特点,选择合适的结构和段落顺序。
常见的结构包括按时间顺序描述、按比例分析等。
同时,我们还可以使用逻辑连接词来连接各个段落,使得文章的结构更加清晰。
四、用数据说话在备考写作考试中的图表描述题目时,第四步是用数据说话。
我们需要根据图表中的数据进行准确描述和分析。
可以使用一些词组和句型来表达图表中的趋势、变化和比较。
例如,我们可以使用“increase”,“decrease”,“rise”,“fall”,“reach a peak”,“hit a bottom”等词汇来描述趋势。
同时,我们还可以使用“more than”,“less than”,“equal to”,“twice as much as”等词组来进行比较。
五、结合图表进行分析在备考写作考试中的图表描述题目时,第五步是结合图表进行分析。
我们可以通过观察图表中的各种数据,提出一些合理的解释和推断。
同时,我们还可以结合自己的知识和经验,对图表中的现象进行分析。
这样可以增加我们的文章的可信度和说服力。
六、总结观点在备考写作考试中的图表描述题目时,最后一步是总结观点。
书面表达之图表类解题指导

文字表格式 体裁相对稳定,以说明文、议论文为主,辅之以记叙文。题材丰富多样,有书信、发言稿、介绍等,通常,试题明确规定了写作格式。根据表格提示内容,确定要表达的写作要点,运用掌握的句型和词汇知识完成文章。
布好局、谋好篇。动笔前,根据表格提示内容,先确定所需体裁,然后根据所给题材确定文章的整体结构。
1. 建设时间长,影响日常生活。 2. 投入资金过大,成本回收过慢。
你的观点……
列提纲:理清要点、分段落与层次
英语作文宜用______式。
四段
第一段:开门见山,引入话题:太原最近
计划修建地铁,这件事引发了人们
的广泛争论。
第二段:赞成者的观点及理由。
第三段:反对者的观点及理由。
第四段:陈述自己的观点。
确定写作要点。确定写作要点,尤其是自由发挥或谈感想的要点。最好以要点/短语形式列一个写作提纲。
【注意】
柱形或饼形图表式 体裁多为议论文、说明文和应用文,内容多涉及前后变化对比、正反观点对比或产品介绍等。通过分析,系统准确地表达出变化的含义,并得结论。要紧扣中心思想,不漏要点,意思连贯,文理通顺,语言准确得当。
常用句型:Facts: There was a great /slight increase in… There has been a sudden/slow/rapid fall in… It is 20% lower/higher than… The number /rate has nearly doubled, as against that of last year. The number is …times as much as that of…. It increases/rises/decreases/reduces by… By comparison with…, it decreased/ increased/ fell from…to…
四级考试图表作文写作技巧

饼状图
特点
用于展示整体中各部分的占比关系。
重点
关注各部分占比大小和变化,以及占比与整体的关系。
分析
比较不同时间段或不同群体之间的占比差异,探究占 比变化的原因和影响。
表格
特点
用于展示多维度数据,包括数值和文字信息。
重点
关注数据的全面性和细节,注意数据的准确 性和可信度。
分析
对表格中的数据进行分类、筛选、计算和对 比,挖掘数据背后的信息和意义。
03
特点
用于比较不同类别之间的 数找 出最大值、最小值和变化 趋势。
分析
比较不同时间段或不同群 体之间的数据,探究数据 背后的原因和影响。
折线图
特点
01
用于展示数据随时间变化的趋势。
重点
02
关注数据变化的规律和趋势,以及峰值和谷值出现的时间点。
分析
03
探究数据变化的内在原因,预测未来趋势,并给出相应建议。
05 实例分析
优秀范文展示
文章结构清晰
优秀范文通常具有明确的文章结 构,包括开头、主体和结尾,层 次分明,逻辑性强。
语言准确流畅
范文的语言表达准确,语法和拼 写错误较少,同时流畅自然,易 于阅读。
图表描述细致
范文能够准确描述图表中的信息, 对数据和趋势进行恰当的分析和 解释。
学生常见错误分析
文章结构混乱
描述图表内容
01
按照题目要求,准确描述图表中的数据和信息,注意使用合 适的单位和表述方式。
02
突出图表中的关键信息和趋势,并解释其含义和影响。
03
可以适当进行图表数据的分析和比较,以支持文章观点。
总结与启示
总结图表所反映的问题或趋势,以及 可能的原因和影响。
中考知识要点简记归纳之图表作文写作指导
《图表作文》写作指导中考中的图表作文一般有以下三类。
一、看图作文【命题形式】看图作文一般要求学生根据所给出的一幅图或几幅图所提供的信息写一篇短文。
在命题形式上,除了图的提示外,一般有英文单词提示或中文文字提示。
有的文章开头已给出。
要求书写的词数一般在80至100之间。
【写作技巧】1.审题要清。
看清题目要求,读懂画面内容和所陈述的含义,抓住要点,注意文体是什么,如果是故事或日记,宜用过去时态;如果介绍物品之类的,多采用现在时态。
2.逐图列提纲。
看图作文所提供的材料是一幅或几幅图。
做题时,可逐图列好提纲,并运用所提供的词语。
根据图示情景并结合自己的英语水平,尽量扬长避短,避繁化简。
遇到一时想不起来的词、句时,可用同义词或同义句代替。
3.连句成文。
就是把第二步所写的句子,在规定的范围内稍加发挥,适当用上连词把它们串联起来整理成一篇短文。
连句成文时应注意文中动词时态的应用,简单句和复合句的交替应用。
4.复核检查。
按要求逐图写好句子后,认真通读写好的句子,一查所写句子是否准确表达出了所给图画的情景,行文是否流畅;二查有没有遗漏要求,句子的时态、语态是否正确,所写句子是否符合英语的基本语序,即:主语+谓语+宾语十状语(地点、时间等);三查单词的拼写、大小写是否规范,标点符号的运用是否正确,主谓语是否一致。
确定无误后,再誊写正稿。
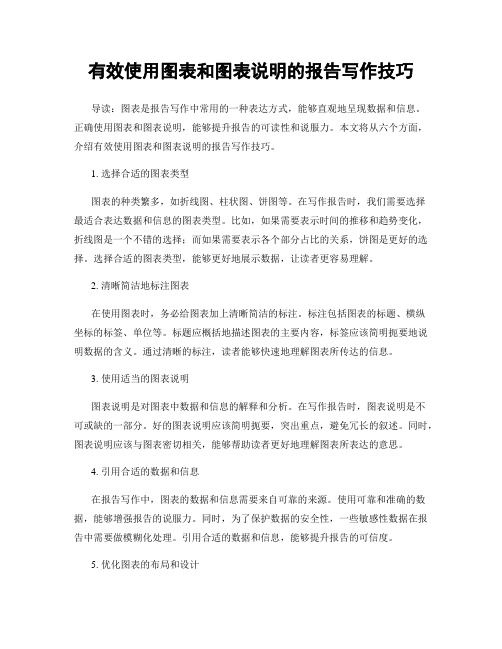
【经典试题】(2017年湖州卷)英语课上,老师组织大家就以下两幅图进行“To change or not"的话题讨论。
请用英语阐述你对此话题的看法。
注意:(1)短文可结合图片信息或自身经历,作适当发挥;(2)文中不得出现真实的姓名和校名;(3)词数:80~100,短文首句仅供选择使用,不计入总词数。
短文首句:Last week, we had a discussion about the topic "To change or not".【审题指导】1.因为短文首句已给出,所以我们可以接着引出下文。
图表作文的写作要领

图表作文的写作要领(1) 观察图表,确定主题句观察图表是为了准确地理解图表所传递的信息。
观察图表首先要看清楚图表的文字说明,然后仔细研究图表以发现数据的主要特征和变化趋势,以此来确定主题句。
(2) 选择典型材料仔细观察表中数据的变化,并加以比较和归纳,选出差距变化最大、最有意义、最能说明主题的信息。
避免过分详细,逐一罗列。
换句话说,并不是图表中的任何一个数字都要进行描述。
(3) 分类确定全文的时态图表有两类,一类是有时间参照的,另一类是无时间参照的。
有时间参照的图表一般在描写时用现在时,有时间参照的可有两种情况:①如果参照的时间在过去就用一般过去时态。
②虽有过去时间参照,但叙述的是经常出现的情况,这种情况整篇文章总的时态仍用现在时态。
(4) 熟练掌握常用套句和短语由于图表包含丰富的信息和各种各样的数据,要清楚有效地把它们呈现出来并不是一件容易的事情,尤其是数据以及发展趋势的变化。
考生应该熟练掌握常用套句和短语。
如果考生能够熟练运用这些套句和短语,自然会信心倍增,对图表作文的恐惧也就消失了。
写作流程第一段:描述图表反映的总情况。
(用能充分说明主题的典型数据描述图表)第二段:分析原因。
(仔细分析比较数字,归纳出增减速率并找出产生变化的原因)第三段:结论。
(得出结论或展望、预测发展趋势)范文与评析(1)---表格(table)作文Directions: You are required to write an essay with the topic “C hanges in the W ays P eople S pent T heir H oliday s. You should base your essay on the information from the table.Changes in the Ways People Spent Their Holidays From the table we could know that the ways people spent their holidays have changed greatly. In 2003, 40% people spent their holidays at home, but their number dropped to 10% in 2013. It was no doubt that people were becoming more and more mobile, and they wanted to get entertainment outside their homes.Seaside still had its attraction to people, though its rate dropped slightly from 40% in 2003 to 30% in 2013, and there might be a further decrease in the future because of the marine pollution. The table shows that a great number of people spent their holidays traveling abroad. The rate in 2013 doubled as compared with 2003. With the increase of their income, more and more people could afford their holidays abroad.The table also indicates another tendency: the rate of camping was rising from 10% in 2003 to 40% in 2013. The reason may be that the real beauty of nature was being rediscovered, and people were getting more and more interested in natural scenery. Based on the above analysis we could draw the conclusion that great changes have taken place in the ways people spent their holidays in the past ten years.范文与评析(2)--- 饼状图(pie chart)作文Popular Desserts in a University CafeteriaDirections: The above pie chart shows the percentage of popular desserts selected in a university cafeteria. Write an essay on the topic “Popular Desserts in a University Cafeteria”. You should base your essay on the information in the chart.Popular Desserts in a University CafeteriaThis pie chart shows the relative popularity of desserts served in a university cafeteria.I ce cream is the favorite among the dessert selections,accounting for 35% of all choices.Pie is the next most popular choice with 25%of all choices. These two items exceeded theremaining four selections in popularity. D oughnut is not so popular with only 10% of all choices, which is the same with pudding in popularity.The only natural fruit choice, the apple, is only a little more popular than the doughnut and is a selection of less than half of percentage in ice-cream.Fruit jelly was last in popularity among all choices.Even pudding proved to be twice as popular as fruit jelly. The relatively high popularity of ice cream and pie may be due in part to the fact that these desserts are not everyday diets in Chinese meals.Fruit jelly,apples, and doughnut are usually served at home.The relatively high standing of the apple in relation to pudding, doughnut,and fruit jelly may be due to parental or school training on nutrition.范文与评析(3)---线状图(line graph)作文Car Accidents in BeijingDirections: You are allowed 30 minutes to write an essay based on the graph. The suggested title is: Car Accidents Declining in Beijing. Remember that your essay must be written according to the following outline:1) Rise and fall of the rate of car accidents as indicated by the graph.2) Possible reason(s) for the decline of car accidents in the city.Car Accidents Declining in BeijingLast year, the rate of car accidents in Beijing reached the highest point 37 in August. After that the rate was steadily declining, and reached the lowest point 14 at the end of the year. The first three months of 2012 showed an increasing trend, and reached 30 in March, and then the rate declined to 26 in June. Then from June to August, the rate was rising from 24 to 37.The highest rate of 37 in August might be due to weather factors. Humidity and high temperature may make drivers become uncomfortable and impatient, which could easily lead to car accidents. The peak point in the first half of 2012 might be also caused by weather conditions. In Beijing, the excessive rain comes at early spring, which makes roads muddy and slippery, and these conditions may result in car accidents.This year the situation is expected to be changed. City government has raised money to improve the road conditions. Two new roads were built at the end of last year, and will soon open to cars. New road regulation stipulates that every car should be air-conditioned in summer. All these precautions account for car accidents declining in Beijing this year.范文与评析(4)---直方图(bar graph)作文Three Major Causes of Fire in ChinaHistogram 1Histogram 2Directions: The above diagram s show three major causes of fire in Guangzhou, these histograms indicate the numbers of fire and the extent of the damage involved, measured in terms of billions of Yuan. Study the two histograms above and draw whatever conclusion(s) you can. T he public interest may be one point to consider. Write an essay stating and supporting your conclusion(s).Three Major Causes of Fire in GuangzhouDespite of all the efforts that mankind has made over the years, fire continues to be a terrible killer in our modern society. From the two histograms above,which describe the leading causes of fires measured in both number of fires and total losses from thefires in Guangzhou, we could see that most fires are caused by smokers, defective insulation and children playing with matches.It is clearly shown in these two histograms that smokers were responsible for totally 10500 of the fires in the last two years, which caused about 5.5 billion Yuan worth of damage. Defective insulation caused more than 4500fires and children playing with matches led to about1000 fires. These results show that smok ers can be considered as the enemies of the whole society, especially when the public interest is taken into consideration.Comparing the figures of these two years, it will be safe to draw a conclusion that, although the number of fires in each category remained nearly the same, the fire losses caused by defective insulation were significantly lower than those in the previous year. O n the contrary, the fire losses in the case of children’s playing with matches were significantly higher than those in the previous year, even though there were fewer fires. T he average losses of a fire caused by smokers remained more or less the same, only showing a slightly increasing trend.Based on the brief analysis above, it can be concluded that, although smokers are the leading cause of fires, we still need to improve the insulation devices and educate our children on the dangers of playing with matches.常用表达句型:1)描述图标的句式(1) T he table shows the changes in the number of...over the period from...to...该表格描述了在...年到...年间...数量的变化。
有效使用图表和图表说明的报告写作技巧
有效使用图表和图表说明的报告写作技巧导读:图表是报告写作中常用的一种表达方式,能够直观地呈现数据和信息。
正确使用图表和图表说明,能够提升报告的可读性和说服力。
本文将从六个方面,介绍有效使用图表和图表说明的报告写作技巧。
1. 选择合适的图表类型图表的种类繁多,如折线图、柱状图、饼图等。
在写作报告时,我们需要选择最适合表达数据和信息的图表类型。
比如,如果需要表示时间的推移和趋势变化,折线图是一个不错的选择;而如果需要表示各个部分占比的关系,饼图是更好的选择。
选择合适的图表类型,能够更好地展示数据,让读者更容易理解。
2. 清晰简洁地标注图表在使用图表时,务必给图表加上清晰简洁的标注。
标注包括图表的标题、横纵坐标的标签、单位等。
标题应概括地描述图表的主要内容,标签应该简明扼要地说明数据的含义。
通过清晰的标注,读者能够快速地理解图表所传达的信息。
3. 使用适当的图表说明图表说明是对图表中数据和信息的解释和分析。
在写作报告时,图表说明是不可或缺的一部分。
好的图表说明应该简明扼要,突出重点,避免冗长的叙述。
同时,图表说明应该与图表密切相关,能够帮助读者更好地理解图表所表达的意思。
4. 引用合适的数据和信息在报告写作中,图表的数据和信息需要来自可靠的来源。
使用可靠和准确的数据,能够增强报告的说服力。
同时,为了保护数据的安全性,一些敏感性数据在报告中需要做模糊化处理。
引用合适的数据和信息,能够提升报告的可信度。
5. 优化图表的布局和设计图表的布局和设计也是影响报告质量的重要因素。
合理的图表布局能够使读者更容易理解图表中的数据和信息。
而美观的图表设计则能够提升报告的视觉效果和吸引力。
在设计图表时,需要考虑字体大小、颜色搭配等因素,让图表更易阅读。
6. 结合文字和图表进行解读文字和图表是相辅相成的,在报告写作中,二者需要相互结合,进行解读和说明。
文字可以对图表中的数据和信息进行更详细的解释,帮助读者理解图表所表达的意思。
图表作文写作

图表式作文写作技巧指引一、图表类型二、要点分析A. 表格图1横向比较: 介绍横向各个数据的区别,变化和趋势2纵向比较:介绍横向各个数据的区别,变化和趋势3无需将每一个数据分别说明,突出强调数据最大值和最小值,对比时要总结出数据对比最悬殊的和最小的说明:考察例举数字的能力和方法。
注意怎样通过举一些有代表性的数据来有效地说明问题。
B. 曲线图1极点说明: 对图表当中最高的,最低的点要单独进行说明2趋势说明: 对图表当中曲线的连续变化进行说明,如上升,下降,波动,持平3交点说明: 对图表当中多根曲线的交点进行对比说明说明:关键是把握好曲线的走向和趋势,学会general classification,即在第二段的开头部分对整个曲线进行一个阶段式的总分类,使写作层次清晰。
接下来在分类描述每个阶段的specific trend,同时导入数据作为你分类的依据。
注意不要不做任何说明就机械性的导入数据!可以使用一些比较native的单词和短语来描述trend。
C. 饼状图1介绍各扇面及总体的关系2各个扇面之间的比较,同类扇面在不同时间,不同地点的比较3重点突出特点最明显的扇面:最大的,最小的,互相成倍的D. 柱状图1.比较: similarity2.对比: difference)3.横向总结所有柱状图表的共性特征 & 分别描写各个柱子的个性特征E. 流程图1.首先说明:做什么工作的过程,目的是什么2.准备工作3.按时间/过程先后描述4.结果5.简单总结(可有可无)说明:注意流程图里的“因果关系”或每一流程的“承前启后”关系;表达每一流程的主体内容,阐明这种关系;揭示其内在联系或规律;最后,给予简要归纳和总结。
F. 实物/器具工作过程1.实物的名称,功能2.基本结构3.工作过程4.简单总结G. 综合图1不求甚解,不拘泥于细节2分门别类,分段落详细介绍各个图表3不画蛇添足,主观臆断或猜测图表之间的关系三、框架结构1.开头:该图阐述的是______的______.共有以下几个部分组成。
主题2:图画、图表类作文写作指南

主题2:图画、图表类作文写作指南安徽张岚Ø命题导读图画、图表类作文通常以图画、表格或图形的形式呈现,体裁多为说明文或议论文。
此类题型要求考生根据图画和图表提供的信息、数据和文字内容进行描述、分析与讨论,得出令人信服的结论,或对某一结论进行评述。
图画、图表类作文常见的命题形式有图画、表格、条形图、饼状图、线形图。
图画、图表中的信息和数据往往较多,写作时一般不能把各种信息和数据都列举出来。
因此,读懂图画和图表是关键,考生要认真分析图画和图表的信息和数据。
考生平常要多做练习,熟悉这类作文的写法,熟记常用词汇和句型。
Ø写作导析在平时的训练或考试中,图画、图表类作文出现的概率相对较小,所以考生不容易把握其写作技巧。
图画、图表类作文不像提纲作文一样会给出写作要点,考生需要根据图画和图表内容来寻找信息,确定文章的写作思路。
尽管图表作文与图画作文有很大的不同,但写作思路基本相同,可以归纳为以下三个方面:1.简要描述图画或图表的直观内容写好图画、图表类作文的第一步是解读图画内容或分析图表中的数据变化所反映出来的问题或趋势,把直观看到的图画或图表的内容简单地描述出来,简要叙述图画的内容或图表所揭示的信息。
这一部分简要概述即可,不需要展开。
2.分析图画或数据并阐述原因分析图画或数据变化的原因,并阐明理由,注意应使内容要点条理化、有序化。
3.提出解决问题的建议或揭示图画的寓意,得出结论和提纲作文一样,图画、图表类作文的最后也要总结全文的观点,根据图画或图表的内容给出相应的评价或者建议,这一点类似于社会问题型作文的结尾。
17疯狂英语(新策略)Ø素材导背一、高频词汇1.上升:rise、increase、go up2.下降:fall、drop、decrease、decline、reduce、lessen3.平稳:stable、steady、remain/maintain/keep/be the same as/similar to4.占:occupy、take up、account for5.而:while、however、whereas、on the other hand6.相比:by contract、on the contrary、likewise、be compared with7.总结:to sum up、in short、in conclusion二、高频句式(一)说明图中的内容1.The table/chart/diagram/graph shows that...这个表格/图表/示意图/曲线图表明……2.According to the table/chart/diagram/graph...根据表格/图表/示意图/曲线图……3.As is shown in the table/chart/diagram/graph...如表格/图表/示意图/曲线图所示……4.As can be seen from the table/chart/diagram/graph/figures...从表格/图表/示意图/曲线图/数字中可以看出……5.It can be seen that...可以看出……6.It is clear from the figures/statistics that...从数字/统计数据可以清楚地看出……7.It is apparent from the figures/statistics/table/chart/diagram/graph that...从这些数字/统计数据/表格/图表/示意图/曲线图中可以明显看出……8.In recent years,there has been rapid growth/development in the area of...近年来,……区域有了很大的发展。
图表作文思路
一、表格图图表作文的写作要点1横向比较。
介绍横向各个数据的区别,变化和趋势2不需要将每一个数据分别说明,突出强调数据最大值和最小值3最对比时要总结出数据对比最悬殊的和最小的二、曲线图图表作文的写作要点1极点说明。
即,对图表当中最高的,最低的点要单独进行说明2趋势说明。
即,对图表当中曲线的连续变化进行说明,如上升,下降,波动,持平3交点说明。
即,对图表当中多根曲线的交点进行对比说明三、饼状图图表作文的写作要点1介绍各扇面及总体的关系2各个扇面之间的比较,同类扇面在不同时间,不同地点的比较3重点突出特点最明显的扇面:最大的,最小的,互相成倍的四、综合图图表作文的写作要点1不求甚解,不拘泥于细节2分门别类,分段落详细介绍各个图表3不画蛇添足,主观臆断或猜测图表之间的关系以上就是这四类图表作文的写作要点介绍,对于各个图表的特点和描写的重点的不同进行了对比,大家可以在备考图表作文考试的时候,提前进行适当的参考和借鉴。
英语四级图表作文讲解及参考范文图表作文也是四(六)级考试中常见,而且被认为是一种较难的作文形式。
图表作文就是把非文字信息(通常为各种图表表示的数字信息等)转换成文字信息的一种作文。
它要求我们用文字来描述非文字性的图表或对图表显示的关系作解释说明。
第一节图表作文的出题形式和写作要领一、图表作文常见出题形式图表作文一般在题目中给出作文的标题和一个或几个统计表格、圆形图、曲线图或条形图,有时还用英文或中文提纲的形式给出提示,要求我们:1)用文字描述图表,客观解释图表中所传递的信息,并找出某种规律或趋势; 2)就图表中所反映的某种趋势或问题分析其原因或后果。
图表作文着重说明事实,常常是通过对图表中所反映的具体数据的说明、分析、比较,对某种事物或现象的事实或变化情况等加以说明,并提出结论或看法。
因此,图表作文常常采用议论文体的写作方法。
写好图表作文,关键在于能否读懂图表中所提供的信息,把握各信息间的联系,用准确流畅的语言把这一信息表达出来,并就这一信息发表自己的看法。
图表作文写作指南
图表作文写作指南写作指南:图表作文图表作文是在文章中使用图表来解释、分析和说明数据,以更清晰地展示信息和结论。
在写作这类作文时,有一些关键点和步骤可以帮助你组织思路并有效地传达你要表达的信息。
以下是图表作文的写作指南,包括准备、写作和审查阶段,每个阶段涉及的关键点和步骤:准备阶段:1. 仔细阅读题目和图表:仔细理解题目并观察图表的数据,包括数据类型、时间范围和单位等。
2. 理解图表的主要内容:图表通常包含主要趋势、变化和关系。
注意图表中的最大值、最小值和重要变化点。
3. 组织信息:将图表中的数据和趋势进行分类和排序,找到其中的相关性和区别。
写作阶段:1. 引言:简要描述图表的主题,并指出你要解释或分析的主要趋势和变化。
这是给读者提供全局视图的一部分。
2. 主体段落:根据图表中的数据、趋势和关系,组织你的主要观点和论据。
每个主体段落都应该专注于一个特定的方面或变化。
a. 描述数据和趋势:使用清晰的语言描述图表中的数据和趋势。
强调重要数字和变化点。
b. 分析原因和结果:解释导致数据和趋势的可能原因,并分析可能的结果和影响。
c. 进行比较和对比:将不同的数据进行比较和对比,强调相似之处和差异。
d. 用例子和证据支持观点:用例子、事实和数据支持你的观点和结论。
e. 使用合适的连接词:使用适当的连接词和短语,如"moreover"、"in addition to"、"on the other hand" 等,使你的论述连贯流畅。
3. 结论:总结你的观点和结论,强调图表中的关键变化和趋势。
对图表可能的局限性进行讨论,提出可能的解决方案或预测。
审查阶段:1. 检查语法和拼写错误:审查你的文章,确保没有语法和拼写错误。
这可以通过使用语法和拼写检查工具来帮助你。
2. 检查数据和数字:确认你引用的数据和数字准确无误。
如果可能,可以重新计算或交叉验证数据。
3. 重新检查结构和逻辑:再次检查你的段落结构和论证的逻辑性。
图表作文写作要点

二、图表种类
3.柱状图(bar chart) 纵横推论:纵坐标一般为数据,横坐标一般 是年代,抓住首尾两端数据,中间年代点到 为止。 4.曲线图(graph, chart, diagram) 考察图表数据及术语是否表达到位。
三、写作流程
1.观察图表数据变化,结合主题,确定典型 数据,如最高点、最低点、骤升骤降的时 间变化范围,选取典型数据。 2.确定这种变化与主题的必然联系,拓展思 维确定出二至三条原因。 3.预测发展趋势或提出建议或展望解决问题 后的美好前景。
一、写作要点
表格和图表题写作一般采用一般现在时,但如果图 表给出了具体时间参照,考生则应对时态进行相应 的调整。 表格和图表题型要求考生使用一些固定的句型和表 达法,考生应对此融会贯通。 列出各段的主题句。考生可以根据所给提纲或已知 信息列出每一段的主题句,为全文的展开铺平道路。 严格围绕主题句展开段落。 检查与修改。表格与图表写作的检查与修改应着重 检查文章中所列举的信息是否与图表所显示的信息 一致。
四、图表术语
6.剧烈/显著/明显 (1) dramatically, sharply, considerably, rapidly, suddenly, greatly, alarmingly, significantly, enormously, steeply, massively, incredibly, hugely, amazingly, substantially (2) at an alarming rate, by leaps and bounds, in big leaps, by a massive leap, by a wide margin 7.缓慢/逐渐 (1) gradually, steadily, slightly, gently, marginally, slowly, moderately (2) in a moderate way, by the least amount 8.数据 figure, statistic, number, amount, quantity, percent, percentage, proportion
写作指导(4) 图表作文
图表作文是近年来高考常考的题型之一。图表作文的体裁多为议 论文、应用文和说明文,内容多涉及前后变化对比、正反观点对比或 产品介绍等。要求考生通过数据、文字内容分析,系统准确地表达出 图表含义,并得出令人信服的结论。
一、图表作文的命题形式 1.表格式 将统计的数据或被说明的对象直接用表格形式体现出来,即统 计表。这类题型一般以说明文和议论文居多,往往是介绍、说明某 种情况或辩论某种观点、看法,但有时也可能是记叙文。 2.图像式 可分为以曲线形式表示数据变化的线形图、以条形形式表示数 据大小或数量之间差异的条形图,以圆内扇形面积的大小表示总体 中部分结构变化的圆形图等。这类题型一般以说明文居多,是一些 关于生产、销售、发展进程等各种项目统计的示意图。
假设你是李华,正在英国牛津参加短期的语言培训,计划星期 天去伦敦旅游。互联网上的一则广告引起了你的注意,但一些具体 信息不明确(箭头所指内容)。请给该旅行社发一封电子邮件,询问 有关情况。
注意:1.词数100左右,信的格式已为你写好; 2.可根据内容要点适当增加细节,以使行文连贯; 3.参考词汇:牛津Oxford;费用fee。 Dear Sir/Madam, ________________________ Yours, Li Hua 案例分析⊙ 这是一篇典型的图表式作文,要求写一封电子邮件,询问旅行社 有关一则广告的情况。细读图表和文字提示可知本文是一篇应用文, 时态以一般现在时为主,人称为第一人称。本文内容要点包括:开头 语;学生票价;费用是否包含景点门票、午餐;返回牛津的时间;是 否有购物时间等,并稍加评论。
二、图表作文的应试策略 1.审读图表前的文字说明,弄清图表的性质,做到“四确定”。 首先,确定文章的体裁;其次,确定文章的结构;再次,确定文章的 时态;最后,确定文章的人称。 2.审读图表后的要求,寻找做题规律,要注意以下几个方面: (1)词数:100左右。 (2)开头或结尾已给出,这就要求考生首先不能另行开头或结尾; 其次,要细读所给语句的人称、时态和语言的表达风格,力求前后一 致。 (3)内容完整,即要点齐全,写作时要注意详略得当和准确全面。
图表作文的写作方法

图表作文的写作方法一、教学内容本节课的教学内容选自人教版初中英语八年级上册第三单元,主题是“图表作文的写作方法”。
具体内容包括:如何观察图表、分析图表、提取信息、组织语言以及如何按照时间、空间、逻辑顺序进行叙述。
二、教学目标1. 学生能够熟练运用所学的图表作文写作方法,独立完成一篇关于图表的作文。
2. 学生能够通过观察图表,提取关键信息,并能够用英语进行表达。
3. 学生能够通过写作练习,提高自己的观察能力、思维能力和语言表达能力。
三、教学难点与重点重点:学生能够掌握图表作文的写作方法,并能够独立完成一篇作文。
难点:学生能够准确地观察图表,提取关键信息,并用英语进行表达。
四、教具与学具准备教具:PPT、图表、作文评分标准学具:笔记本、文具盒、教科书五、教学过程1. 导入:教师通过展示一张有趣的图表,引发学生对图表作文的兴趣,然后简要介绍本节课的教学内容。
2. 讲解:教师通过PPT展示图表作文的写作方法,包括观察图表、分析图表、提取信息、组织语言等步骤,并给出具体实例。
3. 练习:学生根据教师提供的图表,独立完成一篇作文。
教师在学生写作过程中提供必要的帮助和指导。
4. 展示与评价:学生展示自己的作文,教师根据作文评分标准进行评价,给出意见和建议。
六、板书设计图表作文写作方法:1. 观察图表2. 分析图表3. 提取信息4. 组织语言七、作业设计图表:我国近年来互联网使用情况2. 答案:In recent years, the use of the Internet in our country has been increasing rapidly. According to the chart, in 2010, the Internet penetration rate was around 40%, and 2020, it had reached 70%. This indicates that more and more people are using the Internet in our country.The chart also shows that the main users of the Internet are young people aged 1625. They account for more than 60% ofthe total Internet users. This may be because young people are more willing to accept new things and are more skilled in using digital devices.In addition, the chart reveals that the main activities people engage in online are browsing news, playing games, and social networking. Browsing news accounts for the largest proportion, reaching 40%, followed gaming and social networking, each accounting for around 20%.八、课后反思及拓展延伸课后反思:本节课通过展示有趣的图表,引导学生观察、分析、提取信息,并运用所学的写作方法进行作文练习。
图表作文写作指导

写作基本步骤
1. 2. 3. 4. 5. 审题- 确定语言点并标记 确定基调-作文段落结构+总体时态语态 对部分句子进行预写 写作 回读
图表作ห้องสมุดไป่ตู้写作指导
图表作文的结构通常是三段式: 第一段分析图表中的数据变化反映出的 问题或趋势,简要概述图表所揭示的信息; 第二段分析原因; 第三段提出解决问题的办法或建议。 写作时注意直截了当、尽快入题,适当加入 自己的议论,力争做到观点明确,不要拐弯 抹角,拖泥带水,使人读后一头雾水。
重点注意的问题: 1. 文章应包括图表所示内容,但不是全部写 到;叙述调查结果时要避免重复使用百分比; 2. 最重要的是要有表明自己观点的句子;
1.根据下面曲线图,以Car Explosion in China为 题,描述我国近10年来私人拥有小汽车情况, 说明人们生活的水平的变化和你的看法。短 文开头已给出,不计入总词数。词数:120150左右。
As is vividly described in the table above, great changes in car ownership have taken place in China over past decade. The number of private cars has accordingly increased nearly 7 times from more than 2 million in 1996 to over 14 million in 2006. What's the reason? There are two main factors for these changes. To begin with,……What's more,…… In my view,……
大学英语四级考试---图表作文写作方法

图表题的写作逻辑结构:
Paragraph I:(1)概括描述图表:趋势描写; (2)具体描述图表:必要数据支持(细 节性)。
Paragraph II:(1)提出自己理由和观点(本段主题句); (2)细节性分论点(主要是原因,用于支持 自己的观点,至少两点)。
Paragraph III:(1)预测未来和提出解决方法; (2)总结全文和表达作者自己观点。
图表中的数据(Data)具体表达法
数据(Data)在某一个时间段固定不变:fixed in time
在一系列的时间段中转变:changes over time 持续变化的data在不同情况下: 增加:increase / raise / rise / go up … 减少:decrease / grow down / drop / fall … 波动: rebound / wave … 稳定:remain stable / stabilize / level off …
相关常用词组
1、文章开头
图表类型:table, chart, diagram, graph,
column chart, pie chart …
描述:show, describe, illustrate, can be seen
from, clear, apparent, reveal, represent
The figures in the chart deny the claim that knowledge is useless and well demonstrate that education pays. Generally speaking, higher educational degrees holders have received a more systematic training in knowledge and skills and thus a better over-all development. With the advancement of science and the adjustment of industrial structure, quite a few high-tech industries emerge overnight, which leads to a soaring demand of a high-quality workforce. It is natural that people with bachelor’s or higher degrees have a better chance to be hired in highlevel positions and get larger pay packets, while those with a lower level of education cannot get a good pay and may be replaced any time due to the fact that their jobs are easy and can be done by average people.
图表类作文写作指导 Word 文档
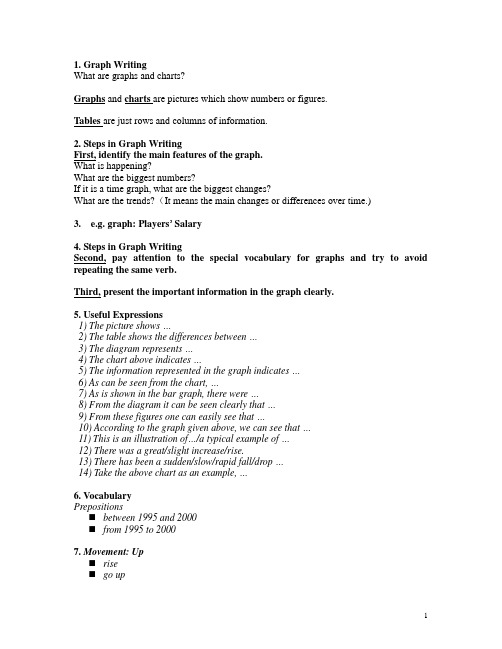
1. Graph WritingWhat are graphs and charts?Graphs and charts are pictures which show numbers or figures.Tables are just rows and columns of information.2. Steps in Graph WritingFirst, identify the main features of the graph.What is happening?What are the biggest numbers?If it is a time graph, what are the biggest changes?What are the trends?(It means the main changes or differences over time.)3. e.g. graph: Players’ Salary4. Steps in Graph WritingSecond, pay attention to the special vocabulary for graphs and try to avoid repeating the same verb.Third, present the important information in the graph clearly.5. Useful Expressions1) The picture shows …2) The table shows the differences between …3) The diagram represents …4) The chart above indicates …5) The information represented in the graph indicates …6) As can be seen from the chart, …7) As is shown in the bar graph, there were …8) From the diagram it can be seen clearly that …9) From these figures one can easily see that …10) According to the graph given above, we can see that …11) This is an illustration of…/a typical example of …12) There was a great/slight increase/rise.13) There has been a sudden/slow/rapid fall/drop …14) Take the above chart as an example, …6. VocabularyPrepositions⏹between 1995 and 2000⏹from 1995 to 20007. Movement: Up⏹rise⏹go up⏹increase⏹grow8. Movement: Down⏹fall⏹decline⏹drop⏹decrease⏹sink⏹go down9. Strong Words (Use them carefully!)⏹shoot up⏹rocket⏹surge⏹fall⏹plummet⏹plunge10. Adverbsslightly a lota little sharply gently suddenly gradually steeply steadily11. No Movement⏹remain steady⏹remain constant⏹remain stable⏹are unchanged⏹do not change⏹stabilize12. Tops and Bottoms⏹reach a peak⏹peak⏹reach their highest level⏹fall to a low⏹sink to a trough⏹reach a bottom13. (数量、比例等)占,构成account formake up14. Vocabulary TipsDon't repeat verbs.Before you start to write, make a list of synonyms (words with the same meaning)15. Graph WritingWrite a composition entitled “Causes of Fire” based on the following graph.16. an example17. Writing PracticeWrite a composition entitled “Leading Causes of Road Accidents in China”based on the following graph.18. You may write it in three paragraphs:(1) introduces the causes;(2) report the information given in the graph;(3) conclude the composition by giving some suggestions.。
图表作文写作指南
图表作文写作指南图表作文写作指南表格(Table)可以使大量数据系统化,便于阅读、比较。
表格常由标题(Title)、表头(Boxhead)(表格的第一行)、侧目(Stub)(表格左边的第一列)和主体(Body)部分(表格的其余部分)等部分组成。
图作文图作文又可分为三种:圆形图作文、曲线图作文和条状图作文。
(1)圆形图作文圆形图(Pie chart)也称为饼状图或圆面分割图。
圆形图因为比较形象和直观,各部分空间大小差别容易分辨,所以常用来表示总量和各分量之间的百分比关系。
整个圆表示总量,楔形块表示分量。
有时圆形图还有数值表,两者结合可把各分量表示得更准确、清楚。
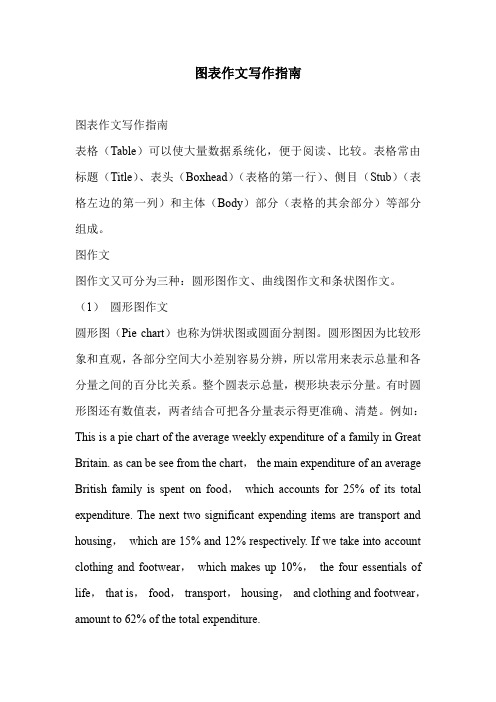
例如:This is a pie chart of the average weekly expenditure of a family in Great Britain. as can be see from the chart,the main expenditure of an average British family is spent on food,which accounts for 25% of its total expenditure. The next two significant expending items are transport and housing,which are 15% and 12% respectively. If we take into account clothing and footwear,which makes up 10%,the four essentials of life,that is,food,transport,housing,and clothing and footwear,amount to 62% of the total expenditure.(2)曲线图作文曲线图(Line graph)也称为线性图或坐标图。
看图图表作文写作指导

首先我们来看一下看图作文的写作步骤: 1) 描述图片.
运用较为简洁的语言在第一段中对图片进行描 述, 同时确立中心论点.
2) 对中心论点加以论证.
即回答 “为什么会产生这种现象或为什么会有 这种做法” 等问题. 方式方法同写议论文.
3) 结尾再重申一下中心论点.
要做到首尾呼应, 但不是对第一段的照抄照搬.
看图/图作文写作指导
在近年的高考中出现了看图和图表作文. 上海 卷中的图表作文主要是提供一幅图片而全国的 看图作文则是由多幅图片构成的且多为描述性 的. 图表作文则是多种多样的, 可以是表格, 曲线图, 也可以是柱状图等, 但无论图形怎样 变化, 它给予我们的就是一组数据, 通过数据 我们可以分析并做出一些结论.
u 附: 看图作文常用句式 1) As we can see from the picture,… 2) Let’s look at the picture. 3) When looking at the picture, I feel… 4) From the picture, we can see that… 5) The picture describes …
- 1、下载文档前请自行甄别文档内容的完整性,平台不提供额外的编辑、内容补充、找答案等附加服务。
- 2、"仅部分预览"的文档,不可在线预览部分如存在完整性等问题,可反馈申请退款(可完整预览的文档不适用该条件!)。
- 3、如文档侵犯您的权益,请联系客服反馈,我们会尽快为您处理(人工客服工作时间:9:00-18:30)。
图表作文写作指导(一)
编写人:诸sir
概念与要求:
图表作文的写作要求考生根据题目的少量提示性语言,结合所给的图表(一般是柱状图,块状图、线状图)中的形象、数据进行分析、研究、自我解读,进而对前景加以预测和发表个人看法。
语言要简明扼要,变化不大的几组数据可以一并带过,不必面面俱到。
图形种类及概述法:
泛指一份数据图表:a data graph/chart/diagram/illustration/table;饼图:pie chart;柱形图:bar chart 趋势曲线图:line chart / curve diagram;表格图:table;流程图或过程图:flow char 程序图:processing /procedures diagram
写作逻辑结构:
Paragraph I: (1) 概括描述图表:趋势描写;(2) 具体描述图表:必要数据支持(细节性)。
Paragraph II: (1) 提出自己理由和观点(主题句);(2) 细节性分论点(主要是原因,用于支持自己的观点,至少两点)。
Paragraph III: (1) 提出解决方法并预测未来; (2) 总结全文和表达作者自己观点
写作实例:
以下是某消费者报对我国2006—2009年手机拥有量变
化所做的统计,请根据以下图表和提示为某英文报写一篇报
道,并阐述手机给人们生活带来的利和弊。
注意:1. 120词左右 2. 参考词汇:短信: short message;
上网:surf the Internet 电磁辐射:radiation
Sample Writing:
As can be seen from the chart, great changes have been taking place in the ownership(所有权) of mobile phones in China. At the end of 2006 there were 30 million mobile phones. By year 2009, the number has reached up to 100 million.
There are two main factors leading to this change. For one thing, People have found mobile phones very convenient. They can get in touch with each other whenever and wherever they like. For another, there are many different functions for different needs, such as sending short messages and surfing the Internet. However, it may also bring us some trouble. For example, you will have to pay for a wrong number, and the radiation from the phone may do harm to our health.
In my opinion, in spite of some disadvantages, the number of people having mobile phones is still increasing steadily.
首段用语套句:
1. From the chart/diagram/figure/graph/illustration/statistics (统计)/table,it’s not difficult to see/find that….
2. According to/ As is shown in/As can be seen from the chart / diagram / table, …
3. The chart/ table……s hows / describes / suggests / indicates (表明) /illustrates (说明) /compares/
summarizes(总结) the number of…/the proportion (份额,比例) of.../ information on .../data (数据) on ...
4. It can be seen from / It is obvious (或clear/ apparent (明显的)) from the chart / statistics… that...
5. According to the statistics, ……percent of the people have……problems, of whom _____ percent are
suffering from _____ problems , such as ________ and so on .
首段模板:
As is shown/indicated/illustrated by the figure/percentage in the table/graph /picture/ chart, the number/amount of ________has been on the rise/decrease (goes up/ increases / drops/ decreases) significantly/dramatically(引人注目地)/steadily(稳定地) from _______ (in 甲时间) to ________ (in 乙时间). From the sharp/notable/obvious/evident decline/rise in the chart/……, it goes without saying that _______.
请按衡水中学标准抄/默写上面模板或范文:————————————————————————————————————————————————————————————————————————————————————————————————————————————————————————————————————————————————————————————————————————————————————————————————————————————————————————————————————————————————————————————————————————————————————————————————————————————————————————————————————————————————————————————————————————实战演练:请就下面的图表内容加以解读,并写出第一段的内容:
下面的柱状图(bar chart)显示了不同年龄段孩子的心理健康状况。
根据下图信息,请以“ Psychological problems of children ”为题,用英语写一篇100~120词的短文。
要求如下:
1、简要描述图中信息;
2、说明原因(学业压力、缺乏引导等);
3、谈谈你的看法。
注意:文章的标题和开头已给出(不计入词数)
As is shown in the bar chart, ______________________________________ ____________________________________________________________________ ____________________________________________________________________ ____________________________________________________________________ ____________________________________________________________________ ____________________________________________________________________。