2009年数学建模优秀论文[1]
2009年大学生数学建模竞赛A题一等奖论文

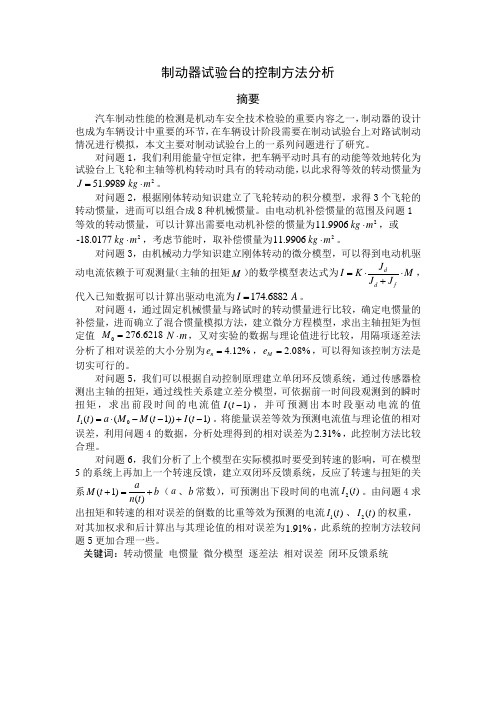
制动器试验台的控制方法分析摘要本文围绕控制器试验台的控制方法问题进行计算与分析,并针对双分流加载式制动器试验台的计算机控制方法进行了设计与评价与改进。
对问题一,利用能量守恒定律,把车辆平动时具有的动能等效地转化为试验台上飞轮和主轴等机构转动时具有的转动动能,得出等效的转动惯量为252m kg ⋅对问题二,通过对不同飞轮的组合,可以产生8种方案,根据所给的条件,对于问题1中得到的等效的转动惯量252m kg ⋅,电动机的补偿惯量有两种方案:2m 12kg ⋅和2m 18kg -⋅。
对问题三,要求建立电动机驱动电流依赖于可观测量的数学模型。
题目中已说明可观测量为主轴的瞬时转速和瞬时扭矩。
首先,充分分析题目的各个量的关系,初步建立出分步模型,然后简化该模型,建立电流分别与两个观测量的数学模型。
并根据该模型和问题一、二的结果,对问题三的题目进行分析求解,得到驱动电流是174.8A 。
对问题四,首先我们根据题目中指定的评价控制方法优劣的指标建立评价模型:以模拟负载精度为评价指标。
然后建立一般积分模型,通过数据分析与处理,基于对离散数据的处理方法,我们采用以和式代替积分,利用改变后的模型,求解出制动器在试验台制动过程所消耗的能量49296.62焦。
在利用评价模型对该方法进行评价,模拟负载精度为5.4743%,效果相对较好。
对问题五,我们先由给出的一组观测量,建立近似的计算模型,估算出下一时刻的瞬时转速,该瞬时转速存在较大误差,为减小这一段路试时与试验台上的能量差,我们再用能量守恒的方法,建立模型,求出下一阶段的瞬时扭矩。
再根据问题三的模型,由该扭矩算出相应时刻的电流值,达到预测电流的目的。
我们根据第四问中的基本条件和一组观测量,利用MATLAB 进行模拟,得到较好的控制效果。
对问题六,分析计算机的调整过程我们发现,计算机的调控是一种闭环回馈调节,即计算机输出的信号会对被控系统产生影响;同时反过来计算机又根据被控系统此时的变化(或运行状态)来决定下一次控制信号的输出,根据这一特点我们决定采用PID 模型进行控制,要想获得好的控制效果,关键是三系数p k ,I k ,D k 的设定,所以我们采用BP 神经网络来对,动态的调整参数的值,使其随着系统状态而不断学习改变,从而大大提高了PID 控制的可靠性。
数学建模竞赛优秀大学生论文

数学建模竞赛优秀大学生论文随着科学技术的高速发展,数学的应用价值越来越得到众人的重视,因此数学建模也被逐渐的引起重视了。
下面是店铺为大家整理的数学建模优秀论文,供大家参考。
数学建模优秀论文篇一:《数学建模用于生物医学论文》1数学建模的过程1.1模型准备首先要了解实际背景,寻找内在规律,形成一个比较清晰的轮廓,提出问题。
1.2模型假设在明确目的、掌握资料的基础上,抓住问题的本质,舍弃次要因素,对实际问题做出合理的简化假设。
1.3模型建立在所作的假设条件下,用适当的数学方法去刻画变量之间的关系,得出一个数学结构,即数学模型。
原则上,在能够达到预期效果的基础上,选择的数学方法应越简单越好。
1.4模型求解建模后要对模型进行分析、求解,求解会涉及图解、定理证明及解方程等不同数学方法,有时还需用计算机求数值解。
1.5模型分析、检验、应用模型的结果应当能解释已存的现象,处理方法应该是最优的决策和控制方案,所以,对模型的解需要进行分析检验。
把求得的数学结果返回到实际问题中去,检验其合理性。
如果理论结果符合实际情况,那么就可以用它来指导实践,否则需再重新提出假设、建模、求解,直到模型结果与实际相符,才能进行实际应用。
总之,数学建模是一项富有创造性的工作,不可能用一些条条框框的规则规定的十分死板,只要是能够做到全面兼顾、能抓住问题的本质、最终检验结果合理,都是一个好的数学模型。
2数学建模在生物医学中的应用2.1DNA序列分类模型DNA分子是遗传信息存储的基本单位,许多生命科学中的重大问题都依赖于对这种特殊分子的深入了解。
因此,关于DNA分子结构与功能的问题,成为二十一世纪最重大的课题之一。
DNA序列分类问题是研究DNA分子结构的基础,它常用的方法是聚类分析法。
聚类分析是使用数据建模简化数据的一种方法,它将数据分成不同的类或者簇,同一个簇中的数据有很大的同质性,而不同的簇中的数据有很大的相异性。
在对DNA序列进行分类时,需首先引入样品变量,比如说单个碱基的丰度、两碱基丰度之比等;然后计算出每条DNA序列的样品变量值,存入到向量中;最后根据相似度度量原理,计算出所有序列两两之间的Lance与Williams距离,依据距离的远近进行分类。
自-2009年全国大学生数学建模大赛D题优秀论文

会议筹备优化模型摘要能否成功举办一届全国性的大型会议,取决于会前的筹备工作是否到位。
本文为某会议筹备组,从经济、方便、满意度等方面,通过数学建模的方法制定了一个预订宾馆客房、租借会议室和租用客车的合理方案。
首先,通过对往届与会情况和本届住房信息有关数据的定量分析,预测到本届与会人数的均值是662人,波动范围在640至679之间。
拟预订各类客房475间。
其次,为便于管理、节省费用,所选宾馆应兼顾客房价位合适,宾馆数量少,距离近,租借的会议室集中等要素。
为此,依据附件4,借助EXCEL计算,得出7号宾馆为10个宾馆的中心。
然后,运用LINGO软件对选择宾馆和分配客房的0-1规划模型求解,得出分别在1、2、6、7、8号宾馆所预订的各类客房。
最后,建立租借会议室和客车的整数规划模型,求解结果为:某天上下午的会议,均在7、8号宾馆预订容纳人数分别为200、140、140、160、130、130人的6个会议室;租用45座客车2辆、33座客车2辆,客车在半天内须分别接关键词:均值综合满意度EXCEL0-1规划LINGO软件1.问题的提出1.1基本情况某一会议服务公司负责承办某专业领域的一届全国性会议。
本着经济、方便和代表满意的原则,从备选10家宾馆中的地理位置、客房结构、会议室的规模(费用)等因素出发,同时,依据会议代表回执中的相关信息,初步确定代表总人数并预定宾馆和客房;会议期间在某一天上下午各安排6个分组会议,需合理分配和租借会议室;为保证代表按时参会,租用客车接送代表是必需的(现有45座、36座、33座三种类型的客车,租金分别是半天800元、700元和600元)。
1.2相关信息(见附录)附件1 10家备选宾馆的有关数据。
附件2 本届会议的代表回执中有关住房要求的信息(单位:人)。
附件3以往几届会议代表回执和与会情况。
附件4 宾馆平面分布图。
1.3需要解决的问题1.预测本届会议参会人数,确定需要预定的各类客房的总量;2.选择宾馆,预定客房;3.预订会议室以及制定租车方案和绘制行车路线。
优秀的数学建模论文范文(通用8篇)
优秀的数学建模论文范文第1篇摘要:将数学建模思想融入高等数学的教学中来,是目前大学数学教育的重要教学方式。
建模思想的有效应用,不仅显著提高了学生应用数学模式解决实际问题的能力,还在培养大学生发散思维能力和综合素质方面起到重要作用。
本文试从当前高等数学教学现状着手,分析在高等数学中融入建模思想的重要性,并从教学实践中给出相应的教学方法,以期能给同行教师们一些帮助。
关键词:数学建模;高等数学;教学研究一、引言建模思想使高等数学教育的基础与本质。
从目前情况来看,将数学建模思想融入高等教学中的趋势越来越明显。
但是在实际的教学过程中,大部分高校的数学教育仍处在传统的理论知识简单传授阶段。
其教学成果与社会实践还是有脱节的现象存在,难以让学生学以致用,感受到应用数学在现实生活中的魅力,这种教学方式需要亟待改善。
二、高等数学教学现状高等数学是现在大学数学教育中的基础课程,也是一门必修的课程。
他能为其他理工科专业的学生提供很多种解题方式与解题思路,是很多专业,如自动化工程、机械工程、计算机、电气化等必不可少的基础课程。
同时,现实生活中也有很多方面都涉及高数的运算,如,银行理财基金的使用问题、彩票的概率计算问题等,从这些方面都可以看出人们不能仅仅把高数看成是一门学科而已,它还与日常生活各个方面有重要的联系。
但现在很多学校仍以应试教育为主,采取填鸭式教学方式,加上高数的教材并没有与时俱进,将其与生活的关系融入教材内,使学生无法意识到高数的重要性以及高数在日常生活中的魅力,因此产生排斥甚至对抗的心理,只是在临考前突击而已。
因此,对高数进行教学改革是十分有必要的,而且怎么改,怎么让学生发现高数的魅力,并积极主动学习高数也是作为教师所面临的一个重大问题。
三、将数学建模思想融入高等数学的重要性第一,能够激发学生学习高数的兴趣。
建模思想实际上是使用数学语言来对生活中的实际现象进行描述的过程。
把建模思想应用到高等数学的学习中,能够让学生们在日常生活中理解数学的实际应用状况与解决日常生活问题的方便性,让学生们了解到高数并不只是一门课程,而是整个日常生活的基础。
数学建模优秀论文

(数学建模B题)北京水资源短缺风险综合评价参赛队员:甘霖(20093133,数学科学学院)李爽(20093123,数学科学学院)崔骁鹏(20091292,计算机科学学院)参赛时间:2011年4月30 - 5月13日承诺书我们仔细阅读了中国大学生数学建模竞赛的竞赛规则. 我们完全明白,在竞赛开始后参赛队员不能以任何方式(包括电话、电子邮件、网上咨询等)与队外的任何人(包括指导教师)研究、讨论与赛题有关的问题。
我们知道,抄袭别人的成果是违反竞赛规则的, 如果引用别人的成果或其他公开的资料(包括网上查到的资料),必须按照规定的参考文献的表述方式在正文引用处和参考文献中明确列出。
我们郑重承诺,严格遵守竞赛规则,以保证竞赛的公正、公平性。
如有违反竞赛规则的行为,我们将受到严肃处理。
我们参赛选择的题号是(从A/B/C/D 中选择一项填写):B所属学校(请填写完整的全名):黑龙江大学参赛队员:1.甘霖2、李爽3、崔骁鹏日期:2011 年5月12日目录1.摘要 -----------------------------------------42.关键词 ---------------------------------------43.问题重述 ---------------------------------------54.模型的条件和假设 ------------------------------55.符号说明 --------------------------------------56.问题的分析及模型的建立 ------------------------66.1问题一的分析与求解 -----------------------66.2问题二的分析与求解 -----------------------106.3问题三的分析与求解 -----------------------186.4问题死的求解 -----------------------------217.模型的评价 ------------------------------------238.参考文献 --------------------------------------239.附录 ------------------------------------------23北京水资源短缺风险综合评价甘霖﹑李爽﹑崔骁鹏【摘要】本文针对水资源短缺风险问题求出主要风险因子,并建立了水资源短缺风险评价模型,以北京为实例,做出了北京1979年到2009年的水资源短缺风险的综合风险评价,划分出了风险等级,以评价水资源短缺风险的程度。
2009年研究生数学建模竞赛优秀论文选-《我国城镇登记失业率影响因素的探讨》-36页
全国第六届研究生数学建模竞赛题 目城镇登记失业率影响因素的探讨摘 要:本文就城镇登记失业率的相关问题,建立模型解决了寻找影响因素以及影响因素和城镇登记失业率关联的问题,并利用所建模型对未来我国的就业前景作出仿真预测,得出了相应结论。
首先,根据计量经济学的滞后变量模型和格兰杰因果关系检验理论,利用 Eviews 软件对相关统计数据进行分析,确定了影响城镇登记失业率的八个主要因素。
针对第二个问题,本文利用主成分分析法,建立了各影响因素与城镇登记失业率之间相互关联的模型。
然后,通过研究相关理论,对城镇登记失业率和各影响因素进行协整分析并建立了基于序列相关性的误差修正模型 ECM :∆y = β + β ∆x +(β-1)(y - β1 + β3x ) +ε t 0 1 t 21- β2 t -1 t针对第三个问题,本文根据不同地区、不同产业表现出的不同特征,以河南省为例,引入各产业的劳动生产率 L i 和结构偏离度 P i ,就当地的产业结构和就业结构的关系问题建立向量误差修正模型 VEC ,进一步揭示了两者之间在一定时期内的协整关系。
针对第四个问题,作为对比,本文首先利用了灰色预测模型对未来两年我国就业前景进行了预测。
然后,利用所建立的 ECM 模型对就业前景作了进一步仿真并得出相应结论。
最后,结合模型所得到的结论和实际情况,就减少城镇登记失业率提出了我们的咨询建议。
关键词:格兰杰因果关系检验 主成分分析法 误差修正模型 ECM 灰色预测参赛队号 队员姓名参赛密码(由组委会填写)一、问题重述失业、经济增长和通货膨胀为宏观经济中特别重要的三个指标,就业(或者失业)是社会、国民经济中极其重要的问题。
按照已有研究,就业可以定义为三个月内有稳定的收入或与用人单位有劳动聘用关系。
失业的统计方法各国差异较大,我国采用城镇登记失业率,是指城镇登记失业人数同城镇从业人数与城镇登记失业人数之和的比。
其中,城镇登记失业人员是指有非农业户口,在一定的劳动年龄内(16 岁以上及男50 岁以下、女45 岁以下),有劳动能力,无业而要求就业,并在当地就业服务机构进行求职登记的人员。
2009年数学建模竞赛C题全国一等奖论文

2009高教社杯全国大学生数学建模竞赛编号专用页赛区评阅编号(由赛区组委会评阅前进行编号):赛区评阅记录(可供赛区评阅时使用):评阅人评分备注全国统一编号(由赛区组委会送交全国前编号):全国评阅编号(由全国组委会评阅前进行编号):卫星和飞船的跟踪测试摘要卫星和飞船对国民经济和国民建设有重要的意义,对卫星的发射和运行测控是航天系统的重要部分,理想状况下是对其进行全程跟踪测控。
本文通过建立空间直角坐标系,得到了卫星或飞船飞行的参数方程,并利用Matlab软件模拟出卫星飞行的轨迹图,借助图形,对卫星和飞船的跟踪测控问题进行建模,得到了在不同情况下对卫星或飞船进行全程跟踪测控所需建立测控站数目的一般方法。
问题1:在所有测控站都与卫星或飞船的运行轨道共面的情况下,采用CAD制图法和解析三角形两种方法,分别计算出在所有测控站都与卫星或飞船运行轨道共面的情况下至少应建立12个测控站才能对其进行全程跟踪测控。
问题2:通过建立空间直角坐标系,给出卫星或飞船的运行轨道的参数方程。
同时,验证了其运行轨道在地球上的投影轨迹为一关于赤道平面对称的环形带状区域。
最后,给出对卫星或飞船可能飞行区域进行全部覆盖所需建立测控站的模型。
问题3:对于陆地上的观测点,通过对“神舟七号飞船”相关信息查询,进行几何角度的和长度计算,得出观测点能观测到的区域约为s,再计算出飞船可能飞行的面积,通过进一步的优化与计算得出陆地上的观测点能观测的区域为18.67%.关键词:轨道星下点测控点相对运动优化一、问题重述卫星和飞船对国民经济和国民建设有重要的意义,对卫星的发射和运行测控是航天系统的重要部分,理想状况下是对其进行全程跟踪测控。
测控设备只能观测到所在点切平面以上的空域,实际上每个测控站的范围只考虑与地面成3度以上的空域。
往往要有很多个测控站联合测控任务。
问题1:在所有测控站都与卫星或飞船的运行轨道共面的情况下至少应建立多少个测控站才能对其进行全程跟踪测控?问题2:如果一个卫星或飞船的运行与地球赤道有固定的夹角,且在离地面为H的球面S上进行。
2009年全国大学生数学建模大赛C题优秀论文_共18页

卫星和飞船的跟踪测控摘要卫星和飞船在国民经济和国防建设中有着重要的作用,本文通过对卫星或飞船运行过程中测控站需要的数目进行求解,从而实现能够对卫星或飞船进行全程跟踪测控的目标。
对于问题一,由于测控站都与卫星运行轨道共面,且测控站的测控范围只考虑与地平面夹角3度以上的空域,所以,我们首先考虑将卫星或者飞船的运行轨道理想化成圆形,建立其与地球共心的圆形轨道模型,此时,运用几何知识和正弦定理计算出至少应建立12个测控站。
但是,在现实中卫星或飞船的轨道为椭圆形状,接着我们又给出了质点运行轨道为椭圆时的数学模型计算得出需要建立测控站数目的区间为12至16个。
问题二,我们利用每个测控站测控的锥形区域与卫星或飞船轨道曲面相交的圆的内接多边形来覆盖整个卫星轨道曲面,就可以将需要这样内接多边形的个数近似的看作需要建立测控站的最少个数,这里我们只给出内接正四边形和正六边形两种数学模型,此时,计算出需要测控站的最少数目分别为60和67个。
问题三,通过网络查询得到神舟七号的观测站位置和数目,以及飞船运行的倾角和高度等相关数据。
通过线性拟合我们发现测控站的位置近似符合正弦曲线。
最后,我们给出了模型优缺点的分析和评价,并提出了模型的改进的方向。
关键字:卫星或飞船的跟踪测控;圆形轨道模型;圆锥测控模型;测控站点的数目1、问题重述1.1 背景资料现代航天工业中卫星和飞船的测控设备只能观测到所在点切平面以上的空域,且在与地平面夹角3度的范围内测控效果不好,实际上每个测控站的测控范围只考虑与地平面夹角3度以上的空域。
在一个卫星或飞船的发射与运行过程中,往往有多个测控站联合完成测控任务,因此需要分析卫星或飞船的测控情况。
1.2 需要解决的问题问题一:在所有测控站都与卫星或飞船的运行轨道共面的情况下至少应该建立多少个测控站才能对其进行全程跟踪测控。
问题二:如果一个卫星或飞船的运行轨道与地球赤道平面有固定的夹角,且在离地面高度为H的球面S上运行。
2009年研究生数学建模竞赛优秀论文选-《110警车配置及巡逻方案》4-31页
全国第六届研究生数学建模竞赛题目110 警车配置及巡逻方案摘要:巡逻勤务是对社会治安进行动态管理的一种勤务方式,要求对社会面做到全时空控制。
110 警车在街道上巡弋,既能够对违法犯罪分子起到震慑作用,降低犯罪率,又能够增加市民的安全感,同时也加快了接处警时间,提高了反应时效,为社会和谐提供了有力的保障。
本文根据某一区域的数据地图,在满足所给要求D1、D2、D3 的情况下,给出求解警车配置及巡逻方案。
由于交叉点众多,导致线性方程组复杂难解,因此采用离散化策略,将地图细分为相邻点距离不超过 200 米图集。
对于问题一我们考虑它的静态状况,将此问题转化问P-中心问题,应用遗传算法求解。
我们得到满足D1 条件时该区最少需要配置 16 辆警车巡逻。
对于问题二我们给出了评价巡逻效果显著程度的有关指标。
而对于之后的问题,均牵扯巡逻问题,警车均为动态,我们采用贪婪策略来处理,得到了四种不同要求下的警车巡逻方案及其评价指标值。
最后根据我们的模型和我们的理解,对当前警车巡逻等方面提出了一些具有实际意义的建议。
关键词:巡逻方案;P-中心问题;遗传算法;贪婪策略参赛队号队员姓名参赛密码(由组委会填写)110警车配置及巡逻方案一、问题重述110 警车在街道上巡弋,既能够对违法犯罪分子起到震慑作用,降低犯罪率,又能够增加市民的安全感,同时也加快了接处警(接受报警并赶往现场处理事件)时间,提高了反应时效,为社会和谐提供了有力的保障。
考虑某城市内一区域,为简化问题,假定所有事发现场均在下图的道路上。
该区域内三个重点部位的坐标分别为:(5112,4806),(9126, 4266),(7434 ,1332)。
某城市拟增加一批配备有 GPS 卫星定位系统及先进通讯设备的 110 警车。
设110 警车的平均巡逻速度为 20km/h,接警后的平均行驶速度为 40km/h。
警车配置及巡逻方案要尽量满足以下要求:D1. 警车在接警后三分钟内赶到现场的比例不低于 90%;而赶到重点部位的时间必须在两分钟之内。
数学建模获奖论文(优秀范文10篇)11000字
数学建模获奖论文(优秀范文10篇)11000字数学建模竞赛从1992年始,到现如今已成为全国高校规模最大的基础性学科竞赛,也是世界上规模最大的数学建模竞赛。
本篇文章就为大家介绍一些数学建模获奖论文,供给大家欣赏和探讨。
数学建模获奖论文优秀范文10篇之第一篇:高中数学核心素养之数学建模能力培养的研究摘要:数学建模是一种比较重要的能力,教师在进行高中数学教学的过程中应该让学生们学习这种能力,这对于解决高中数学问题是比较有效的,而且对于学生们未来接受高等教育有更重要的意义。
教师在进行高中数学教学的过程中需要让学生们的能力得到锻炼,提升能力是教学的主要目的,学习知识是比较基础的教学目的,教师如果想让学生们的能力得到锻炼应该对教学方法进行更新,高中数学对于很多学生们来说都是比较困难的,所以教师应该不断更新教学方法,让学生们能理解教师的教学目的,而且找到适合自己的学习方法,这也是核心素养的基本内涵。
本文将对高中数学核心素养之数学建模能力培养进行研究。
关键词:高中数学; 核心素养; 数学建模; 能力培养; 应用研究;建模活动是一项比较有创造性的活动,学生们在学习的过程中一定要具备创新思维和自主学习能力,建模活动进行过程中可以让学生们独立,自觉运用数学理论知识去探索以及解决问题,构建模型解决实际问,教学活动中,让学生们的基础知识更加牢固、基本技能得到锻炼是最根本的目的。
学生们的运算能力以及逻辑思维能力也能在建模活动中得到锻炼,提升学生们的空间观念以及增强应用数学意识是延伸目的。
一、对数学建模的基本理解概述高中数学建模最简单的解释就是利用学生们学习过的理论知识来建立数学模型解决遇到的问题。
数学建模的基本过程就是对生活中或者课本中比较抽象问题解决的过程。
通过抽象可以建立刻画出一种较强的数学手段,通过运用数学思维也能观察分析各种事物的基本性质和特点。
学生们可以从复杂的问题中抽离出自己熟悉的模型,然后在利用好数学模型去解决实际问题基本就是事半功倍。
2009高教社杯全国大学生数学建模竞赛
承诺书我们仔细阅读了中国大学生数学建模竞赛的竞赛规则.我们完全明白,在竞赛开始后参赛队员不能以任何方式(包括电话、电子邮件、网上咨询等)与队外的任何人(包括指导教师)研究、讨论与赛题有关的问题。
我们知道,抄袭别人的成果是违反竞赛规则的, 如果引用别人的成果或其他公开的资料(包括网上查到的资料),必须按照规定的参考文献的表述方式在正文引用处和参考文献中明确列出。
我们郑重承诺,严格遵守竞赛规则,以保证竞赛的公正、公平性。
如有违反竞赛规则的行为,我们将受到严肃处理。
我们参赛选择的题号是(从A/B/C/D中选择一项填写): A我们的参赛报名号为(如果赛区设置报名号的话):所属学校(请填写完整的全名):三峡大学参赛队员(打印并签名) :1. 徐小美2. 马焱3. 曹帅指导教师或指导教师组负责人(打印并签名):日期: 2011 年 5 月 15日赛区评阅编号(由赛区组委会评阅前进行编号):编号专用页赛区评阅编号(由赛区组委会评阅前进行编号):全国统一编号(由赛区组委会送交全国前编号):全国评阅编号(由全国组委会评阅前进行编号):垃圾分类处理及清运方案摘要就生活中垃圾运输处理问题进行研究。
问题一中清运路线,垃圾清运路线优化中具有“垃圾产生分散性高,垃圾处理高度集中······”的特点通过对问题的分析和假设,建立目标函数,在这个函数中先不考虑环保因素,而将运输费用作为主函数处理使之形成非线性规划的数学模型,在运用软件进行优化求解。
在此问题中有垃圾产量处理和运输费用的累积计算问题。
因此我们的目标函数可以设为运输费用最少,而将每天的垃圾都会处理完作为其约束条件。
以运输车是否从一个小区到另外一个小区为决策变量,来建立运输费用最小的单目标非线性规划的数学模型。
利用Mathlab编程(具体程序见附录四)找出了方案一中大型设备的最佳安放位置坐标为(3108,4710),即在朗山二路和五号路交叉点附近。
2009年全国大学生数学建模A题优秀论文
制动器试验台的控制方法分析摘要汽车制动性能的检测是机动车安全技术检验的重要内容之一,制动器的设计也成为车辆设计中重要的环节,在车辆设计阶段需要在制动试验台上对路试制动情况进行模拟,本文主要对制动试验台上的一系列问题进行了研究。
对问题1,我们利用能量守恒定律,把车辆平动时具有的动能等效地转化为试验台上飞轮和主轴等机构转动时具有的转动动能,以此求得等效的转动惯量为51.9989J =2k g m ⋅。
对问题2,根据刚体转动知识建立了飞轮转动的积分模型,求得3个飞轮的转动惯量,进而可以组合成8种机械惯量。
由电动机补偿惯量的范围及问题1等效的转动惯量,可以计算出需要电动机补偿的惯量为11.99062k g m ⋅,或-18.01772k g m ⋅,考虑节能时,取补偿惯量为11.99062k g m ⋅。
对问题3,由机械动力学知识建立刚体转动的微分模型,可以得到电动机驱动电流依赖于可观测量(主轴的扭矩M )的数学模型表达式为d d fJ IK MJ J=⋅⋅+,代入已知数据可以计算出驱动电流为174.6882I =A 。
对问题4,通过固定机械惯量与路试时的转动惯量进行比较,确定电惯量的补偿量,进而确立了混合惯量模拟方法,建立微分方程模型,求出主轴扭矩为恒定值 0276.6218M =N m ⋅,又对实验的数据与理论值进行比较,用隔项逐差法分析了相对误差的大小分别为 4.12%ne =, 2.08%Me =,可以得知该控制方法是切实可行的。
对问题5,我们可以根据自动控制原理建立单闭环反馈系统,通过传感器检测出主轴的扭矩,通过线性关系建立差分模型,可依据前一时间段观测到的瞬时扭矩,求出前段时间的电流值(1)I t -,并可预测出本时段驱动电流的值10()((1))(1)I t a M M t I t =⋅--+-。
将能量误差等效为预测电流值与理论值的相对误差,利用问题4的数据,分析处理得到的相对误差为2.31%,此控制方法比较合理。
2009年数学建模A题论文解析

“制动器试验台的控制方法分析”评阅综述与参考解答方沛辰 吉林大学数学学院这是2009A 题,这道题目涉及了一些专业知识,但是作为理工科的大学生,大学物理和理论力学都是刚学过所涉及的知识都是熟悉的,就算不熟悉临时看也能搞明白的,只有我们这些年纪大的数学老师可能感到不适应。
为此介绍它们的关系如下:平动 转动路程 x 角度 θ速度 .v x = 角速度 .ωθ=加速度..a x = 角加速度 ..αθ=质量 m 转动惯量 2J r dm =⎰力 F ma = 力矩 M J α= 动能 212E mv = 动能 212E J α=功率W Fv==功率W Mω一、问题的来源与处理这道题目源自一个实际问题。
上世纪八十年代以前,我国还没有制动器试验台,这方面处于空白。
后来由吉林大学在1988年填补了这项国家空白,到现在已生产出至少有100多台各种各样的制动器试验台。
题目就是沿着试验台如何进行设计展开的。
制动器的本质是利用摩擦把动能转化为热能从而使车辆减速,换句话说制动器是能量转换部件。
谈到制动器的性能不得不涉及到温度、热量和制动器内部的压力、刹车片在不同温度下的摩擦系数等物理量。
制动器的性能实际就是对在不同温度下能量转换的效率的描述。
试验台是测量一个制动器性能的设备,实际使用的试验台都有温度、压力的测量值。
为了简化成一个赛题,题目中没有提到温度也没有改变正压力,即假设制动器内部的压力恒定。
显然在不同的温度下由于摩擦系数的改变制动力矩不是常量。
我们仅从制动器的外特性上考虑问题,即把制动器特性看做制动力矩是时间和已制动能量的函数,从而回避了制动器内部产生热量造成温升使得制动力矩下降即对内特性的正面研究,所以这是做了大幅度简化的实际问题。
我们仅从用电流驱动电动机产生扭矩辅助制动角度考虑同一架试验台做不同的制动试验的场合。
这样一来,制动器试验台研制中的核心问题就是电动机驱动电流的确定策略。
也是这道题目最后两问的问题。
2009 MCM A 一等奖论文
ign or Traffic Light ?S ign or Traffic LightThe problem we face is to give best traffic flow control strategies under different conditions. The objective we set to evaluate strategy’s quality of service (QOS) is average delay time, and the criterion for traffic condition evaluation is saturation.In this paper, we first sort out the traffic control forms and then use an algorithm to calculate the capacity proposed in Roundabouts: an Information Guide.For stop or yield sign controlled circular intersection, we also use the delay equation in Roundabouts: an Information Guide to draw up the delay-saturation curve.For traffic lights controlled circular intersection. We design a model which the intersection is working in two phases. In delay equation, we add delay caused by left-turning vehicles to the HCM2000 delay computing formula which only approximately stands for none turning vehicles’ delay. After this we use simplified Webster model to set the optimal cycle length for traffic lights. Then by utilizing optimization method, we can set green light time length for circular intersections to give the best performance under different conditions.To choose between sign controlled method and traffic lights controlled methods, we just simply compare two delay-saturation curves to figure out the threshold. When the traffic saturation is below this point, stop or yield sign controlling strategy is proposed, otherwise traffic lights should be used.Finally, we provide an optimal traffic control strategy for a specific circular intersection to illustrate our model. The choice we make is to use sign controlling method.1 IntroductionIn this age, as our human society is more civilized than ever before, people emphasize the value of life more than ever. Thus a well designed traffic control system take priority of people’s safety and efficiency. In the development of road transportation, different forms of intersection appears, here we design models for the traffic control of circular intersections.1)Circular IntersectionCircular intersection is an intersection with a circular shape, and usually, a central island. According to the book Roundabouts: an Informational Guide, circular intersections can mainly be classified into Rotaries, Neighborhood traffic circles and Roundabouts.R otaries are old-style circular intersections common to us prior to the 1960’s. This large diameter typically results in travel speeds within the circulatory roadway that exceed 50 km/h (30 mph). They typically provide little or no horizontal deflection of the paths of through traffic and may even operate according to the traditional “yield-to-the-right” rule, this means circulating traffic yields to entering traffic.Neighborhood traffic circles are typically built at the intersections of local streets for reasons of traffic calming and/or aesthetics. The intersection approaches may be uncontrolled or stop-controlled. They do not typically include raised channelization to left-turning movements are allowed to occur to the left of (clockwise around) the central island, potentially conflicting with other circulating traffic.Roundabouts are circular intersections with specific design and traffic control features. These features include yield control of all entering traffic, channelized approaches, and appropriate geometric curvature to ensure that travel speeds on the circulatory roadway are typically less than 50 km/h (30 mph). Also, sorted by the number of lanes, roundabouts can be divided into single-lane roundabouts, two-lane roundabouts and multi-lane roundabouts.2 Restatement of the ProblemProperly designed intersections employ traffic control devices to regulate the traffic flow. As mentioned above, the traffic control devices are stop signal, yield signal, traffic lights and so on. In this paper, we build model to give optimal control method of traffic flow of intersections. Thus we need to seek out the optimization objectives and constraint factors of the method.Thinking thoroughly of various traffic states, we offer different strategies of controlling depend on different traffic conditions. The mainly differ of traffic conditions is decided by lane flow which is related to maximum speed (V) (kilometers per hour) and density (K) (vehicles per kilometer), these changing parameters affect the road transportation condition and thus ask us to explore different methods to control.3 Properties of a Successful ModelA properly designed circular intersection configuration model which guide intersections to give high quality of service (QOS) should achieve the following objectives:Guarantee people’s safety, lower congestion and crash probabilities.Maximum efficiency of circular intersections.The quality of service (QOS) at an circular intersection is measured by delay, capacity, speed, queue lengths, saturation degree and so on. Among these criteria, delay owns the most important weight.4 General AssumptionsThere is only one type of driver in the system. This means, under a specific condition, all drivers’ behavior goes the same.All people drive on the right.All the drivers follow the traffic rules.5 Traffic Control FormsSorted by traffic flow control forms, circular intersections are classified into uncontrolled ones, stop sign or yield sign controlled ones and traffic lights controlled ones. As some intersections are fading out eventually, we can narrow traffic flow control forms into stop or yield sign control and traffic lights control. This means, uncontrolled circular intersections and yield sign controlled ones which older circulating traffic yield to entering traffic are eventually out of use. Why does this situation happen? The analysis is given below:Uncontrolled circular intersection and yield sign controlled ones which give priority to entering traffic match the properties of rotaries and neighborhood traffic circles, they are called older traffic circles. The rest circular intersections are called modern roundabouts. The distinguishing differences between traffic circles and modern roundabouts are:•Modern roundabouts have a smaller diameter than most older traffic circles, resulting in safer conditions and lower speeds.•Vehicles can enter modern roundabouts much easier than older traffic circles due to flared approaches, entry angles, slower speeds on the circulating roadway and the fact that vehicles entering roundabouts always yield to circulating traffic•Properly planned modern roundabouts are designed using rigorous standards based on specific turning volumes. Older traffic circles are typically sized based on land availability and or road distance needed for accomplishing high speed weave movements. Older traffic circles are large in diameter, have high circulating speeds and can require some merging and weaving between lanes to exit. They exhibit poor operations and high crash rates. Driving through older traffic circles can be unnerving to the uninitiated driver. Thus many countries have adopted modern roundabouts as a common intersection form, according to this truth, in the latter part of our paper, we just focus on the study of modernroundabouts. This lead to a narrow traffic flow control methods, they are: stop or yield sign controlled roundabouts which give priority to the circulating traffic.6 Choice Making Model6.1 Technical SummaryFor a specific circular intersection, we choose different traffic control methods based on different traffic conditions. Use saturation as a criterion to measure the traffic conditions, thus the changing of controlling methods is based on the changing of saturation.When using traffic lights controlling method, we can obtain the optimal light cycle length by utilizing the simplified Webster Model. Meanwhile the uncertainty of split value leads to various controlling choices. How to give a best traffic lights controlling method? In this paper we implement optimization method. Fix a certain saturation value, take Delay as objective, and then use our optimization model to get the optimal split value and delay value under this traffic condition. Repeatedly use this method, we can obtain different optimal delay and split value under different saturation, thus minimum delay’s function of split, minimum delay’s function of saturation are achieved. That is, we can provide optimal traffic lights timing strategies under different traffic conditions.For the problem of how to decide when to switch between stop or yield sign controlling method and traffic lights controlling methods, we utilize comparison method to seek the switching point. Referred to Delay calculation model in book Roundabouts: an Informational Guide, we can figure out minimum delay’s function of saturation under sign controlled condition. Draw delay’s function of saturation for both yield sign controllingmethod and traffic lights controlling method in one coordinate, compare them and we can get the intersection point, that is the threshold of saturation. When the traffic condition is in lower saturation than the threshold, we utilize stop or yield sign controlling method, when traffic saturation exceeds the threshold, traffic lights must be utilized to give a better performance. Consulting the minimum delay’s function of split, we can get the optimal green light timing length.6.2 DefinitionsKeyExhibit 1 roundabout featuresExhibit 2 roundabout dimensionExhibit 3 phase a-1Exhibit 4 phase a-2c e n t e r i s l a n dc e n t e r i s l a n dExhibit 5 phase a-3Exhibit 6 phase a-4Parameters e : entry width, m v : approach half width, m l’: effective flare length, m S : sharpness of flare, m/m D : inscribed circle diameter, m : entry angle, degrees r : entry radius, m C : through the simplify model we can calculate the cycle length (unit s) Q : set up the initial value of waiting person car unit (unit u) s 1: the Saturation flow rate of entrance point (unit pcu/s) s 2: the Saturation flow rate of cycle point (unit pcu/s)c e n t e ri s l a n d c e n t e ri s l a n dTeam # 4645 Page 7 of 41 q: the flow rate of entrance (unit pcu/s)q ij: the flow rate of entrance i to direction j. (unit pcu/s)d: the delay time (unit s)d s: the average delay per vehicle of travelling forwardd L: the average delay per vehicle of left travellingd1: the average delay per vehicle of left travelling at the entrance stop line (unit s) d2: the average delay per vehicle of left travelling at the Circuit stop line (unit s) d ij: the delay time from entrance i running to direction j (unit s)A: the Passage time (unit:s)L a: the distance from Entrance bays to Circuit conflict place (unit m)L b: the distance from Circuit bays to Circuit conflict place (unit m)L c: the distance between stop line to the parking entrance (unit m)L d: The distance from the next phase of stop line to the point of conflict (unit m) L p: the width of the circle island street (unit m)v r: the velocity of flowing in (unit m/s)v e: the velocity of flowing out (unit m/s)TT: the analysis time period,T: time from Entrance bays to Circuit bays∆ܶ: the time the last left turning vehicle need to pass through the conflicting point. c: the capacity of the traffic circle!(unit pcu/s)c e: entry capacity (unit pce/h)c c: circulating flow (unit pce/h)x: the Saturation rate of traffic circle (unit:100%)g: the green traffic light time length (unit s)r: red light time length (unit s)ߣ: split y ir: critical flow rate of phase i (100%)Y: sum of critical flow rate of each phase (100%)I1: spacing interval between entrance light and circulatory light (unit s)t1: arrival function of vehiclest2: departure function of vehicles6.3 Data RequirementsThe analysis method described in this paper requires the specification of traffic volumes for each approach to the roundabout, including the flow rate for each directional movement. Volumes are typically expressed in passenger car vehicles per hour (vph), for a specified 15-minute analysis period. To convert other vehicle types to passenger car unit (pcu), use the conversion factors according to book Roundabouts: an Informational Guide which are given in Exhibit 7.Team # 4645 Page 8 of 41Exhibit 7 the conversion factorsVehicle TypePassenger Car Equivalent (pcu)Car1Single-unit truck or bus 1.5Truck with trailer2Bicycle or motorcycle0.56.4 Capacity Calculation ModelCapacity, the maximum flow rate of a roundabout, can be accommodated at a roundabout entry depends on two factors: the circulating flow on the roundabout that conflicts with the entry flow, and the geometric elements of the roundabout.When the circulating flow is low, drivers at the entry are able to enter the roundabout without significant delay. The larger gaps in the circulating flow are more useful to the entering drivers and more than one vehicle may enter each gap. As the circulating flow increases, the size of the gaps in the circulating flow decrease, and the rate at which vehicles can enter also decreases. Note that when computing the capacity of a particular leg, the actual circulating flow to use may be less than demand flows, if the entry capacity of one leg contributing to the circulating flow is less than demand on that leg.The geometric elements of the roundabout also affect the rate of entry flow. The most important geometric element is the width of the entry and circulatory roadways, or the number of lanes at the entry and on the roundabout. Two entry lanes permit nearly twice the rate of entry flow as do one lane. Wider circulatory roadways allow vehicles to travel alongside, or follow, each other in tighter bunches and so provide longer gaps between bunches of vehicles. The flare length also affects the capacity. The inscribed circle diameter and the entry angle have minor effects on capacity.Consult to book Roundabouts: an Informational Guide provided by U.S. Department of Transportation, the equations used to calculate capacity are:ܿൌ൜݇ሺܨെ݂ܿሻ ݂ܿܨ0 ݂ܿܨ݇ൌ1െ0.00347ሺെ30ሻെ0.978൬1ݎെ0.05൰ܨൌ303ݔଶ݂ൌ0.210ݐሺ10.2ݔଶሻݐൌ10.51݁ݔ ቀܦെ6010ቁݔଶൌݒ݁െݒ12ܵܵൌ1.6ሺ݁െݒሻ݈ᇱTeam # 4645 Page 9 of 41 6.5 Cycle Length Optimization ModelSimplify Webster’s Model to calculate the best Cycle length. The equation is:ܥൌ1.05ܮ2.51െܻ Where: ܥis the best Cycle length,ܮൌ൬ܣ݈ݒ݈ௗݒ൰ଶୀଵ 6.6 Delay Calculation Model:Delay is the time that a driver spends queuing and then waiting for an acceptable gap in the circulating flow while at the front of the queue. It is a standard parameter used to measure the performance of an intersection.The Highway Capacity Manual (1) identifies delay as the primary measure of effectiveness for both signalized and none signalized intersections, with level of service determined from the delay estimate. 1) Model for sign controlled roundaboutsConsult to Roundabouts: an Informational Guide, for sign controlled roundabouts, the formula for computing the delay is given in Equation: ݀ൌ3600ܿ,௫900ܶܶൈۏێێێۍܸ௫ܿ,௫െ1ඩቆܸ௫ܿ,௫െ1ቇଶ൬3600ܿ,௫൰൬ܸ௫ܿ,௫൰450ܶܶےۑۑۑېExhibit 8 the delay, flow rate and capacity2) Model for traffic lights controlled roundaboutsPrevious work on delay modelThree types of analytical delay models including stochastic steady state, deterministic and time dependent with different assumptions have been developed in the past for predicting average delay models assume that arrivals are random and departure headways are uniform(Newell,1956; Webster,1958; Miller,1968). They are only applicable to under saturated conditions, that is, demand is less than capacity, and predict infinite delay when arrival flow approaches capacity. However, when demand exceeds capacity oversaturated conditions exist and continuous overflow delay occurs.Deterministic delay models can estimate continuous overflow delay, but they do not completely deal with the effect of randomness when arrival flows are close to capacity, and also fail when the degree of saturation is between 1.0 and 1.1.As pointed out by Hurdle (1984), both types of delay model are utterly incompatible when the degree of saturation is equal to 1.0. Time-dependent delay models, therefore, are used to fill the gap between these 2 models and also to give more realistic results in the estimation of delay at signalized intersections. They are derived as a mix of steady state and deterministic models using the coordinate transformation techniques described by Kimber and Hollis (1979). Thus, this type of model predicts delay for both under saturated and oversaturated conditions without having any discontinuity at the degree of saturation 1.0.Various time-dependent delay models have been introduced within different mathematical forms to estimate delays for various traffic conditions at signalized intersections (Catling, 1977; Kimber and Hollis, 1978, 1979; Robertson1979; Akcelik, 1980, 1988; ITE 1995; TRB, 1997, 2000). Among them, the most commonly used delay models are defined in the 1981 Australian Capacity Guide (Akcelik,1980) , the 1985 Canadian Capacity Guide for Signalized Intersections (ITE,1995) , and the 1997 and 2000 versions of the Highway Capacity Manual (TRB,1998, 2000).The previous work on delay modals generally fit well for conventional intersections. Due to the addition of geometric delay, the former delay modals don’t fit well for roundabouts. The addition delay is caused by the turning process at a roundabout, the left-turning vehicles have to wait at the stop line, and pass the traffic lights twice. Because geometric delay owns a heavier weight in total delay for a roundabout than it owns in a conventional intersection. A new delay calculation model must be proposed.Our Delay model1). Delay calculation for non-turning vehiclesFor non-turning vehicles, the situations for conventional intersections and roundabout are similar. Using delay models offered by HCM2000, the formula for computing of delay is:݀ݏൌ0.5ܥሺ1െ݃/ܥሻଶ1െܽ݃/ܥ900ൈ0.25ݔെ1ඨሺݔെ1ሻଶ4ݔ0.25ܿWhere: a=min {1, x}2).Delay calculation for left-turning vehiclesBecause left-turning vehicles need to pass the traffic lights twice, thus the delay calculation should not be simply based on the calculation of split at entry approach.For left-turning vehicles, delay is mainly formed by two parts. The first part of delay is contributed at the first stop line which is similar to the non-turning vehicles. The second part of delay is contributed at the second stop line before passing the second traffic light. Based on this theory, the equation for delay calculation is: ݀ൌ݀ଵ݀ଶThe formula of ݀ଵ which describes delay at entry stop line for left-turning vehicles goes the same to ݀ݏ, that is ݀ଵൌ݀ݏ.The delay at second stop line for left-turning can be calculated according to arrival-departure curve. Different algorithms were given in terms of different dissipating balance point time. They are listed in four cases.Case 1: The left-turning vehicles meet the green light signal when arriving at the stop line. Shown in Exhibit 9.Exhibit 9 the delay time analysisCase 2: The left-turning vehicles arrive at the dissipating balance point at saturation flow rate S. Shown in Exhibit 10.timeExhibit 10 the delay time analysisCase 3: The left-turning vehicles arrive at the dissipating balance point at arriving rate q. Shown in Exhibit 11.Exhibit 11 the delay time analysisCase 4: The left-turning vehicles arrive at the dissipating balance point at arriving rate zero. Shown in Exhibit 12..T h e c u m u l a t i v e n u m b e r o f v e h i c l e stimeT h e c u m u l a t i v e n u m b e r o f v e h i c l e stimeExhibit 12 the delay time analysisIn Exhibit 9-12, G stands for the length of green light signal time; R stands for the length of red light signal time and t is time. Reckon the first left-turning vehicle’s arriving time as the start time point.݀ଶൌەۖۖۖۖ۔ۖۖۖۖۓ0 ݃ܫ′െܶ0ሺݐଶെݐଵሻ݀ܳௌభௌమௌమିௌభ൫ାூ′ି்൯ݍܥ ݃ܫ′െܶ൏ܵଶሺ݃ܫ′െܶሻܵଶെܵଵݍݎܵଵെݍሺݐଶെݐଵሻ݀ܳௌమௌభି൫ାூ′ି்ା൯ݍܥݍݎܵଵെݍ൏ܵଶሺ݃ܫ′െܶሻݍݎܵଶെݍ݃ሺݐଶെݐଵሻ݀ܳݍܥ ܵଶሺ݃ܫ′െܶሻݍݎܵଶെݍ݃ݐଵൌ݂ଵሺܳሻൌە۔ۓܳݏଵ 0ܳܵଵݍݎܵଵെݍܳݍെ1 ܵଵݍݎܵଵെݍ൏ܳݍܥݐଶൌ݂ଶሺܳሻൌ݃ܫ′െܶܳ/ܵଶ3) Delay calculation for roundaboutRoundabout have more than one arms, the total delay for the roundabout is a weighted average value of every delay for each entrance. The equation for calculation is :݀ൌ݀ݍୀଵୀଵݍୀଵୀଵ൙T h e c u m u l a t i v e n u m b e r o f v e h i c l e stime6.7 Green Light Time Length Optimization ModelUtilize optimization method to calculate the green light time length. First, we fix a certain saturation value, take Delay as objective, and then use our optimization model to get the optimal green light time and delay value under this traffic condition. The constraints are green light time length (include the consideration for the minimum green light time length for vehicle flow, the minimum green light time length for passengers to go across the road and maximum green light time length constraint for left turning queuing volume); red light time length (the minimum red light time length we could bear), split and spacing interval of green light. Consulting Yang Xiaoguang’s method on this problem, the equations are :Objective: ݉݅݊ ݀ൌ݉݅݊∑∑݀ݍୀଵୀଵ∑∑ݍୀଵୀଵൗConstraints:Green light time length݃݃ி, ݃ଶ௩ ݃ேௌభಽRed light time length rr୮,୫୧୬Splitߣൌൌି ௬ೝSpacing interval of green lightܫൌܫᇱܫᇱᇱ ܫᇱൌܣೌ௩ೝെ್௩ ܫᇱᇱൌ݉ܽݔቄܣ௩ೝെ௩െܫᇱ,∆ܶቅ6.8 StrategiesBasic RulesAccording to the previous study in this paper, the traffic control forms include stop or yield sign control and traffic lights control. Because of different Cycle length and split value, lots of strategies can be generated to control the traffic flow. Thus how to choose a best strategy to give high quality of service (QOS)? We take Delay as our objective and use optimization method to generate strategies.The main factors which affect our objective are Capacity and flow rate V, Roundabout approach capacity is dependent on the conflicting circulating flow and the roundabout’s geometric elements. When a specific roundabout is given, the Capacity can be obtained by using the capacity model. The traffic transport condition is mainly reflected on the value of saturation, when the saturation goes up, the road condition leads to congestion. Thus different strategies should be employed under different saturation.Condition1: Low saturationAs a basic rule, when the saturation is very low, that is the traffic flow rate is way smaller than roundabout’s capacity, judging by the control effects, using traffic lights as control form causes higher delay than employing yield sign, because traffic lights control produces more unnecessary stops for major lane vehicles thus leads to a larger delay.Condition2: High saturationWhen the saturation goes up to a degree, the operation of yield sign controlled roundabout will likely deteriorate rapidly due to the queuing effect, thus traffic lights controlled strategy should be employed to take place of yield sign now, for traffic lights controlling gives higher QOS than yield sign controlling under this situation.TasksAchieve the threshold of saturation to decide the switching point of yield sign controlling form and traffic lights controlling form.Give strategies for traffic lights controlling. That means to give calculation of how many seconds each light should remain green.Green light timing optimization1)According to a specific roundabout’s parameters, calculate the value of Capacity and optimal Cycle Length.2)For a specific saturation, using delay model we’ve built before, the Delay-green light time curve can be drew. The lowest point corresponded to optimal green light time and delay.3)Repeat step 2, give optimal delay and green light timing length value for different flow rate, by using regression fitting method, we get delay’s function of green light timing length and saturation.Threshold calculation1)Draw Delay-Saturation curve based on our optimal green light timing method.2)Draw Delay-Saturation curves for stop and yield sign controlled roundabout.3)Compare these two curves in a coordinate, the intersection is the threshold point we seek. When the delay for yield sign controlled roundabout is smaller, we employ this traffic flow control strategy, otherwise use traffic lights to control.7 Application of Choice Making ModelNow, we use a specific roundabout to illustrate our model. Note that all calculation work is done in Matlab.7.1 Parameters of the RoundaboutExhibit 13 the flow rate of roundaboutflow rate (pcu/s) Capacity of movement The flow rate of differentDirection of travelq(ES) 0.2 0.6q(EL) 0.2 0.6q(EL2) 0.2 0.6q(WS) 0.2 0.6q(WL) 0.2 0.6q(WL2) 0.2 0.6q(NS) 0.1 0.6q(NL) 0.1 0.6 q(NL2) 0.1 0.6q(SS) 0.1 0.6q(SL) 0.1 0.6q(SL2) 0.1 0.6Note :ES the east entrance go throughEL the east entrance go left firstlyEL2 the east entrance go left secondlyWS the west entrance go throughWL the west entrance go left firstlyWL2 the west entrance go left secondlyNS the north entrance go throughNL the north entrance go left firstlyNL2 the north entrance go left secondlySS the north entrance go throughSL SL2the north entrance go left firstlythe north entrance go left secondly Exhibit 14 the structure data of roundaboutSign Value Unitla lb 510mmlc ld ve vr T ∆܂A c TT102010201041021000.25mmm/sm/sssspcu/shour7.2 Traffic Lights Controlling MethodCycle length optimization: Compute our cycle length equation with given parameters. Green light time length optimization: Calling our delay model and green light time length optimization method to compute the value.The final traffic lights controlled strategy for this particular roundabout is shown below:Exhibit 15 Roundabout flow rate (pcu/s)Direction of travel flow rate (pcu/s) Capacity of movement Degree of saturation the Theory of the best cycle length ES 0.2 0.6 0.33 117 EL 0.2 0.6 0.33 117 EL2 0.2 0.6 0.33 117 WS 0.2 0.6 0.33 117 WL 0.2 0.6 0.33 117 WL2 0.2 0.6 0.33 117 NS 0.1 0.6 0.17 85 NL 0.1 0.6 0.17 85 NL2 0.1 0.6 0.17 85 SS 0.1 0.6 0.17 85 SL 0.1 0.6 0.17 85 SL2 0.1 0.6 0.17 85Exhibit 16the time length of green light(s)t h e d e l a y t i m e (s )the changing delay time with green lightExhibit 17Exhibit 18 resultsDirection of travel Direction of travelGt Gt(s)(s)(s) I nterval nterval Gt Gt(s)(s)(s)ES ES6651EL EL 66 51 EL2EL2 45 40 WS WS 66 51 WL WL 66 51 WL2WL2 45 40 NS NS 45 40 NL NL 45 40 NL2NL2 66 51 SS SS 45 40 SL SL 45 40 SL2SL26651the time length of green light(s)t h e d e l a y t i m e (s )the changing delay time with green lightExhibit 19 results7.3 Sign Controlling MethodCalling our delay model for sign controlled roundabout, we can get Exhibit below through Matlab.Exhibit 207.4 Strategies1) Calculate Optimal Green light time length for different saturation. The results are shown in Exhibit:Saturationt h e d e l a y t i m e (s )the changing delay time with SaturationExhibit 21 the changing delay time with different saturation rateConclude our optimal values in table form, the result is shown in below:Exhibit 22 the minimum delay timeThe saturation rateThe time length of green light(s)The min delay time(s)0.01 62.4 81.77 0.1 62.4 83.31 0.5 72 92.69 0.75 81.6 103.3 0.85 86.4 111.3 0.95 100.8129.5Using Matlab to get the regression fitting equation below:the time length of green light(s)t h e d e l a y t i m e (s )the changing delay time with green lightthe Saturation rate(s)t h e d e l a y t i m e p e r v e h i c l e (s )The vehicle delays along with the degree of saturation change。
2009年电工杯数学建模一等奖论文

2
的公差带。 因此可以在设计铁心截面时稍微增加铁心柱的外接圆的直径以使得铁 心柱有更好的截面形状。请结合铁心柱截面的设计而设计出二者的公差带。 问题三: 铜导线在电流流过时发热造成的功率损耗简称为铜损;铁心在磁力 线通过时发热造成的功率损耗简称为铁损。为了改善铁心内部的散热,铁心柱直 径为 380 毫米以上时须设置冷却油道。简单地说,就是在某些相邻阶梯形之间留 下 6 毫米厚的水平空隙(如图 2 所示) ,空隙里充满油,变压器工作时油上下循 环带走铁心里的热量。具体油道数可按表 2 选取。油道的位置应使其分割的相邻 两部分铁心柱截面积近似相等。 分别针对问题一和问题二的情况,增加油道要求再给出设计,并指出油道的 位置。 表2 铁心柱直径 mm 380-410 420-500 510-690 700-840 冷却油道数的选择 半圆中 6mm 油道个数 0 1 2 3
第二页
答卷编号:
阅卷专家 1 论文等级
阅卷专家 2
阅卷专家 3
摘 要
本文对运用优化模型对电力变压器铁心柱截面进行了优化设计, 并给出了具 体的设计方案。 问题一中只有“使铁心柱有效截面积最大”这一个目标,由于叠片系数只与 组成铁心柱的材料和制作工艺有关,和铁心柱的设计无关,所以我们将其作为常 数处理,只考虑铁心柱的几何截面积,建立了简单的单目标规划模型。我们用 lingo 软件进行编程求解,得到问题一的最优结果:欲使其有效截面积最大,铁 心柱截面的级数应为 14,各级的宽度和厚度见正文。 问题二要求结合问题一中铁心柱截面的设计而设计出线圈内筒直径和铁心柱 外接圆直径的公差带。 我们在问题一的基础上加入新的目标——使铁心柱有更好 的截面形状——建立了多目标规划模型, 选择用铁心柱截面上的所有顶点到圆心 的平均距离与给定圆的半径之差来量化截面形状,利用问题一的结论,采用分层 序列法将其转化为只考虑截面形状的单目标规划模型,用 lingo 软件编程实现, 考虑国标中关于公差的要求,得出铁心柱外接圆直径的公差带为 650—652mm, 线圈的内筒直径的公差带为 652.2—652.8mm。 问题三为在前两问的基础上增加油道要求后再分别给出设计二者的设计,并 指出油道的位置。 我们分别在前两问中增加“被油道分割的相邻两部分铁心柱截 面面积近似相等”这一目标,分别建立两个多目标规划模型。对于第一个模型, 我们采用主要目标法将“面积近似相等”这一目标转化为约束,并规定了近似相 等的条件;在求解过程中,由于决策变量过多,从而导致编程出现困难,所以我 们采用人工搜索的方法初步判定油道所在的位置, 然后再对各种可能分别进行编 2 程实现,最终得出最优解:铁心柱的最大截面积为 306913.4 mm ,油道的位置分 别在第 1、2 级之间和第 4、5 级之间,铁心柱截面共分 14 级,各级的宽度和厚 度见正文。 对于第二个模型,我们采用主要目标法和分层序列法相结合的方法将 两类目标分别转化成约束条件来处理,然后综合前三个模型的求解过程,用 lingo 软件进行编程实现, 可以得出结果如下: 铁心柱外接圆直径的公差带为 650 —652mm,线圈的内筒直径的公差带为 652.2—652.8mm。 本文综合考虑了各个方面, 建立了符合条件的优化模型,采用 lingo 编程的 方法,求得的结果完全满足题目的要求,并有一定的实际应用价值。
2009美国大学生数学建模竞赛特等奖论文全集

163
On
Jargon
Ptolemyto
Fourier:
Epicycles
Fawaz
Hjouj
...............................................................169
Strivingfor
Balance:
Why
ReintroducingMore
Speciesto
Fish
Farm
EcosystemYields
BiggerProfits
Sean
Clement,
Timothy
Newlin,
andJoseph
Lucas
and
empowerone’s
life.
I
also
Байду номын сангаасagree
with
Dudley
that
even
though
some
students
donotfullyunderstandtheconceptsandtheoriesofcalculus,itshouldstillbetaught—and
Associate
Editors
Don
AdolphsonChris
ArneyAaron
Archer
Ron
Barnes
Arthur
BenjaminRobert
Bosch
James
M.
CargalMurray
K.
2009高教社杯全国大学生数学建模竞赛(上海世博对就业的影响)论文

2009高教社杯全国大学生数学建模竞赛上海世博对就业的影响摘要2010年上海世博会是首次在中国举办的世界博览会。
从1851年伦敦的“万国工业博览会”开始,世博会正日益成为各国人民交流历史文化、展示科技成果、体现合作精神、展望未来发展等的重要舞台。
在世博会的建设、运转及后期的相关工作中直接或间接地给我们提供了大量的就业机会,相对减少了紧张的就业局势。
我们将以就业为切入口,定量评估世博会的影响力。
我们将从两个方面讨论其对就业的影响。
一、问题的分析(一)世博会简介世博会,全称为世界博览会(World Exhibition or Exposition,简称World Expo),是一项由主办国组织或政府委托有关部门举办的有较大影响和悠久历史的国际性博览活动。
参展者向世界各国展示当代的文化、科技和产业上正面影响各种生活范畴的成果。
2010年中国上海以“城市,让生活更美好”(Betty city, Betty life)为主题。
它所包含的五个分主题:城市与经济发展关系、城市与可持续发展关系、城乡互动关系、城市与高科技发展关系、城市与多元文化发展关系。
中国是第一个举办综合类世博会的发展中国家。
举办此种盛会将会在科技、经济、政治、文化、社会等诸多方面给中国带来积极的影响。
(二)我国经济发展与就业增长的关系一方面,经济增长是推动就业增长的原动力;另一方面,通过增加就业岗位,使更多的劳动力参加到经济建设中来,又能反过来推动经济的增长。
解决就业问题,根本途径还是发展经济,通过扩大经济规模来扩大就业容量,使更多的劳动力参加进来,从而使经济增长,形成一个良性循环。
而随着经济建设的深入,第一产业、第二产业都已经或将会达到饱和状态,此时要想继续使经济持续增长,就不得不进行产业结构的优化,进一步地提高第三产业在国民经济中所占得比例,通过第三产业牵引着整体经济的持续发展。
(三)世博会给经济转型带来的契机目前上海的第三产业一直维持在国民经济的百分之五十左右,而此时同为中国经济中心的香港则早已达到了百分之九十以上。
全国大学生数学建模竞赛—参考论文

路灯的更换策略摘要本文针对路灯的更换策略中最佳更换周期的确定做了深入的研究,根据路灯更换的周期对平均费用影响的分析可知该问题是一类基于概率模型的周期性更换策略问题。
对此,本文建立了微分方程模型进行讨论求解。
首先,我们采用数理统计的思想,利用题中给出了200个抽样灯泡的寿命,借助SPSS 应用统计软件和MATLAB软件工具箱对样本进行了假设检验以及参数估计,检验结果显示,样本中的灯泡的寿命均服从均值为4002.67,标准差为96.047的正态分布。
对于问题(1),先确定了以单位时间内路政部门所花费最小为判断指标,通过计算推导得到了单位时间所花费的平均费用关于周期的表达式,即单位时间内所花的平均费用为一个周期内所花的总费用除以一个周期的小时数,周期的总费用包括灯泡成本以及罚款费用。
然后对该函数进行微分求导,在导数为0的情况下求解最佳更换周期T的表达式,经化简,得到T为最佳周期时的等式。
对于问题(2),在问题(1)以及数据处理阶段的基础上,对模型进行了求解。
采用遍历的思想,用MATLAB对周期在某一范围内进行遍历代入问题(1)中求得的关系式进行计算,当(1)中关系式成立时,输出的周期T为最佳周期,即4314小时。
对于问题(3),在问题(1)的基础上,考虑更换下来的未损坏路灯的回收价值,对模型进行修改,在从费用中减去该部分的价格,按照问题(1)的推导的思路以及问题(2)中的算法对该问题进行分析求解,最佳更换周期为3926.5小时。
最后,本文对模型中涉及的罚款费用做了敏感性分析,并结合实际做了的优缺点进行了评价,提出了离散的时间模型的改进方案,对模型进行了简单的推广。
关键词:假设检验;周期性更换策略;微分方程模型;敏感性分析一、问题的提出和重述1.1问题的提出路灯的更换和维护是路政部门的一项重要的工作,在更换路灯时间的选择上,路政部门需要考虑到跟换的成本,灯泡的寿命等众多因素。
而在更换时,花费的精力和成本主要是要专用云梯车进行线路检测和更换灯泡,向相应的管理部门提出电力使用和道路管制申请,雇用的各类人员支付的报酬等,这些工作需要的费用往往比灯泡本身的费用更高,因此,灯泡坏一个换一个的办法是不可取的。
- 1、下载文档前请自行甄别文档内容的完整性,平台不提供额外的编辑、内容补充、找答案等附加服务。
- 2、"仅部分预览"的文档,不可在线预览部分如存在完整性等问题,可反馈申请退款(可完整预览的文档不适用该条件!)。
- 3、如文档侵犯您的权益,请联系客服反馈,我们会尽快为您处理(人工客服工作时间:9:00-18:30)。
眼科病床的合理安排摘要医院病床的合理安排是病人和医院共同关注的问题。
本文对医院病床的分配进行分析,使用层次分析法找出模型的判定因素,通过对医院已制定的模型的判断,找出了原模型的优劣,并使用线性规划制定出合理的模型,通过模型的结果推断出第三问的答案,若该住院部周六、周日不安排手术,则改变模型的约束条件,使其判断之后的手术时间是否要做出相应的调整。
考虑到便于医院进行管理,提出运用排队论的方法求解出病床比例分配模型。
关键词:层次分析法线性规划排队论一、问题重述医院就医排队是大家都非常熟悉的现象,它以这样或那样的形式出现在我们面前,例如,患者到门诊就诊、到收费处划价、到药房取药、到注射室打针、等待住院等,往往需要排队等待接受某种服务。
我们考虑某医院眼科病床的合理安排的数学建模问题。
该医院眼科门诊每天开放,住院部共有病床79张。
该医院眼科手术主要分四大类:白内障、视网膜疾病、青光眼和外伤。
附录中给出了2008年7月13日至2008年9月11日这段时间里各类病人的情况。
白内障手术较简单,而且没有急症。
目前该院是每周一、三做白内障手术,此类病人的术前准备时间只需1、2天。
做两只眼的病人比做一只眼的要多一些,大约占到60%。
如果要做双眼是周一先做一只,周三再做另一只。
外伤疾病通常属于急症,病床有空时立即安排住院,住院后第二天便会安排手术。
其他眼科疾病比较复杂,有各种不同情况,但大致住院以后2-3天内就可以接受手术,主要是术后的观察时间较长。
这类疾病手术时间可根据需要安排,一般不安排在周一、周三。
由于急症数量较少,建模时这些眼科疾病可不考虑急症。
该医院眼科手术条件比较充分,在考虑病床安排时可不考虑手术条件的限制,但考虑到手术医生的安排问题,通常情况下白内障手术与其他眼科手术(急症除外)不安排在同一天做。
当前该住院部对全体非急症病人是按照FCFS(First come, First serve)规则安排住院,但等待住院病人队列却越来越长,医院方面希望你们能通过数学建模来帮助解决该住院部的病床合理安排问题,以提高对医院资源的有效利用。
问题一:试分析确定合理的评价指标体系,用以评价该问题的病床安排模型的优劣。
问题二:试就该住院部当前的情况,建立合理的病床安排模型,以根据已知的第二天拟出院病人数来确定第二天应该安排哪些病人住院。
并对你们的模型利用问题一中的指标体系作出评价。
问题三:作为病人,自然希望尽早知道自己大约何时能住院。
能否根据当时住院病人及等待住院病人的统计情况,在病人门诊时即告知其大致入住时间区间。
问题四:若该住院部周六、周日不安排手术,请你们重新回答问题二,医院的手术时间安排是否应作出相应调整?问题五:有人从便于管理的角度提出建议,在一般情形下,医院病床安排可采取使各类病人占用病床的比例大致固定的方案,试就此方案,建立使得所有病人在系统内的平均逗留时间(含等待入院及住院时间)最短的病床比例分配模型。
二、模型假设:1.外伤疾病都属于急诊2.病人服从医院的住院安排,没有插队现象3.病人治愈后会离开医院,不会在医院逗留4.所有的病床都能正常使用5.79张病床只提供给白内障,青光眼,视网膜疾病,外伤的患者入住。
三、符号说明A:各个指标权重的对比较矩阵:对于矩阵A的自大特征根W:矩阵A归一化后的特征向量记为权向量CI:判断矩阵偏离一致性指标RI:判断矩阵随机一致性指标CR:判断矩阵一致性比率a i :等待住院的第i类病人数c j :第j天允许住院的病人数数量t ij第i类眼科病人在第j天住院的住院天数b ij第i类眼科病人在第j天住院的人数B:每天都安排手术的情况下各类眼科病人的住院时间矩阵C:周末不安排手术的情况下各类眼科病人的住院时间矩阵D:周末不安排手术的情况下各类眼科病人在调整手术时间后的时间矩阵四、模型分析4.1问题一的分析对题目中所给的数据进行处理,结合文献]1[查到的一系列指标,初步建立评判指标,并运用层次分析法将指标进行权重大小,得出各个指标占病床安排合理性的分值。
使用指标的总分值,参照评判标准进行模型的优劣判断。
4.2问题二的分析用矩阵的形式将每类病人的住院时间列出,建立模型的目标函数(所有病人的最短住院的时间),即利用住院时间和住院人数的矩阵的乘积得出病人住院的时间最短。
4.3问题三的分析分析出病人住院时间就要分析出病人每天的住院人数,进而建立模型病人住院的人数及时间。
4.4问题四的分析此问题为问题二的特殊情况,改变模型二的约束条件进行判断。
五、问题求解5.1问题一的求解5.1.1通过查阅文献]1[资料可知,在医院病床安排过程中,存在着许多影响病床安排优劣性的指标。
本文中根据题目中所给的数据选取以下指标作为影响病床安排的判定指标。
1.病床的使用率:病床实际使用的数量/医院的病床数2.病床周转次数:一段时期内平均每天病床的转换张数3.出院人数:平均每天出院的病人数4.出院者平均住院日:病人从住院至出院所用的天数5.平均等待入院的时间5.1.2运用层次分析法计算各个指标权重的大小。
将5个判定指标分别两两因素成对比较(采取1-9尺度]1[){}待入院的时间日,出院人数,平准等次数,出院者平均住院病床使用率,病床周转形成对比较矩阵A⎥⎥⎥⎥⎥⎥⎦⎤⎢⎢⎢⎢⎢⎢⎣⎡=1433/143/1113/12/14/1113/12/1233164/1226/11A −−−−→−列向量归一化⎥⎥⎥⎥⎥⎥⎦⎤⎢⎢⎢⎢⎢⎢⎣⎡0.2610.3640.3000.1540.3330.08700.0910.1000.1540.0420.0650.0910.1000.1540.0420.5220.2730.3000.4620.5000.0650.1820.2000.0770.083−−−→−按行求和⎥⎥⎥⎥⎥⎥⎦⎤⎢⎢⎢⎢⎢⎢⎣⎡1.4120.4730.4522.0560.607−−→−归一化⎥⎥⎥⎥⎥⎥⎦⎤⎢⎢⎢⎢⎢⎢⎣⎡0.2820.0950.0900.4110.121=W, AW=⎥⎥⎥⎥⎥⎥⎦⎤⎢⎢⎢⎢⎢⎢⎣⎡1.5550.4770.4532.2600.631 ⎪⎭⎫⎝⎛++++=282.0555.1095.0477.0090.0453.0411.0260.2121.0631.051λ=5.250以及成对比较矩阵A 的一致性指标CI CI=1--n n λ=155250.5--=0.063即 一致性指标RI 的数值如下表从而计算对比较矩阵A 的一致性比率CR ,CR=RI=0.056<0.1由于CR<0.1,从而认为A 的不一致程度在容许范围之内,可以用其特征向量作为权向量。
根据所得的权向量从而确立判定指标体系权向量为⎥⎥⎥⎥⎥⎥⎦⎤⎢⎢⎢⎢⎢⎢⎣⎡0.2820.0950.0900.4110.121 对应得判定指标分别赋于分值为 1.21 ,4.11,0.90,0.95,2.825.1.3当综合评定分析后分值分支处于8—10分视为优,6—8分视为良,4—6分视为中,2—4分视为较差,0—2分视为差。
对五个指标 采用百分制分值为优(90,100)良(80,90)中(60,80)较差(40,60)差(0,40)各等级对应的指标取值情况5.2问题二的求解5.2.1 病人住院的时间指从住院至出院的天数,从题中所给的数据观察到,在9月30号为止有一部分病人住院后出院,一部分人住院后并没有出院,另一部分病人只进行了诊断,没有住院。
5.2.2 从题中给的第一组数据可以整理出四种眼科病在做完手术至出院的平均天数,从而推断出做完手术但没出院的病人具体在哪天出院,进而安排已诊断但未安排住院的病人进行安排住院。
5.2.3 利用线性规划的方法,用矩阵的形式将每类病人的逗留时间一一列出,建立模型的目标函数是使所有病人住院的时间最短,利用住院时间和住院人数的矩阵的乘积即可得所需结果。
4 表1 白内障(单眼)手术后观察时间情况表2 白内障(双眼)手术后观察时间情况表3 视网膜疾病手术后观察时间情况表4青光眼手术后观察时间情况表5 外伤手术后观察时间情况5 进而从5个表格中得出白内障(单眼),白内障(双眼),视网膜疾病,青光眼,外伤的术后观察时间分别为:6从而知道术后观察时间后可以推断出术后没出院的具体在第几天可以出院对题中所给的住院后没出院的数据进行整理得到以下表格表6 病人出院的日期人数选取2008年9月10号到9月30号能安排以会诊的但没有住院的病人进行院,然而从9月10号到30号出院的病人分为两类,一类是9月10号之前做完手术但没出院的人出院,另一类为9月10号之后住院在30号之前出院的病人。
写病人住院时间矩阵表矩阵从左到右依次表示2008年9月10号到9月30号,矩阵从上到下以此表示白内障(单眼),白内障(双眼),青光眼,视网膜疾病,外伤 因为9月10号为周三,依次类推星期各种眼病的限制条件是白内障手术准备时间只需1、2天,每周一、三做白内障(单眼)手术,双眼是周一先做一只,周三再做另一只。
外伤疾病通常属于急症,病床有空时立即安排住院,住院后第二天便会安排手术。
青光眼,视网膜疾病,大致住院以后2-3天内就可以接受手术,一般不安排在周一、周三。
由于急症数量较少,建模时这些眼科疾病可不考虑急症。
根据限制条件建立住院时间矩阵B⎥⎥⎥⎥⎥⎥⎦⎤⎢⎢⎢⎢⎢⎢⎣⎡=77777777777777777777712131213121312121312131212121213121312121210111011101110101110111010101011101110101011126767811126789101112678910454567845456784545678B 8 根据题中所各数据可体得到四种眼科病人诊断后没有住院的人数 表8病人诊断后没有住院的人数9 建立线性规划模型bt Zijj iji ∑∑===211511min()()⎪⎪⎪⎪⎪⎪⎪⎪⎪⎪⎪⎪⎪⎪⎪⎪⎪⎪⎪⎪⎪⎪⎪⎪⎪⎪⎪⎩⎪⎪⎪⎪⎪⎪⎪⎪⎪⎪⎪⎪⎪⎪⎪⎪⎪⎪⎪⎪⎪⎪⎪⎪⎪⎪⎪⎨⎧====≤≤-≤-≤----≤----≤-≤---≤-≤--≤-≤----≤≤-≤==∑∑∑∑∑∑∑∑∑∑∑∑∑∑∑∑∑∑∑∑∑=====================)19(21.........,.,4321j 54321i )18(7,6,4,4,20,2,2,2)17(1,36,15,29,21)16(0)15(0)14(0)13(0)12(0)11(0)10(0)9(2)8(5)7(4)6(9)5(9)4(4)3()2(1)1(..512110.3512039511938126214.113.15118454437365117128151164335345115425114413351133251125131217165111511051511981515221151,,,,,,,,为整数,b c a b b b b b b b b b b b b b b b b b b b b b b b b b b b b b b b b b b b b c b b a b ij j i i i i i i i j j i i i i j j i i i i i i i i i i j j i i i i i j j i j ji ij j i iij t s对式子的解释:(1)在9月10号到30号住院的人数是数据中过给的病人诊断后没住院的人数(2)由于外伤属于急症,并且只有一个外伤病人在9月11号门诊,所以安排当天住院(3)根据分析从9月10号入院的人之后在第9天就有出院的,因此前8天出院的人只有前面术后没有出院的人,而从第9天之后就有从10号开始入院又出院的,因此1到8天住院的人数小于出院的人数(4)-(19)从第9天开始住院的人数小于两类出院的人数之和。