小波分解与重构
小波的分解与重构去噪。课件

小波变换在物联网中的应用
总结词
压缩感知、低功耗、物联网设备兼容
详细描述
物联网设备产生大量的数据,需要高效的压缩和感知技术来处理这些数据。小波变换作为一种有效的 数据压缩和感知方法,可以在保证数据完整性的同时,减少数据的存储空间和传输带宽需求。未来研 究需要进一步探索小波变换在物联网设备上的应用,降低功耗和提高设备的兼容性。
在图像处理、信号处理、数据压缩等 领域得到广泛应用。
优点
具有多尺度分析能力,能够适应不同 尺度的信号特征。
缺点
计算量较大,需要较高的计算资源和 时间。
提升小波变换
原理
应用
提升小波变换是一种基于滤波器组的小波 变换方法,通过将信号分解成低通和高通 分量,实现信号的多尺度分析。
在图像处理、信号处理、数据压缩等领域 得到广泛应用。
滤波器组
小波变换使用滤波器组来将信号分解为细节和近似成分。 滤波器组的特性决定了小波变换的性能和效果。
快速小波变换(FWT)
FWT是一种高效的小波变换算法,可以在计算机上实现。 它可以用于实时分析和处理信号。
小波变换的应用领域
图像处理
小波变换在图像处理中广泛应 用,包括图像压缩、去噪、增
强和特征提取等。
02
连续小波变换(CWT)
CWT是一种将信号分解为一系列不同尺度和频率的小波基函数的叠加
。它可以用于分析信号的时频特性。
03
离散小波变换(DWT)
DWT是一种将连续小波变换离散化,以便在计算机上实现。它可以用
于分析信号的细节和近似成分。
小波变换的基本原理
多尺度分析
多尺度分析是一种将信号分解为不同尺度和频率成分的方 法。小波变换的多尺度特性使得它可以在不同的尺度上分 析信号,从细节到整体。
用小波矩阵分析法进行函数的分解与重构

用小波矩阵分析法进行函数的分解与重构小波矩阵分析法(Wavelet Matrix Analysis)是一种用来分解和重构函数的数学方法。
它基于小波理论,将函数分解成不同频率的小波成分,并可以通过这些小波成分的线性组合来重构原始函数。
小波矩阵分析法在信号处理、图像处理、数据压缩等领域有着广泛的应用。
首先,我们需要选择合适的小波基函数。
小波基函数是用来描述小波的形状以及频率信息的,通常是一组正交函数。
常用的小波基函数有Haar小波、Daubechies小波、Symlet小波等。
选择不同的小波基函数会对分解和重构结果产生不同的影响。
在小波矩阵分析法中,我们将函数表示为小波基函数的线性组合,通过调整线性组合的系数来获得函数的分解和重构。
具体步骤如下:1.将原始函数表示为小波基函数的线性组合:f(x)=Σc(i,j)ψ(i,j)(x)其中,c(i,j)是系数矩阵,ψ(i,j)(x)是小波基函数。
2.根据小波基函数的正交性质,可以通过内积运算计算系数矩阵c(i,j)的值:c(i,j)=<f(x),ψ(i,j)(x)>3.对系数矩阵进行阈值化,去除较小的系数,得到稀疏的系数矩阵。
4.根据稀疏的系数矩阵f(x)≈Σc(i,j)ψ(i,j)(x)小波矩阵分析法的优点是可以同时分析函数在频域和时域上的信息,可以更准确地描述函数的局部特征。
同时,由于小波基函数的局部性,小波矩阵分析法对于非平稳信号的处理效果更好。
以图像处理为例,假设我们有一幅图像,我们可以将图像表示为一个二维的函数。
通过小波矩阵分析法可以将这个二维函数分解成不同频率的小波成分,每个小波成分代表图像中不同尺度和方向的特征。
通过调整系数矩阵的值,我们可以选择保留哪些小波成分,从而实现图像的降噪、压缩等操作。
最后,通过将选定的小波成分进行线性组合,可以重构原始图像。
总结来说,小波矩阵分析法是一种分析函数的有效数学方法,可以将函数表示为小波基函数的线性组合,并通过调整系数矩阵的值来实现函数的分解和重构。
小波分解与重构原理
“小波工程应用”实验报告一维信号离散小波分解与重构(去噪)的VC实现一、目的在理解了离散小波变换的基本原理和算法的基础上,通过设计VC程序对简单的一维信号在加上了高斯白噪声之后进行Daubechies小波、Morlet小波和Haar小波变换,从而得到小波分解系数;再通过改变分解得到的各层高频系数进行信号的小波重构达到消噪的目的。
在这一程序实现的过程中能直观地理解信号小波分解重构的过程和在信号消噪中的重要作用,以及在对各层高频系数进行权重处理时系数的选取对信号消噪效果的影响。
二、基本原理1、信号的小波分解与重构原理在离散小波变换(DWT)中,我们在空间上表示信号,也就是说对于每一个在上表示的信号能用在上面提到的两个空间中的基函数来表示。
Where and are the coefficients of the scale metric space (j-1) which are obtained after the Decomposing the coefficient of the scale metric space j . Analogously we could reconstruct theby and .我们在尺度度量空间对系数进行分解得到在尺度度量空间的两个系数和。
同样的,我们也能从两个系数和通过重构得到系数。
如上图中的分解与重构我们可以通过一定的滤波器组来实现(也就是小波变换算法)。
当小波和尺度在空间内是正交的,我们就可以用内积公式计算得到系数和:下面是内积计算方法的具体公式:具体的系数计算过程如下:对于上面的小波分解过程,通过分别设计高通滤波器和低通滤波器两组滤波器的系数(数组g[]和h[])即可实现,特别是对于离散小波变换,程序算法相对简单。
而重构也只是分解的逆过程,重构算法和分解的算法是相对应而互逆的。
2、小波去噪原理一般来说,噪声信号多包含在具有较高频率细节中,在对信号进行了小波分解之后,再利用门限阈值等形式对所分解的小波系数进行权重处理,然后对小信号再进行重构即可达到信号去噪的目的。
小波分解与重构原理
小波分解与重构原理小波分解与重构是一种信号处理技术,它可以将信号分解成不同尺度和频率的成分,从而更好地理解和分析信号的特性。
在本文中,我们将介绍小波分解与重构的原理,以及它在信号处理领域的应用。
首先,让我们来看一下小波分解的原理。
小波分解是通过一组小波基函数对信号进行分解的过程。
这组小波基函数具有不同的尺度和频率特性,可以将信号分解成不同频率成分的系数。
在小波分解中,我们通常使用离散小波变换(DWT)来实现信号的分解。
DWT 是通过一系列的滤波器和下采样操作来实现信号的分解,具体过程是将信号通过低通滤波器和高通滤波器进行滤波,并对滤波后的信号进行下采样,最终得到近似系数和细节系数。
接下来,我们来谈谈小波重构的原理。
小波重构是将分解得到的近似系数和细节系数通过逆小波变换(IDWT)合成为原始信号的过程。
在小波重构中,我们需要使用逆小波变换来将近似系数和细节系数合成为原始信号。
逆小波变换的过程是通过一系列的滤波器和上采样操作来实现信号的合成,具体过程是将近似系数和细节系数通过上采样和滤波器进行滤波,并将滤波后的信号相加得到重构的信号。
小波分解与重构的原理虽然看起来比较复杂,但是它在信号处理领域有着广泛的应用。
首先,小波分解与重构可以用于信号的压缩和去噪。
通过保留重要的近似系数和细节系数,可以实现对信号的高效压缩;同时,通过去除不重要的近似系数和细节系数,可以实现对信号的去噪。
其次,小波分解与重构还可以用于信号的特征提取和模式识别。
通过分析不同尺度和频率的小波系数,可以提取信号的特征并进行模式识别。
此外,小波分解与重构还可以用于信号的分析和合成,例如音频信号的压缩和图像信号的处理等。
综上所述,小波分解与重构是一种重要的信号处理技术,它通过一组小波基函数对信号进行分解和重构,可以实现对信号的压缩、去噪、特征提取、模式识别、分析和合成等功能。
在实际应用中,我们可以根据具体的需求选择合适的小波基函数和分解层数,从而实现对不同类型信号的有效处理和分析。
小波分解与重构原理

小波分解与重构原理小波分解与重构是一种将信号分解为不同频率成分的方法,它是一种新兴的数学理论,近年来在信号处理、图像处理、压缩编码等领域得到广泛应用。
小波可以看作是一种基函数,可以用来表示任意一个非周期函数。
小波分解与重构原理便是利用小波基函数将信号进行分解和重构的过程。
首先,需要选择一个合适的小波基函数。
在小波函数中,常用的有Haar小波、Daubechies小波、Coiflet小波等,不同的小波函数适用于不同的信号特性。
接下来,通过小波基函数对原始信号进行分解。
分解的过程是逐级进行的,每一级都将信号分解为近似系数和细节系数两部分。
近似系数表示信号的低频成分,细节系数表示信号的高频成分。
通过迭代的方式,可以得到多个不同尺度的近似系数和细节系数。
分解后得到的近似系数和细节系数可以用于信号分析和处理。
近似系数表示信号的低频内容,可以用来恢复信号的平滑部分;细节系数表示信号的高频成分,可以用来提取信号的细节特征。
在重构过程中,通过逆变换操作将分解得到的近似系数和细节系数重构为原始信号。
重构的过程是逐级进行的,每一级都将近似系数和细节系数进行逆变换操作得到原始信号的一部分,并将其与上一级的逆变换结果相加得到更精确的重构结果。
小波分解与重构具有多尺度分析的特点,可以适应不同频率成分的信号处理需求。
它具有信号特征提取的能力,可以提取信号中的边缘、纹理等细节信息。
同时,小波变换还具有良好的时频局部性,可以很好地适应信号的时变特性。
小波分解与重构的应用十分广泛。
在图像处理中,可以利用小波分解与重构技术进行图像压缩、边缘提取、图像恢复等操作。
在语音信号处理中,可以提取语音的共振频率、噪声成分等信息。
此外,小波分解与重构还可以用于信号分析、数据压缩、图像处理、模式识别等领域。
总之,小波分解与重构是一种将信号分解为不同频率成分的方法,通过小波基函数的选择和分解重构过程,可以提取信号的不同尺度特征,具有良好的时频局部性和多尺度分析能力,广泛应用于各个领域。
matlab小波分解与重构 -回复
matlab小波分解与重构-回复什么是小波分解与重构?小波分解与重构是一种在信号处理领域广泛应用的技术。
它是基于小波函数的变换方法,能够将信号分解成多个频率和时域上局部化的子信号,以及通过这些子信号重构原始信号。
小波分解与重构广泛应用于图像处理、语音识别、数据压缩等领域。
小波分解过程中,信号被分解为多个低频和高频子带信号。
低频子带信号描述了信号的缓慢变化,而高频子带信号描述了信号的快速变化。
分解后的子带信号包含了原始信号的不同频率成分和时域局部特征。
小波重构是将这些子带信号进行逆变换来重构原始信号。
小波分解与重构的步骤如下:1. 选择适当的小波函数:小波函数是用来描述信号的形状和特征的数学函数。
常用的小波函数有Haar小波、Daubechies小波、Symlet小波等。
选择适当的小波函数能够更好地适应信号的特征。
2. 进行分解:使用选择的小波函数进行信号分解。
分解过程中,信号被分解为多个尺度和频率上的子带信号。
通常使用多级分解来获取信号的不同细节和近似信息。
3. 选择分解层数:确定分解的层数是一个重要的步骤。
分解层数的选择取决于信号的特征和应用的要求。
通常,随着分解层数的增加,信号的细节和频率成分会更加详细。
4. 单位归一化:对分解得到的子带信号进行单位归一化处理。
这是为了避免各个子带信号幅值的差异影响分析和重构。
5. 进行重构:使用逆小波变换将分解得到的子带信号重构成原始信号。
逆小波变换使用的是与分解所用小波函数相对应的小波函数。
需要注意的是,小波分解与重构是一种无损的信号处理方法,可以保留原始信号的细节信息。
相比傅里叶变换,小波分解在时域和频域上都具有局部特征,因此能够更好地描述信号的局部特性和时变性。
在MATLAB中,可以使用Wavelet Toolbox进行小波分解与重构。
该工具箱包含了多种小波函数和相关的分析和重构函数,可以方便地进行信号处理和分析。
使用MATLAB进行小波分解与重构的一般步骤如下:1. 导入信号数据:使用MATLAB的数据导入函数将原始信号导入到工作空间。
matlab小波分解与重构 -回复
matlab小波分解与重构-回复Matlab小波分解与重构小波分解与重构是一种在信号处理领域广泛应用的技术,通过对信号进行小波分解可以提取信号中的不同频率成分,并对这些成分进行重构,从而实现信号的压缩、降噪、特征提取等一系列应用。
在Matlab中,小波分解与重构可以通过Wavelet Toolbox实现。
本文将详细介绍Matlab中的小波分解与重构的步骤和应用。
一、准备工作在进行小波分解与重构之前,首先需要导入Wavelet Toolbox。
在MATLAB命令窗口中输入"wavelet"命令,或者直接点击MATLAB工具栏的"Apps"选项卡,然后在"Wavelet Toolbox"中选择Wavelet Analyzer 来打开Wavelet Toolbox工具箱。
二、小波分解1. 导入信号在开始之前,需要先导入需要进行小波分解与重构的信号。
可以通过MATLAB的文件读取函数来读取信号数据。
例如,可以使用`audioread`函数来导入音频信号:matlab[x, fs] = audioread('your_audio_file.wav');其中,`x`为读取到的音频信号,`fs`为采样率。
2. 选择小波函数和参数在进行小波分解之前,需要选择合适的小波函数和分解层数。
在Wavelet Analyzer工具箱中,可以通过"Wavelet"选项卡来选择小波函数。
常用的小波函数有haar、db、sym等。
选择小波函数后,需要指定小波的分解层数。
3. 进行小波分解在选择好小波函数和参数后,可以使用`wavedec`函数进行小波分解。
语法如下:matlab[c, l] = wavedec(x, n, wavelet)其中,`x`为输入信号,`n`为小波的分解层数,`wavelet`为选择的小波函数。
`c`为分解系数向量,`l`为各个分解层级的长度向量。
小波变换分解与重构

小波变换是一种时频分析方法,将信号分解为不同频率的子信号。
它可以用于信号处理、数据压缩、模式识别等领域。
小波变换的分解和重构过程如下:
1. 分解(Decomposition):
a. 选择合适的小波基函数(例如哈尔小波、Daubechies小波等)。
小波基函数是具有局部性质的函数,能够反映不同频率成分的特征。
b. 将原始信号通过小波基函数与尺度函数进行卷积运算得到一组低频信号(approximation,A)和高频信号(detail,D)。
c. 将低频信号进一步分解,得到更低频的近似信号和更高频的细节信号。
这个过程可以迭代多次,形成小波分解的多个层次。
2. 重构(Reconstruction):
a. 从最低频的近似信号(A)开始,通过逆小波变换(inverse wavelet transform)将近似信号和各层的细节信号进行重构。
b. 每次重构时,使用相应的小波基函数逆向卷积
运算,将低频信号和高频信号进行合并,得到上一层的近似信号。
c. 重复上述步骤,直到最终得到重构的原始信号。
小波分解和重构的过程在频域上实现了信号的分离,将时域与频域信息结合起来,能够更好地描述信号的局部特征和瞬态特性。
小波变换的应用广泛,例如图像压缩领域中的JPEG2000标准就使用了小波变换方法。
此外,小波分析还可以用于信号降噪、信号特征提取、边缘检测、图像增强等多个领域,具有很高的实用价值。
小波分解与重构原理
小波分解与重构原理小波分解与重构是一种信号处理和数据分析的方法,它可以将信号分解成不同尺度和频率的成分,从而更好地理解和处理信号。
小波分解与重构原理是基于小波变换的,小波变换是一种时频分析方法,它可以在不同时间尺度上观察信号的频率特性,从而更好地理解信号的局部特征。
本文将介绍小波分解与重构的原理和应用,帮助读者更好地理解和应用这一方法。
小波分解与重构的原理是基于小波变换的,小波变换是一种基于尺度函数和小波函数的变换方法。
在小波分解中,信号可以分解成不同尺度和频率的小波系数,从而更好地理解信号的频率和局部特征。
小波变换可以将信号分解成低频部分和高频部分,低频部分反映信号的整体特征,高频部分反映信号的局部特征。
通过小波分解,可以更好地理解信号的频率特性和局部特征,从而更好地处理和分析信号。
小波分解与重构的过程包括分解和重构两个步骤。
在分解过程中,信号经过小波变换,可以得到不同尺度和频率的小波系数。
小波系数反映了信号在不同尺度和频率上的特性,可以帮助我们更好地理解信号的频率特性和局部特征。
在重构过程中,可以根据小波系数重构原始信号,从而实现信号的分解和重构。
通过小波分解与重构,可以更好地理解和处理信号,从而更好地分析和应用信号。
小波分解与重构在信号处理和数据分析中有着广泛的应用。
在信号处理中,可以利用小波分解与重构方法对信号进行分析和处理,从而更好地理解信号的频率特性和局部特征。
在数据分析中,可以利用小波分解与重构方法对数据进行分解和重构,从而更好地理解数据的结构和特征。
小波分解与重构方法在图像处理、语音处理、生物医学信号分析等领域有着重要的应用,可以帮助我们更好地理解和处理信号和数据。
总之,小波分解与重构是一种重要的信号处理和数据分析方法,它可以帮助我们更好地理解和处理信号,从而更好地分析和应用信号。
通过小波分解与重构,可以更好地理解信号的频率特性和局部特征,从而更好地处理和分析信号。
希望本文能够帮助读者更好地理解小波分解与重构的原理和应用,从而更好地应用这一方法。
小波的分解与重构,去噪。
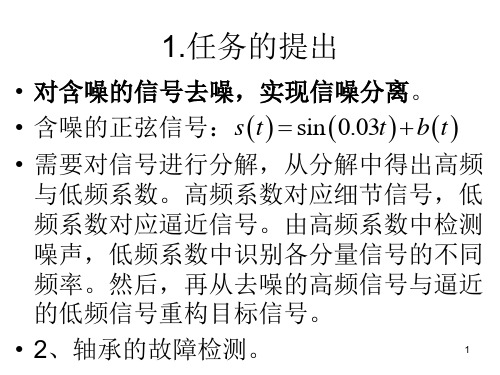
• 对含噪的信号去噪,实现信噪分离 对含噪的信号去噪,实现信噪分离。 • 含噪的正弦信号: s ( t ) = sin ( 0.03t ) + b ( t ) • 需要对信号进行分解,从分解中得出高频 与低频系数。高频系数对应细节信号,低 频系数对应逼近信号。由高频系数中检测 噪声,低频系数中识别各分量信号的不同 频率。然后,再从去噪的高频信号与逼近 的低频信号重构目标信号。 • 2、轴承的故障检测。
6
2、仿真验证去噪效果
1、含噪信号的分解与重构
• • • • • • • • • • • • • • • % 生成含噪正弦信号 N=1024; t=1:N; sig=sin(0.03*t); figure(1);subplot(211);plot(t,sig); title('正弦信号'); % 叠加噪声 x=sig+randn(1,N); subplot(212);plot(t,x); title('含噪正弦信号'); % 一维小波分解,使用'haar'进行4层分解 [c,l]=wavedec(x,4,'haar'); % 重构第1-4层逼近信号 a4=wrcoef('a',c,l,'haar',4); a3=wrcoef('a',c,l,'haar',3); a2=wrcoef('a',c,l,'haar',2); a1=wrcoef('a',c,l,'haar',1);
ck +1, n = ∑ (ck ,l pn − 2l 来自 d k ,l qn − 2l )
python小波包分解与重构

python小波包分解与重构小波包分解与重构是一种在信号处理和数据分析中常用的方法,它可以将信号分解成不同尺度和频率的子信号,并通过重构将这些子信号重新组合成原始信号。
本文将介绍小波包分解与重构的原理、方法和应用。
一、小波包分解的原理小波包分解是基于小波变换的一种方法,它通过将信号与一组基函数进行卷积运算,将信号分解成不同尺度和频率的子信号。
小波包分解与小波变换的区别在于,小波包分解可以对不同频段的信号进行更精细的分解,从而得到更多尺度和频率的信息。
小波包分解的核心思想是将信号分解成低频和高频部分,然后对高频部分再进行进一步的分解,直到达到所需的精度。
在每一次分解中,信号会被分解成两部分,一部分是低频信号,另一部分是高频信号。
通过不断重复这个过程,就可以获得不同尺度和频率的子信号。
二、小波包分解的方法小波包分解的方法主要包括选择小波基函数和确定分解层数两个步骤。
1. 选择小波基函数小波基函数是小波包分解的基础,不同的小波基函数具有不同的性质和特点。
常用的小波基函数有Haar、Daubechies、Symlet等。
选择合适的小波基函数可以根据信号的特点和需求来确定。
2. 确定分解层数分解层数决定了信号被分解成多少个子信号。
分解层数越大,分解得到的子信号越多,分解的精度也越高。
但是过多的分解层数会导致计算量增加,同时也可能引入不必要的噪音。
确定分解层数需要在信号的特性和计算效率之间进行权衡。
三、小波包重构的方法小波包重构是将小波包分解得到的子信号重新组合成原始信号的过程。
小波包重构的方法与小波包分解的方法相反,它通过逆向的操作将子信号合并成原始信号。
小波包重构的方法包括选择合适的子信号和确定重构层数两个步骤。
1. 选择合适的子信号选择合适的子信号是小波包重构的关键,不同的子信号包含了不同尺度和频率的信息。
根据需求和应用场景,选择合适的子信号可以提取出感兴趣的信息。
2. 确定重构层数重构层数决定了重构信号的精度。
如何进行小波分解和重构
如何进行小波分解和重构小波分解与重构是信号处理领域中重要的技术手段之一。
它可以将复杂的信号分解为不同频率的子信号,并且能够保留信号的时频特性。
本文将介绍小波分解与重构的基本原理和步骤,并探讨其在实际应用中的一些技巧和注意事项。
一、小波分解的基本原理小波分解是一种多尺度分析方法,它通过将信号与一组基函数进行卷积运算来实现信号的频域分解。
这组基函数称为小波函数,它具有时频局部化的特性,可以有效地捕捉信号的瞬时特征。
小波分解的基本原理可以用数学公式表示为:\[x(t) = \sum_{k=0}^{N-1} c_{j,k} \phi_{j,k}(t) + \sum_{j=1}^{J}\sum_{k=0}^{N-1} d_{j,k} \psi_{j,k}(t)\]其中,\(x(t)\)为原始信号,\(c_{j,k}\)和\(d_{j,k}\)分别表示近似系数和细节系数,\(\phi_{j,k}(t)\)和\(\psi_{j,k}(t)\)为小波基函数。
二、小波分解的步骤小波分解的具体步骤如下:1. 选择小波基函数:根据信号的特性和需要,选择合适的小波基函数。
常用的小波基函数有Haar小波、Daubechies小波、Morlet小波等。
2. 信号预处理:对原始信号进行必要的预处理,如去除噪声、归一化等。
3. 小波分解:将预处理后的信号与小波基函数进行卷积运算,得到近似系数和细节系数。
4. 选择分解层数:根据需要,确定分解的层数。
分解层数越多,分解的频带越多,但计算量也增加。
5. 重构信号:根据近似系数和细节系数,利用小波基函数进行逆变换,得到重构后的信号。
三、小波重构的技巧和注意事项小波重构是将分解后的信号恢复到原始信号的过程,下面介绍一些技巧和注意事项:1. 选择适当的重构滤波器:在小波重构中,需要选择适当的重构滤波器。
常用的重构滤波器有低通滤波器和高通滤波器,它们与小波基函数相对应。
2. 选择合适的重构层数:重构层数决定了重构信号的频带范围和精度。
matlab小波分解与重构 -回复
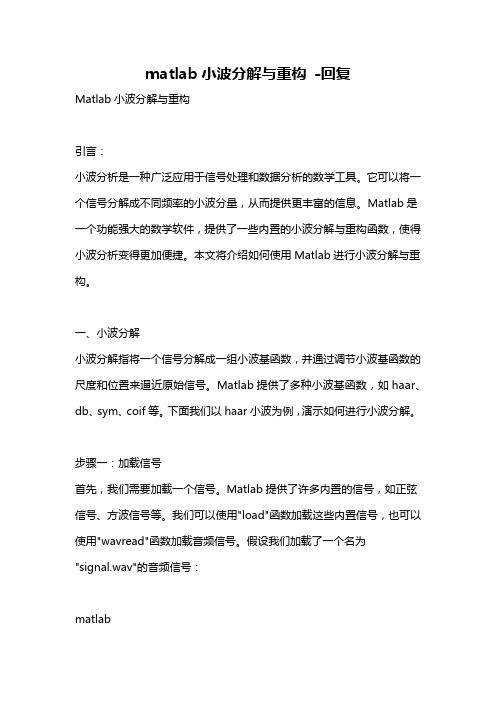
matlab小波分解与重构-回复Matlab小波分解与重构引言:小波分析是一种广泛应用于信号处理和数据分析的数学工具。
它可以将一个信号分解成不同频率的小波分量,从而提供更丰富的信息。
Matlab是一个功能强大的数学软件,提供了一些内置的小波分解与重构函数,使得小波分析变得更加便捷。
本文将介绍如何使用Matlab进行小波分解与重构。
一、小波分解小波分解指将一个信号分解成一组小波基函数,并通过调节小波基函数的尺度和位置来逼近原始信号。
Matlab提供了多种小波基函数,如haar、db、sym、coif等。
下面我们以haar小波为例,演示如何进行小波分解。
步骤一:加载信号首先,我们需要加载一个信号。
Matlab提供了许多内置的信号,如正弦信号、方波信号等。
我们可以使用"load"函数加载这些内置信号,也可以使用"wavread"函数加载音频信号。
假设我们加载了一个名为"signal.wav"的音频信号:matlab[x, fs] = wavread('signal.wav');步骤二:进行小波分解接下来,我们需要选择一个小波基函数进行分解。
在Matlab中,可以使用"wavename"函数来列出所有可用的小波基函数。
我们选择haar小波进行分解:matlabwname = 'haar';[c, l] = wavedec(x, N, wname);其中,"wavedec"函数用于进行小波分解,输入参数"signal"为待分解信号,"N"为分解的层数,"wname"为选择的小波基函数。
该函数的输出包括分解系数矩阵"c"和尺度参数向量"l"。
步骤三:可视化分解结果分解后的信号可以通过可视化来进行观察和分析。
小波分解与重构原理

小波分解与重构原理1. 选择适当的小波函数:小波函数是用来描述信号或图像在不同尺度上的变化的函数。
小波函数具有时频局部性的特性,可以将信号或图像在时间和频率上进行精细刻画。
常用的小波函数有Haar小波、Daubechies小波和Morlet小波等。
2.分解过程:将原始信号或图像通过小波函数进行分解,得到一组不同尺度上的近似和细节信息。
分解过程可以看作是对信号或图像在不同频段的频率分量进行提取。
3.分解系数的计算:在分解过程中,需要计算每个尺度的近似和细节系数。
近似系数表示信号或图像在该尺度上的低频成分,细节系数表示信号或图像在该尺度上的高频成分。
通常采用小波变换或离散小波变换来计算分解系数。
4.选择截断阈值:为了降低分解系数的维数和噪声的影响,需要选择合适的截断阈值。
截断阈值用于将小于阈值的分解系数置为零,从而实现信号或图像的稀疏表示。
5.重构过程:将经过截断阈值处理后的分解系数进行逆变换,得到重构信号或图像。
重构过程可以看作是对近似和细节信息进行合并和拼接,从而实现对信号或图像的还原。
1.多分辨率分析能力:小波分解与重构可以将信号或图像在不同尺度上进行分解和重构,从而实现对信号或图像的多尺度分析和描述。
利用不同尺度上的近似和细节信息,可以更全面地描述信号或图像的特征和结构。
2.时频局部性特性:小波分解与重构的小波函数具有时频局部性的特性,可以更精确地描述信号或图像在时间和频率上的变化。
相比于傅里叶变换和小波包分解,小波分解与重构可以更好地捕捉信号或图像的局部特征。
3.自适应性:小波分解与重构可以根据不同应用的需求,选择合适的小波函数和尺度参数。
通过调整小波函数和尺度参数,可以实现对不同类型信号或图像的自适应分析和处理。
4.稀疏性表示:小波分解与重构可以将信号或图像的分解系数进行截断和稀疏表示,从而实现对信号或图像的压缩和降噪。
通过选择适当的截断阈值,可以抑制噪声对信号或图像的影响,提高信号或图像的质量和可读性。
小波分解与重构原理

小波分解与重构原理小波分解与重构是一种信号处理技术,它可以将信号分解成不同频率的小波分量,并且可以通过这些小波分量来重构原始信号。
这项技术在许多领域都有广泛的应用,比如图像处理、音频处理、医学图像分析等。
在本文中,我们将介绍小波分解与重构的原理,以及它在实际应用中的一些特点。
首先,让我们来了解一下小波分解的原理。
小波分解是通过一组小波基函数对信号进行分解的过程。
小波基函数是一种特殊的函数,它可以在时间和频率上进行局部化,这意味着它可以在不同的时间点和频率范围内对信号进行分析。
通过对信号进行小波分解,我们可以得到不同尺度和频率的小波系数,从而揭示出信号在不同频率上的特征。
接下来,让我们来看一下小波重构的原理。
小波重构是通过小波系数和小波基函数的线性组合来重构原始信号的过程。
通过将不同尺度和频率的小波系数与小波基函数进行线性组合,我们可以得到原始信号的近似重构。
在实际应用中,通常只需要保留部分小波系数,就可以对原始信号进行有效的重构,这样可以实现信号的压缩和去噪。
小波分解与重构的原理非常简单,但是它却具有许多优点。
首先,小波分解可以提供多尺度分析,这意味着我们可以同时获得信号在不同频率上的信息,从而更全面地理解信号的特征。
其次,小波分解具有局部化特性,这意味着我们可以在时间和频率上对信号进行局部分析,从而更准确地捕捉信号的局部特征。
此外,小波分解还可以实现信号的压缩和去噪,这对信号处理和分析非常有用。
在实际应用中,小波分解与重构可以用于许多领域。
在图像处理中,小波分解可以用于图像压缩和去噪,从而减小图像文件的大小并提高图像的质量。
在音频处理中,小波分解可以用于音频压缩和音频信号的分析。
在医学图像分析中,小波分解可以用于医学图像的特征提取和分析。
总之,小波分解与重构在各个领域都有着广泛的应用前景。
综上所述,小波分解与重构是一种非常有用的信号处理技术,它可以在不同尺度和频率上对信号进行分析,并且可以实现信号的压缩和去噪。
小波包分解与重构详解
小波包分解与重构详解
小波包分解与重构是一种信号处理方法,常用于对非平稳信号进行分析和重构。
它是基于小波变换的一种扩展,可以更好地捕捉信号的时频特性。
在小波包分解中,信号被分解成不同频率和不同时间分辨率的子带。
这些子带
可以看作是信号在不同尺度上的局部近似。
通过将信号分解成不同的尺度,可以更好地理解信号在不同频率上的含义。
小波包分解包括两个步骤:分解和重构。
在分解过程中,信号通过一系列低通
和高通滤波器进行滤波和下采样,从而得到不同频率范围的子带。
这些子带分别代表了信号在不同频率上的能量分布。
分解得到的子带可以进一步分解,形成小波包树结构。
小波包树是一种多层的
分解结构,每一层代表了不同频率和尺度的分量。
通过提取感兴趣的子带,可以得到关于信号的更多详细信息。
在重构过程中,可以通过对子带进行滤波和上采样,将子带进行逐层重建,最
终得到重构的信号。
重构后的信号可以近似地表示原始信号,但在不同频率上的能量分布可能有所不同。
小波包分解与重构的优点在于能够提供更灵活的信号分析和处理方式。
通过选
择不同的滤波器和分解层数,可以根据特定的应用需求进行信号分析和重构。
总结而言,小波包分解与重构是一种用于分析和重构非平稳信号的信号处理方法。
它通过将信号分解成不同频率和时间分辨率的子带,可以更准确地描述信号的时频特性。
通过选择不同的参数,可以实现不同应用场景下的信号处理需求。
小波变换的基本原理与理论解析

小波变换的基本原理与理论解析小波变换(Wavelet Transform)是一种在信号处理和图像处理领域中广泛应用的数学工具。
它通过将信号分解成不同频率和时间的小波分量,可以有效地捕捉信号的局部特征和时频特性。
本文将介绍小波变换的基本原理和理论解析。
一、小波变换的基本原理小波变换的基本原理可以概括为两个步骤:分解和重构。
1. 分解:将原始信号分解为不同尺度和频率的小波分量。
这个过程类似于频谱分析,但是小波变换具有更好的时频局部化特性。
小波分解可以通过连续小波变换(Continuous Wavelet Transform,CWT)或离散小波变换(Discrete Wavelet Transform,DWT)来实现。
在连续小波变换中,原始信号与一组母小波进行卷积,得到不同尺度和频率的小波系数。
母小波是一个用于分解的基本函数,通常是一个具有有限能量和零平均的函数。
通过在时间和尺度上的平移和缩放,可以得到不同频率和时间的小波分量。
在离散小波变换中,原始信号经过一系列低通滤波器和高通滤波器的处理,得到不同尺度和频率的小波系数。
这种方法更适合于数字信号处理,可以通过快速算法(如快速小波变换)高效地计算。
2. 重构:将小波分量按照一定的权重进行线性组合,恢复原始信号。
重构过程是分解的逆过程,可以通过逆小波变换来实现。
二、小波变换的理论解析小波变换的理论解析主要包括小波函数的选择和小波系数的计算。
1. 小波函数的选择:小波函数是小波变换的核心,它决定了小波变换的性质和应用范围。
常用的小波函数有Morlet小波、Haar小波、Daubechies小波等。
不同的小波函数具有不同的时频局部化特性和频谱性质。
例如,Morlet小波适用于分析具有明显频率的信号,而Haar小波适用于分析信号的边缘特征。
选择合适的小波函数可以提高小波变换的分辨率和抗噪性能。
2. 小波系数的计算:小波系数表示了信号在不同尺度和频率上的能量分布。
python小波包分解与重构
python小波包分解与重构小波包分解与重构是一种常用的信号分析和处理方法,通过将信号分解为不同频率的子信号,并根据需要对子信号进行处理和重构,以实现对信号的分析和提取感兴趣的信息。
本文将介绍小波包分解与重构的基本原理和步骤,并通过Python编程实现。
一、小波包分解小波包分解是指将信号通过小波包变换分解为不同频率的子信号。
小波包变换是在小波变换的基础上进行的,其基本思想是将信号分解为低频和高频成分,然后再将高频成分进行进一步的分解。
这种多层次的分解方式可以更好地揭示信号的频率特征。
小波包分解的步骤如下:1. 选择合适的小波基函数和分解层数。
小波基函数是小波变换的基础,不同的小波基函数具有不同的特性,选择合适的小波基函数可以更好地适应信号的特点。
分解层数表示对信号进行多少次的分解。
2. 对信号进行小波包分解。
首先将信号进行小波变换得到低频和高频成分,然后对高频成分进行进一步的分解,重复这个过程直到达到设定的分解层数。
3. 对分解得到的子信号进行处理。
根据需要可以对分解得到的子信号进行滤波、去噪、特征提取等操作,以实现对信号的分析和提取感兴趣的信息。
二、小波包重构小波包重构是指根据分解得到的子信号,通过逆小波包变换将其重构为原始信号。
小波包重构的过程与小波包分解相反,首先将分解得到的子信号进行逆小波变换得到高频成分,然后将高频成分与低频成分进行逆小波变换得到原始信号。
小波包重构的步骤如下:1. 对分解得到的子信号进行逆小波变换,得到高频成分。
2. 将高频成分与低频成分进行逆小波变换,得到重构后的信号。
三、Python实现小波包分解与重构在Python中,可以使用PyWavelets库来实现小波包分解与重构。
PyWavelets是一个开源的小波变换库,提供了丰富的小波基函数和变换方法。
需要安装PyWavelets库。
可以使用pip命令进行安装:```pip install PyWavelets```然后,可以使用以下代码实现小波包分解与重构:```pythonimport pywt# 选择小波基函数wavelet = 'db4'# 选择分解层数level = 3def wavelet_packet_decomposition(signal, wavelet, level):# 进行小波包分解wp = pywt.WaveletPacket(data=signal, wavelet=wavelet, mode='symmetric', maxlevel=level)return wpdef wavelet_packet_reconstruction(wp, wavelet):# 进行小波包重构signal = wp.reconstruct(update=False)return signal# 原始信号signal = [1, 2, 3, 4, 5, 6, 7, 8, 9, 10]# 进行小波包分解wp = wavelet_packet_decomposition(signal, wavelet, level)# 进行小波包重构reconstructed_signal = wavelet_packet_reconstruction(wp,wavelet)print("原始信号:", signal)print("重构信号:", reconstructed_signal)```在上述代码中,首先选择了小波基函数和分解层数,然后定义了小波包分解和重构的函数。
小波变换分解与重构
小波变换分解与重构小波变换(Wavelet Transform)是信号分析的一种重要工具,以其优良的时频局部性特性,被广泛应用于信号处理、图像处理、音频压缩等领域。
小波变换既可以对信号进行分解,也可以进行重构,实现从时域到频域的转换。
小波分解是指将信号分解为不同尺度、不同频率的子信号,以便对信号的各个频段分别进行分析。
在小波分解中,采用不同长度的小波基函数(Wavelet)对信号进行卷积运算,得到小波系数,其代表了信号在不同频率和尺度下的能量分布。
常用的小波函数有Haar小波、Daubechies小波等,选择不同的小波函数可以适应不同的信号特性。
小波变换的分解过程可以看作是一个多分辨率分析的过程。
通过多级分解,可以分解出信号的低频分量和高频分量。
低频分量代表了信号的整体趋势,而高频分量代表了信号的细节信息。
分解直到最后一层,得到的低频部分就是信号的近似部分,而高频部分则代表了信号的细节信息,也称为细节系数。
通过不同的分解层数,可以得到不同尺度上的细节系数,从而实现对信号的多尺度分析。
小波重构是指根据分解得到的低频部分和高频部分,重新合成原始信号的过程。
通过逆向的小波变换,可以从小波系数中恢复出原始信号。
重构的过程可以分为逐层重构和全局重构两种方法。
逐层重构是指从最高频率的细节系数开始逐步重构,直到最后得到完整的信号。
全局重构是指直接从低频部分开始重构,将所有细节系数一次性加回来,得到完整的信号。
重构的结果与原始信号相比,通常存在一定的误差,但可以通过调整小波系数的阈值或适当选择小波基函数来减小误差。
小波变换的分解与重构在信号处理中具有广泛的应用。
在图像处理中,可以利用小波变换将图像分解为不同频带的子图像,以实现图像增强、去噪、压缩等功能。
在音频处理中,可以利用小波变换对音频信号进行分析,实现音频特征提取、语音识别等任务。
在通信领域,小波变换可以用于信号的压缩和解压缩,以提高信号传输效率。
总之,小波变换的分解与重构是信号分析的一种有效方法,在各个领域都有广泛的应用。
- 1、下载文档前请自行甄别文档内容的完整性,平台不提供额外的编辑、内容补充、找答案等附加服务。
- 2、"仅部分预览"的文档,不可在线预览部分如存在完整性等问题,可反馈申请退款(可完整预览的文档不适用该条件!)。
- 3、如文档侵犯您的权益,请联系客服反馈,我们会尽快为您处理(人工客服工作时间:9:00-18:30)。
figure(2);
lev_1=lev+1;
for i=1:lev
cD=detcoef(C,L,i);
subplot(lev_1,1,i)
plot(cD);
ylabel(['cD',num2str(i)]);
Fs=1000; % 采样频率
Ts=1/Fs; % 采样间隔
N=1024; % 采样点数
t=[0:1/Fs:(N-1)/Fs]; %采样时刻
lev=5;
x=sin(2*pi*f1*t);
figure(1);
plot(t,x);
%%小波分解
[C,L]=wavedec(x,lev,'db10'); %C由[cAj,cDj,cDj-1,...,cD1]
subplot(2,2,4);
image(hd2+dd2+vd2+a1);colormap(map);
% 验证这些图像的长度都是sX
sX = size(X)
sa1 = size(a1)
shd2 = size(hd2)
norm(hd2+dd2+vd2+a1-X)
结果:
sX =
256 256
plot(A);
title('原始信号')
subplot(3,1,2);
plot(a0);
title('重构信号')
subplot(3,1,3);
plot(A-a0);
title('误差信号')
err=max(abs(A-a0))
%重构第1~5层高频细节信号
d9=wrcoef('d',c,l,'db5',9);
p=abs(fft(ydata,nfft));
figure(4);
plot((0:nfft/2-1)/nfft*fs,p(1:nfft/2));
xlabel('频率 f/Hz');
ylabel('功率谱 P/W');
小波分解与重构程序
>> clear
I=imread('C:\Documents and Settings\Administrator\桌面\暑期/cidian.bmp');
clear;
% 装载图像
load woman;
% X包含载入的图像
% 绘制原始图像
figure(1);
subplot(2,2,1);
image(X);
colormap(map);
title('原始图像');
% 使用sym5对X进行尺度为2的分解
[c,s] = wavedec2(X,2,'sym5');
A0=idwt2(cA,cH,cV,cD,' db4', sX);
subplot(2,2,2);
imshow(A0,map);
title('db4小波重构');
error1=max(max(abs(X-A0)))
程序很简单,也很基础。不要以为你见过,其实仔细看,有一些改进哦。
clc;
% exa130301.m 例13.3.1: 利用小波变换模极大重建原信号
%-----------------------------------
close all;
points=1024; level=6; sr=360; num_inter=6; wf='db3';
d8=wrcoef('d',c,l,'db5',8);
d7=wrcoef('d',c,l,'db5',7);
d6=wrcoef('d',c,l,'db5',6);
d5=wrcoef('d',c,l,'db5',5);
d4=wrcoef('d',c,l,'db5',4);
d3=wrcoef('d',c,l,'db5',3);
data{1:end};
A=ans(2:end);
for i=1:609;
if A(i)>50.0;
A(i)=(A(i-12)+A(i+12))/2;
end
end
for i=609:612;
if A(i)>50.0;
A(i)=(A(i-12)+A(i-24))/2;
end
end
% 从小波分解结构[c,s]进行尺度为1和2时的低频重构
a1 = wrcoef2('a',c,s,'sym5',1);
a2 = wrcoef2('a',c,s,'sym5',2);
% 绘制尺度为1时的低频图像
subplot(2,2,3);
image(a1);colormap(map);
wsnr(m)=20*log10(norm(swd(m,: ))/norm(werr(m,: )))
subplot(level+1,1,m);
plot(swd(m,: )),hold on,
plot(w2(m,: ),'r');grid on;ylabel(strcat('j=',num2str(m))),axis tight;
%信号时域波形
figure(1);
plot(1:612,A);
%使用db5小波进行尺度为7时的分解
[c,l]=wavedec(A,9,'db5');
%从小波分解结构[c,l]重构信号xdata
a0=waverec(c,l,'db5');
%检查重构效果
figure(2);
subplot(3,1,1);
title('尺度为2时的水平高频图像');
subplot(2,2,2);
image(vd2);colormap(map);
title('尺度为2时的垂直高频图像');
subplot(2,2,3);
image(dd2);colormap(map);
title('尺度为2时的对角高频图像');
title('尺度为1时的低频图像');
% 绘制尺度为2时的低频图像
subplot(2,2,4);
image(a2);colormap(map);
title('尺度为2时的低频图像');
% 从小波分解结构[c,s]在尺度为2时重构高频
% 'h' 是水平方向
% 'v' 是垂直方向
% 'd' 是对角方向
[a,d]=swt(w0,level,Lo_D,Hi_D); % Pv
end
pswa=iswt(swa(level,: ),w2,Lo_R,Hi_R); % 计算重建信号
% 原信号和由模极大重建信号的比较
figure,
subplot(211)
ylabel('d2');
xlabel('时间 t/s');
subplot(9,1,9);
plot(d1,'LineWidth',2);
ylabel('d1');
%第1层高频细节信号的包络谱
y=hilbert(d1);
ydata=abs(y);
y=y-mean(y);
nfft=1024;
I=rgb2gray(I);
[X,map]=gray2ind(I);
subplot(2,2,1);
imshow(X,map);
title('原始图像');
X=double(X);
sX=size(X);
[cA,cH,cV,cD]=dwt2(X,'db4');
sa1 =
256 256
shd2 =
256 256
ans =
8.106902321771278e-010
分析:
由ans的值可以看到,重构的效果几乎完美!
小波变换的模极大值重建信号源程序
这是用小波变换模极大值重建信号的源程序,数据是一心电信号,在matlab6.5下实现,来源于胡广书的《现代信号处理教程》附属光盘程序包含四个部份,其中wave_peak实现信号的分解并求出模极大值%--------------------------------------------------------------------------
ylabel('d5');
subplot(9,1,6);
plot(d4,'LineWidth',2);
ylabel('d4');
subplot(9,1,7);
plot(d3,'LineWidth',2);
ylabel('d3');
subplot(9,1,8);