高考英语作文专题复习-图表类说明文
高考英语图表类作文写作技巧讲解

高考英语图表类作文写作技巧讲解一、考点分析图表作文以说明文和议论文为主。
考查时要求学生根据所给的图表、数据等进行分析,阅读文字和说明,然后组织语言进行写作,得出令人信服的结论,必要时还要加入个人观点。
二、专题详解1)文体一:说明文文体特点:(重事实)说明文是以说明为主要表达方式,用简洁明了的语言来解释说明事物,阐明事理。
它要求语言要简明扼要,客观准确。
框架:第一段:概括说明内容常用的词有:1.table, a pie chart饼图, a bar chart柱状图, graph, survey, picture2.describe, show, represent, illustrate, reveal,3. figure, statistic, number, percentage, proportion常用的开篇句型(即概述图表内容时常用的表达法):1.The graph/chart/table above shows / describes / illustrates that...2. From the above graph/chart, it can be seen that…3. As shown in the graph / survey, …4.The chart/table shows the differences between…5. I launched an inquiry into… / I conducted a survey on… / to…第二段:描述变化情况并分析引起变化的因素A. 写作关键:1.对比分析,寻找数据的变化规律;2.筛选数据这些数据是否具有典型代表性、是否需要一一列出?一般而言首尾数字以及增减值是必需的;3.强调数据间的关系,突出变化。
B. 常用词汇和套语:a.描写数据变化常用套语:增加:1.There was a great / stable / slight increase /rise in…倍数:2.The number /rate has nearly doubled, compared with that of last year.3.The number is …times as much as that of….保持不变:4.In 1985, the number remained the same.减少:5. There was a gradual/sharp decline in 1989.分别列举:6. The numbers / percentages are… and…respectively.b.说明因果关系表示原因:as / since / due to / owning to / thanks to / because (of)进一步解释:that is to say / to put it another way表示结果:therefore / thus / as a result ( consequence), so that提示例证:(take…)for example / instance, …such as (一般不用于句首),常用套语:提出第一个原因:The first reason can be seen by every person.The first and most impo rtant reason / One of the premier causes is that…解释某一种现象:…is the cause of ……mainly / partially contribute(s) to the tendency of……account(s) for the fact / phenomenon…总括性解释原因:There exist… reasons, which may account for this difference.The reasons for the phenomenon may be as follows:There are several causes for this significant growth in….例证:This point can be confirmed by the fact / example of + nn + is a case in point.第三段:总结归纳/提议/提出解决办法结尾常用套语1.In my opinion / Perso nally / As far as I’m concerned2.In short/ In brief/ In a word/ In conclusion /In summary/ To sum up,3. From what has been discussed above, we can draw the conclusion that…4. Obviously, if we want to…, it is necessary…/ There is no doubt that atten tion must be paid…2)文体二:议论文文体特点:(重说理)议论文是以议论为主要表达方式的一种文体。
(完整)高考英语写作图表说明文模板范文
高考英语指导写作专题:图表说明文一,图表说明1,分类:数字表、函数关系图、曲线图(graph);表格(table);几何图形(figure);图形表、饼状图(pie chart);条状图、柱状图(bar chart);平面图、示意图、外形图(diagram)。
2,一般可分三个层次来写:按照题目要求描述图表反映的总情况,即概括大意。
对数字进行仔细的比较,抓住特点进行分析、归纳并找出产生变化的原因。
读图表后的想法、结论、评论或针对反映出的问题采取的解决措施。
二.表达方式:1,常用的描述句型The table/chart/diagram/graph shows that ...According to the table/chart/diagram/graph...As is shown in the table/chart/diagram/graph...As can be seen from the table/chart/diagram/graph/figures...We can see from the figures/statistics...It is clear/ apparent from the figures/statistics...2.图表中数据(data)的具体表达法数据(data)在某一个时间段固定不变:fixed in time在一系列的时间段中转变:changes over time增加:increase/raise/rise/...减少:decrease/grow down/drop/fall/decline稳定:remain stable3.描写变化的形容词及副词rapid/rapidly,dramatic/dramatically,significant/significantly,sharp/sharplysteep/steeply,steady/steadily,gradual/gradually,slow/slowly,slight/slightly三、写作模板As (is) shown/indicated by the figure/in the table/graph/pie chart/chart,_____ has been increased/decreased significantly/steadily from _____ to_____. From the sharp decline/rise in the chart,it goes without saying that_____.There are at least two reasons accounting for / contributing to ____. On the one hand, _____ On the other hand, _____. _____is due to the fact that_____. In addition,_____is responsible for_____. Maybe there are other reasons to show. But it is generally believed that the above mentioned reasons are commonlyconvincing/persuasive.As far as I am concerned,I hold the view that_____. I am sure my opinion is both sound and well-grounded.四,作文范例1,最近你校对中学生的消费情况进行了调查。
高考英语作文专题复习图表类说明文

2. As is shown in the graph, ... 3. It has been shown from the table that…
描述数据变化常用句型:网 zxxk
1.There was a great /slight increase /rise in… 2.There has been a sudden/slow/rapid fall/drop in… 3.The rate dropped slightly from 38%in…to 31% in… 4. Statistics show a 20% rise/reduction in traffic accidents compared with last year. 5. The population owning mobile phones increased by 10% in 1999.
描述图表数据内容并点明主题
There are at least two reasons accounting for /contributing to this. On the one hand, with the development of the economy and our society, more and more people live a rich life, therefore their kids have more money to spend on things they like. On the other hand, they don’t have to worry about food any more, people have more chance to persue the inner fulfillment, so they spend more to buy clothes and iterms concerning entertainment.
图表型说明文英语范文

图表型说明文英语范文英文回答:## The Power of Charts: Unveiling the Insights in Data.Charts are visual representations of data that simplify complex information and make it more accessible and understandable. They play a crucial role in data analysis, enabling us to identify patterns, trends, and relationships that would otherwise be difficult to discern from raw data alone.### Types of Charts.There are numerous types of charts, each suited to specific data types and analysis purposes. Some common types include:Bar charts: Represent data as vertical or horizontal bars, with the length of the bars indicating the value ofthe data points.Line charts: Connect data points with lines, showing the trend or progression of data over time or with respect to other variables.Pie charts: Divide data into slices representing different categories' proportions.Scatter plots: Plot individual data points as dots on a coordinate plane, highlighting the relationship between two variables.Histograms: Display the distribution of data bydividing the range into bins and showing the frequency of occurrence within each bin.### Benefits of Using Charts.Charts offer several advantages over raw data:Improved comprehension: Visualizing data makes iteasier to understand patterns, trends, and relationships than reading numerical tables.Easy identification of outliers: Charts can highlight unusual data points that may represent errors orsignificant deviations from the norm.Facilitate comparisons: Charts allow for quick and easy comparisons between different datasets or data subsets.Enhance presentations: Charts can make presentations more visually appealing and engaging, enhancing the audience's understanding of the data.### How to Create Effective Charts.Creating informative and visually effective charts requires careful attention to the following principles:Choose the right chart type: Select the chart type that best suits the data and analysis objectives.Use clear labels: Label axes, titles, and legendsclearly and concisely to guide readers through the chart.Ensure appropriate scale: Use a scale that accurately represents the range of data and avoids distorting the patterns.Highlight important features: Use color, size, or other visual cues to emphasize key insights or areas of interest.### Conclusion.Charts are a powerful tool for data analysis and communication. They transform complex numerical data into visual representations that reveal insights, facilitate understanding, and support informed decision-making. By understanding the different types of charts, their benefits, and best practices for creating them, we can harness the power of charts to unlock valuable insights from data.中文回答:## 图表的力量,揭示数据中的见解。
高考英语精考点 作文指导之图表说明文

毛额市鹌鹑阳光实验学校高考英语作文指导之图表说明文一、图表说明文的常见类型1.以表格形式,将统计的数据或被说明的事物直接用表格形式体现出来2.表示数据的大小或数量之间的差异的柱状图3.表示数据变化的曲线图4.表示总体内部结构变化的扇形图二、图表作文的一般结构:建议用三段式作文三、图表类说明文的写作结构:第一段:开门见山地点明本图表所反映的主题, 即conclusion.第二段:分析数据间的主要差异及趋势,然后描写(在描写数据间变化及总趋势特征时,可采用分类式或对比式以支持主题,并阐明必要的理由)。
注意层次。
第三段:归纳总结或发表评论四、写作步骤:1.审题(四确定)1)确定类型2)确定体裁3)确定主体时态4)确定主体人称2.列要点3.依要点, 拟草纲, 组织成句.4.构篇章,扩句成文.5.检查润色6.书写五、图标说明文常用词句。
1.常用词汇:table(表格, 项目表), chart(图表), graph(图表, 曲线图),figure(数据),rate (比列,比率),make a survey about…(做关于…的调查) , describe, tell, show, represent, Obviously/Apparently (很明显地),rise,increase(增多,增加),climb,go up, fall,decline(下降),decrease(减少,减低),drop,go down, ….2.常用句型:1).The rate of … is2).There was a great /slight increase /rise in…3).The main reason is that ….4).The rate dropped slightly from 38%in… to 31% in…5). By comparison with…, it decreased/increased/fell from…to…6). From Chart 1, / According to Chart 2, /As is shown on Chart 1,7)Besides/ What’s more/What’s worse.8)In a word/In short/ Generally speaking /In summary/ As faras I am concerned.3.单句训练:1.由表1,我们可以看出……2.最近的一项关于人们怎样度假的调查表明。
高中英语基础写作——图表类说明文

倍数的表达:
1.The number /rate has nearly _______ doubled ...的两倍 的两倍) (是...的两倍), as against that of last year. 2.The number is five times as many as that of…. (是…的5倍) 的 倍 =The number is four times more than in…(比...多4倍) 比...多
Possible Version: As can be seen from the graph, great changes in car ownership have taken place in China in the past ten years. The number of private cars increased more than 5 times from nearly 3 million in 1999 to over 15 million in 2009. It’s mainly because the economy of China has developed so rapidly that many Chinese people want to own private cars. Besides, in modern society, many Chinese need a car to do business so as to save time. In my view, as the car ownership constantly increases year by year, a large number of social problems, such as traffic jams, will turn up in nearly every city throughout China.
高考英语 作文高分攻略专题三 图表作文-人教版高三全册英语试题

专题三:图表作文【命题规律】从近几年高考真题来看,图表作文体裁多为议论文、应用文和说明文,内容涉与前后变化比照等方面。
要求考生通过数据分析,表达图表含义,得出合理结论。
其考查形式有表格式和图形式两种。
其中图形式又有三种情况:①表示数据变化的曲线图,②表示数据的大小或数量之间差异的柱状图,③表示总体内部结构变化的饼状图。
图形式的题目多为说明文。
【备考策略】1.描述图表内容特别是图表中的变化趋势.(先总的变化趋势,后重点用第一、中间、最后几个数据阐述总的变化趋势〕2.解释某一变化的原因〔主题句+细节的阐述模式〕3.作出结论或提出解决问题的方法对策。
【必备模板】一、表格类As shown in the chart, We can see that表格内容123 .From the figure in the chart, we can come to a conclusion that结论. There are many reasons responsible for this instance, and the following are the typical ones. First , 原因一 . Besides,___原因二 .Finally, 原因三 .As far as I am concerned,I hold the point that of view that 自己的观点_____.二、图形类According to the graph given above, it can be seen clearly that there was a slight/slow/gradual /small/ steady drop (decline/ fall /reduction/decrease) in_______.〔如果是数据上升如此用:There was a sudden/ dramatic/ large/ rapid/ sharp rise in ______.〕Judging from these figures,we can draw the conclusion that结论.There are two/three reasons why this happened.For one thing,原因一.For another,原因二.In addition,原因三 is also responsible for it.It’s high time that we should提出解决问题的方法与对策。
上海高考英语作文分类训练:图表作文
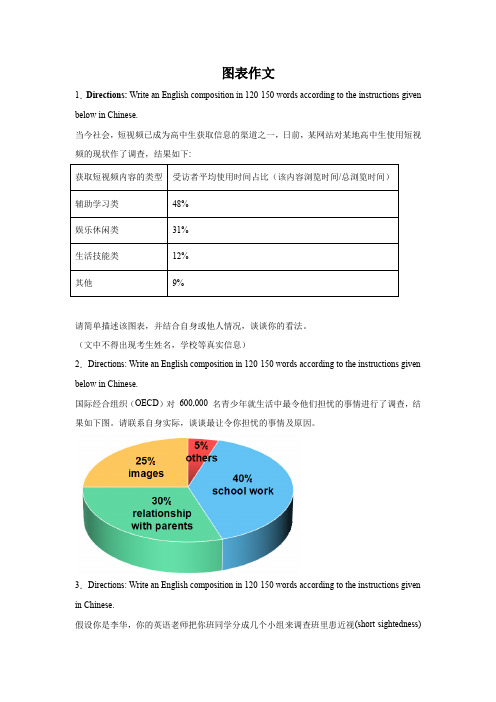
图表作文1.Directions: Write an English composition in 120-150 words according to the instructions given below in Chinese.当今社会,短视频已成为高中生获取信息的渠道之一,日前,某网站对某地高中生使用短视频的现状作了调查,结果如下:请简单描述该图表,并结合自身或他人情况,谈谈你的看法。
(文中不得出现考生姓名,学校等真实信息)2.Directions: Write an English composition in 120-150 words according to the instructions given below in Chinese.国际经合组织(OECD)对600,000 名青少年就生活中最令他们担忧的事情进行了调查,结果如下图。
请联系自身实际,谈谈最让令你担忧的事情及原因。
3.Directions: Write an English composition in 120-150 words according to the instructions given in Chinese.假设你是李华,你的英语老师把你班同学分成几个小组来调查班里患近视(short-sightedness)的同学的人数和原因。
你们小组调查后做了如下图所示的统计,请分析下面的饼状图,并谈谈你的看法及建议。
注意:1. 词数100左右;2. 可以适当增加细节,以使行文连贯。
_______________________________________________________________________________ _______________________________________________________________________________ _______________________________________________________________________________ _______________________4.Directions: Write an English composition in 120-150 words according to the instructions given in Chinese.下列图表反映的是某高中2010年与2013年学生健康状况调查的部分数据,请你用英语为某报写一份报告,反映你校三年间学生健康状况的变化情况,分析其中原因,并提出一些改进措施。
- 1、下载文档前请自行甄别文档内容的完整性,平台不提供额外的编辑、内容补充、找答案等附加服务。
- 2、"仅部分预览"的文档,不可在线预览部分如存在完整性等问题,可反馈申请退款(可完整预览的文档不适用该条件!)。
- 3、如文档侵犯您的权益,请联系客服反馈,我们会尽快为您处理(人工客服工作时间:9:00-18:30)。
第三步:归纳总结或发表评论。
常用表达:
1. in a word,/ in short,(简而言之) / _g_e_n_e_r_a_lly speaking(总的来说)
5. Statistics show a 20% rise/reduction in traffic accidents compared with last year.
6. The population owning mobile phones increased by 10% in 1999.
倍数的表达:
Recreation 3% 5% 7% 8% 10%
Others 24% 26% 33% 35% 38%
Total 100% 100% 100% 100% 100%
矩形的竖行和横行进行排列的表格
二是以图形形式 A 表示数据变化的曲线图( graph );
学科网 zxxk
表示两组数的关系-通常为函数关系图
2.There has been a sudden/slow/rapid fall/drop in…
3.The rate dropped slightly from 38%in…to 31% in…
4. By comparison with…,it decreased/increased/fell from…to…
(在描写数据间变化及总趋势特征时,可采用分类式 或对比式以支持主题,并阐明必要的理由)。注意层
次。 即 facts and reasons学科网 zxxk
增长/减少的表达:
表示上升的动词: rise,increase,climb,go up , …;
表示上升的名词: rise,increase, …;
B 表示数据的大小或数量之间的差异 的柱状图( bar chart / graph );
C 表示总体内部结构变化的扇形图 ( pie chart )
图表类说明文的写作步骤
第一步:开门见山地点明本图表所反映的主题, 即conclusion.
常使用的词汇有:
(图表/数据):table, chart, graph,figure(数据)… ; 动词: describe, tell, show, represent … 常用句型:
Reasons:
1. The reason why/for …is that… 2. One may think of the change as a result of…
3. The change in … largely results _fr_o_m__
the fact that… 4.This brings out the important fact
1.The number /rate has nearly _d_o_u_b_l_e_d (是...的两倍), as against that of last year.
2.The number is five times as many as that of…. (是…的5倍)
=The number is four times more than in…(比...多4倍)
实: 践演练
下图是我国近10年私人汽 车拥有情况,反映了人 们生活水平的变化.
[写作内容] 99 00 01 02 03 04 05 06 07 08 09 请根据以上数据,写一 篇短文,包括以下内容:
1. 近10年我国私人汽 车拥有量增加了5倍多;
2. 增加的理由是:经 济增长快;节约时间。
3. 你对此现象的看法。
remain, for…
范文剖---析- 07年高考基础写作
[写作内容] 根据以上数据,写一篇短 文,包括以下内容: 1.调查时间,调查问题,以 及调查对象; 2.男女生在以明星为偶像 方面的差异; 3.”父母”在男女生偶像 中的排序差异; 4.男女生在以伟人为偶像 方面的异同; 5.你的偶像及理由。
高考英语基础写作 复习系列
图表类说明文的类型
一是以表格形式,将统计的 数据或被说明的事物直 接用表格形式体现出来,
即统计表(table) 。
Item Food
1994 1995 1996 1997 1998 65% 60% 48% 42% 35%
clothing 8% 9% 12%l 15% 17%
表示下降的动词: fall,decline,decrease,drop, go down, …;
表示下降的名词: fall,decline,decrease,drop, …;
ቤተ መጻሕፍቲ ባይዱ
表示平稳:
remain steady/unchanged…
常用句型:( Facts)
1.There was a great /slight increase /rise in…
2. In summary, it is important… 3. From what has been discussed above, we can draw the conclusion(得出结论)that… 4. Obviously/_A_p_p_a_r_e_n_tl_y__(很明显地), if we want to…, it is
necessary… 5. T_h__e_re__is__n_o_d__o_u_b_t_t_h_a_t (毫无疑问) attention must be paid
to… 6. Is_u_g_g_e_s_t(建议)the government take effective measures
to … 7.P_e_r_s_o_n_a_l_ly, I think(就我来看) the “golden week” should
篇章结构:
1.Conclusion 2.Facts and reasons 3.Your own opinion/
suggestions
Try to finish your passage within 10 minutes.
[checklist] 1.是否只用了5句? 2.要点是否齐全? 3.是否符合图表类说明文的篇章结构? 4.有无语法或拼写错误? 5.是否用上了高级词汇或高级结构? 6.有无过渡性词语,使文章更连贯?
1.The graph/chart/table above shows… 2. From the above graph/chart, it can be seen
that... 3. As (正如) is shown in the graph, ... 4. It has been shown from the table that…
Homework
Learn by heart the useful expressions we learnt today.
知识回顾 Knowledge Review
[写作要求] 1. 只能使用5个句子表
达全部内容; 2. 标题 :Car
Ownership in China。
写作指导
人称: 第三人称
时态: 现在完成时& 一般现在时
要点:
99 00 01 02 03 04 05 06 07 08 09
1. 近10年我国私人汽 车拥有量发生了巨变;
2. 2009年私人汽车拥 有量比1999年增加了5 倍多; 3. 理由1:经济增长快; 4. 理由2:节约时间; 5. 你对此现象的看法。
范文剖析
a. Conclusion/fact/reason/your opinion? b.数据的表达?
1._C_o_n_cl_u_si_o_n Last week,we did a survey among 2, 600 students on “Who is your idol”. 2.__F_a_c_t The survey shows that half of the girls choose film and TV stars as idols,while 48% of the boys favor sports stars. 3.__F_a_ct_ As the data shows, “parents” rank the second for the girls, but the fpoeurrctehnftoargteheofbtohyes.bo4y._sF_ac_ch_to_oHsionwge“vegrr,eatthfeigures” is the same as that of the girls.Y5o.u_r_o_p_in_io_n__ As for myself, Thomas Edison is my idol, because his inventions have greatly changed our life.
Possible Version: As can be seen from the graph, great changes in car ownership have taken place in China in the past ten years. The number of private cars increased more than 5 times from nearly 3 million in 1999 to over 15 million in 2009. It’s mainly because the economy of China has developed so rapidly that many Chinese people want to own private cars. Besides, in modern society, many Chinese need a car to do business so as to save time. In my view, as the car ownership constantly increases year by year, a large number of social problems, such as traffic jams, will turn up in nearly every city throughout China.