雅思小作文题型整理
雅思小作文各种图题、表格题技巧总结
雅思小作文各种图题、表格题技巧总结雅思作文Task 1受图表内容的限制,遣词造句的要求非常有限,只需针对考试,把核心表达用准用熟即可,所谓博大不如精深。
下面是威学教育雅思教研组总结的雅思小作文线图题、柱形图题、饼图题、表格题以及流程图等的写作总结!线图、柱状图、饼图,表格题介绍段introduction介绍段内容几乎完全不用创新,就是对题目文字部分的第二段做改写,paraphrase the rubric.所谓改写,要么换词,要么换句式。
例如:(I4-100)The charts below give information about travel to and from the UK and most popular countries for UK residents to visit.换词(1) 图 The charts图:chart, graph(雅思写作中完全等价,无差别)线:line / curve chart柱图:bar / column graph饼:pie chart表:table / statistics / figures(2) 动词“表明”give information about介绍段是客观描述,用一般现在时态,give information about 虽然在这篇作文中最好不再用,但是informal learning,随手学到的东东,留作其它文章再用。
替换的词语和结构很多,比如我常用的show /illustrate / demonstrate/compare,大家也可以选几个自己喜欢并且拼写准确的形成风格。
第二段其余部分的替换因题而异,比如travel换成visitthe UK换成Britain(注意不是England,英格兰只是Britain的一部分)popular换成fashionablecountry换成nationUK residents to visit换成UK tourists不过随着练习作文数量的增加,你会惊喜的发现,雅思图表作文,连描述的对象都是类似的。
雅思考试作文试题讲解
雅思考试作文试题讲解雅思考试作文试题讲解篇一:雅思写作小作文题型分类总结雅思写作小作文题型分类总结摘要:雅思写作小作文题型一般都是图表作文,常见的几种主要类型有:表格图,曲线图,柱状图,饼状图和图画题五大类。
雅思写作小作文是雅思写作的重要组成部分。
雅思写作小作文的题型一般包括柱图和线图是每月常考的题型,饼图和表格题也是相对频率较高的题型。
偶尔也会考综合题。
图画题主要分为流程图和地图题,一般每季度轮换题库的时候会出现。
只要同学们按照固定的题目分类学习,针对性的进行复习,做到多样性和灵活性的语言使用,考生就能达到更高的分数。
在雅思课程A类小作文图表题的写作当中,考生经常会碰到图表看懂了,专家将从动态图表和静态图表的角度来详细分析雅思小作文的解题思路。
一、动态图有时间推移变化的图我们通常叫做动态图。
曲线图都是动态图,但是对于表格图,饼图和柱图却有动态和静态之分。
对于大多数的动态图我们都可以大致当作线图来处理。
动态图重点在数字变化的表达上,利用主语句型的不同和衔接关联词来展开。
写好动态图的基础是要准备好三个方面:1. 解题思路1). 表格题的动态题解题思路大致可以分为四步:①先相减(年份大的减小的);②后分类(上升一类,下降一类);③挑出极值(最大值);④挑选数值(倍数关系,变化明显的数值);2). 线图的解题思路大致分为两种:第一种:①按整条线来写(可以把相同趋势的线放在一起,也可把相反趋势的线拿来做对比);②挑选重要信息(整体趋势,起点,重点,最高点,最低点);③整体作比较。
第二种:①按时间区间来写(横轴对上去有共同拐点或交点的分为一段);②对比着写(强调交点,拐点,最高点,最低点);3). 动态柱图解题思路:把各个柱子的顶点连起来就是几条线,所以按线图方式处理;4). 动态饼图解题思路:把每种颜色看做一条线,可把相同相反的颜色放在一起写,很多时候也可以把占的比例最大的单独写一部分。
2. 基础替换词汇1). 趋势词汇上升动词类:increase, rise, grow, jump, surge, shoot up, soar下降动词类:decrease, decline, fall down, drop, sink, dip波动动词类:fluctuate持平动词类:remain the same, stabilize, remain stable, remain constant修饰动词的副词:slightly 轻微地,slowly 缓慢地,gradually 逐渐地,steadily 稳定地,rapidly 迅速地,moderately 温和地,轻微地,significantly 明显地,sharply 明显地,dramatically 急剧地,drastically 急剧地上升名词类:increase, rise, growth, jump, surge下降名词类:decrease, decline, fall, reduction, drop波动名词类:fluctuation修饰名词的形容词:slight, slow, gradual, steady, rapid, moderate, significant, sharp, dramatic, drastic2). 极值类词汇和表达最高点:reach the peak/top/highest pointIncrease to the peak/top/highest point(所有上升类的动词都可以替换掉increase)最低点:reach the bottom/lowest pointdrop to the bottom/lowest point(所有下降类的动词都可以替换掉drop)占了:occupy/make up/take up/account for/represent/constitute3). 倍数的表达方式Double 是两倍/大一倍Increase/decrease three times 增长/减少了三倍4). 大约的表达方式Approximately/About/around+数字3. 常用的小作文的趋势句式表达句式一:变化主体/图画中主体+趋势动词+副词+数值+时间区间Eg: The number of aged people over 65 increased significantly from 1 million in 1940 to 1.2 million in 2000.句式二:There be+形容词+表示趋势的名词+in+变化的主体+时间区间Eg: There was a significant increase in the number of aged people over 65 from 1 million in 1940 to 1.2million in 2000.句式三:时间+see/experience/witness+ 表示趋势的名词+in+ 变化的主体+ 数值Eg: The period from 1940 to 2000 saw an upward trend in the number of aged people over 65 from 1 million to 1.2 million.句式四:表示趋势的名词+be+seen/experienced/witnessed+in+变化的主体+时间Eg: An upward trend was seen in the number of aged people over 65 from 1 million in 1940 to 1.2million in 2000.二、静态图静态图常见的是柱图,饼图和表格题。
雅思写作的常见写作题型

雅思写作的常见写作题型雅思写作考试是许多考生最为关注的一项考试内容。
在雅思写作考试中,考生需要应对各种不同的写作题型。
本文将介绍一些常见的雅思写作题型,并给出一些应对方法和技巧。
一、议论文类型 (Opinion Essay)议论文是雅思写作中最常见的一种题型。
考生需要就一个特定的观点或主题发表自己的观点,并给出理由和例证来支持自己的观点。
议论文的写作结构可以分为引言、主体和结论三个部分。
在引言部分,考生需要清楚地表达自己对于问题或主题的观点。
主体部分应该包括两到三个段落,每个段落都应该有一个清晰的主题句,并附带有具体的例证和理由来支持观点。
结论部分则是对整篇文章的总结和再次强调自己的观点。
在写作时,考生应该尽量使用丰富的词汇和句式结构,同时注意使用适当的连接词来使文章更加连贯。
此外,考生还应该注意避免使用个人化的表达方式,而是尽量使用客观的语言来阐述观点。
二、利弊分析型 (Advantages and Disadvantages Essay)利弊分析型题目要求考生就一个特定的主题或观点列举其优点和缺点,并进行分析。
考生在写作时需要明确表达自己对于该主题的观点,并用理由和例证来支持自己的观点。
利弊分析型的写作结构类似于议论文,同样包括引言、主体和结论三个部分。
在引言部分,考生需要明确表达自己对于该主题的观点,并说明自己将会列举出该主题的优点和缺点。
在主体部分,考生需要逐一列举出主题的优点和缺点,并进行分析和解释。
结论部分应该总结全文,并再次强调自己的观点。
写作时,考生可以从各个方面来论述该主题的优点和缺点,如经济、社会、环境等不同角度进行分析。
同时,考生应该注意使用适当的连接词来使文章更加连贯。
三、原因与解决方案型 (Causes and Solutions Essay)原因与解决方案型的题目要求考生分析某一问题的原因,并提出解决该问题的方法和方案。
在写作中,考生需要清楚地列举问题的原因,并给出具体的例子和论据来支持自己的观点。
雅思小作文题型大盘点

雅思小作文题型大盘点英文回答:There are several types of writing tasks in the IELTS exam, and one of them is the IELTS Writing Task 1, also known as the Academic Writing Task 1. In this task, candidates are required to describe and interpret visual information, such as graphs, charts, and diagrams. Let's take a look at the different types of questions that can appear in the IELTS Writing Task 1.1. Line Graphs: Line graphs are commonly used to show trends or changes over a period of time. For example, you may be asked to describe the population growth in a particular country over the past decade.2. Bar Charts: Bar charts are used to compare different categories or groups. You may be asked to describe the sales figures of different products in a company, or the percentage of people with different types of hobbies.3. Pie Charts: Pie charts are used to show proportions or percentages. You may be asked to describe thedistribution of different types of energy sources in a country, or the percentage of students studying different subjects.4. Tables: Tables are used to present detailed information in a structured manner. You may be asked to describe the number of students enrolled in different courses in a university, or the average monthly temperature in different cities.5. Maps: Maps are used to show the geographical distribution of something. You may be asked to describe the changes in the layout of a city over a period of time, or the development plans for a particular area.中文回答:雅思考试中有几种写作任务,其中之一是雅思写作任务1,也被称为学术写作任务1。
雅思小作文全题型解析+例文
Content1.Line graph ------------------------Exp1-3-----------------------P2-42.Bar chart---------------------------Exp4-5-----------------------P5-63.Table-------------------------------Exp6-8-----------------------P6-84.Pie chart---------------------------Exp9-11----------------------P9-105.Flow chart-------------------------Exp12------------------------P11-126.Map---------------------------------Exp13-----------------------P12-13the requirement of getting 6 score : correct + nativeExample 1The version of teacher Answer 1The graph shows the increase in the percentage of people aged 65 or more in Japan, Sweden and the USA.In 1940 the proportion of people over 65 years stood at only 5% in Japan, approximately 7% in Sweden and 9% in the US. However, while the figures for the Western countries grew to about 15% in around 1990, the figure for Japan dipped to only 2.5% for much of his period, before rising to almost 5% again at the present time.In spite of some fluctuation in the expected percentages, the proportion of older people will probably continue to increase in the next two decades in the three countries.A more dramatic rise is predicted between 2030 and 2040 in Japan, by which time it is thought that the proportion of elderly people will be similar in the three countries.Overall, it indicates that the percentage of elderly people in all three countries is expected to increase to almost 25% of the respective populations by the year 2040.Example 2NOTE①表将来:...%... Be (is/was) predicted to increase/decrease Be expected to ,,, Be planned to .. Be projected to ...②Introduction 改写题目Origin:The graph below shows the number (thousands) of people taking part in four kinds of sports in a particular region between 1985 and 2005 .Revise:①The line graph reflects how many people participated/joined in four types of sports in a specific area from 1985 to 2005.②The line graph illustrates how the number of people who joined in four types ......changed in a....during 1985, to2005.③line graph步骤第一段改写分两段主体段,主体段抓细节描写,不能主观臆断添油加醋,看到什么说什么按照从左到右,从上到下的顺序描写不要一条一条描写,必须先分类。
雅思写作(题型、结构、观点、句子、词汇大全)
题型--->结构--->观点--->句型--->词汇运用恰当的语言去表达个人的思维逻辑。
语言只是辅助工具,思维逻辑才是主线和抢分点。
何谓题型?其实雅思写作task2题型一般有三大类:report,argumentation 和“report + argumentation” 的结合体。
•report:只有三个要素:1.cause2.influence(积极或消极的)3.solution•通常report类的文体,不会同时出现以上三个要素,只会有一到两个的配搭,即:cause+influence,cause + solution,influence +solution,或只问influence。
在这种题型底下,它的结构就非常的单一:开头段+ 原因分析段(一般分析3个原因)+ 影响分析段(一个列举3个影响)+ 解决办法段(这些解决办法一定要对应于之前分析的原因或者影响)+ 结尾段。
这个结构是应该视情况而定(as the case may be) •argumentation:一般有三种问法:1.discuss both views and give your own opinion2.to what extent do you agree or disagree3.do you think the advantage outweigh the disadvantage•其实argumentation就是两种,那就是1 和2/3(2和3可以看成同一类)。
1是要你先分析双方有什么合理之处,然后再给出你自己的个人观点。
很明显这是需要均衡结构。
意思是,假如你支持观点1用了三个论点,然后到你支持观点2的时候也得同样用三个论点(想不到的话,憋你也得憋出来),最后在结尾清晰表达你自己的最后看法。
对于这种题型,开头段也是表明观点,例如some people argue···, whileothers claim that···. I personally believe that···。
雅思小作文题库练习集锦
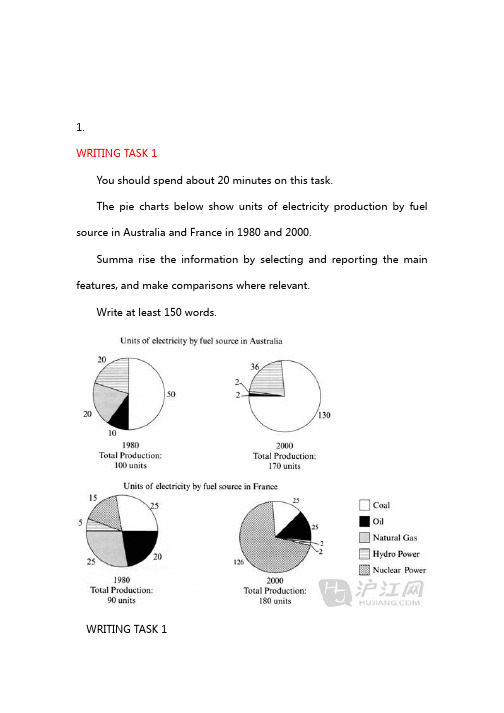
1.WRITING TASK 1You should spend about 20 minutes on this task.The pie charts below show units of electricity production by fuel source in Australia and France in 1980 and 2000.Summa rise the information by selecting and reporting the main features, and make comparisons where relevant.Write at least 150 words.WRITING TASK 1You should spend about 20 minutes on this task.The pie charts below show units of electricity production by fuel source in Australia and France in 1980 and 2000.Summa rise the information by selecting and reporting the main features, and make comparisons where relevant.Write at least 150 words.he charts compare the sources of electricity in Australia and France in the years 1980 and 2000. Between these years electricity production almost doubled, rising from 100 units to 1970 in Australia, and from 90 to 180 units in France.In 1980 Australia used coal as the main electricity source (50 units) and the remainder was produced from natural gas, hydro power (each producing 20 units) and oil (which produced only 10 units). By 2000, coal had become the fuel for more than 75% of electricity produced and only hydro continued to be another significant source supplying approximately 20%.In contrast, France used coal as a source for only 25 units of electricity in 1980, which was matched by natural gas. The remaining 40 units were produced largely from oil and nuclear power, with hydro contributing only 5 units. But by 2000 nuclear power, which was not used at all in Australia, had developed into the main source, producing almost 75% of electricity, at 126 units, while coal and oil together produced only50 units. Other sources were no longer significant.Overall, it is clear that by 20000 these two countries relied on different principal fuel sources: Australia relied on coal and France on nuclear power.这些图比较了1980年和2000年澳大利亚和法国的电的来源。
雅思作文各题型模板及范文

雅思作文各题型模板及范文在学习雅思写作时,了解不同题型的模板和范文是非常重要的。
本文将以雅思写作各题型的模板和范文为标题,为大家详细介绍如何写好雅思作文。
一、议论文。
议论文是雅思写作中常见的题型,通常要求考生就某一话题发表自己的观点,并给出支持观点的理由。
下面是议论文的模板和范文。
模板:第一段,引出话题,陈述自己的观点。
第二段,列举理由支持观点。
第三段,再次强调自己的观点,并总结全文。
范文:题目,是否应该禁止吸烟。
吸烟对健康有害,因此应该禁止吸烟。
首先,吸烟会导致各种严重的健康问题,如肺癌、心脏病等。
其次,吸烟不仅危害个人健康,还会对周围的人造成二手烟的危害。
因此,政府应该立法禁止吸烟,以保护公众健康。
二、观点对比文。
观点对比文要求考生对两种不同的观点进行比较,然后给出自己的观点。
下面是观点对比文的模板和范文。
模板:第一段,引出话题,陈述两种不同的观点。
第二段,分别阐述两种观点的理由。
第三段,给出自己的观点,并解释理由。
范文:题目,电视和书籍的优缺点。
电视和书籍都是获取信息的重要途径。
电视可以通过视觉和听觉传递信息,而书籍可以通过文字传递信息。
电视能够提供生动的图像和声音,但书籍能够提供更深入的思考和分析。
因此,我认为两者都有其优点,但书籍更适合深入思考和学习。
三、问题解决文。
问题解决文要求考生对某一问题进行分析,并提出解决问题的方法。
下面是问题解决文的模板和范文。
模板:第一段,引出问题,陈述问题的严重性。
第二段,分析问题的原因。
第三段,提出解决问题的方法。
第四段,总结全文。
范文:题目,如何减少交通拥堵。
交通拥堵是城市发展中普遍存在的问题。
造成交通拥堵的原因有很多,如车辆过多、道路狭窄等。
为了解决这一问题,政府可以采取一些措施,如修建更多的道路、鼓励居民使用公共交通工具等。
只有多方面采取措施,才能有效减少交通拥堵。
四、图表作文。
图表作文要求考生根据给出的图表进行分析和描述。
下面是图表作文的模板和范文。
雅思小作文作文题目怎么写
雅思小作文作文题目怎么写题目一:城市交通发展请描述一下你所在城市或你熟悉的城市近年来在交通方面的发展情况,包括主要的交通方式的变化、交通拥堵情况的改善或加剧以及你对未来交通发展的展望。
题目二:旅游业对经济的影响探讨旅游业对一个国家或地区经济所产生的积极和消极影响。
举例说明并分析这些影响的具体表现。
题目三:饮食习惯的变化描述近年来人们饮食习惯上发生的主要变化,例如对健康食品的偏好增加、快餐消费的趋势、饮食习惯受文化影响的情况等。
并分析导致这些变化的原因。
题目四:电子产品的普及谈谈电子产品在我们日常生活中日益普及的现象,包括手机、电脑、平板电脑等的广泛应用。
分析其给人们的生活、工作和学习带来的好处和可能带来的问题。
题目五:教育资源的分配不均探讨教育资源在不同地区或不同社会群体之间分配不均的现象。
描述这种不均带来的挑战以及可能的解决办法。
题目六:社交媒体的影响分析社交媒体对个人、社会和人际关系所产生的影响。
例如,社交媒体对沟通方式、信息传播、心理健康等方面的作用。
题目七:环保意识的提升描述近年来人们环保意识逐渐提升的表现,如对垃圾分类的重视、绿色出行的增加等。
探讨这种意识提升对环境保护的意义和未来的发展趋势。
题目八:人口老龄化问题探讨人口老龄化给社会带来的挑战,如医疗保健、社会保障、劳动力市场等方面的问题。
并提出应对人口老龄化的一些措施和建议。
题目九:城市绿化的重要性阐述城市绿化对于城市环境、居民生活质量的重要性。
分析城市绿化不足或过度开发可能带来的后果,并提出加强城市绿化的建议。
题目十:科技对教育的影响探讨科技在教育领域的应用对教学方式、学习效果和教育公平性所产生的影响。
举例说明科技在教育中的具体应用和未来的发展方向。
雅思小作文题型大盘点
雅思小作文题型大盘点Demystifying the IELTS Writing Task 1: A Comprehensive Guide to Chart Types The IELTS Writing Task 1, a seemingly straightforward assessment, often becomes a stumbling block for many test-takers. It demands not only a keen eye for detail and accurate data interpretation but also the ability to weave those observations into a coherent and engaging narrative. Understanding the various chart types and their nuances is the first step towards conquering this challenge. Let's embark on a journey to unravel the mysteries of these visual representations and equip you with the skills to tackle them head-on. One of the most common chart types you'll encounter is the line graph. Think of it as a storyteller, tracing the journey of data points over time. (simile) It's perfect for showcasing trends, fluctuations, and patterns, revealing the ebb and flow of data like the rise and fall of tides. (metaphor) For instance, a line graph might illustrate the fluctuating unemployment rate in a country over a decade, highlighting periods of economic boom and bust. Analyzing such a graph involves identifying key trends, significant turning points, and comparing different data sets if multiple lines are present. Remember, the devil is in the details, so pay close attention to the scales and units of measurement. Next, we have the bar chart, a master of comparison. It presents data in distinct categories, making it easy to spot the winners and losers at a glance. (idiom) Imagine comparing the populations of different cities or the sales figures of various products – bar charts excel at highlighting such disparities. When describing a bar chart, focus on the most significant differences, use comparative language like "higher than" or "twice as much as," and don't forget to mention the overall trend, if any. Pie charts are the visual equivalent of slicing a cake, dividing a whole into its constituent parts. (metaphor) They are ideal for illustrating proportions and percentages, like the breakdown of a company's expenditure or the distribution of age groups within a population. When tackling a pie chart, ensure you accurately represent the proportions using appropriate language like "the majority," "a small fraction," or "roughly equal." Tables may seem less intimidating, but they demand a meticulous approach. Packed with numbers and categories, they require careful analysis to identify key information and trends. It's like panning for gold – you need tosift through the data to find the nuggets of insight. (metaphor) Focus on the most significant figures, highlight any comparisons or contrasts, and avoid simply regurgitating the data. Finally, process diagrams showcase the flow of a process or system, like the steps involved in manufacturing a product or the life cycle of a butterfly. Describing these diagrams requires clear and concise language, focusing on the sequence of steps and the connections between them. Think of it as narrating a journey, guiding the reader through each stage of the process. (metaphor) Remember, regardless of the chart type, your task is to tell a story with the data. Paint a picture with words, highlighting the key insights and trends, and avoid getting lost in the minutiae. (idiom) Practice analyzing different charts, build your vocabulary, and soon you'll be deciphering data like a seasoned pro, turning the IELTS Writing Task 1 from a hurdle into a stepping stone to success.。
雅思写作之7种作文类型
雅思写作之7种作文类型
雅思写作考试包括两个部分,Task1(小作文)和Task2(大作文),用时1个小时。
Task1主要有三种类型:
1.双边讨论型(Discussion):要求讨论一个话题的两个不同观点,并给出个人观点。
2.观点型(Opinion):要求表达个人观点,通常是同意或不同意某个观点。
3.问题及解决措施型(Problem·Solution):要求识别一个问题,并提出解决问题的方法。
Task2 主要有以下几种类型:
1.议论文(Argumentation):通常需要分析一个论点或者一种现象,然后提出自己的看法,并进行论证。
2.说明文(Exposition):需要解释一个概念或者问题,可能是解释一个事件的发生过程或者一个问题的解决方法。
3.对比类(Comparison):需要对两种相似的事物进行比较和分析,比如比较两种不同的教育方式等。
4.原因结果类(Cause and Effect):需要分析一个现象的原因和结果,可能是分析一个问题的原因和解决方法。
以上就是雅思写作的主要题型,考生在备考过程中需要针对不同的题型进行分别准备,以应对考试的需要。
雅思大小作文写作题型及时间分配

雅思大小作文写作题型及时间分配大家在备考雅思写作的时候可以找一些真题去练习,然后对比(范文),找到自己的不足之处加以改进。
下面是我整理的雅思大小(作文)写作题型准时间安排,欢迎大家阅读共享借鉴。
更多雅思相关内容推举↓↓↓雅思听力备考五大建议半个月如何提高雅思写作雅思作文写作常用十大模板雅思口语part2说多久时间好雅思大小作文写作题型分类雅思小作文7大题型流程图地图题饼图曲线图混合图柱状图表格图雅思大作文6大题型(按(文章)规律分) 1.foragainst,或者是advantagedisadvantage 支持反对类型/有点缺点类型2.discussion争论型3.to what extent do you agree or disagree 你对某观点的赞成/反对程度4.causeeffect问题产生缘由和影响5.problemsolution问题说明和解决方案parecontrast两种观点比较雅思大作文12大题型(按文章主题分)一、(教育)类A.理论与实践1.学问和(阅历)的重要性。
2.为什么要上高校。
3.高校理论学问和实践课程的关系。
4.高中(毕业)的同学是否应当在去高校前要工作或旅游一年5.高中生评估和挑战老师,会不会没有敬重没有纪律性。
6.胜利人士所需素养是不是必需从高校或相像的科研学术机构中去学习。
B.男女生问题7.高校专业招收的同学男女比例是否应当协调。
8.男女分校的利弊。
二、体育活动类:1.同学花时间练习(体育运动)的利与弊/该不该。
2.体育活动造成竞争而非合作的是否应当提倡。
3.体育盛事是否有利于缓解世界紧急局势可以维护世界和平。
三、语言类1.如何说服他人学习自己母语。
2.英语流行的利弊。
3.机器翻译的进展是否导致不必学外语。
4.英语和国际旅游业的流行会不会导致小语种和小民族的损害。
四、新闻(广告)类1.人们是否只应阅读真实大事或人物。
2.新闻的真实性和好的工的素养有关系吗。
2023年雅思写作题目汇总
2023年雅思写作题目汇总引言概述:雅思写作考试是国际上广泛接受的英语语言能力考试之一,对于想要出国留学或移民的人来说,取得高分是非常重要的。
随着时间的推移,雅思写作题目也在不断变化。
本文将对2023年雅思写作题目进行汇总,分析其主要内容和要求。
正文内容:1. 题目一:环境保护1.1 气候变化- 描述气候变化对环境和人类生活的影响- 分析应对气候变化的措施,如减少温室气体排放和推广可再生能源等1.2 垃圾处理- 讨论垃圾处理对环境的影响- 探讨减少垃圾产生和有效处理垃圾的方法,如分类回收和垃圾焚烧发电等2. 题目二:科技发展2.1 人工智能- 分析人工智能对社会和经济的影响- 探讨人工智能的优势和挑战,如就业机会和隐私问题等2.2 互联网- 讨论互联网对人们生活的改变- 分析互联网的利弊,如信息泄露和网络犯罪等3. 题目三:教育体制3.1 学校教育- 探讨传统学校教育的优点和缺点- 分析如何改进学校教育,如增加实践课程和个性化教学等3.2 在线教育- 讨论在线教育的优势和挑战- 分析在线教育对传统教育的影响,如学习方式和教师角色的改变等4. 题目四:社会问题4.1 贫富差距- 描述贫富差距对社会的影响- 探讨减少贫富差距的措施,如改善教育和提高就业机会等4.2 社会公平- 分析社会公平的重要性- 讨论如何实现社会公平,如减少歧视和提供平等机会等5. 题目五:全球化5.1 国际合作- 探讨国际合作的重要性和好处- 分析国际合作的挑战,如文化差异和利益冲突等5.2 跨国公司- 讨论跨国公司对经济和就业的影响- 探讨如何管理跨国公司,如加强监管和提高企业社会责任等总结:综上所述,2023年雅思写作题目涵盖了环境保护、科技发展、教育体制、社会问题和全球化等多个领域。
考生需要深入研究这些话题,了解其背景和影响,提出合理的观点和解决方案。
通过充分准备和实践,考生可以在雅思写作考试中取得优异的成绩,为自己的留学或移民计划打下坚实的基础。
雅思大小作文写作题型分类
雅思大小作文写作题型分类小作文主要按照题干中的图形的类型来分,大作文按照*逻辑和*主题来分。
下面就和大家分享雅思大小作文写作题型分类,来欣赏一下吧。
雅思大小作文写作题型分类雅思小作文7大题型流程图地图题饼图曲线图混合图柱状图表格图雅思大作文6大题型(按*逻辑分)1.foragainst,或者是advantagedisadvantage支持反对类型/有点缺点类型2.discussion讨论型3.to what extent do you agree or disagree 你对某观点的赞成/反对程度4.causeeffect问题产生原因和影响5.problemsolution问题说明和解决方案6parecontrast两种观点比较雅思大作文12大题型(按*主题分)一、教育类A.理论与实践1.知识和经验的重要性。
2.为什么要上大学。
3.大学理论知识和实践课程的关系。
4.高中毕业的学生是否应该在去大学前要工作或旅游一年5.高中生评估和挑战老师,会不会没有尊重没有纪律性。
6.成功人士所需素质是不是必须从大学或相似的科研学术机构中去学习。
B.男女生问题7.大学专业招收的学生男女比例是否应该协调。
8.男女分校的利弊。
二、体育活动类:1.学生花时间练习体育运动的利与弊/该不该。
2.体育活动造成竞争而非合作的是否应该提倡。
3.体育盛事是否有利于缓解世界紧张局势可以维护世界和平。
三、语言类1.如何说服他人学习自己母语。
2.英语流行的利弊。
3.机器翻译的发展是否导致不必学外语。
4.英语和国际旅游业的流行会不会导致小语种和小民族的伤害。
四、新闻广告类1.人们是否只应阅读真实事件或人物。
2.新闻的真实性和好的工作者的素质有关系吗。
3.广告的利与弊。
五、青少年成长类1.学生变异行为或态度的原因和改善。
2.家庭小孩的惩罚教育是否有效。
3.学生压力是否很大。
4.父母是否应该限制小孩看电视玩游戏而应该看书学习。
5.儿童的性格来自先天还是后天培养。
剑桥雅思1-12小作文Task1题目汇总
剑桥雅思1-12小作文Task1题目汇总Cambridge IELTS 1~12剑桥雅思作文真题集小作文Writing Task 1ContentCambridge IELTS 1-Test 1 静态- bar+pie (2) Cambridge IELTS 1-Test 2 flow chart (3) Cambridge IELTS 1-TEST 3 静+动bar+line (4) Cambridge IELTS 1-TEST 4 map (5) Cambridge IELTS 2-TEST 1 动态– table (6) Cambridge IELTS 2-TEST 2 静态– bar (7) Cambridge IELTS 2-TEST 3 动态– table (8) Cambridge IELTS 2-TEST 4 动态– bar (9) Cambridge IELTS 3-TEST 1 动态– bar + line (10) Cambridge IELTS 3-TEST 2 静态– bar (11) Cambridge IELTS 3-TEST 3 动态– bar (12) Cambridge IELTS 3-TEST 4 动态– line (13) Cambridge IELTS 4-TEST 1 静态– table (14) Cambridge IELTS 4-TEST 2 动态– line + pie (15) Cambridge IELTS 4-TEST 3 静态– bar (16) Cambridge IELTS 4-TEST 4 动态– line + bar (16) Cambridge IELTS 5-TEST 1 动态– line (17) Cambridge IELTS 5-TEST 2 静态– bar (18) Cambridge IELTS 5-TEST 3 map (19) Cambridge IELTS 5-TEST 4 静态– table (20) Cambridge IELTS 6-TEST 1 动态– line + table (21) Cambridge IELTS 6-TEST 2 动态– table (22) Cambridge IELTS 6-TEST 3 flow chart (23)Cambridge IELTS 6-TEST 4 动态- bar (24)Cambridge IELTS 7-TEST 1 静态– table (25)Cambridge IELTS 7-TEST 2 动态– line (26)Cambridge IELTS 7-TEST 3 动态– bar (27)Cambridge IELTS 7-TEST 4 动态– pie (28)Cambridge IELTS 8-TEST 1 静态– pie + table (29)Cambridge IELTS 8-TEST 2 动态– pie (30)Cambridge IELTS 8-TEST 3 flow chart (31)Cambridge IELTS 8-TEST 4 动态– line (32)Cambridge IELTS 9-TEST 1 map (33)Cambridge IELTS 9-TEST 2 动态– bar (34)Cambridge IELTS 9-TEST 3 动态– pie (35)Cambridge IELTS 9-TEST 4 动态- line (36)Cambridge IELTS 10-TEST 1 静态– pie (37)Cambridge IELTS 10-TEST 2 动态– table (38)Cambridge IELTS 10-TEST 3 静态– bar (39)Cambridge IELTS 10-TEST 4 flow chart (40)Cambridge IELTS 11-TEST 1 静态– pie (41)Cambridge IELTS 11-TEST 2 动态– pie (42)Cambridge IELTS 11-TEST 3 动态– line (43)Cambridge IELTS 11-TEST 4 动态– table + pie (44)Cambridge IELTS 12 -TEST 5 静态– bar (45)Cambridge IELTS 12 -TEST 6 map (47)Cambridge IELTS 12 -TEST 7 动态– bar (48)Cambridge IELTS 12 -TEST 8 flow chart (49)Cambridge IELTS 1-Test 1 静态- bar+pieYou should spend about 20 minutes on this task.The charts below show the results of a survey of adult education. The first chart shows the reasons why adults decide to study. The pie chart shows how people think the costs of adulteducation should be shared.Write a report for a university lecturer, describing the information shown below. You should write at least 150 words.Cambridge IELTS 1-Test 2 flow chartYou should spend about 20 minutes on this task.The diagram below shows how the Australian Bureau of Meteorology collectsup-to-the-minute information on the weather in order to produce reliable forecasts. Write a report for a university lecturer describing the information shown below. You should write at least 150 words.Cambridge IELTS 1-TEST 3 静+动bar+lineYou should spend about 20 minutes on this taskThe chart below shows the amount of money per week spent on fast foods in Britain. The graph shows the trends in consumption of fast foods.Write a report for a university lecturer describing the information shown below. You should write at least 150 words.Cambridge IELTS 1-TEST 4 mapYou should spend about 20 minutes on this task.Chorleywood is a village near London whose population has increased steadily since the middle of the nineteenth century. The map below shows the development of the village.Write a report for a university lecturer describing the development of the village. You should write at least 150 words.Cambridge IELTS 2-TEST 1 动态– tableYou should spend about 20 minutes on this task.The table below shows the consumer durables (telephone, refrigerator, etc.) owned in Britain from 1972 to 1983.Write a report for a university lecturer describing the information shown below. You should write at least 150 words.。
雅思小作文题型概率总结

雅思小作文题型概率总结雅思小作文,顾名思义就是可以作为一个小文章来进行写作的一类小作文,其在写作方式上可以分为两个部分,一是需要多长时间写完一篇文章,二是只需要用一段话即可写完整个大作文。
对于小作文,大家需要注意以下几点:a时间上:雅思考试一般分为3天左右的时间进行考前准备,因此每天需要花费在时间上不能太长。
一般要在下午两点之前完成三篇小作文,且每一篇小作文的字数要超过2000字。
b要求论点准确、内容充实、逻辑严密;要用足够多的语言展开论点表达自己的观点。
如果出现不恰当或不合常理的言论被考官发现或是超出预期可以进行有效辩驳;如果发现存在明显错误时应立即改正;可以引用他人名言而非自己名言作为论据。
c时间上:作文完成之后需要考生至少在两个小时内完成小作文,超过三小时后就不要再写了,否则可能会影响最后分数。
文章结构上:小作文每一篇大约需花费四个小时才能写完。
注意!1.文章的结构不能太过松散,因此需要大量的运用固定词语、句子、句子的开头部分和结尾部分,不要求将主题和论点都写清楚,但一般情况下在你写完整篇文章之后,你可以把你认为重要的一些观点、陈述或反驳放在后面写。
a.标题。
雅思小作文一般会有两种写作方式,一是直接写明题目要求;二是把题目的要求写在文章目录当中,即主题和论点。
但这两种方式都需要大量运用固定的词语、句子之间相互搭配以突出主题。
当然这两种方法都有各自的优点,也存在着一些缺点。
如果是直接写主题是很难给自己留下深刻印象的,如果文章标题过于吸引人则也会显得空洞乏味。
但对于这种题型而言其优点是可以在一开始就让考官觉得文章有了主题,能吸引他继续阅读下去。
b开头。
雅思小作文一般都会有一段话,且每个文章只需要一次完整表达观点即可,这类作文就类似于作文分论点部分,要求考生根据自己对文章的看法和角度而写。
因为在写作难度上比大作文要低得多,所以这样的写作方式下就不会涉及到长句之间的衔接。
而这种衔接也不需要过长时间进行论述,在考生用完整篇文章之后还需结合自己所写内容对其进行分析才可以得出一个正确的结论,因此这种结构往往能让考生获得比较高速度发展为一种较为理想的状态。
雅思小作文的类型与审题

1.小作文的类型小作文按照图表的类型大致可以分为4类:⏹动态图⏹静态图(动静结合图)⏹流程图⏹地图题不同的类型有不同的句式、语法,可以有着对性地备考。
动态图和静态图在正式考试中出现的概率十之八九,余下两类小作文只占一二。
1.1动态图动态图的显著特点是有时间变化,如下图展示的就是‘美国老年人的业余活动在近几十年的变化’。
柱形图、饼状图也可以是动态图,只要是有时间变加,就可以归为动态图。
例如,下图也是常见的动态图。
1.2静态图(动静结合图)静态图多以表格、饼图为形式,突出的特点是没有时间变化。
例如,下表比较了同一时间内,不同国家各主要发电能源的占比。
动静结合图会出现一个动态图,一个静态图。
单独的动静图准备充分后,二者组合也不足为惧。
1.3流程图该类型以一个科学插图为题,要求学生对其进行描述,考察学生对科学的理解和学术语言的掌握能力。
例如,下图显示的是易拉罐的回收、加工与重新利用过程,需要学生选取主要信息并输出文字。
1.4地图题地图题以一副地图为主,即可能是对比两张不同时期的地图,描述当地的变化,也可能是对一张图的描述。
总之,以题目要求为主。
例如,下面这个地图题就是同一地区在不同时间的变化。
需要学生找到主要变化点,并正确输出。
下面这幅图则是为学校选址,S1或S2,要求考生描述图中的主要信息。
2.小作文的审题下面图片是一份完整的小作文考题。
需要注意以下几点:1321.时间控制住20分钟内;2.字数最少150,但也不是多多益善,原因见第3点;3.选取表中的主要信息点进行描述,在恰当处做出对比;切勿在细枝末节处纠结,定要牢记主要信息点,一个是字数限制,字数过多显得学生啰里啰嗦,不够利索,语言掌控能力不够。
二则是时间限制,真正考试中时间飞快,一定要紧张有序,切莫超时。
雅思写作小作文的题型与难点分析
雅思写作小作文的题型与难点分析推荐文章投诉类雅思小作文要点分析与实例点评热度:雅思写作中常见7个错误示例分析热度:雅思写作地图题学生习作分析热度:导致雅思写作低分的6大成因详细分析热度:深度分析雅思写作考试Task2常见陷阱大盘点热度:在雅思写作考试小作文中,图形描述题的难点之一是难以在短时间内找出该题需要表达的重点,其次缺乏此举,缺少书面表达的语言和亮点。
对于题型出现的这些难点,下面是小编为您收集整理的雅思写作小作文的题型与难点分析,供大家参考!雅思写作小作文的题型与难点分析1、寻找小作文需要表达的重点见到图形表达题,我们需要作答时先说明再梳理数据。
切不可将文章写成账本式的文字,否则,你就会得到很低的分数。
例如:The graph shows how the amount of water used worldwide changed between1900 and 2000. Throughout the century, the largest quantity of water was usedfor agricultural Purposes, and this increased dramatically from about 500 km toaround 3,000 km in the year 2000.雅思小作文考察的精髓还是查看考生的英文表达能力,精简凝练。
我们的描述要让阅卷者脑海中浮现出图形的样本,数量和趋势等等相关变量。
如果你能达到以上这些要求,那么小作文本身也就基本上合格了。
2、了解图形的分类规律图形描述题,按照标准图形来分,可以分为line graph(curve),bar chart, piechart以及table,按照表达重点来分,分为趋势类和大小类,分类依据于题中的时间列表。
一般来说,出现时间段的图形题都是以描述数据变化趋势为主。
3、准备必要的表达方式1. 与趋势有关的词语:上升(动词):increase, rise, climb, ascend, surge, shoot up下降(动词):decrease, decline, drop, fall, descend, plunge持平(动词):remain stable, keep constant, level off, flatten out 波动(动词):fluctuate, wave, go up and down快速(形容词/副词):considerable/considerably,significant/significantly,substantial/su bstantially,remarkable /remarkably,dramatic/dramatically 稳步(形容词/副词):steady/steadily,stable/stably,moderate/moderately,modest/mod estly缓慢(形容词/副词):slight/slightly, minimal/minimally, marginal/marginally顶点(名词 /动词):peak趋势 (名词):trend/ tendency2. 与大小相关的词语:Outnumber(动词):在数量上超过The demonstrators were outnumbered by the policeExceed(动词):在数量上超过Triple(动词):变成三倍The figure has tripled.Double (动词):变成两倍The price of houses has virtually doubled over the past fewyears.Mount to (动词):达到Counterpart(名词):对应的另一方,比较的另一方 this product is better than itscounterparts此外,建议考生还应考虑一下题中数据和百分比有没有联系,如果有的话还应添加一些数据所占百分比的语句。
- 1、下载文档前请自行甄别文档内容的完整性,平台不提供额外的编辑、内容补充、找答案等附加服务。
- 2、"仅部分预览"的文档,不可在线预览部分如存在完整性等问题,可反馈申请退款(可完整预览的文档不适用该条件!)。
- 3、如文档侵犯您的权益,请联系客服反馈,我们会尽快为您处理(人工客服工作时间:9:00-18:30)。
雅思小作文(图表题)题型归纳一.t able 表格题1.剑2 (1)4.剑5(4)6.剑7(1)二.Line graph线图(含直线和曲线图)1.剑3(4)You should spend about 20 minutes on this task.The graph below shows the unemployment rates in the US and Japanbetween March 1993 and March 1999.Write a report for a university lecturer describing the information shownbelow.You should write at least 150 words.You should spend about 20 minutes on this task.The graph below shows the proportion of the population aged 65 and overbetween 1940 and 2040 in three different countries.Summarize the information by selecting and reporting the main features,and make comparisons where relevant.Write at least 150 words.You should spend about 20 minutes on this task.The graph below shows the consumption of fish and some different kinds of meatin a European country between 1979-2004.Summarize the information by selecting and reporting the main features, andmake comparisons where relevant.Write at least 150 words.You should spend about 20 minutes on this task.The graph below shows the quantities of goods transported in the UK between 1974 and 2002 by four different modes of transport.Summarize the information by selecting and reporting the main features, and make comparisons where relevant.Write at least 150 words.5.剑9(4)三.Bar chart 柱状图You should spend about 20 minutes on this task.The chart below shows the amount of leisure time enjoyed by men and women of different employment status.Write a report for a university lecturer describing the information shown below.Write at least 150 words.Leisure time in a typical week: by sex and employment status,1998-99You should spend about 20 minutes on this task.The table below shows the figures for imprisonment in five countries between 1930 and 1980.Write a report for a university lecturer describing the information shown below.You should write at least 150 words.You should spend about 20 minutes on this task.The chart below shows the amount spent on six consumer goods in fourEuropean countries.Write a report for a university lecturer describing the information shown below. You should write at least 150 words.You should spend about 20 minutes on this task.The charts below show the level of participation in education and sciencein developing and industrialized countries in 1980 and 1990Write a report for a university lecturer describing the information shown below. You should write at least 150 words.5.剑4(3)You should spend about 20 minutes on this task.The chart below shows the different levels of post-school qualifications inAustralia and the proportion of men and women who held them in 1999.Summarize the information by selecting and reporting the main features,and make comparisons where relevant.You should write at least 150 words.You should spend about 20 minutes on this task.The charts below show the main reasons for study among students ofdifferent age groups and the amount of support they received from employers.Summarize the information by selecting and reporting the main features,and make comparisons where relevant.You should write at least 150 words.You should spend about 20 minutes on this task.The charts below give information about USA marriages and divorce ratesbetween 1970 and 2000, and the marital status of adult Americans in twoof the years.Summarize the information by selecting and reporting the main features,and make comparisons where relevant.You should write at least 150 words.You should spend about 20 minutes on this task.The chart below shows information about changes in average house prices in fivedifferent cities between 1990 and 2002 compared with the average house prices in 1989.Summarize the information by selecting and reporting the main features, and makecomparisons where relevant.You should write at least 150 words.四.Pie chart饼图1.剑7(4)2.剑8(2)3.剑9(3)五.流程图1.剑1(2)You should spend about 20 minutes on this task.The diagrams below show the life cycle of the silkworm and the stages inthe production of silk cloth.Summarize the information by selecting and reporting the main features,and make comparisons where relevant.Write at least 150 words.六.混合图。