国外输气管道失效事故调查分析参考文本
《国内外石油天然气长输管道事故分析综述》1900字

国内外石油天然气长输管道事故分析综述目录国内外石油天然气长输管道事故分析综述 (1)1.1欧洲石油天然气管道事故原因分析 (1)(1)油品管道 (1)(2)天然气管道 (2)1.2 加拿大石油天然气管道事故原因分析 (3)1.3 英国石油天然气管道事故原因分析 (4)1.4 我国石油天然气管道事故原因分析 (5)1.1欧洲石油天然气管道事故原因分析(1)油品管道Concawe是由数家欧洲主要石油公司于1963年成立的。
它最新的事故统计了从上世纪七十年代年到2013年间的所有油品管道事故【6】。
Concawe汇总了过去43年中欧洲管道泄漏事故的统计数据,并总结了管道故障泄漏的原因。
如图2.3显示了1971年至2013年各种事故的成因。
【7】图2.3 油品管道主要泄露原因由图2.3得知,导致管道泄漏的各类是事故原因及所占比例如下表所示图2.4 年各类事故原因平均总泄漏量(1971—2013)(2)天然气管道欧洲天然气管道事故数据库组织(EGIG)收集了1970年至2013年间欧洲发生的1309【2】起管道事故的数据资料。
该报告可知,在过去的43年中,欧洲的管道事故发生率逐渐下降,1970—2013年的事故发生率为0.33次/(10³·km·a)【3】,1994年到2013年间的事故发生率为0.18次/(10³·km·a)【4】,2009年到2013年的事故发生率为0.16次/(10³·km·a)。
同一时间,EGIG还分析了导致管道故障的主要因素。
表2.5显示了2004年至2013年以及2009年至2013年欧洲管道故障的主要原因以及各种原因的比例[5]。
【5】。
表2.5 事故原因所占比例事故原因所占比例2004—2013 2009—2013外部造成的干扰36% 28%腐蚀因素23% 27%施工缺陷/材料缺陷15% 15%地面的运动14% 16%紧急维修失效失效5% 7%其他/未知原因7% 7%从表2.5可以看出,欧洲天然气管道故障的主要原因可以粗略地分为以下几个方面,分别是外部造成的干扰、材料缺陷以及施工缺陷,腐蚀,地面的运动和紧急维修失效等,从上世纪七十年代到如今,外部造成的干扰一直是造成事故率最高的首要原因,紧接着是建筑材料和腐蚀。
俄罗斯油气管道运营状况及事故统计分析

俄罗斯油气管道运营状况及事故统计分析作者:赵永涛前苏联在20世纪60年代至90年代创建的天然气、原油和成品油管道系统在长度和运输能力上无疑是20世纪最大的工程之一,它们是俄罗斯的经济命脉。
如今,经过多年运营,俄罗斯的油气管道系统已趋于老化,隐患增多。
俄罗斯对约2000km西伯利亚原油管道进行检查后发现,管道内壁上存在6000多个缺陷。
管道隐患不仅危及运营安全,更有损经济效益。
俄罗斯政府和各油气公司已经意识到问题的严重性,正在从技术手段和管理制度上采取综合措施加以解决。
考虑到油气管道系统对于国家的重要意义,保证管道系统的可靠性和生态安全作为首先解决的问题,已被俄罗斯提到了国家的议事日程。
一、危及俄罗斯管道系统的三大问题原苏联建设的油气管道,其主干线仅在俄罗斯境内就长达20.8万km,而且以高压力,大口径(1220~1420mm)管道为主,是国家的经济大动脉,为俄罗斯带来滚滚财源。
而如今,约有50%的管线在使用了20~25年后已接近其使用寿命。
存在的诸多问题对管道的安全高效运输构成了威胁。
主要问题集中在三个方面。
1、管道老化严重,隐患增加大部分的油管道于上世纪60~70年代投入生产,2000年时使用超过20年的油管道比例为73%,其中超过30年的为41%;30%的天然气管道运营已超过20年,其中约15%的运营年龄在30年左右;在1970~1990年建成的气管道中(长度为15.5万km),已有4万km的管道目前已接近使用年限;成品油管道也呈老化趋势,以50~60年代建设投产的管道居多。
目前这些管道都磨损得相当厉害。
对管道事故和故障的大量统计数字进行分析,可以非常客观地评价管道的可靠性。
俄罗斯连续3年对管道进行抽选,结果显示出管道老化对事故的影响力:超过30%的故障发生在使用超过20年的管道上,可见管道老化必然会加大管道的运营风险。
管道老化是因为钢管属于易老化材料,老化后工作性能会产生一些不良变化,如金属的可塑性和粘性降低,脆性增加等。
国内外燃气管道失效率及失效原因对比与归纳

1概述国际上通常将管道失效率作为衡量管网运行管理水平的重要指标,也作为管道风险评估和完整性管理的基础性数据[1-2]。
管道失效率的基础数据来源于管网运行管理部门的记录,原则上管网运行管理部门应及时登记管道在运行过程中发生事故的起因、地点、时间、程度、影响等相关信息。
然而,我国城市燃气企业的实际管理水平决定了可获得的管道失效率基础数据很有限,并且数据的有效性也不高[3]。
本文对国内外燃气管道失效率统计情况及失效原因进行对比与归纳。
2失效率类型及计算方法①整体平均失效率。
整体的含义为涵盖所有失效原因导致的燃气管道事故。
整体平均失效率为统计时间内燃气管道事故数(包含所有失效原因导致的燃气事故)与总风险暴露数之比,用于反映统计时间内在单位管长单位时间发生的燃气管道事故数。
②5年移动整体平均失效率。
若统计时间取某年(包含该年)的前5年的时间,此时的整体平均失效率称为5年移动整体平均失效率,用于反映5 a内在单位管长单位时间发生的燃气管道事故数。
③分类平均失效率。
分类平均失效率与整体平均失效率的计算方法基本一致,只是将统计时间内由某一种失效原因导致的燃气管道事故数除以总风险暴露数,用于反映统计时间内在单位管长单位时间由某一种失效原因导致的燃气管道事故数。
由上述定义可知,无论整体平均失效率、5年移动整体平均失效率还是分类平均失效率均涉及总风险暴露数,因此总风险暴露数的计算成为关键。
以某一区域一段统计时间为例,说明总风险暴露数的计算方法。
设定第1年的燃气管道长度为L1,第2年新增燃气管道长度为L2,第i年新增燃气管道长度为L i,第n年新增燃气管道长度为L n。
则统计时间内总风险暴露数β的计算式为:由式(1)、(2)可知,整体平均失效率可计算任意统计时间(大于或等于1 a)的燃气管道失效率。
当式(1)中n取5 a时,由式(1)、(2)计算得到的整体平均失效率即5年移动整体平均失效率。
3国外燃气管道失效率与失效原因3.1欧洲EGIG1982年,由6个欧洲燃气管道运营商组织成立了欧洲燃气管道事故数据组织(Europe Gas pipeline Incident data Group,EGIG),记录燃气管道信息和失效数据。
输气管道事故分析

● 2007年3月17日凌晨4时许,深圳罗湖区一大厦5楼单身 公寓内突发煤气爆炸,两名女子被重度烧伤,生命垂危。
● 2007年4月1日凌晨,深圳罗湖区东门168大厦一公寓发生 煤气爆炸,一名男子重度烧伤。
● 2008年7月16日上午8时30分许,罗湖区嘉宾路中怡大厦 内一寓所发生煤气爆炸,一名女子被炸伤。
◆ 疏散 居民学生迅速撤离 ◆ 排险 泄漏源在学院门前 ◆ 原因据称疑为故意破坏
目击者毛先生说,居民对于燃气泄漏有两种说法,一种说 法是大货车碾压造成了燃气泄漏,因为有居民夜间听到了大货 车经过的声音;另一种说法是有小偷偷盗燃气管道阀门所致, 但这两种说法均未得到警方和燃气公司的证实。
“听说燃气井中4个阀门有3个已经松动,不排除有人故意 破坏的可能。”毛先生说,这是他听到现场一名工作人员说的。 昨晚,燃气集团工作人员表示,暂不能透露任何细节,原因还 在调查当中。
输气系统维护及安全管理
输气管道事故分析
输气管道事故分析
● 输气管道事故实例 ● 输气管道事故及特点 ● 输气管道重大事故实例
施工不当导致事故
最新国外输气管道失效事故调查分析

国外输气管道失效事故调查分析国外输气管道失效事故调查分析一、前言管道的安全性是一个非常重要的问题,日益受到人们的重视。
随着管道的大量敷设和运行时间延长,管道事故时有发生。
由于管道所输送的物质一般为有害物质,一旦发生泄漏或断裂,就会对其周围的环境和人员产生严重的后果。
输气管道,尤其是高压输气管道,一旦破裂,压缩气体迅速膨胀,释放大量的能量,引起爆炸、火灾,会造成巨大的损失。
例如,1960年美国Transwestern公司的一条X56钢级的、直径为762毫米的输气管道破裂,破裂长度达13公里。
1989年6月苏联拉乌尔山隧道附近由于对天然气管道维护不当,造成天然气泄漏,随后引起大爆炸,烧毁了两列铁路列车,死伤800多人,成为1989年震惊世界的灾难性事故。
国外对于长输管道失效事故的调查分析工作十分重视,如美国运输部(DOT)的管道运输安全办公室OPSO (OfficeofPipelineSafetybytheOperators)及研究与专门项目委员会RSPA (ResearchandSpecialProgransAdministration)、欧洲输气管道事故数据组织EGIG (EuropeanGaspipelineIncidentdataGroup)、加拿大的国家能源委员会NEB(NationalEnergyBoard)及加拿大能源管道协会CEPA(CanadianEnergyPipelineAssociation)、加拿大运输安全委员会TSB (theTransportationSafetyBoardofCanada)、英国天然气协会、俄罗斯天然气监督机构以及全苏天然气科学研究院等机构,均进行了大量的管道失效事故调查分析与研究工作。
加拿大、美国和欧洲等国家还建立了相应的管道事故数据库,以进行现役管道的安全评价,减少事故发生的可能性。
对以往的管道失效事故进行调查分析,对管道安全设计与运行管理有以下重要作用。
安全案例分享(加拿大管道失效案例)
纠正性维护工单以调查并缓解已识别出的缺
陷
国家能源局(NEB)指出:关键阀门的泄漏是影响管道系统的危害(threat)之一,公司的完整性管理方案必须
包括关键阀门的相关要求。 17
中国石油
三、应力腐蚀开裂(SCC)风险辨识
根据已有资料的总结,除了熔结环氧粉末涂层(FBE) 外,任何其他涂层管道系统都 包含在ASME B31.8S 所规定的SCC风险定义中。
8
二、事故调查分析
中国石油
内漏阀门的现场调查
对100-2管线和100-3管线之间发生泄漏的隔断阀进行开挖检查发现该阀门处于正常关的 位置
在该事故发生前,TransCanada就已经知道该阀门有内漏,但并未意识到内漏是由于过行程导致。 过行程导致阀门底座受损,并最终发生气体泄漏。 9
二、事故调查分析
法规强制性要求,如
CSA Z662, Z662附件,ASME标准,API标准及
非强制性的工业标准,如CSA
NACE标准
推荐做法
13
二、事故调查分析
中国石油
针对失效管段的完整性管理方案审核
事实上,TransCanada公司的 IMPP已经识
别出SCC为100-2号管线的潜在危害之一, 并通过检验性开挖和水压试验进行监测。 特别是出事管段的上游和下游均为水压再
特别是聚烯烃类(PE)基涂层系统由于与管体金属粘附力损失,逐渐与管体金属剥离。 聚乙烯收缩带在原有涂层与收缩带的搭接部位形成鼓起,地下水可进入到此鼓起部 位。由于聚乙烯的高绝缘性能,阴极保护无法轻易的到达管体表面,也就无法将腐 蚀减缓至可接受的水平。季节更替导致地下水位变化使得在剥离部位对腐蚀进行控 制或减缓更加复杂。在表面预处理不充分的情况下,临近压气站或泵站产生的压力 波动,剥离的收缩带会产生SCC发生所需的许多先决条件
国外管道失效数据库简介及参考
国外管道失效数据库简介及参考作者:齐先志杨静王晓霖谢成曹加园席罡来源:《当代化工》2016年第04期摘要:管道失效数据库在管道完整性管理实施和安全监管方面起着重要作用,介绍了国外PHMSA、EGIG、Concawe、NEB等管理机构成熟运行的管道失效数据库,从数据库的统计范围、事故上报、事故统计等方面分析了不同国家管道失效数据库的差异和对我国数据库建设的参考。
关键词:油气管道;管道失效数据库;管道完整性管理;管道失效;管道泄漏中图分类号:TQ 000E 832 文献标识码: A 文章编号: 1671-0460(20142016)0004-00000853-0003Abstract: Pipeline incident database(PID) played a crucial role in the pipeline integrity management and safety supervision. The PIDs abroad founded by PHMSA,EGIG,Concawe and NEB were briefly introduced. Among these databases the differences in the scope of pipeline types in the database, incident reporting, the pipeline incident statistics were compared and analyzed,providing some guidelines and references for us.Key words: Oil and gas pipeline ; Pipeline incident database; Pipeline integrity management; pipeline Pipeline failure; pipeline Pipeline release油气管道属于重大危险源,油气一旦泄漏可能引发环境污染、火灾、爆炸等严重事故。
从美国油气管道事故看我国管道运输安全
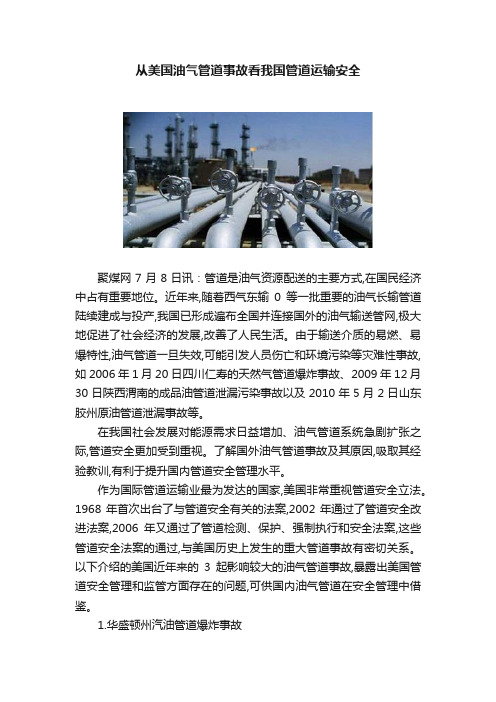
从美国油气管道事故看我国管道运输安全聚煤网7月8日讯:管道是油气资源配送的主要方式,在国民经济中占有重要地位。
近年来,随着西气东输0等一批重要的油气长输管道陆续建成与投产,我国已形成遍布全国并连接国外的油气输送管网,极大地促进了社会经济的发展,改善了人民生活。
由于输送介质的易燃、易爆特性,油气管道一旦失效,可能引发人员伤亡和环境污染等灾难性事故,如2006年1月20日四川仁寿的天然气管道爆炸事故、2009年12月30日陕西渭南的成品油管道泄漏污染事故以及2010年5月2日山东胶州原油管道泄漏事故等。
在我国社会发展对能源需求日益增加、油气管道系统急剧扩张之际,管道安全更加受到重视。
了解国外油气管道事故及其原因,吸取其经验教训,有利于提升国内管道安全管理水平。
作为国际管道运输业最为发达的国家,美国非常重视管道安全立法。
1968年首次出台了与管道安全有关的法案,2002年通过了管道安全改进法案,2006年又通过了管道检测、保护、强制执行和安全法案,这些管道安全法案的通过,与美国历史上发生的重大管道事故有密切关系。
以下介绍的美国近年来的3起影响较大的油气管道事故,暴露出美国管道安全管理和监管方面存在的问题,可供国内油气管道在安全管理中借鉴。
1.华盛顿州汽油管道爆炸事故1999年6月10日下午3:00左右,华盛顿州Bellingham的1条406mm汽油管道发生断裂,约89.7@104L汽油泄漏并流入1条小溪,扩散长度约850m,30min后,小溪中的汽油因被点燃而发生爆炸,两名约10岁的儿童和1名18岁的年轻人死亡,8人受伤,1户居民住宅以及1座城市水处理工厂严重损坏,直接财产损失45@106美元。
管道泄漏的直接原因是:在1处管道划痕处产生了69mm长的裂口,事故后检查包括管道断裂部位在内的5.5m长的管道,发现33处划痕,裂口起源于其中之一。
实验室检查表明:这些划痕的外表面残留有高铬合金,这是一种典型用于挖掘机械铲斗齿上的合金材料,可见这些划痕是挖掘活动所致。
输气管道事故统计与分析

输气管道事故统计与分析1 国外同类项目事故统计与分析1.1 美国美国是世界上建设输气管道最早、最多也是距离最长的国家,目前天然气输送管道大约有52×104km。
美国天然气管道事故资料较详实,逐年统计了事故次数、事故原因和所造成的危害后果,可以作为本项目类比分析依据。
美国天然气主干网管道事故后果和事故原因统计结果见表1、表2和图1。
表1 美国天然气主干网管道及其事故后果统计表2美国天然气主干网管道及其事故原因统计(1990年~2005年)图 1 事故原因比例图从以上图可以看出,在1990年~2005年的16年里,美国天然气主干网管道共发生了1415次事故,年平均事故率约为88.4次。
外力是造成美国天然气管道事故的首要原因,共发生了560次,占事故总数的39.6%;其次是腐蚀,共有327次,占到22.5%,其中内腐蚀共导致了180次事故,占事故总数12.5%,外腐蚀共导致了147次事故,占事故总数是10.3%,排在第三位的是建造/材料缺陷,共发生了216次,占15.3%。
1.2 欧洲欧洲是天然气工业发展比较早,也是十分发达的地区,经过几十年的发展和建设,该地区的跨国管道已将许多欧洲国家相连,形成了密集复杂的天然气网络系统。
为了更有效地掌握输气管道事故发生的频率和原因,1982年开始,6家欧洲气体输送公司联合开展了收集所属公司管道事故的调查工作,并得到了各大输气公司的积极响应,到了2005年,参加此项工作的有12家西欧主要气体输送管道公司,并据此成立了一个专门组织即欧洲输气管道事故数据组织(EGIG),这个组织的数据库提供的信息资源对了解管道事故的各类情况都极有帮助。
2005年EGIG对1970年~2004年共35年间该组织范围内所辖的输气管道进行了事故调查和统计,共调查的管道长度为2.77×10⁶km,共统计事故1123起。
图2,图3及图4列出了这一调查的统计结果。
其中管道事故的频率以每年运行的管道公里数(km•a)与事故次数相除而得到,单位是10-3次/(km•a)。
国外管道失效统计分析机制
23rd World Gas Conference June 1–5, 2006 Amsterdam, The Netherlands 23e Conférence Mondiale du Gaz – 1–5 juin 2006 Amsterdam, Pays-BasReport of Study Group 3.4A Guideline"Using or Creating Incident Databases for Natural GasTransmission Pipelines"Rapport du Groupe d’étude 3.4Une Directive« Utiliser ou Créer des Bases de Données des Incidents concernant les Canalisations de Transport de Gaz Naturel »Chairman/PrésidentRein BoltThe NetherlandsABSTRACTThis report details the work undertaken by Study Group 3.4 during the triennium 2003–2006. The initiative that launched the work of this study group came during the 22nd World Gas Conference, where it was noticed that the use of pipeline incident information often is not fit for purpose.A comparative analysis has been carried out considering the most frequently used and reliable high pressure gas pipeline incident databases. The four main objectives of the analysis are described in the following:Determine the differences and similarities of existing databasesCreate a reference model to be used when developing a new pipeline incident databaseAssess if harmonization of existing databases is possibleProvide recommendations regarding the aboveRÉSUMÉCe rapport expose en détail le travail entrepris par le Groupe d’étude 3.4 au cours de lapériode triennale 2003-2006. L’initiative à l’origine du travail de ce groupe d’étude a vu le jour au cours de la 22e Conférence Mondiale du Gaz, à la suite de la constatation que souvent les informations sur les incidents concernant les canalisations n’étaient pas utilisables pour le but recherché.Une analyse comparative des bases de données les plus utilisées et les plus fiables sur les incidents concernant les canalisations de gaz à haute pression a été effectuée. Cette analyse avait les quatre objectifs suivants :•déterminer les différences et les similitudes entre les bases de données existantes ;•concevoir un modèle de référence pour créer une nouvelle base de données des incidents concernant les canalisations ;•déterminer s'il est possible d’harmoniser les bases de données existantes ;•donner des recommandations en ce qui concerne ce qui précède.TABLE OF CONTENTSTable of contents (3)1. Introduction (5)1.1. Scope of the work (5)1.2. Participants (7)1.3. Approach (7)1.4. Meetings (8)2. Importance of and Need for Pipeline Incident Information (9)2.1. General (9)2.2. Users of Pipeline Incident Information (10)2.2.1. Authorities and Regulatory Bodies (10)2.2.2. Gas Pipeline Operating Companies (10)2.2.3. General Public (11)2.2.4. Consultants/Contractors/Engineering Companies (11)3. Worldwide Pipeline Incident Databases (13)3.1. Basic Principles of Pipeline Incident Databases (13)3.1.1. Goals of Pipeline Incident Databases (13)3.1.2. Definitions (13)3.1.3. Database architecture (14)3.1.4. Collecting process (14)3.1.5. Statistical elaboration (15)3.2. Databases (15)3.2.1. USA (16)3.2.2. Canada (17)3.2.3. Europe (EGIG) (20)3.2.4. Europe (UKOPA) (24)3.2.5. Australia (25)4. Comparative Analysis of Existing Pipeline Incident Databases (28)4.1. External Factors Affecting the Safety Performance of Pipelines (29)4.2. Pipeline System Information (29)4.3. Incident Definitions: Incident Consequence and Target Systems (31)4.4. Categorisation of Incident Parameters (34)4.5. Categorisation of Incident Causes (35)4.6. Damage Classification (36)4.7. Categorisation of Incident Consequences (36)4.8. Reporting of Data (37)5. Importance of using Fit for Purpose PIDs (39)6. IGU Pipeline Incident Database Reference Model (41)6.1. Guideline to Creating New Pipeline Incident Database (PID) (41)6.1.1. Determination of the Data Boundary (41)6.1.2. Population (41)6.1.3. Definition of an Incident (42)6.1.4. Occurrence of an Incident (42)6.1.5. Data Handling (43)6.2. Recommendations for the Harmonization of Existing PIDs (44)6.2.1. Normalization of Statistical Data (44)6.2.2. Recommendations for Harmonization (44)7. Conclusions (46)8. Literature (47)9. Appendices (49)9.1. Implementation of IGU SG3.4 Results (49)9.2. Other Pipeline Incident Database Information (50)9.2.1. Argentina (50)9.2.2. Algeria (53)9.2.3. Russia (54)1. INTRODUCTIONDuring the 22nd IGU World Gas Conference held in Tokyo 2003 it was noticed that many presentations used different existing pipeline incident databases (PID) as reference. Very often references were made to the US Department of Transportation (DOT) [1] database and the European Gas pipeline Incident data Group (EGIG) [2] database.In some cases, the pipeline incident frequencies derived from the DOT database was compared with the frequencies derived from the EGIG database and, based on the observed differences, conclusions were drawn about the quality of the databases. In some risk analysis, pipeline incident frequencies were used without consideration of the data referenced and the background of associated frequencies.The EGIG members in particular observed that there was a substantially increasing demand for the EGIG report. It was noted that the EGIG information was being used to assess risk associated with oil pipelines in South America or offshore pipelines in the Gulf of Mexico. Given the limitations of the database, it was concluded that the EGIG data was misused and for some cases the “damage” is considered irreparable.Therefore the EGIG companies has taken the initiative and proposed to International Gas Union (IGU) the implementation of a comparative analysis covering the most frequently used pipeline incident databases and the preparation of a guideline of how and when to use which database. This proposal was presented and approved at the first Working Committee 3 (WOC-3) meeting in September 2003 in Bilbao, Spain.1.1. Scope of the workEarly work looked at a comparison of incident databases covering the whole gas chain. However, due to the relatively short period of time that was available to conclude the project, the study group has limited itself to “only” pipeline incident databases pertaining to onshore high pressure gas pipelines. Some of the databases do contain offshore incidents, however, the main focus of this report is on the onshore gas pipelines. Another reason for this limitation in scope is the knowledge that the safety of a gas transmission system is mainly dominated by cross country onshore pipelines and not by other parts of the gas chain.Not all pipeline incidents directly affect the safety of the pipeline. The following 4 levels of incident are often indicated and categorised:1. unintentional release of the product causing a directly unsafe situation, e.g.holes and ruptures (with and without ignition);2. pipeline damage affecting the pipeline integrity which could result in a directlyunsafe situation, e.g. scratches, dents and gouges;3. coating damage causing an integrity problem in the long term, e.g. externalcorrosion;4. near miss not affecting the integrity of the pipeline but which could result in alevel 1, 2 or 3 incident; unnoticed ground activities in the vicinity of the pipeline.From literature it is known that there is a relationship between the number of incidents at each incident level. This relationship is referred to as “the Iceberg Theory” [6] and is visualised in Figure 1.Figure 1: Iceberg TheoryThe databases that were taken into account within the scope of IGU Study Group (SG) 3.4covers only level 1 pipeline incidents. Due to major differences in definitions, descriptions and circumstances it is not reliable to compare results from all four incident categories derived from different databases with each other. However, most pipeline owners and operators have pipeline integrity management systems in place that enable the evaluation of all levels of pipeline incidents.The scope of work for IGU SG 3.4 was approved by the WOC 3 of IGU (transmission) andthe main elements are:• Determine the differences and similarities of existing databases; • Create a reference model to create a new pipeline incident database; • Determine if harmonization of existing databases is possible;• Provide recommendations regarding the above (including promotion of theresults).As the suggested activities to promote this guideline is considered to be applicable to allpublished IGU reports, the study group has decided to integrate this part of the work as a separate appendix to this report (see appendix 9.1).1. Unintentional release2. Pipe material damage3. Coating damage4. Near Miss1.2. ParticipantsCompany Country Name Membership ENAGAS, S.A. Spain Mr. D. Velez Vega ActiveE.ON Ruhrgas AG Germany Mr. A. Hilgenstock Active Gassco, AS Norway Mr. O. Rasmussen ActiveGasunie The Netherlands Mr. R. Bolt Active, chairman SNAM Rete Gas Italy Mr. A. Cappanera Active Transcanada Pipelines Canada Mr. B. Rothwell ActiveXG Gas Transmission Algeria Mr. A. Taberkokt ActiveNational Energy Board Canada Ms. K. Duckworth Guest member OPS USA Mr. R. Little Guest member PRCI USA Mr. H. Haines Guest memberPRCI/Kiefner & Associates, Inc USA Ms. C. Kolovich Guest member andconsultantAPIA; PipelineOperators Group(POG),Australia Mr. P. Tuft CorrespondingFluxys Belgium Mr. A. Niemirowski Corresponding, after2004 vacantR&K Consulting Russia Mr. B. Krivoshein CorrespondingTGS Argentina Mr. E. Espineira CorrespondingUKOPA UK Mr. R. Owen CorrespondingTable 1: Members IGU Study Group 3.4Especially Mr. R. Minson from E.ON Ruhrgas is kindly acknowledged for his valuable contribution to the comparative analysis.1.3. ApproachAfter an exploratory meeting with active members, the scope of work and the approach was discussed and approved. In order to understand the importance of and need for pipeline incident information, the study group identified and described in section 2 the users of pipeline incident information.The next phase was to develop an inventory of which databases that are available (internet search) and all characteristics of the identified databases were explored and organized. Based on this inventory, the goals, definitions, database architecture, collecting process and statistical elaboration of pipeline incident databases were described, ref. sections 3.1 to 3.5. In section 3.6, more information is given on the most frequently used worldwide pipeline incident databases. The information given in this section was prepared in close cooperation with the database owners themselves.This information was the basis for carrying out the comparative analysis as shown in section 4. The analysis demonstrates very clearly the similarities and differences between all the investigated databases.Based on the comparative analysis, the study group has developed a description of the importance of using fit for purpose pipeline incident databases, ref. section 5.In section 6 the IGU pipeline incident database reference model is given, as well as recommendations for harmonisation of existing databases.1.4. MeetingsAn overview of the meetings is given in the following table 2.MeetingDate Place IssuesnumberStudy Group meetings1 13-14 January 2004 Beetsterzwaag – TheExploratoryNetherlands2 26-27 April 2004 Milan - Italy First inventory of availabledatabases and comparativeanalysis3 30 Sept.- 1 Oct. 2004 Calgary - Canada Discussion progress/comparative analysis.4 10-11 March 2005 Washington DC - USA First ideas aboutharmonisation and adatabase reference model5 21-22 September 2005 Essen - Germany Discussion/first draft report6 19-20 December 2005 Madrid - Spain Discussion/final report. Special task expert meetingsA 31 August 2004 Moscow - Russia Extra input from RussiandelegateB 9 March 2005 Washington DC - USA Database expert meetingC 22-23 August 2005 Algiers - Algeria Extra input from AlgeriandelegateD 28 November 2005 Birmingham Check draft report withUKOPA databaserepresentativeTable 2: Study Group 3.4 meetingsThe meetings 1 to 6 are described as working meetings and the meetings A to D were meetings with a special task.2. IMPORTANCE OF AND NEED FOR PIPELINE INCIDENT INFORMATION2.1. GeneralStatistics indicate that high pressure gas pipelines are inherently safer for the public than other modes of gas transportation. The gas transmission industry in particular assures high safety performance for its pipelines by paying great attention to safety issues, to environmental protection and to reliability during all the phases of the service life of a pipeline.However the gas transmission industry is increasingly requested to demonstrate this safety performance in response to requests from regulating authorities or from the public with regard to new or existing pipelines. These requests are dealt with by ensuring open and detailed communication.In this respect, data and information regarding the incidents, the corresponding failure mechanisms and the resulting consequences, as well as information related to the industrial facilities and its operations, have become of increased importance to open and effective support in this communication process.In this environment information regarding incidents needs to be used by and communicated between the various parties and disciplines within the same company, between other pipeline operating companies or outside the companies, while using the most appropriate analysis methodologies with the aim of establishing the safety performance with regard to people and the environment or to analyse plant or system performance.The need for this type of information is clearly evidenced by the great quantity of such information being issued around the world. Websites, paper publications, symposia, handbooks, and PhD Theses etc. which deal with safety matters very often use incident statistical data for supporting their conclusions.Various comprehensive databases exist throughout the industry. Government authorities and pipeline operating companies collect data on pipeline incident and their causes. These “incident databases” and the data they contain, together with analysis of any incidents which occurs, are essential for the authorities, operating companies and engineering companies as well as for the general public to both demonstrate and ensure that pipelines remains a safe and reliable means of transporting gas.Data collection can be mandatory or voluntary and it is possible to distinguish between three main types of databases:•database owned and compiled by a single company that collects information regarding its own network and analyses the data;•database managed by the authority/regulatory body that collects information regarding the networks of the companies under its regulatory responsibility;•database compiled through a co-operation agreement between a group ofnational and international companies.The incident databases will be designed according to its specific use and the need of the company/companies collecting the data. For instance, a database may be intended for both internal and external use and consequently the database must allow for performing data analysis at different detail levels; the structure of the incident database will greatly vary for each different situation as the architecture of the database must be fit for purpose.The importance and need for these incident databases for the different stakeholders mentioned above are discussed in the following paragraphs.2.2. Users of Pipeline Incident Information2.2.1. Authorities and Regulatory BodiesFor the authorities, data and information regarding incidents are fundamental. The analysis of the incident data should advise on the need to maintain or improve the existing legislation or standards and, where necessary, on the need to propose new initiatives.Using the information, authorities can play an ever more active role in identifying deficiencies or gaps in the legislation or requirements regarding external safety for individuals and the protection of the environment. The technical knowledge which is gained from analysing the incident databases represents a powerful tool in order to identify the areas where more focused attention is required.The incident information can also strongly support the strategy behind countries energy supply market, allowing a benchmark among different industrial energy sectors, where energy demand and energy source are linked with safety for individuals and observance of environmental standards.2.2.2. Gas Pipeline Operating CompaniesThe overall responsibility to comply with regulatory requirements relating to the construction, operation and maintenance of hazardous liquid and gas pipelines is the responsibility of pipeline operating companies in each country.Additionally, when regulatory requirements do not exist, prudent operating companies can apply regulations from other countries or internal company practices and procedures.In order to manage this responsibility, accurate statistics can be an effective tool for the management of different activities and some examples of possible applications are given in the following:•Construction of new pipelinesIn order to obtain all the permits necessary for constructing new pipelines thegas pipeline operating companies are required to prepare and submitdocumentation adequately demonstrating the safety of the new projects. Thisdocumentation normally includes an analysis of the possible hazards and theeffects on safety and on the environment due to the presence of the newpipelines linked with the route selection.•Improvements to or demonstration of the safety of existing pipelinesInformation on the most frequent types of incidents and the category ofpipelines most frequently affected, enables pipeline operating companies togain a better understanding of the causes of incidents, to monitor trends and todiagnose problems that may indicate the need for targeting solutions oradditional actions or protective measures.Using these facts, pipeline operating companies can demonstrate to authorities,regulatory bodies and the public the safety levels of the network and monitoringeffectiveness. This knowledge can also optimise their maintenance andinspection programs by concentrating efforts on these critical areas.•Evaluation of safety management system performanceThe information obtained from the incident databases can be used to measurethe performance of a Safety Management System (SMS), to verify that thepolicies regarding safety and environmental protection adopted are effective, todemonstrate to all the stakeholders the reliability of the transmission system, tocharacterise the overall health of the industry and to determine if the resourceallocations adopted are functioning effectively.•International benchmarkingGroups of companies can decide to exchange incident data, improvecommunications regarding safety performance, create a “safety language” andcarry out benchmarking analyses. In order to make this possible, a commonviewpoint is required and a standard definition of the data to be collected andthe analysis to be performed.2.2.3. General PublicHistorically, communication relating to pipeline safety aspects has been “what the technical experts told the outside world”. It would typically be largely one-way communication where the public had little or no input in determining the acceptability of the safety levels, or in making safety management decisions.However, the public no longer willingly accepts, without question, the decisions of the “safety experts”. The public is requiring to be allowed to give input into safety decisions that affect the environment and the community, sometimes showing a strong opposition often referred to as the NIMBY (not-in-my-backyard) syndrome. This, along with increased regulatory requirements for safety communication, has created a need for an improved and better understanding and management of the safety communication process and the factors that influence risk perception.Greater awareness of the general public concerning the safety of pipelines transporting hazardous products has led to the need on the part of pipeline operating companies to assure the public that the condition of these pipelines is adequately known, that current regulations and industry practices are adequate and are being implemented and that the need for additional protection has been explicitly and responsibly considered.These assurances given to the public should also include information about the operational history of the pipeline and its safety record in general. A valuable tool in demonstrating these safety aspects is a comprehensive incident database which clearly indicates the safety record of the pipelines: an appropriate use of the database statistics can support a positive and reassuring dialogue with the local public.2.2.4. Consultants/Contractors/Engineering CompaniesDue to requirements from regulating authorities and pipeline operating companies, consultants, contractors and engineering companies rely more and more on statistics obtained from pipeline incident databases to evaluate and optimise their pipeline designs.The data is important for design activities in order to evaluate hazards to which a given pipeline is subject, thus enabling improvements in the design of the pipeline and its protective measures by taking into consideration the relevant failure scenarios.It is also important to optimise recommended maintenance programs by concentrating efforts where the relevant threats are greatest, thus guaranteeing the safety levels while ensuring that pipelines stays a competitive alternative for gas transportation.3. WORLDWIDE PIPELINE INCIDENT DATABASESThe following chapters will describe the basic principles of pipeline incident databases as well as selected gas transmission pipeline databases in countries across the world.3.1. Basic Principles of Pipeline Incident Databases3.1.1. Goals of Pipeline Incident DatabasesThe objectives for collecting incident data have to be clearly stated before the data collection process starts. The database aims can differ according to technical and legislative scenarios.For instance, the information could be necessary for analysing:• Safety Performance;• Quantitative Risk;• Structural Integrity;• Availability;• Benchmarking.The definition of these needs is fundamental in order to collect relevant information, adopting the most suitable database architecture for the intended use.In any case, due consideration should be given to the principle of “lessons learnt” from previous incidents (both within and outside the organisation) during operation of the installations concerned.3.1.2. DefinitionsThe main characteristics of the databases can be summarised in three essential points: •Incident definition (failure mode and consequences);•Database population and boundary;• Reference period.The incident definition can be based on the failure mode (e.g. loss of containment or unserviceability of the system) and/or on the magnitude of consequence. This definition heavily influences the content of the database and limits its application field (e.g. its “fitness for purpose”).The database population is any detailed information with regard to the pipeline network. The database boundary is defined, in general, according to life cycle phases of the gas transmission activity (construction, operations and abandonment) and the installations taken into consideration (e.g. onshore versus offshore, pipeline only or including equipment). Most of the databases focus on the incidents which occur during the operating phase.Two examples of different kinds of equipment boundaries are EGIG and DOT (see following chapters). In the European database (EGIG) the incident definition is more selective than the DOT definition. EGIG only considered incidents relating specifically to pipelines, while in the US database (DOT) include incidents related to valve stations, etc.. On the other hand the DOT database disregard the occurrence of small leakages due to a financial threshold and a definition of “significant consequence” (i.e. fatality or injury).The reference period has to be established according to: the incident definition, the equipment boundary and the collection process.All the above elements (incident definition, life cycle phases, equipment, reference period) have to be verified and analysed with great care when different databases are compared.3.1.3. Database architectureThe databases can also have different structures and data details depending upon the individual goals of each pipeline incident database.Nevertheless, two main kinds of information are generally collected:•Information about the incident;•Information about the equipment population.The information about the incident usually covers:•the incident causes•the equipment involved•the size of the damage•the detection modality•the consequencesIn most of the existing databases, the information about equipment population relates to the pipeline network length. Very often the pipeline exposure (length of a pipeline times its exposure duration) is also used. In some of the databases, this length is reported for different classes of relevant parameters (e.g. diameter, year of construction, wall thickness and so on).Using the above information the most common elaborations cover:•the evaluation of the importance of the damage caused;•the incident trend versus time due to different threat scenarios (related to the reference period of the database or as a moving average);•the likelihood/number of causalities per threat scenario.3.1.4. Collecting processThe quality of the data gathered in a database has to be ensured through a suitable collection process:•The origin of the data has to be documented and traceable;•The data has to originate from similar equipment type, technology and operating conditions;•The data has to be recorded in the correct format.During and after the data collection exercise, the data needs to be analysed to check consistency and correct interpretations.The quality control process has to be documented. Whether the data collection is compulsory or voluntary the quality of the data can be very high if the company defines appropriate tools for avoiding “poor” or incomplete information. One of these tools is the adoption of a management system where rules and responsibilities for collecting and elaborating the data are defined inside the company.3.1.5. Statistical elaborationA sufficient amount of data has to be collected in order to give an acceptable statistical confidence level.Data covering several years of operation may be needed before sufficient data has been accumulated to give confidence in analysis results and relevant decision support. Data collection shall therefore be seen as a long-term planned activity and should be executed with appropriate goals in mind. At the same time, clarity as to the causes of failure is the key to prioritising and implementing corrective actions that will result in sustainable improvements in reliability, leading to improved profitability and safety.The above elements must be analysed with great care, in all cases and by all the users, before using the data information since each of them can strongly influence the validity of the evaluations: the misinterpretation of one element could lead to wrong conclusions.The same attention must be paid when different databases are compared with each other. The risk is that simplistic and incorrect conclusions can be drawn when incompatible statistics are compared with each other without a complete understanding of the origin and nature of the data. For example it is not correct to assume that the “incident frequencies” published by different database owners are directly comparable just because they have the same “units” of incidents per kilometre per year.In this case it is strongly advisable to set up a comparison method in order to link or translate each piece of information from one database to another. The method could be based on an analytical approach and on engineering judgement but should, in any case, be clear and open, avoiding or indicating all the possible “grey” areas from which misunderstandings can arise. One of the goals of this guideline is to highlight where the differences lie and how to correctly compare statistics from different sources.3.2. DatabasesIn the following sections selected pipeline incident databases, covering onshore high pressure gas pipelines are described taking the above points into consideration:•North America:Natural Gas Gathering and Transmission System Incident database,managed by Department Of Transportation (DOT);Statistics about pipeline incidents, managed by National Energy Board(NEB)- Canada;Pipeline Incident Database British Columbia, managed by OGC (Canada);Statistical Series managed by Alberta Energy and Utilities Board (EUB -Canada).•Europe:Gas Pipeline Incidents, managed by European Gas pipeline Incident dataGroup (EGIG);Pipeline Fault Database, managed by UKOPA.•Australia:Developmental Pipeline Incident Database, APIA (Australia)。
输气管道事故统计与分国内外对

合计
1137
100%
13
二、国内外输气管道事故统计和分析
美国输气管道事故分析
1.外力 外力是造成事故的首要原因。各类外力事故的分类见下表:
事故原因
事故率
人为因素
自然因素 其他 合计
设备由外部人员操作
设备由操作者操作 地震 不利气候
69.0%
4.5% 15.3% 10.2% 1.0% 100%
14
二、国内外输气管道事故统计和分析
➢ 2005年,12家欧洲主要天然气管道公司加入了此工作,并成立了 欧洲输气管道事故数据组织(EGIG)
➢ 2005年,EGIG对1970~2004年35年间该组织范围内所属的输气 管道进行了事故调查和统计。共调查管道2.77*106KM,共统计事故 1123起。
➢ 1970~2004年欧洲输气管道事故原因统计事故频率如下图:
2.腐蚀 腐蚀是美国输气管道的又一主要事故原因,腐蚀主要分为外腐蚀、内腐蚀和 应力腐蚀等,他们导致的事故频率见下表。
事故原因 外部腐蚀
事故率 40%
内部腐蚀
27%
应力腐蚀 其他 合计
17% 16% 100%
15
二、国内外输气管道事故统计和分析
加拿大输气管道事故分析
事故原因
腐蚀
均匀 腐蚀
应力 腐蚀 开裂
外部干扰多表现为孔洞型泄漏, 占到外部干扰事故总数的57.1%。
外部干扰泄漏事故发生的频率与管 道壁厚和直径大小有着直接的关系: ➢较小管径的管道,其事故发生频 率高于较大管径管道的事故发生频 率。 ➢管径小,管壁相应较薄,容易出 现针孔或孔洞。
9
二、国内外输气管道事故统计和分析
管道埋深与是事故率有着密切的关系: 随着管道埋深的增加,管道事故发生率明显下降,因为埋深增加可以 较少管道遭受外力影响的破坏的可能性。
国外管道失效数据库简介及参考
国外管道失效数据库简介及参考齐先志;杨静;王晓霖;谢成;曹加园;席罡【摘要】管道失效数据库在管道完整性管理实施和安全监管方面起着重要作用,介绍了国外PHMSA、EGIG、Concawe、NEB 等管理机构成熟运行的管道失效数据库,从数据库的统计范围、事故上报、事故统计等方面分析了不同国家管道失效数据库的差异和对我国数据库建设的参考。
%Pipeline incident database (PID) plays a crucial role in the pipeline integrity management and safety supervision. In this paper, foreign PIDs founded by PHMSA,EGIG,Concawe and NEB were introduced. These databases’ differences were compared and analyzed from the aspects of database statistical range, incident reporting and pipeline incident statistics, which could provide some guidelines and references for us.【期刊名称】《当代化工》【年(卷),期】2016(045)004【总页数】4页(P853-855,859)【关键词】油气管道;管道失效数据库;管道完整性管理;管道失效;管道泄漏【作者】齐先志;杨静;王晓霖;谢成;曹加园;席罡【作者单位】抚顺石油化工研究院,辽宁抚顺 113001;抚顺石油化工研究院,辽宁抚顺 113001;抚顺石油化工研究院,辽宁抚顺 113001;中国石化销售华南分公司,广东广州 510620;中国石化销售华南分公司,广东广州 510620;中国石化销售华南分公司,广东广州 510620【正文语种】中文【中图分类】TE832油气管道属于重大危险源,油气一旦泄漏可能引发环境污染、火灾、爆炸等严重事故。
长输天然气管道内腐蚀事故调查分析与对策
和水汽进入输气干线。1980 年以 后,通过加注缓释剂、加强清管等 管道事故率有所下降, 但20世纪90 年代川渝地区输气管道的平均事故 率仍达到了 2.3 次 /1000km・a,远 由于内腐蚀本身的特点, 内腐 蚀管理是管道完整性管理的较薄弱 环节之一。油气储运行业企业众 多,分布广泛,很难将所有的储运
0 前言
内腐蚀是管道系统老化的重要 因素之一, 内腐蚀能造成管道结构 强度降低,导致泄漏,而且内腐蚀 引起的事故往往具有突发性和隐蔽 性, 后果一般比较严重。随着各气 田逐渐进入开发的中后期, 天然气 中含水量、 二氧化碳和硫化氢等腐 蚀性介质的含量在逐渐增加, 这也 加速了天然气输送管道的内腐蚀。 国内外由于内腐蚀而造成的腐
含水率就低 ;反之则饱和率就高。 随着天然气管道服役年限的增加,
由管线内的湿气、微生物、氯化物、 段时间内或同一季节,温度一般 全年都在 0度以上, 按 O2、CO2 和 H2S 等因素共同造成的。 变化不大, 照相关标准,经过处理的天然 气, 其饱和含水率应该再0.052g/m
3
3 原因分析与讨论
题,值得所有管道安全管理借鉴。 事故原因分析表明 ,事故是 由于严重的内腐蚀使得管壁厚度减 薄到不能承受管内压力,导致管道 发生断裂。管道断裂处没有发现外 腐蚀, 发现了严重的内腐蚀, 可能是
[5]
管道运行过程中,天然气不易析出 天然气具有一定的饱和含水率,见 表 1 。如果压力高, 温度低, 饱和 对于一条运行的天然气管道,在一
Analysis and Countermeasures of Natural Gas Transmission Pipeline Internal Corrosion Accidents
LUO Peng, ZHANG Yi-ling, CAI Pei-pei, GUO Zheng-hong, CHEN Hong-yuan, WANG Wei-bin (PetroChina Pipeline R&D Center, Langfang 065000, China) Abstract: Statistical analysis for natural gas pipeline accidents of North America during 1988 to 2008 was completed in this paper. Internal Corrosion Accident Probability was summarized, and the reason of accidents was also analyzed. The natural gas pipeline rupture and fire near Carlsbad accident in New Mexico in 2000 was analyzed in detail, the course and lessons was concluded. The gas pipeline internal corrosion management regulations of China were in contrast to those of North America in the paper at last, with suggestion of internal corrosion management countermeasures in China. Key words: natural gas pipeline; internal corrosion; accident; analysis; countermeasure
国外输气管道失效事故调查分析(正式)
编订:__________________审核:__________________单位:__________________国外输气管道失效事故调查分析(正式)Deploy The Objectives, Requirements And Methods To Make The Personnel In The Organization Operate According To The Established Standards And Reach The Expected Level.Word格式 / 完整 / 可编辑文件编号:KG-AO-1201-41 国外输气管道失效事故调查分析(正式)使用备注:本文档可用在日常工作场景,通过对目的、要求、方式、方法、进度等进行具体的部署,从而使得组织内人员按照既定标准、规范的要求进行操作,使日常工作或活动达到预期的水平。
下载后就可自由编辑。
一、前言管道的安全性是一个非常重要的问题,日益受到人们的重视。
随着管道的大量敷设和运行时间延长,管道事故时有发生。
由于管道所输送的物质一般为有害物质,一旦发生泄漏或断裂,就会对其周围的环境和人员产生严重的后果。
输气管道,尤其是高压输气管道,一旦破裂,压缩气体迅速膨胀,释放大量的能量,引起爆炸、火灾,会造成巨大的损失。
例如,1960年美国Transwestern公司的一条X56钢级的、直径为762毫米的输气管道破裂,破裂长度达13公里。
1989年6月苏联拉乌尔山隧道附近由于对天然气管道维护不当,造成天然气泄漏,随后引起大爆炸,烧毁了两列铁路列车,死伤800多人,成为1989年震惊世界的灾难性事故。
国外对于长输管道失效事故的调查分析工作十分重视,如美国运输部(DOT)的管道运输安全办公室OPSO(OfficeofPipelineSafetybytheOperators)及研究与专门项目委员会RSPA (ResearchandSpecialProgransAdministration)、欧洲输气管道事故数据组织EGIG (EuropeanGaspipelineIncidentdataGroup)、加拿大的国家能源委员会NEB(NationalEnergyBoard)及加拿大能源管道协会CEPA (CanadianEnergyPipelineAssociation)、加拿大运输安全委员会TSB (theTransportationSafetyBoardofCanada)、英国天然气协会、俄罗斯天然气监督机构以及全苏天然气科学研究院等机构,均进行了大量的管道失效事故调查分析与研究工作。
国内外油气管道事故比较分析

2008 NO.28Science and Technology Innovation Herald化 学 工 业从我国在20世纪70年代开始大规模建设油气管道到目前为止,原油、成品油以及天然气管道约3×10⁴,全球石油和天然气管道总长超过200×104。
近年来,随着石油天然气工业发展速度不断加快,各种油气管道数量还在持续增加。
无论是老管道还是新建管道,在服役期间都存在各种给管道运行带来风险的因素:施工和材料缺陷、设计缺陷、腐蚀、第三方损伤、地质灾害、误操作等。
一旦某个或几个因素造成管道运行失效,就会出现泄漏、爆炸、火灾等情况,带来严重的财产甚至人员生命的损失。
有效防止油气输送管道事故的发生,在增强其运行安全性的同时合理利用资源获取最大经济效益,是各国政府部门、石油天然气工业所面临的重大课题。
1 欧洲管道系统事故分析在1998~2007年的欧洲燃气管道事故原因统计中,外部干扰占52%,施工和材料缺陷占17%,腐蚀占14%,地表移动占6%,抢修错误占5%,其他6%,外部干扰、材料缺陷、腐蚀列前三位。
其中,1998~2002年欧洲输气管道事故频率平均为0.575次(103km·a),由于在防止气体泄漏事故的管理、监督、施工和技术措施等方面所取得的成就,事故频率逐年下降,1998~2004年为0.381次(103km·a)。
外部影响是导致气体泄漏的主要原因,而且大多数为“孔洞”类型。
1998~2006年外部影响造成的事故频率平均为0.295次(103km·a),1998~2006年降到次(103km·a)。
其次是施工和材料缺陷,这与管道建设年代有关。
1993年以前建设的管道,因施工和材料缺陷的事故频率相对较高。
由于提高了建设标准以及严格的检测和试压,以后的失效频率逐渐降低。
第三个主要因素是腐蚀。
2 美国管道系统事故分析在1998~2004年间,美国天然气长输及集输管道共发生了5847次事故,年平均事故402次,事故率为0.72次(103km·a)。
阿尔伯特省Enbridge公司原油管道破裂事故分析

1、事故概况2001年1月17日山地标准时间00:45时,在Enbridge公司管道有限公司(以下统称Enbridge公司)阿尔伯特哈迪斯蒂泵站下游0.8km,里程标109.42处的864mm外径3/4管线发生一起管道破裂事故。
此次事故的发生地点是一片永久泥沼地中,它是由地下泉水注入而成。
尽管事故发生几分钟内,管线被位于阿尔伯特埃德蒙顿的控制中心关闭,但是破裂的确切位置直到山地标准时间14:15时才被找到。
将近3800m3原油泄漏,覆盖2.7ha土地。
截至2001年5月1日,3760m3的原油已经被回收。
2、事故分析(1)事故分析由于电阻焊直焊缝外部的焊瘤没有被打磨成与管道一样平,防腐层胶带在直焊缝上鼓起,形成了地下水可以渗进的狭窄通道。
纵向直焊缝位于三点位置,这个位置的土壤应力为最大值。
反复的冻胀/融沉循环,可能与较小的管道沉降叠加,加重了防腐层的剥离。
尽管管道受到阴极保护,但是剥离的防腐层胶带隔离了阴极保护电流,到达不了管道上。
地下水提供了管道钢的腐蚀环境,并允许建立腐蚀回路。
电阻焊直焊缝外部焊瘤和管体间形成的拐角处应力集中。
沿拐角处断续分布的点腐蚀增加了应力集中系数。
腐蚀性环境会降低对裂纹起裂和扩展的应力强度因子门槛值。
批量运行产生的循环压力,提供了裂纹萌生和扩展的必要压力水平。
在Enbridge公司的864mm管道内检测程序中(对于金属损失和裂纹),Enbridge公司做出努力来确保例如腐蚀或裂纹的缺陷被检测到、评估并且修复。
但是,内检测程序的有效性依赖于检测器的选择、运行检测器和数据报告、数据分析和缺陷的筛选的及时性。
Enbridge 公司认识到同一检测器不能提供这两种类型缺陷的信息,并且在内检测程序中使用不同的技术。
当检测程序出现问题时,Enbridge公司采取措施来改正程序,努力防止问题再次发生。
尽管金属损失内检测器的性能已经被证明了十多年,但是这不是针对裂纹检测内检测器的情况。
1999年5月失效事件暴露出弹性波裂纹检测器的局限性。
输油、输气管线及设备的事故(故障)分析
输油、输气管线及设备的事故(故障)分析第1章绪论我国管道运输行业发展的这些年来,事故发生率较高,有些具有危险的管道没有进行风险评估,或者没有被国家安全规范考虑。
虽然在设计和铺设输送危险介质管线经过敏感的或者人口稠密地区时,也参照了全面的设计验收规范执行。
但在管道运行的这些年来,事故发生率还是比较高,带来了非常严重的后果,包括经济损失以及人员伤亡,引起了社会的强烈反映[1j。
因此管道系统的后期管理,可靠性分析及风险评价也越来越引起来自各方面的关注和重视。
1.1课题背景截止目前为止,世界上长输管道的总长度已经超过2 000 OOOkm,但我国已建成并投产的在役油气输送管道不足2 OOOkm,占不到世界总长度的1 %}2}。
我国的管道运输起步晚,且管道运行管理目前情况亦是如此,甚至还相对落后。
而我国的原油产量在世界上排第5位,原油产量在世界也排第5位,因此管道的建设与我国经济发展相比,并不能适应经济发展的要求,还有很大的发展空间。
因此,在以后的发展阶段,管道系统的可靠性分析更应该引起足够的重视。
我们要在修建新管道的同时,要切实保证在役管道安全可靠经济的运行。
这就对我国输送危险介质。
的油气管道运输的技术可靠性、安全性、风险性、经济性提出了更大的挑战。
油气泛指原油、成品油、液化烃、可燃液体化工品及可燃气体等,它们普遍具有易燃易爆及有毒等特性。
但它们却是人类社会不可缺少的能源和原料。
为了将这些重要的能源和原料运送到最需要的地方去,管道输送是最重要的手段。
所谓油(气)长输管道是指长距离输送原油(成品油或油产品)或天然气的管道,一般其长度在25km以上输送危险介质的油气管线失效可能造成严重的危害,可燃或有毒物质泄漏是引起许多悲惨意外事故的开始事件。
公众和社会对环境污染和意外事件的宽容度现在正在减退,同时,意外事件发生之后,管理者所要承担的责任则越来越大。
尽管危险事件在全世界屡屡发生,但跟铁路,公路运输相比,管线输送仍然被认为是输送大量危险物质的最安全模态之一。
天然气管道风险影响因素及对策参考文本
天然气管道风险影响因素及对策参考文本In The Actual Work Production Management, In Order To Ensure The Smooth Progress Of The Process, And Consider The Relationship Between Each Link, The Specific Requirements Of EachLink To Achieve Risk Control And Planning某某管理中心XX年XX月天然气管道风险影响因素及对策参考文本使用指引:此安全管理资料应用在实际工作生产管理中为了保障过程顺利推进,同时考虑各个环节之间的关系,每个环节实现的具体要求而进行的风险控制与规划,并将危害降低到最小,文档经过下载可进行自定义修改,请根据实际需求进行调整与使用。
天然气的主要成分是甲烷,易燃易爆,其爆炸极限为5%~14%,密度,<0.75kg/m³,比空气的密度小。
随着国内经济的发展,天然气长距离输送管线在不断建设。
天然气管线由于输送的是压缩气体,影响安全的内在和外在因素较多,存在着不同的风险,下面将就这些影响因素及其防范对策进行分析和探讨。
1 事故原因分析据国内外事故统计分析资料显示,国外不同地区和不同国家输气管道事故原因虽然所占比例不同,但前三项不外乎为外部干扰、腐蚀、材料失效及施工缺陷。
在欧美等国家管道事故中,外力影响占第一位,其次是施工及材料缺陷,第三是腐蚀;前苏联天然气管道的主要原因是腐蚀、外部干扰、材料缺陷;我国输气管道的事故原因和前苏联类似,事故原因以腐蚀为主,施工及材料缺陷、不良环境的影响居后,便是近年来人为破坏的事故增长势头较为迅猛。
国外不同地区和国家事故频率为0.38×10⁻³(-3标在右上位置)~0.6×10⁻³(-3标在右上位置)次/(km•a)之间,而且呈逐年下降的趋势。
- 1、下载文档前请自行甄别文档内容的完整性,平台不提供额外的编辑、内容补充、找答案等附加服务。
- 2、"仅部分预览"的文档,不可在线预览部分如存在完整性等问题,可反馈申请退款(可完整预览的文档不适用该条件!)。
- 3、如文档侵犯您的权益,请联系客服反馈,我们会尽快为您处理(人工客服工作时间:9:00-18:30)。
国外输气管道失效事故调查分析参考文本
In The Actual Work Production Management, In Order To Ensure The Smooth Progress Of The Process, And Consider The Relationship Between Each Link, The Specific Requirements Of Each
Link To Achieve Risk Control And Planning
某某管理中心
XX年XX月
国外输气管道失效事故调查分析参考文
本
使用指引:此安全管理资料应用在实际工作生产管理中为了保障过程顺利推进,同时考虑各个环节之间的关系,每个环节实现的具体要求而进行的风险控制与规划,并将危害降低到最小,文档经过下载可进行自定义修改,请根据实际需求进行调整与使用。
一、前言
管道的安全性是一个非常重要的问题,日益受到人们
的重视。
随着管道的大量敷设和运行时间延长,管道事故
时有发生。
由于管道所输送的物质一般为有害物质,一旦
发生泄漏或断裂,就会对其周围的环境和人员产生严重的
后果。
输气管道,尤其是高压输气管道,一旦破裂,压缩
气体迅速膨胀,释放大量的能量,引起爆炸、火灾,会造
成巨大的损失。
例如,1960年美国Transwestern公司
的一条X56钢级的、直径为762毫米的输气管道破
裂,破裂长度达13公里。
1989年6月苏联拉乌尔山
隧道附近由于对天然气管道维护不当,造成天然气泄漏,
随后引起大爆炸,烧毁了两列铁路列车,死伤800多人,成为1989年震惊世界的灾难性事故。
国外对于长输管道失效事故的调查分析工作十分重视,如美国运输部(DOT)的管道运输安全办公室OPSO (OfficeofPipelineSafetybytheOperators)及研究与专门项目委员会RSPA (ResearchandSpecialProgransAdministration)、欧洲输气管道事故数据组织EGIG (EuropeanGaspipelineIncidentdataGroup)、加拿大的国家能源委员会NEB(NationalEnergyBoard)及加拿大能源管道协会CEPA (CanadianEnergyPipelineAssociation)、加拿大运输安全委员会TSB (theTransportationSafetyBoardofCanada)、英国天然气协会、俄罗斯天然气监督机构以及全苏天然气科学研
究院等机构,均进行了大量的管道失效事故调查分析与研究工作。
加拿大、美国和欧洲等国家还建立了相应的管道事故数据库,以进行现役管道的安全评价,减少事故发生的可能性。
对以往的管道失效事故进行调查分析,对管道安全设计与运行管理有以下重要作用。
(1)建立风险评价模型;
(2)管道修复和替换决策;
(3)进行安全评价;
(4)检查管道失效倾向;
(5)成本效益分析;
(6)为管道的设计、施工及运行管理提供技术支持。
通过对国外主要国家和地区输气管道失效事故的调查分析,可掌握国外长距离天然气输送管道失效的主要原
因,对国内输气管道建设具有重要的参考价值。
二、输气管道的失效原因
造成管道失效的原因很多,常见的有材料缺陷、机械损伤、各种腐蚀、焊缝缺陷、外力破坏等。
将各种失效原因进行归纳,划分为以下五大类。
(1)机械损伤;
(2)腐蚀;
(3)焊接和材料缺陷;
(4)设备和操作;
(5)其他原因。
三、输气管道事故调查
1.欧洲
1982年,6家欧洲气体输送公司发起了一项收集
管道输送系统意外事故数据的活动。
1992年,8家西欧主要气体输送管道系统的公司参与了这项活动。
欧洲输气管道事故数据组织(EGIG)还建立了失效管道数据库,为提高管道安全性提供了相当有价值的信息资源。
1970~1992年欧洲管道事故频率平均为0.575/1000公里·年,由于在防止气体泄漏事故的管理、监督、施工和技术措施等方面所取得的成就,事故频率逐年下降,1988~1992年为0.381/1000公里·年。
管道总长度为92853公里,其中50%的管道直径在127~406毫米之间,20%的管道直径超过762毫米,70%的管道建于1964~1983年间。
事故原因分为以下几项:
(1)外部影响;
(2)施工和材料缺陷;
(3)腐蚀;
(4)地面运动;
(5)误操作;
(6)其它原因。
其中,外部影响是导致气体泄漏的主要原因,而且大多数为“孔洞”类型。
1970~1992年外部影响造成的事故频率平均为0.295/1000公里·年,1988~1992年降到0.226/1000公里·年。
其次是施工和材料缺陷,这与管道建设年代有关。
1963年以前建设的管道,因施工和材料缺陷的事故频率相对较高。
由于提高了建设标准以及严格的检测和试压,以后的失效频率逐渐降低。
第三个主要因素是腐蚀。
2.苏联
(1)1981~1990年输气管道事故。
苏联的干线输气管道总长度在1981~1990年间增加了83×103公里,主要是若干条直径为1420毫米的特大
干线输气管道,至1990年初达到207×103公里,管道的年平均增长量为8.3×10³公里。
这期间共发生管道事故752起,内腐蚀和外腐蚀、焊接和管材缺陷、外部干扰是排在前三位的失效原因。
而且,每千公里年的失效频率由1981年的0.71逐年下降到1990年的0.26,这主要归功于敷设了大管径、厚壁厚的管道使得管道腐蚀事故减少了。
(2)1971~1990年水下输气管道事故。
从苏联地区水下输气管道的失效频率随年份变化的情况中可以看出,腐蚀、焊接和管材缺陷是主要的失效原因。
与陆上管道所不同的是,水下管道由于悬跨振动引起的疲劳应力而造成的管子完全破裂事故占有较大比例,这通常是由于管沟深度不够或重量不够造成的。
水下输气管道的事故频率一般较陆上管道高。
1971~1980年事故频率下降幅度较大,这主要是由于制订了新的严格的水下穿越
规程和标准;从1981年起事故数开始上升,这主要是由制造缺陷、焊接和施工缺陷及腐蚀造成的,还与管道运行时间长有关(15~20年);随后又有所下降。
3.美国
(1)1970~1984年天然气长输及集输管道事故。
在1970~1984年间,美国天然气长输及集输管道共发生了5872次事故,年平均事故404次。
可见,外力是造成天然气管道损坏的主要原因。
(2)1985~1993年天然气长输及集输管道事故。
自1984年7月1日起,美国运输部(DOT)研究与特殊项目委员会(RSPA)将各种失效原因分为五大类,分别是a.外力;b.腐蚀;c.焊接和材料缺陷;d.设备和操作;e.其他。
从1985~1993年间美国输气管道共发生789起失效事故,外力、腐蚀、设备和操作是造成失效的主要原因。
外力是第一位
的,约占失效总数的43.6%;其次是腐蚀,占22.2%;设备和操作原因居第三位,占15.3%;焊接和材料缺陷引起的失效事故较少,约占8.5%。
在789起事故中,有673起发生在陆上,116起发生在海上,对于海底管道,腐蚀,尤其是内腐蚀造成的失效事故引人注目。
4.加拿大
加拿大约有540000公里的油气输送管道,直径从25毫米到1219毫米不等。
据加拿大国家能源委员会(NEB)统计,加拿大平均每年约发生管道失效事故30~40起,其中大部分为泄漏,断裂事故发生较少。
1975~1982年,加拿大输气管道的事故率为2次/1000公里·年;1985~1995年间的管道失效事故统计,其中68%是输气管道失效事故;1996年发生管道事故69起,1997年88起,1998年5
4起,其中大部分为气管道事故。
四、结论
根据上述调查统计的结果,可以得出以下结论:
(1)欧洲输气管道事故原因主要有外部影响、施工和材料缺陷及腐蚀,其中,外部影响的事故频率与管径、壁厚及管子埋深有关,施工和材料缺陷的事故频率与管道建设年代有关,腐蚀失效频率与管龄有关。
(2)在苏联,外部腐蚀、外部干扰和管材缺陷是排在前三位的失效原因;对于水下输气管道,外部腐蚀、工厂制造缺陷、施工缺陷和焊接缺陷是主要的失效原因。
(3)1970~1984年,美国天然气长输及集输管道失效的主要原因是外力、材料损坏及腐蚀,1985~1993年失效的主要原因是外力、腐蚀及材料和焊接缺陷。
(4)腐蚀及应力腐蚀在加拿大输气管道失效事故中占有很大比例,其次是地层滑动和建造因素。
(5)总体来看,造成国外大多数天然气管道失效的主要原因是机械损伤、腐蚀及焊接和材料缺陷,其中机械损伤是造成欧美天然气管道失效的主要原因,在加拿大和苏联腐蚀是管道失效的主要原因。
(6)国外输气管道每千公里年的事故率随时间呈下降趋势。
请在此位置输入品牌名/标语/slogan
Please Enter The Brand Name / Slogan / Slogan In This Position, Such As Foonsion。