生物英文文献.doc
微生物专题英文文献

班级:生物工程 学生:马春玲 2013年12月13日
LOGO
试验内容
1. Purpose and meaning 2. Introduction 3. Materials and methods
4.5 正交试验结果
Table 5. Results of ortho.1 Trend curve
Fig.2 Relationship between xylanase and time of fermentation in Aspergillus niger N212
通过对出发菌株注入不同剂量的氮离子,低能氮离子 束对菌体细胞均有一定程度的致死和损伤作用,细胞及其 损伤DNA又在其修复系统的作用下得到不同程度的修复, 从而导致黑曲霉孢子的存活率先下降,后上升,然后又下 降,并且菌种的修复出错会使其突变率大大提高,从而提 高了菌株的正突变率,从而确定了氮离子最佳注入参数。 以上试验可以得出最优培养基的组成(即各组分的最 适浓度),而且在以上培养得到了黑曲霉N212(表2),当 它发酵60个小时后酶活达到600IU/ml,比之前未优化的菌 株减少了12个小时,而且相对于原出发菌株酶活增加了100 %。 试验证明离子注入对微生物进行诱变改良是一种行之 有效的诱变技术。
木聚糖酶是植物细胞壁的主要之一,属 于非淀粉多糖。可作为生物漂白剂用于造纸工 业,也可用于生物转化等等。目前木聚糖酶的 生产主要还依靠真菌。
对于产酶微生物的育种,国外多采用基因工程手段 构建高产菌,而国内多采用传统的诱变方法,如紫外辐 射、化学诱变剂处理等,这些诱变手段获得的突变株一 般稳定性差、容易产生回复突变且负突变较多及诱变选 育的工作量很大,而20世纪80年代末,人们发现离子束 可以引起靶物质原子移位和重排,使细胞表面刻蚀和穿 孔,并能影响和改变细胞电性等现象,提出了离子束可 以用于细胞加工和基因转移的设想,并陆续得到了研究 证实,由此产生了国内外普遍关注的离子束生物技术工 程学,而且离子束育种是一项具有我国自主知识产权且 被国际所承认的定向遗传改良的集物理诱变和化学诱变 于一身的综合诱变方法,具有损伤小、突变谱广、突变 率高的特点。
(英文)生物外文文献

FIG. 3
SK-BR-3 cell,HER2过表达的乳腺癌细胞,STAT3可以通 过特定的细胞因子激活。HER2是重要的乳腺癌预后判 断因子,HER2阳性(过表达或扩增)的乳腺癌,其临 床特点和生物学行为有特殊表现,治疗模式也与其他 类型的乳腺癌有很大的区别。
36%
FIG. 4 LIF刺激
FIG. 1
15.5%
FIG. 2
GRN knockdown reduced the mRNA expression of these genes, similar to the effects of STAT3 knockdown
58%
染色质免疫共沉淀技术( chromatin immunoprecipitation assay, CHIP )
70%
Suggesting that some but not all phenotypes associated with GRN knockdown can be rescued by constitutively active STAT3.
FIG. 6
42.9%
13.5%
These findings indicate that in primary breast cancers, GRN expression specifically correlates with enhanced STAT3 transcriptional activity in the presence of tyrosinephosphorylated STAT3
• 皮尔森相关系数(Pearson correlation coefficient)也称皮尔森积矩 相关系数(Pearson product-moment correlation coefficient) ,是一种 线性相关系数。皮尔森相关系数是用来反映两个变量线性相关程 度的统计量。相关系数用r表示,其中n为样本量,分别为两个变 量的观测值和均值。r描述的是两个变量间线性相关强弱的程度。 r的绝对值越大表明相关性越强。
生物工程英文文献
Abstract. Thermomyces lanuginosus, isolated from
self-heated jute stacks in Bangladesh, was able to produce a very high level of cellulase-free xylanase in shake cultures using inexpensive lignocellulosic biomass. Of the nine lignocellulosic substrates tested, corn cobs were found to be the best inducer of xylanase activity. The laboratory results of xylanase production have been successfully scaled up to V A B I O (VoestAlpine Biomass Technology Center) scale using a 15m 3 fermentor for industrial production and application of xylanase. In addition, some properties of the enzyme in crude culture filtrate produced on corn cobs are presented. The enzyme exhibited very satisfactory storage stability at 4-30°C either as crude culture filtrate or as spray- or freeze-dried powder. The crude enzyme was active over a broad range of pH and had activity optima at pH 6.5 and 70-75 ° C. The enzyme was almost thermostable (91-927/o) at pH 6.5 and 9.0 after 41 h preincubation at 55 ° C and lost only 20-33% activity after 188 h. In contrast, it was much less thermostable at pH 5.0 and 11.0. Xylanases produced on different lignocellulosic substrates exhibited differences in thermostability at 55°C and pH 6.5.
微生物英文文献及翻译—翻译

A/O法活性污泥中氨氧化菌群落的动态与分布摘要:我们研究了在厌氧—好氧序批式反应器(SBR)中氨氧化菌群落(AOB)和亚硝酸盐氧化菌群落(NOB)的结构活性和分布。
在研究过程中,分子生物技术和微型技术被用于识别和鉴定这些微生物。
污泥微粒中的氨氧化菌群落结构大体上与初始的接种污泥中的结构不同。
与颗粒形成一起,由于过程条件中生物选择的压力,AOB的多样性下降了。
DGGE测序表明,亚硝化菌依然存在,这是因为它们能迅速的适应固定以对抗洗涤行为。
DGGE更进一步的分析揭露了较大的微粒对更多的AOB种类在反应器中的生存有好处。
在SBR反应器中有很多大小不一的微粒共存,颗粒的直径影响这AOB和NOB的分布。
中小微粒(直径<0.6mm)不能限制氧在所有污泥空间的传输。
大颗粒(直径>0.9mm)可以使含氧量降低从而限制NOB的生长。
所有这些研究提供了未来对AOB微粒系统机制可能性研究的支持。
关键词:氨氧化菌(AOB),污泥微粒,菌落发展,微粒大小,硝化菌分布,发育多样性1.简介在浓度足够高的条件下,氨在水环境中对水生生物有毒,并且对富营养化有贡献。
因此,废水中氨的生物降解和去除是废水处理工程的基本功能。
硝化反应,将氨通过硝化转化为硝酸盐,是去除氨的一个重要途径。
这是分两步组成的,由氨氧化和亚硝酸盐氧化细菌完成。
好氧氨氧化一般是第一步,硝化反应的限制步骤:然而,这是废水中氨去除的本质。
对16S rRNA的对比分析显示,大多数活性污泥里的氨氧化菌系统的跟ß-变形菌有关联。
然而,一系列的研究表明,在氨氧化菌的不同代和不同系有生理和生态区别,而且环境因素例如处理常量,溶解氧,盐度,pH,自由氨例子浓度会影响氨氧化菌的种类。
因此,废水处理中氨氧化菌的生理活动和平衡对废水处理系统的设计和运行是至关重要的。
由于这个原因,对氨氧化菌生态和微生物学更深一层的了解对加强处理效果是必须的。
当今,有几个进阶技术在废水生物处理系统中被用作鉴别、刻画微生物种类的有价值的工具。
微生物英文文献及翻译—原文

微生物英文文献及翻译—原文本期为微生物学的第二讲,主要讨论炭疽和蛔虫病这两种既往常见而当今社会较为罕见的疾病。
炭疽是由炭疽杆菌所致的一种人畜共患的急性传染病。
人因接触病畜及其产品及食用病畜的肉类而发生感染。
临床上主要表现为皮肤坏死、溃疡、焦痂和周围组织广泛水肿及毒血症症状;似蚓蛔线虫简称蛔虫,是人体内最常见的寄生虫之一。
成虫寄生于小肠,可引起蛔虫病。
其幼虫能在人体内移行,引起内脏幼虫移行症。
案例分析Case 1:A local craftsman who makes garments from the hides of goats visits his physician because over the past few days he has developed several black lesions on his hands and arms. The lesions are not painful, but he is alarmed by their appearance. He is afebrile and his physical examination is unremarkable.案例1:一名使用鹿皮做皮衣的当地木匠来就医,主诉过去几天中手掌和手臂上出现几个黑色皮肤损害。
皮损无痛,但是外观较为骇人。
患者无发热,体检无异常发现。
1. What is the most likely diagnosis?Cutaneous anthrax, caused by Bacillus anthracis. The skin lesions are painless and dark or charred ulcerations known as black eschar. It is classically transmitted by contact with thehide of a goat at the site of a minor open wound.皮肤炭疽:由炭疽杆菌引起,皮损通常无痛、黑色或称为焦痂样溃疡。
生物科学中英文对照外文翻译文献

中英文资料外文翻译文献译文标题:传统意大利榛子的体外繁殖用于当地遗传资源库的稳定和保存译文:关键词:欧洲榛,榛属,传统种质,体外繁殖摘要:在地中海盆地,榛子(欧洲榛)是非常重要的一种作物。
体外繁殖能够有效的稳定当地遗传资源库。
为了提高榛子微组织繁殖实验记录的精确性,各种不同的研究已经在进行。
这些研究通常以重要的品种为材料,然而,微组织繁殖实验记录应用在这些幼小品种上比起传统方法通常会产生相反的结果,这种技术在幼小品种上很少取得成功。
本实验的目的是为重要品种微组织繁殖的操作积累相关的知识和信息。
实验过程中需要设计不同成分的培养基,灭菌时间和培养时间都要进行详细的讨论。
传统意大利品种植株茎芽中的N6-异戊烯腺嘌呤的作用是改善这种状态。
生根阶段是榛属微组织繁殖应用于大型商业生产的关键步骤。
欧洲榛在欧洲特别是生物地理分布区地中海盆地代表一种重要的经济类林木。
榛子主要产于土耳其,意大利,美国和西班牙(分别是每年55,000, 110,000, 25,000, 18,000+吨),其次是法国,希腊,葡萄牙。
大约90%的产品被去皮并且以树芯的形式卖出,然而剩余的10%则作为树苗消费。
极好的营养成分和营养制品的特性也使该物种产生很高的利润。
此外,在一些特有的栽培地区,传统和文化身份严重受榛子产量的影响,文化身份常常会促进贫瘠土地的回收和利用。
即使这样,在一些地区,这种林业作物仍然不是重要的农业资源,然而,就当地足够维持的生产式系统和作为宝贵的食物的传统而言,它却是一种有趣的收入来源。
世界第二大生产商意大利说一些传统的品种主要种植在Campania ,Latium, Piedmont,在西西里岛有大量的属典型种。
近几年,一些主要品种由于质量和传统特性获得了欧洲质量印模。
此外,这些品种还被引进其他国家特定的果园中以增大他们的生长范围。
没有经过检验的物质可能会传播疾病,也可能会导致原因不明的物质的出现。
微组织繁殖法等生物技术的应用会促进健康的合乎本性的物质的产生(Nas et al.,2004),并且提高这种林木的经济价值。
微生物英文文献及翻译—翻译

A/O法活性污泥中氨氧化菌群落的动态与分布摘要:我们研究了在厌氧—好氧序批式反应器(SBR)中氨氧化菌群落(AOB)和亚硝酸盐氧化菌群落(NOB)的结构活性和分布。
在研究过程中,分子生物技术和微型技术被用于识别和鉴定这些微生物。
污泥微粒中的氨氧化菌群落结构大体上与初始的接种污泥中的结构不同。
与颗粒形成一起,由于过程条件中生物选择的压力,AOB的多样性下降了。
DGGE测序表明,亚硝化菌依然存在,这是因为它们能迅速的适应固定以对抗洗涤行为。
DGGE更进一步的分析揭露了较大的微粒对更多的AOB种类在反应器中的生存有好处。
在SBR反应器中有很多大小不一的微粒共存,颗粒的直径影响这AOB和NOB的分布。
中小微粒(直径<0.6mm)不能限制氧在所有污泥空间的传输。
大颗粒(直径>0.9mm)可以使含氧量降低从而限制NOB的生长。
所有这些研究提供了未来对AOB微粒系统机制可能性研究的支持。
关键词:氨氧化菌(AOB),污泥微粒,菌落发展,微粒大小,硝化菌分布,发育多样性•简介在浓度足够高的条件下,氨在水环境中对水生生物有毒,并且对富营养化有贡献。
因此,废水中氨的生物降解和去除是废水处理工程的基本功能。
硝化反应,将氨通过硝化转化为硝酸盐,是去除氨的一个重要途径。
这是分两步组成的,由氨氧化和亚硝酸盐氧化细菌完成。
好氧氨氧化一般是第一步,硝化反应的限制步骤:然而,这是废水中氨去除的本质。
对16S rRNA的对比分析显示,大多数活性污泥里的氨氧化菌系统的跟ß-变形菌有关联。
然而,一系列的研究表明,在氨氧化菌的不同代和不同系有生理和生态区别,而且环境因素例如处理常量,溶解氧,盐度,pH,自由氨例子浓度会影响氨氧化菌的种类。
因此,废水处理中氨氧化菌的生理活动和平衡对废水处理系统的设计和运行是至关重要的。
由于这个原因,对氨氧化菌生态和微生物学更深一层的了解对加强处理效果是必须的。
当今,有几个进阶技术在废水生物处理系统中被用作鉴别、刻画微生物种类的有价值的工具。
生物科学论文中英文资料外文翻译文献
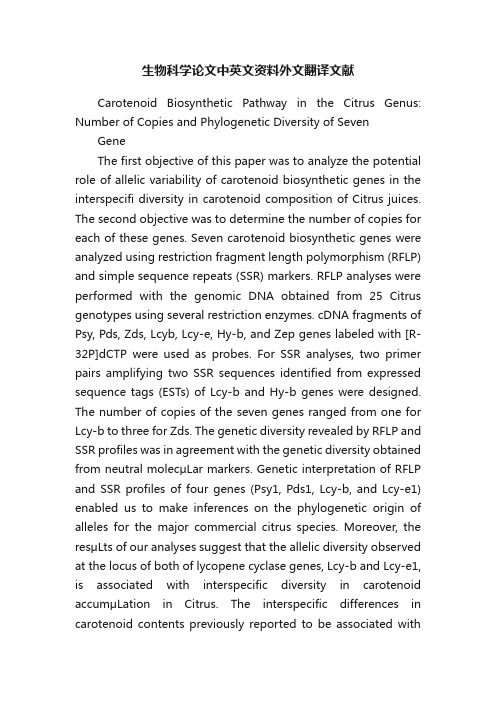
生物科学论文中英文资料外文翻译文献Carotenoid Biosynthetic Pathway in the Citrus Genus: Number of Copies and Phylogenetic Diversity of Seven GeneThe first objective of this paper was to analyze the potential role of allelic variability of carotenoid biosynthetic genes in the interspecifi diversity in carotenoid composition of Citrus juices. The second objective was to determine the number of copies for each of these genes. Seven carotenoid biosynthetic genes were analyzed using restriction fragment length polymorphism (RFLP) and simple sequence repeats (SSR) markers. RFLP analyses were performed with the genomic DNA obtained from 25 Citrus genotypes using several restriction enzymes. cDNA fragments of Psy, Pds, Zds, Lcyb, Lcy-e, Hy-b, and Zep genes labeled with [R-32P]dCTP were used as probes. For SSR analyses, two primer pairs amplifying two SSR sequences identified from expressed sequence tags (ESTs) of Lcy-b and Hy-b genes were designed. The number of copies of the seven genes ranged from one for Lcy-b to three for Zds. The genetic diversity revealed by RFLP and SSR profiles was in agreement with the genetic diversity obtained from neutral molecμLar markers. Genetic interpretation of RFLP and SSR profiles of four genes (Psy1, Pds1, Lcy-b, and Lcy-e1) enabled us to make inferences on the phylogenetic origin of alleles for the major commercial citrus species. Moreover, the resμLts of our analyses suggest that the allelic diversity observed at the locus of both of lycopene cyclase genes, Lcy-b and Lcy-e1, is associated with interspecific diversity in carotenoid accumμLation in Citrus. The interspecific differences in carotenoid contents previously reported to be associated withother key steps catalyzed by PSY, HY-b, and ZEP were not linked to specific alleles at the corresponding loci.KEYWORDS: Citrus; carotenoids; biosynthetic genes; allelic variability; phylogeny INTRODUCTIONCarotenoids are pigments common to all photosynthetic organisms. In pigment-protein complexes, they act as light sensors for photosynthesis but also prevent photo-oxidat ion induced by too strong light intensities. In horticμLtural crops, they play a major role in fruit, root, or tuber coloration and in nutritional quality. Indeed some of these micronutrients are precursors of vitamin A, an essential component of human and animal diets. Carotenoids may also play a role in chronic disease prevention (such as certain cancers), probably due to their antioxidant properties. The carotenoid biosynthetic pathway is now well established. Carotenoids are synthesized in plastids by nuclear-encoded enzymes. The immediate precursor of carotenoids (and also of gibberellins, plastoquinone, chlorophylls,phylloquinones, and tocopherols) is geranylgeranyl diphosphate (GGPP). In light-grown plants, GGPP is mainly derivedcarotenoid, 15-cis-phytoene. Phytoene undergoes four desaturation reactions catalyzed by two enzymes, phytoene desaturase (PDS) and β-carotene desaturase (ZDS), which convert phytoene into the red-colored poly-cis-lycopene. Recently, Isaacson et al. and Park et al. isolated from tomato and Arabidopsis thaliana, respectively, the genes that encode the carotenoid isomerase (CRTISO) which, in turn, catalyzes the isomerization of poly-cis-carotenoids into all-trans-carotenoids. CRTISO acts on prolycopene to form all-trans lycopene, which undergoes cyclization reactions. Cyclization of lycopene is abranching point: one branch leads to β-carotene (β, β-carotene) and the other toα-carotene (β, ε-carotene). Lycopene β-cyclase (LCY-b) then converts lycopene intoβ-carotene in two steps, whereas the formation of α-carotene requires the action of two enzymes, lycopene ε- cyclase (LCY-e) and lycopene β-cyclase (LCY-b). α- carotene is converted into lutein by hydroxylations catalyzed by ε-carotene hydroxylase (HY-e) andβ-carotene hydroxylase (HY-b). Other xanthophylls are produced fromβ-carotene with hydroxylation reactions catalyzed by HY-b and epoxydation catalyzed by zeaxanthin epoxidase (ZEP). Most of the carotenoid biosynthetic genes have been cloned and sequenced in Citrus varieties . However, our knowledge of the complex regμLation of carotenoid biosynthesis in Citrus fruit is still limited. We need further information on the number of copies of these genes and on their allelic diversity in Citrus because these can influence carotenoid composition within the Citrus genus.Citrus fruit are among the richest sources of carotenoids. The fruit generally display a complex carotenoid structure, and 115 different carotenoids have been identified in Citrus fruit. The carotenoid richness of Citrus flesh depends on environmental conditions, particμLarly on growing conditions and on geogr aphical origin . However the main factor influencing variability of caro tenoid quality in juice has been shown to be genetic diversity. Kato et al. showed that mandarin and orange juices accumμLated high levels of β-cryptoxanthin and violaxanthin, respectively, whereas mature lemon accumμLated extremely low levels of carotenoids. Goodner et al. demonstrated that mandarins, oranges, and their hybrids coμLd be clearly distinguished by theirβ-cryptoxanthin contents. Juices of red grapefruit contained two major carotenoids: lycopene and β-carotene. More recently, we conducted a broad study on the organization of the variability of carotenoid contents in different cμLtivated Citrus species in relation with the biosynthetic pathway . Qualitative analysis of presence or absence of the different compounds revealed three main clusters: (1) mandarins, sweet oranges, and sour oranges;(2) citrons, lemons, and limes; (3) pummelos and grapefruit. Our study also enabled identification of key steps in the diversification of the carotenoid profile. Synthesis of phytoene appeared as a limiti ng step for acid Citrus, while formation of β-carotene and R-carotene from lycopene were dramatically limited in cluster 3 (pummelos and grapefruit). Only varieties in cluster 1 were able to produce violaxanthin. In the same study , we concluded that there was a very strong correlation between the classification of Citrus species based on the presence or absence of carotenoids (below,this classification is also referred to as the organization of carotenoid diversity) and genetic diversity evaluated with bi ochemical or molecμLar markers such as isozymes or randomLy amplified polymorphic DNA (RAPD). We also concluded that, at the interspecific level, the organization of the diversity of carotenoid composition was linked to the global evolution process of cμLt ivated Citrus rather than to more recent mutation events or human selection processes. Indeed, at interspecific level, a correlation between phenotypic variability and genetic diversity is common and is generally associated with generalized gametic is common and is generally associated with generalized gametic disequilibrium resμLting from the history of cμLtivated Citrus. Thus from numerical taxonomy based on morphologicaltraits or from analysis of molecμLar markers , all authors agreed on the existence o f three basic taxa (C. reticμLata, mandarins; C. medica, citrons; and C. maxima, pummelos) whose differentiation was the resμLt of allopatric evolution. All other cμLtivated Citrus specie s (C. sinensis, sweet oranges; C. aurantium, sour oranges;C. paradi si, grapefruit; and C. limon, lemons) resμLted from hybridization events within this basic pool except for C. aurantifolia, which may be a hybrid between C. medica and C. micrantha .Our p revious resμLts and data on Citrus evolution lead us to propose the hypothesis that the allelic variability supporting the organization of carotenoid diversity at interspecific level preceded events that resμLted in the creation of secondary species. Such molecμLar variability may have two different effects: on the one hand, non-silent substitutions in coding region affect the specific activity of corresponding enzymes of the biosynthetic pathway, and on the other hand, variations in untranslated regions affect transcriptional or post-transcriptional mechanisms.There is no available data on the allelic diversity of Citrus genes of the carotenoid biosynthetic pathway. The objective of this paper was to test the hypothesis that allelic variability of these genes partially determines phenotypic variability at the interspecific level. For this purpose, we analyzed the RFLPs around seven genes of the biosynthetic pathway of carotenoids (Psy, Pds, Zds, Lcy-b, Lcy-e, Hy-b, Zep) and the polymorphism of two SSR sequences found in Lcy-b and Hy-b genes in a representative set of varieties of the Citrus genus already analyzed for carotenoid constitution. Our study aimed to answer the following questions: (a) are those genes mono- or mμLtilocus, (b) is the polymorphism revealed by RFLP and SSR markers inagreement with the general histor y of cμLtivated Citrus thus permitting inferences about the phylogenetic origin of genes of the secondary species, and (c) is this polymorphism associated with phenotypic (carotenoid compound) variations.RESΜLTS AND DISCUSSIONGlobal Diversity of the Genotype Sample Observed by RFLP Analysis. RFLP analyses were performed using probes defined from expressed sequences of seven major genes of the carotenoid biosynthetic pathway . One or two restriction enzymes were used for each gene. None of these enzymes cut the cDNA probe sequence except HindIII for the Lcy-e gene. Intronic sequences and restriction sites on genomic sequences werescreened with PCR amplification using genomic DNA as template and with digestion of PCR products. The resμLts indicated the absence of an intronic sequence for Psy and Lcy-b fragments. The absence of intron in these two fragments was checked by cloning and sequencing corresponding genomic sequences (data not shown). Conversely, we found introns in Pds, Zds, Hy-b, Zep, and Lcy-e genomic sequences corresponding to RFLP probes. EcoRV did not cut the genomic sequences of Pds, Zds, Hy-b, Zep, and Lcy-e. In the same way, no BamHI restriction site was found in the genomic sequences of Pds, Zds, and Hy-b. Data relative to the diversity observed for the different genes are presented in Table 4. A total of 58 fragments were identified, six of them being monomorphic (present in all individuals). In the limited sample of the three basic taxa, only eight bands out of 58 coμLd not be observed. In the basic taxa, the mean number of bands per genotype observed was 24.7, 24.7, and 17 for C. reticμLata, C. maxima, and C. medica, respectively. It varies from28 (C. limettioides) to 36 (C. aurantium) for the secondary species. The mean number of RFLP bands per individual was lower for basic taxa than for the group of secondary species. This resμLt indicates that secondary species are much more heterozygous than the basic ones for these genes, which is logical if we assume that the secondary species arise from hybridizations between the three basic taxa. Moreover C. medica appears to be the least heterozygous taxon for RFLP around the genes of the carotenoid biosynthetic pathway, as already shown with isozymes, RAPD, and SSR markers.The two lemons were close to the acid Citrus cluster and the three sour oranges close to the mandarins/sweet oranges cluster. This organization of genetic diversity based on the RFLP profiles obtained with seven genes of the carotenoid pathway is very similar to that previously obtained with neutral molecμLar markers such as genomic SSR as well as the organization obtained with qualitative carotenoid compositions. All these resμLts suggest that the observed RFLP and SSR fragments are good phylogenetic markers. It seems consistent with our basic hypothesis that major differentiation in the genes involved in the carotenoid biosynthetic pathway preceded the creation of the secondary hybrid species and thus that the allelic structure of these hybrid species can be reconstructed from alleles observed in the three basic taxa.Gene by Gene Analysis: The Psy Gene. For the Psy probe combined with EcoRV or BamHI restriction enzymes, five bands were identified for the two enzymes, and two to three bands were observed for each genotype. One of these bands was present in all individuals. There was no restriction site in the probe sequence. These resμLts lead us to believe that Psy is present at two loci,one where no polymorphism was found with the restriction enzymes used, and one that displayed polymorphism. The number of different profiles observed was six and four with EcoRV and BamHI, respectively, for a total of 10 different profiles among the 25 individuals .Two Psy genes have also been found in tomato, tobacco, maize, and rice . Conversely, only one Psy gene has been found in Arabidopsis thaliana and in pepper (Capsicum annuum), which also accumμLates carotenoids in fruit. According to Bartley and Scolnik, Psy1 was expressed in tomato fruit chromoplasts, while Psy2 was specific to leaf tissue. In the same way, in Poaceae (maize, rice), Gallagher et al. found that Psy gene was duplicated and that Psy1 and notPsy2 transcripts in endosperm correlated with endosperm carotenoid accumμLation. These resμLts underline the role of gene duplication and the importance of tissue-specific phytoene synthase in the regμLation of carotenoid accumμLation.All the polymorphic bands were present in the sample of the basic taxon genomes. Assuming the hypothesis that all these bands describe the polymorphism at the same locus for the Psy gene, we can conclude that we found allelic differentiation between the three basic taxa with three alleles for C. reticμLata, four for C. maxima, and one for C. medica.The alleles observed for the basic taxa then enabled us to determine the genotypes of all the other species. The presumed genotypes for the Psy polymorphic locus are given in Table 7. Sweet oranges and grapefruit were heterozygous with one mandarin and one pummelo allele. Sour oranges were heterozygous; they shared the same mandarin allele with sweet oranges but had a different pummelo allele. Clementine was heterozygous with two mandarin alleles; one shared with sweetoranges and one with “Willow leaf” mandarin. “Meyer” lemon was heterozygous, with the mandarin allele also found in sweet oranges, and the citron allele. “Eureka”lemon was also heterozygous with the same pummelo allele as sour oranges and the citron allele. The other acid Citrus were homozygous for the citron allele.The Pds Gen. For the Pds probe combined with EcoRV, six different fragments were observed. One was common to all individuals. The number of fragments per individual was two or three. ResμLts for Pds led us to believe that this gene is present at two loci, one where no polymorphism was found with EcoRV restriction, and one displaying polymorphism. Conversely, studies on Arabidopsis, tomato, maize, and rice showed that Pds was a single copy gene. However, a previous study on Citrus suggests that Pds is present as a low-copy gene family in the Citrus genome, which is in agreement with our findings.The Zds Gene. The Zds profiles were complex. Nine and five fragments were observed with EcoRV and BamHI restriction, respectively. For both enzymes, one fragment was common to all individuals. The number of fragments per individual ranged from two to six for EcoRV and three to five for BamHI. There was no restriction site in the probe sequence. It can be assumed that several copies (at least three) of the Zds gene are present in the Citrus genome with polymorphism for at least two of them. In Arabidopsis, maize, and rice, like Pds, Zds was a single-copy gene .In these conditions and in the absence of analysis of controlled progenies, we are unable to conduct genetic analysis of profiles. However it appears that some bands differentiated the basic taxa: one for mandarins, one for pummelos, and one for citrons with EcoRV restriction and one for pummelos and onefor citrons with BamHI restriction. Two bands out of the nine obtained with EcoRV were not observed in the samples of basic taxa. One was rare and only observed in “Rangpur” lime. The other was found in sour oranges, “V olkamer” lemon,and “Palestine sweet” lime suggesting a common ancestor for these three genotypes.This is in agreement with the assumption of Nicolosi et al. that “V olkamer” lemon resμLts from a complex hybrid combination with C. aurantium as one parent. It will be necessary to extend the analysis of the basic taxa to conclude whether these specific bands are present in the diversity of these taxa or resμLt from mutations after the formation of the secondary species.The Lcy-b Gene with RFLP Analysis.After restriction with EcoRV and hybridization with the Lcy-b probe, we obtained simple profiles with a total of four fragments. One to two fragments were observed for each individual, and seven profiles were differentiated among the 25 genotypes. These resμLts provide evidence that Lcy-b is present at a single locus in the haploid Citrus genome. Two lycopene β-cyclases encoded by two genes have been identified in tomato. The B gene encoded a novel type of lycopene β-cyclase whose sequence was similar to capsanthin-capsorubin synthase. The B gene expressed at a high level in βmutants was responsible for strong accumμLation ofβ-carotene in fruit, while in wild-type tomatoes, B was expressed at a low level.The Lcy-b Gene with SSR Analysis. Four bands were detected at locus 1210 (Lcy-b gene). One or two bands were detected per variety confirming that this gene is mono locus. Six different profiles were observed among the 25 genotypes. As with RFLPanalysis, no intrataxon molecμLar polymorphism was found within C. Paradisi, C. Sinensis, and C. Aurantium.Taken together, the information obtained from RFLP and SSR analyses enabled us to identify a complete differentiation among the three basic taxon samples. Each of these taxons displayed two alleles for the analyzed sample. An additional allele was identified for “Mexican” l ime. The profiles for all secondary species can be reconstructed from these alleles. Deduced genetic structure is given in. Sweet oranges and clementine were heterozygous with one mandarin and one pummelo allele. Sour oranges were also heterozygous sharing the same mandarin allele as sweet oranges but with another pummelo allele. Grapefruit were heterozygous with two pummelo alleles. All the acid secondary species were heterozygous, having one allele from citrons and the other one from mandarins except for “Mexican” lime, which had a specific allele.柑桔属类胡萝卜素生物合成途径中七个基因拷贝数目及遗传多样性的分析摘要:本文的首要目标是分析类胡萝卜素生物合成相关等位基因在发生变异柑橘属类胡萝卜素组分种间差异的潜在作用;第二个目标是确定这些基因的拷贝数。
分子生物学英文文献6

Chapter19Detection and Quantitative Analysis of Small RNAs by PCR Seungil Ro and Wei YanAbstractIncreasing lines of evidence indicate that small non-coding RNAs including miRNAs,piRNAs,rasiRNAs, 21U endo-siRNAs,and snoRNAs are involved in many critical biological processes.Functional studies of these small RNAs require a simple,sensitive,and reliable method for detecting and quantifying levels of small RNAs.Here,we describe such a method that has been widely used for the validation of cloned small RNAs and also for quantitative analyses of small RNAs in both tissues and cells.Key words:Small RNAs,miRNAs,piRNAs,expression,PCR.1.IntroductionThe past several years have witnessed the surprising discovery ofnumerous non-coding small RNAs species encoded by genomesof virtually all species(1–6),which include microRNAs(miR-NAs)(7–10),piwi-interacting RNAs(piRNAs)(11–14),repeat-associated siRNAs(rasiRNAs)(15–18),21U endo-siRNAs(19),and small nucleolar RNAs(snoRNAs)(20).These small RNAsare involved in all aspects of cellular functions through direct orindirect interactions with genomic DNAs,RNAs,and proteins.Functional studies on these small RNAs are just beginning,andsome preliminaryfindings have suggested that they are involvedin regulating genome stability,epigenetic marking,transcription,translation,and protein functions(5,21–23).An easy and sensi-tive method to detect and quantify levels of these small RNAs inorgans or cells during developmental courses,or under different M.Sioud(ed.),RNA Therapeutics,Methods in Molecular Biology629,DOI10.1007/978-1-60761-657-3_19,©Springer Science+Business Media,LLC2010295296Ro and Yanphysiological and pathophysiological conditions,is essential forfunctional studies.Quantitative analyses of small RNAs appear tobe challenging because of their small sizes[∼20nucleotides(nt)for miRNAs,∼30nt for piRNAs,and60–200nt for snoRNAs].Northern blot analysis has been the standard method for detec-tion and quantitative analyses of RNAs.But it requires a relativelylarge amount of starting material(10–20μg of total RNA or>5μg of small RNA fraction).It is also a labor-intensive pro-cedure involving the use of polyacrylamide gel electrophoresis,electrotransfer,radioisotope-labeled probes,and autoradiogra-phy.We have developed a simple and reliable PCR-based methodfor detection and quantification of all types of small non-codingRNAs.In this method,small RNA fractions are isolated and polyAtails are added to the3 ends by polyadenylation(Fig.19.1).Small RNA cDNAs(srcDNAs)are then generated by reverseFig.19.1.Overview of small RNA complementary DNA(srcDNA)library construction forPCR or qPCR analysis.Small RNAs are polyadenylated using a polyA polymerase.ThepolyA-tailed RNAs are reverse-transcribed using a primer miRTQ containing oligo dTsflanked by an adaptor sequence.RNAs are removed by RNase H from the srcDNA.ThesrcDNA is ready for PCR or qPCR to be carried out using a small RNA-specific primer(srSP)and a universal reverse primer,RTQ-UNIr.Quantitative Analysis of Small RNAs297transcription using a primer consisting of adaptor sequences atthe5 end and polyT at the3 end(miRTQ).Using the srcD-NAs,non-quantitative or quantitative PCR can then be per-formed using a small RNA-specific primer and the RTQ-UNIrprimer.This method has been utilized by investigators in numer-ous studies(18,24–38).Two recent technologies,454sequenc-ing and microarray(39,40)for high-throughput analyses of miR-NAs and other small RNAs,also need an independent method forvalidation.454sequencing,the next-generation sequencing tech-nology,allows virtually exhaustive sequencing of all small RNAspecies within a small RNA library.However,each of the clonednovel small RNAs needs to be validated by examining its expres-sion in organs or in cells.Microarray assays of miRNAs have beenavailable but only known or bioinformatically predicted miR-NAs are covered.Similar to mRNA microarray analyses,the up-or down-regulation of miRNA levels under different conditionsneeds to be further validated using conventional Northern blotanalyses or PCR-based methods like the one that we are describ-ing here.2.Materials2.1.Isolation of Small RNAs, Polyadenylation,and Purification 1.mirVana miRNA Isolation Kit(Ambion).2.Phosphate-buffered saline(PBS)buffer.3.Poly(A)polymerase.4.mirVana Probe and Marker Kit(Ambion).2.2.Reverse Transcription,PCR, and Quantitative PCR 1.Superscript III First-Strand Synthesis System for RT-PCR(Invitrogen).2.miRTQ primers(Table19.1).3.AmpliTaq Gold PCR Master Mix for PCR.4.SYBR Green PCR Master Mix for qPCR.5.A miRNA-specific primer(e.g.,let-7a)and RTQ-UNIr(Table19.1).6.Agarose and100bp DNA ladder.3.Methods3.1.Isolation of Small RNAs 1.Harvest tissue(≤250mg)or cells in a1.7-mL tube with500μL of cold PBS.T a b l e 19.1O l i g o n u c l e o t i d e s u s e dN a m eS e q u e n c e (5 –3 )N o t eU s a g em i R T QC G A A T T C T A G A G C T C G A G G C A G G C G A C A T G G C T G G C T A G T T A A G C T T G G T A C C G A G C T A G T C C T T T T T T T T T T T T T T T T T T T T T T T T T V N ∗R N a s e f r e e ,H P L CR e v e r s e t r a n s c r i p t i o nR T Q -U N I r C G A A T T C T A G A G C T C G A G G C A G GR e g u l a r d e s a l t i n gP C R /q P C Rl e t -7a T G A G G T A G T A G G T T G T A T A G R e g u l a r d e s a l t i n gP C R /q P C R∗V =A ,C ,o r G ;N =A ,C ,G ,o r TQuantitative Analysis of Small RNAs299 2.Centrifuge at∼5,000rpm for2min at room temperature(RT).3.Remove PBS as much as possible.For cells,remove PBScarefully without breaking the pellet,leave∼100μL of PBS,and resuspend cells by tapping gently.4.Add300–600μL of lysis/binding buffer(10volumes pertissue mass)on ice.When you start with frozen tissue or cells,immediately add lysis/binding buffer(10volumes per tissue mass)on ice.5.Cut tissue into small pieces using scissors and grind it usinga homogenizer.For cells,skip this step.6.Vortex for40s to mix.7.Add one-tenth volume of miRNA homogenate additive onice and mix well by vortexing.8.Leave the mixture on ice for10min.For tissue,mix it every2min.9.Add an equal volume(330–660μL)of acid-phenol:chloroform.Be sure to withdraw from the bottom phase(the upper phase is an aqueous buffer).10.Mix thoroughly by inverting the tubes several times.11.Centrifuge at10,000rpm for5min at RT.12.Recover the aqueous phase carefully without disrupting thelower phase and transfer it to a fresh tube.13.Measure the volume using a scale(1g=∼1mL)andnote it.14.Add one-third volume of100%ethanol at RT to the recov-ered aqueous phase.15.Mix thoroughly by inverting the tubes several times.16.Transfer up to700μL of the mixture into afilter cartridgewithin a collection bel thefilter as total RNA.When you have>700μL of the mixture,apply it in suc-cessive application to the samefilter.17.Centrifuge at10,000rpm for15s at RT.18.Collect thefiltrate(theflow-through).Save the cartridgefor total RNA isolation(go to Step24).19.Add two-third volume of100%ethanol at RT to theflow-through.20.Mix thoroughly by inverting the tubes several times.21.Transfer up to700μL of the mixture into a newfilterbel thefilter as small RNA.When you have >700μL of thefiltrate mixture,apply it in successive appli-cation to the samefilter.300Ro and Yan22.Centrifuge at10,000rpm for15s at RT.23.Discard theflow-through and repeat until all of thefiltratemixture is passed through thefilter.Reuse the collectiontube for the following washing steps.24.Apply700μL of miRNA wash solution1(working solu-tion mixed with ethanol)to thefilter.25.Centrifuge at10,000rpm for15s at RT.26.Discard theflow-through.27.Apply500μL of miRNA wash solution2/3(working solu-tion mixed with ethanol)to thefilter.28.Centrifuge at10,000rpm for15s at RT.29.Discard theflow-through and repeat Step27.30.Centrifuge at12,000rpm for1min at RT.31.Transfer thefilter cartridge to a new collection tube.32.Apply100μL of pre-heated(95◦C)elution solution orRNase-free water to the center of thefilter and close thecap.Aliquot a desired amount of elution solution intoa1.7-mL tube and heat it on a heat block at95◦C for∼15min.Open the cap carefully because it might splashdue to pressure buildup.33.Leave thefilter tube alone for1min at RT.34.Centrifuge at12,000rpm for1min at RT.35.Measure total RNA and small RNA concentrations usingNanoDrop or another spectrophotometer.36.Store it at–80◦C until used.3.2.Polyadenylation1.Set up a reaction mixture with a total volume of50μL in a0.5-mL tube containing0.1–2μg of small RNAs,10μL of5×E-PAP buffer,5μL of25mM MnCl2,5μL of10mMATP,1μL(2U)of Escherichia coli poly(A)polymerase I,and RNase-free water(up to50μL).When you have a lowconcentration of small RNAs,increase the total volume;5×E-PAP buffer,25mM MnCl2,and10mM ATP should beincreased accordingly.2.Mix well and spin the tube briefly.3.Incubate for1h at37◦C.3.3.Purification 1.Add an equal volume(50μL)of acid-phenol:chloroformto the polyadenylation reaction mixture.When you have>50μL of the mixture,increase acid-phenol:chloroformaccordingly.2.Mix thoroughly by tapping the tube.Quantitative Analysis of Small RNAs3013.Centrifuge at10,000rpm for5min at RT.4.Recover the aqueous phase carefully without disrupting thelower phase and transfer it to a fresh tube.5.Add12volumes(600μL)of binding/washing buffer tothe aqueous phase.When you have>50μL of the aqueous phase,increase binding/washing buffer accordingly.6.Transfer up to460μL of the mixture into a purificationcartridge within a collection tube.7.Centrifuge at10,000rpm for15s at RT.8.Discard thefiltrate(theflow-through)and repeat until allof the mixture is passed through the cartridge.Reuse the collection tube.9.Apply300μL of binding/washing buffer to the cartridge.10.Centrifuge at12,000rpm for1min at RT.11.Transfer the cartridge to a new collection tube.12.Apply25μL of pre-heated(95◦C)elution solution to thecenter of thefilter and close the cap.Aliquot a desired amount of elution solution into a1.7-mL tube and heat it on a heat block at95◦C for∼15min.Open the cap care-fully because it might be splash due to pressure buildup.13.Let thefilter tube stand for1min at RT.14.Centrifuge at12,000rpm for1min at RT.15.Repeat Steps12–14with a second aliquot of25μL ofpre-heated(95◦C)elution solution.16.Measure polyadenylated(tailed)RNA concentration usingNanoDrop or another spectrophotometer.17.Store it at–80◦C until used.After polyadenylation,RNAconcentration should increase up to5–10times of the start-ing concentration.3.4.Reverse Transcription 1.Mix2μg of tailed RNAs,1μL(1μg)of miRTQ,andRNase-free water(up to21μL)in a PCR tube.2.Incubate for10min at65◦C and for5min at4◦C.3.Add1μL of10mM dNTP mix,1μL of RNaseOUT,4μLof10×RT buffer,4μL of0.1M DTT,8μL of25mM MgCl2,and1μL of SuperScript III reverse transcriptase to the mixture.When you have a low concentration of lig-ated RNAs,increase the total volume;10×RT buffer,0.1M DTT,and25mM MgCl2should be increased accordingly.4.Mix well and spin the tube briefly.5.Incubate for60min at50◦C and for5min at85◦C toinactivate the reaction.302Ro and Yan6.Add1μL of RNase H to the mixture.7.Incubate for20min at37◦C.8.Add60μL of nuclease-free water.3.5.PCR and qPCR 1.Set up a reaction mixture with a total volume of25μL ina PCR tube containing1μL of small RNA cDNAs(srcD-NAs),1μL(5pmol of a miRNA-specific primer(srSP),1μL(5pmol)of RTQ-UNIr,12.5μL of AmpliTaq GoldPCR Master Mix,and9.5μL of nuclease-free water.ForqPCR,use SYBR Green PCR Master Mix instead of Ampli-Taq Gold PCR Master Mix.2.Mix well and spin the tube briefly.3.Start PCR or qPCR with the conditions:95◦C for10minand then40cycles at95◦C for15s,at48◦C for30s and at60◦C for1min.4.Adjust annealing Tm according to the Tm of your primer5.Run2μL of the PCR or qPCR products along with a100bpDNA ladder on a2%agarose gel.∼PCR products should be∼120–200bp depending on the small RNA species(e.g.,∼120–130bp for miRNAs and piRNAs).4.Notes1.This PCR method can be used for quantitative PCR(qPCR)or semi-quantitative PCR(semi-qPCR)on small RNAs suchas miRNAs,piRNAs,snoRNAs,small interfering RNAs(siRNAs),transfer RNAs(tRNAs),and ribosomal RNAs(rRNAs)(18,24–38).2.Design miRNA-specific primers to contain only the“coresequence”since our cloning method uses two degeneratenucleotides(VN)at the3 end to make small RNA cDNAs(srcDNAs)(see let-7a,Table19.1).3.For qPCR analysis,two miRNAs and a piRNA were quan-titated using the SYBR Green PCR Master Mix(41).Cyclethreshold(Ct)is the cycle number at which thefluorescencesignal reaches the threshold level above the background.ACt value for each miRNA tested was automatically calculatedby setting the threshold level to be0.1–0.3with auto base-line.All Ct values depend on the abundance of target miR-NAs.For example,average Ct values for let-7isoforms rangefrom17to20when25ng of each srcDNA sample from themultiple tissues was used(see(41).Quantitative Analysis of Small RNAs3034.This method amplifies over a broad dynamic range up to10orders of magnitude and has excellent sensitivity capable ofdetecting as little as0.001ng of the srcDNA in qPCR assays.5.For qPCR,each small RNA-specific primer should be testedalong with a known control primer(e.g.,let-7a)for PCRefficiency.Good efficiencies range from90%to110%calcu-lated from slopes between–3.1and–3.6.6.On an agarose gel,mature miRNAs and precursor miRNAs(pre-miRNAs)can be differentiated by their size.PCR prod-ucts containing miRNAs will be∼120bp long in size whileproducts containing pre-miRNAs will be∼170bp long.However,our PCR method preferentially amplifies maturemiRNAs(see Results and Discussion in(41)).We testedour PCR method to quantify over100miRNAs,but neverdetected pre-miRNAs(18,29–31,38). AcknowledgmentsThe authors would like to thank Jonathan Cho for reading andediting the text.This work was supported by grants from theNational Institute of Health(HD048855and HD050281)toW.Y.References1.Ambros,V.(2004)The functions of animalmicroRNAs.Nature,431,350–355.2.Bartel,D.P.(2004)MicroRNAs:genomics,biogenesis,mechanism,and function.Cell, 116,281–297.3.Chang,T.C.and Mendell,J.T.(2007)Theroles of microRNAs in vertebrate physiol-ogy and human disease.Annu Rev Genomics Hum Genet.4.Kim,V.N.(2005)MicroRNA biogenesis:coordinated cropping and dicing.Nat Rev Mol Cell Biol,6,376–385.5.Kim,V.N.(2006)Small RNAs just gotbigger:Piwi-interacting RNAs(piRNAs) in mammalian testes.Genes Dev,20, 1993–1997.6.Kotaja,N.,Bhattacharyya,S.N.,Jaskiewicz,L.,Kimmins,S.,Parvinen,M.,Filipowicz, W.,and Sassone-Corsi,P.(2006)The chro-matoid body of male germ cells:similarity with processing bodies and presence of Dicer and microRNA pathway components.Proc Natl Acad Sci U S A,103,2647–2652.7.Aravin,A.A.,Lagos-Quintana,M.,Yalcin,A.,Zavolan,M.,Marks,D.,Snyder,B.,Gaaster-land,T.,Meyer,J.,and Tuschl,T.(2003) The small RNA profile during Drosophilamelanogaster development.Dev Cell,5, 337–350.8.Lee,R.C.and Ambros,V.(2001)An exten-sive class of small RNAs in Caenorhabditis ele-gans.Science,294,862–864.u,N.C.,Lim,L.P.,Weinstein, E.G.,and Bartel,D.P.(2001)An abundant class of tiny RNAs with probable regulatory roles in Caenorhabditis elegans.Science,294, 858–862.gos-Quintana,M.,Rauhut,R.,Lendeckel,W.,and Tuschl,T.(2001)Identification of novel genes coding for small expressed RNAs.Science,294,853–858.u,N.C.,Seto,A.G.,Kim,J.,Kuramochi-Miyagawa,S.,Nakano,T.,Bartel,D.P.,and Kingston,R.E.(2006)Characterization of the piRNA complex from rat testes.Science, 313,363–367.12.Grivna,S.T.,Beyret,E.,Wang,Z.,and Lin,H.(2006)A novel class of small RNAs inmouse spermatogenic cells.Genes Dev,20, 1709–1714.13.Girard, A.,Sachidanandam,R.,Hannon,G.J.,and Carmell,M.A.(2006)A germline-specific class of small RNAs binds mammalian Piwi proteins.Nature,442,199–202.304Ro and Yan14.Aravin,A.,Gaidatzis,D.,Pfeffer,S.,Lagos-Quintana,M.,Landgraf,P.,Iovino,N., Morris,P.,Brownstein,M.J.,Kuramochi-Miyagawa,S.,Nakano,T.,Chien,M.,Russo, J.J.,Ju,J.,Sheridan,R.,Sander,C.,Zavolan, M.,and Tuschl,T.(2006)A novel class of small RNAs bind to MILI protein in mouse testes.Nature,442,203–207.15.Watanabe,T.,Takeda, A.,Tsukiyama,T.,Mise,K.,Okuno,T.,Sasaki,H.,Minami, N.,and Imai,H.(2006)Identification and characterization of two novel classes of small RNAs in the mouse germline: retrotransposon-derived siRNAs in oocytes and germline small RNAs in testes.Genes Dev,20,1732–1743.16.Vagin,V.V.,Sigova,A.,Li,C.,Seitz,H.,Gvozdev,V.,and Zamore,P.D.(2006)A distinct small RNA pathway silences selfish genetic elements in the germline.Science, 313,320–324.17.Saito,K.,Nishida,K.M.,Mori,T.,Kawa-mura,Y.,Miyoshi,K.,Nagami,T.,Siomi,H.,and Siomi,M.C.(2006)Specific asso-ciation of Piwi with rasiRNAs derived from retrotransposon and heterochromatic regions in the Drosophila genome.Genes Dev,20, 2214–2222.18.Ro,S.,Song,R.,Park, C.,Zheng,H.,Sanders,K.M.,and Yan,W.(2007)Cloning and expression profiling of small RNAs expressed in the mouse ovary.RNA,13, 2366–2380.19.Ruby,J.G.,Jan,C.,Player,C.,Axtell,M.J.,Lee,W.,Nusbaum,C.,Ge,H.,and Bartel,D.P.(2006)Large-scale sequencing reveals21U-RNAs and additional microRNAs and endogenous siRNAs in C.elegans.Cell,127, 1193–1207.20.Terns,M.P.and Terns,R.M.(2002)Small nucleolar RNAs:versatile trans-acting molecules of ancient evolutionary origin.Gene Expr,10,17–39.21.Ouellet,D.L.,Perron,M.P.,Gobeil,L.A.,Plante,P.,and Provost,P.(2006)MicroR-NAs in gene regulation:when the smallest governs it all.J Biomed Biotechnol,2006, 69616.22.Maatouk,D.and Harfe,B.(2006)MicroR-NAs in development.ScientificWorldJournal, 6,1828–1840.23.Kim,V.N.and Nam,J.W.(2006)Genomics of microRNA.Trends Genet,22, 165–173.24.Bohnsack,M.T.,Kos,M.,and Tollervey,D.(2008)Quantitative analysis of snoRNAassociation with pre-ribosomes and release of snR30by Rok1helicase.EMBO Rep,9, 1230–1236.25.Hertel,J.,de Jong, D.,Marz,M.,Rose,D.,Tafer,H.,Tanzer, A.,Schierwater,B.,and Stadler,P.F.(2009)Non-codingRNA annotation of the genome of Tri-choplax adhaerens.Nucleic Acids Res,37, 1602–1615.26.Kim,M.,Patel,B.,Schroeder,K.E.,Raza,A.,and Dejong,J.(2008)Organization andtranscriptional output of a novel mRNA-like piRNA gene(mpiR)located on mouse chro-mosome10.RNA,14,1005–1011.27.Mishima,T.,Takizawa,T.,Luo,S.S.,Ishibashi,O.,Kawahigashi,Y.,Mizuguchi, Y.,Ishikawa,T.,Mori,M.,Kanda,T., and Goto,T.(2008)MicroRNA(miRNA) cloning analysis reveals sex differences in miRNA expression profiles between adult mouse testis and ovary.Reproduction,136, 811–822.28.Papaioannou,M.D.,Pitetti,J.L.,Ro,S.,Park, C.,Aubry, F.,Schaad,O.,Vejnar,C.E.,Kuhne, F.,Descombes,P.,Zdob-nov, E.M.,McManus,M.T.,Guillou, F., Harfe,B.D.,Yan,W.,Jegou,B.,and Nef, S.(2009)Sertoli cell Dicer is essential for spermatogenesis in mice.Dev Biol,326, 250–259.29.Ro,S.,Park,C.,Sanders,K.M.,McCarrey,J.R.,and Yan,W.(2007)Cloning and expres-sion profiling of testis-expressed microRNAs.Dev Biol,311,592–602.30.Ro,S.,Park,C.,Song,R.,Nguyen,D.,Jin,J.,Sanders,K.M.,McCarrey,J.R.,and Yan, W.(2007)Cloning and expression profiling of testis-expressed piRNA-like RNAs.RNA, 13,1693–1702.31.Ro,S.,Park,C.,Young,D.,Sanders,K.M.,and Yan,W.(2007)Tissue-dependent paired expression of miRNAs.Nucleic Acids Res, 35,5944–5953.32.Siebolts,U.,Varnholt,H.,Drebber,U.,Dienes,H.P.,Wickenhauser,C.,and Oden-thal,M.(2009)Tissues from routine pathol-ogy archives are suitable for microRNA anal-yses by quantitative PCR.J Clin Pathol,62, 84–88.33.Smits,G.,Mungall,A.J.,Griffiths-Jones,S.,Smith,P.,Beury,D.,Matthews,L.,Rogers, J.,Pask, A.J.,Shaw,G.,VandeBerg,J.L., McCarrey,J.R.,Renfree,M.B.,Reik,W.,and Dunham,I.(2008)Conservation of the H19 noncoding RNA and H19-IGF2imprint-ing mechanism in therians.Nat Genet,40, 971–976.34.Song,R.,Ro,S.,Michaels,J.D.,Park,C.,McCarrey,J.R.,and Yan,W.(2009)Many X-linked microRNAs escape meiotic sex chromosome inactivation.Nat Genet,41, 488–493.Quantitative Analysis of Small RNAs30535.Wang,W.X.,Wilfred,B.R.,Baldwin,D.A.,Isett,R.B.,Ren,N.,Stromberg, A.,and Nelson,P.T.(2008)Focus on RNA iso-lation:obtaining RNA for microRNA (miRNA)expression profiling analyses of neural tissue.Biochim Biophys Acta,1779, 749–757.36.Wu,F.,Zikusoka,M.,Trindade,A.,Das-sopoulos,T.,Harris,M.L.,Bayless,T.M., Brant,S.R.,Chakravarti,S.,and Kwon, J.H.(2008)MicroRNAs are differen-tially expressed in ulcerative colitis and alter expression of macrophage inflam-matory peptide-2alpha.Gastroenterology, 135(1624–1635),e24.37.Wu,H.,Neilson,J.R.,Kumar,P.,Manocha,M.,Shankar,P.,Sharp,P.A.,and Manjunath, N.(2007)miRNA profiling of naive,effec-tor and memory CD8T cells.PLoS ONE,2, e1020.38.Yan,W.,Morozumi,K.,Zhang,J.,Ro,S.,Park, C.,and Yanagimachi,R.(2008) Birth of mice after intracytoplasmic injec-tion of single purified sperm nuclei and detection of messenger RNAs and microR-NAs in the sperm nuclei.Biol Reprod,78, 896–902.39.Guryev,V.and Cuppen,E.(2009)Next-generation sequencing approaches in genetic rodent model systems to study func-tional effects of human genetic variation.FEBS Lett.40.Li,W.and Ruan,K.(2009)MicroRNAdetection by microarray.Anal Bioanal Chem.41.Ro,S.,Park,C.,Jin,JL.,Sanders,KM.,andYan,W.(2006)A PCR-based method for detection and quantification of small RNAs.Biochem and Biophys Res Commun,351, 756–763.。
生物英文文献.pdf
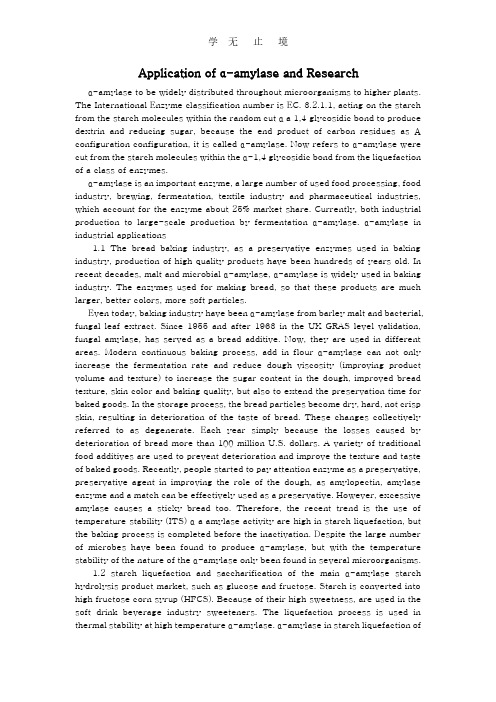
Application of α-amylase and Researchα-amylase to be widely distributed throughout microorganisms to higher plants. The International Enzyme classification number is EC. 3.2.1.1, acting on the starch from the starch molecules within the random cut α a 1,4 glycosidic bond to produce dextrin and reducing sugar, because the end product of carbon residues as Α configuration configuration, it is called α-amylase. Now refers to α-amylase were cut from the starch molecules within the α-1,4 glycosidic bond from the liquefaction of a class of enzymes.α-amylase is an important enzyme, a large number of used food processing, food industry, brewing, fermentation, textile industry and pharmaceutical industries, which account for the enzyme about 25% market share. Currently, both industrial production to large-scale production by fermentation α-amylase. α-amylase in industrial applications1.1 The bread baking industry, as a preservative enzymes used in baking industry, production of high quality products have been hundreds of years old. In recent decades, malt and microbial α-amylase, α-amylase is widely used in baking industry. The enzymes used for making bread, so that these products are much larger, better colors, more soft particles.Even today, baking industry have been α-amylase from barley malt and bacterial, fungal leaf extract. Since 1955 and after 1963 in the UK GRAS level validation, fungal amylase, has served as a bread additive. Now, they are used in different areas. Modern continuous baking process, add in f lour α-amylase can not only increase the fermentation rate and reduce dough viscosity (improving product volume and texture) to increase the sugar content in the dough, improved bread texture, skin color and baking quality, but also to extend the preservation time for baked goods. In the storage process, the bread particles become dry, hard, not crisp skin, resulting in deterioration of the taste of bread. These changes collectively referred to as degenerate. Each year simply because the losses caused by deterioration of bread more than 100 million U.S. dollars. A variety of traditional food additives are used to prevent deterioration and improve the texture and taste of baked goods. Recently, people started to pay attention enzyme as a preservative, preservative agent in improving the role of the dough, as amylopectin, amylase enzyme and a match can be effectively used as a preservative. However, excessive amylase causes a sticky bread too. Therefore, the recent trend is the use of temperature stability (ITS) α a amylase activity are high in starch liquefaction, but the baking process is completed before the inactivation. Despite the large number of microbes have been found to produce α-amylase, but with the temperature stability of the nature of the α-amylase only been found in several microorganisms.1.2 starch liquefaction and saccharification of the main α-amylase starch hydrolysis product market, such as glucose and fructose. Starch is converted into high fructose corn syrup (HFCS). Because of their high sweetness, are used in the soft drink beverage industry sweeteners. The liquefaction process is used in thermal stability at high temperature α-amylase. α-amylase in starch liquefaction ofthe application process is already quite mature, and many relevant reports.1.3 fiber desizing modern fiber manufacturing process in knitting yarn in the process will produce large amounts of bacteria, to prevent these yarn faults, often increase in the surface layer of the yarn can remove the protective layer. The surface layer of the material there are many, starch is a very good choice because it is cheap and easy to obtain, and can be easily removed. Starch desizing α-amylase can be used, it can selectively remove the starch without harming the yarn fibers, but also random degradation of starch dextrin soluble in water, and are easily washed off. 1.4 Paper Industry amylase used in the paper industry mainly to improve the paper coating starch. Paste on the paper is primarily to protect the paper in the process from mechanical damage, it also improved the quality of finished paper. Paste to improve the hardness and strength of paper, enhanced erasable paper, and is a good paper coating. When the paper through two rolls, the starch slurry is added the paper. The process temperature was controlled at 45 ~ 6O ℃, need a stable viscosity of starch. Grinding can also be controlled according to different grades of paper starch viscosity. Nature of the starch concentration is too high for the sizing of paper, you can use part of α-amylase degradation of starch to adjust.1.5 Application of detergents in the enzyme is a component of modern high-efficiency detergents. Enzymes in detergents in the most important function is to make detergents more modest sound. Automatic dishwasher detergents early is very rough, easy to eat when the body hurts, and on ceramics, wood tableware can also cause damage. α-amylase was used from 1975 to washing powder. Now, 90% of the liquid detergents contain an amylase, and automatic dishwasher detergents α-amylase on demand is also growing. α 1 amylase ca2 + is too sensitive to low ca2 + in the stability of poor environment, which limits an amylase in the remover in. And, most of the wild-type strains produced an amylase on raw materials as one of the oxidants detergents are too sensitive. Keep household detergents, this limitation by increasing the number of process steps can be improved. Recently, two major manufacturers of detergents NovozymesandGcncncoreInternational enzyme protein technology has been used to improve the stability of amylase bleaching. They leucine substitution of Bacillus licheniformis α-amylase protein in the first 197 on the methionine, resulting in enzymes of the oxidant component of resistance increased greatly enhanced the oxidation stability of the enzyme stability during storage better. The two companies have been pushing in the market these new products.1.6 Pharmaceutical and clinical chemical analysis with the continuous development of biological engineering, the application of amylase involved in many other areas, such as clinical, pharmaceutical and analytical chemistry. Have been reported, based on the liquid α-amylase stability of reagents have been applied to automatic biochemical analyzer (CibaComingExpress) clinical chemistry system. Amylase has been established by means of a method of detecting a higher content of oligosaccharides, is said this method is more than the effective detection method of silver nitrate.2.1 Research amylase α-amylase enzymes in domestic production and application in 1965, China began to apply for a 7658 BF Bacillus amyloliquefaciens amylase production of one, when only exclusive manufacturing plant in Wuxi Enzyme. 1967 Hangzhou Yi sugar to achieve the application of α-amylase production of caramel new technology can save 7% ~ 10% malt, sugar, increase the rate of 10%.1964, China began a process of enzymatic hydrolysis of starch production of glucose. In September l979 injection of glucose by the enzyme and identification of new technology and worked in North China Pharmaceutical Factory, Hebei Dongfeng Pharmaceutical Factory, Zhengzhou Songshan applied pharmaceutical units and achieved good economic benefits. Compared with the traditional acid to improve the yield of 10% Oh, cost more than 15%. In addition to enzyme for citric acid production in China, glutamic acid fermentation system for beer saccharification, fermentation, rice wine, soy sauce manufacture, vinegar production also has been studied and put into production successfully.2.2 Overseas Researc h α-amylase, present, and in addition a large number of T for conventional mutation breeding, the overseas production has been initially figure out the regulation of α-amylase gene, the transduction of the transformation and gene cloning techniques such as breeding. The Bacillus subtilis recombinant gene into the production strain to increase α-amylase yield of 7 to 10 times and has been used in food and the wine industry, for breeding high-yield strains of α-amylase to create a new way.2.3 domestic and foreign research institutions and major research direction as α-amylase is an important value of industrial enzymes, weekly discussion group and outside it was a lot of research. Representative of the domestic units: Sichuan University, major research produc tion of α-amylase strains and culture conditions; Jiangnan University, the main research structure of α-amylase and application performance, such as heat resistance, acid resistance; Northwest universities, major research denatured α-amylase and the environment on the mechanism of α-amylase; South China University of Technology, the main α-amylase of immobilization and dynamic nature; there Huazhong Agricultural University, Chinese Academy of Sciences Institute of Applied Ecology in Shenyang, Tianjin University, Nankai University, College of Life Sciences, Chinese Academy of Agricultural Sciences, Chinese Academy of Sciences Institute of Microbiology and a number of research institutions on a variety of bacterial α-amylase production of a amylase gene cloning and expression. Representative of foreign research units are: Canada UniversityofBritishColumbia, they were a pancreatic amylase structure and mechanism of in-depth research; Denmark's Carlsberg Research Laboratory of the main structure of barley α-amylase domain and binding sites; U.S. WesternRegionalResearchCenter major study α-amylase in barley and the role of antibiotics and the barley α-amylase active site.3, α-amylase conclusion has become the industrial application of one of the most important enzymes, and a large number of micro-organisms can be used for efficient production of amylase, but large-scale commercial production of the enzyme is still limited to some specific fungi and bacteria. For the effective demandfor α-amylase more and more, this enzyme by chemical modification of existing or improved technology through the white matter are. Benefit from the development of modern biotechnology, α an amylase in the pharmaceutical aspects of growing importance. Of course, the food and starch indust ries is still the main market, α amylase in these areas, a demand is still the largest.Journal of Southeast University(English Edition)2008 24(4)。
中学生物 实验教学 英文文献

中学生物实验教学英文文献一、绪论1.1 研究背景随着教学理念的不断更新和发展,实验教学在中学生物教育中起着越来越重要的作用。
实验教学能够帮助学生巩固所学知识,培养实验操作技能,提高学生的科学素养和动手能力。
在这一背景下,越来越多的研究开始关注中学生物实验教学,以探讨如何更好地进行实验教学,提高教学效果。
1.2 研究意义通过对英文文献的调研,可以了解国外在中学生物实验教学方面的最新研究动态,为我国中学生物实验教学提供借鉴和参考。
可以通过对比分析国内外的研究成果,找出中学生物实验教学的薄弱环节,指导我国中学生物实验教学的改进和完善。
二、中学生物实验教学英文文献调研结果2.1 实验教学设计通过对英文文献的调研,发现国外研究者在中学生物实验教学设计方面有着丰富的经验和成果。
他们注重实验教学的设计合理性和科学性,通过设置不同类型的实验,激发学生的学习兴趣,激活学习动力,提高学生的实验技能和实验能力。
2.2 实验教学方法另外,英文文献中也提到了国外在中学生物实验教学方法上的创新和改革。
他们注重通过多元化的实验教学方法,如课堂讨论、小组合作、实验研究等,促进学生自主探究和合作学习,提高学生的探究精神和实验技能。
2.3 实验教学评价英文文献还对国外在中学生物实验教学评价方面的研究成果进行了总结和归纳。
他们倡导运用多元化的评价方法,如实验报告、实验成绩、实验表现、实验心得等,全面客观地评价学生的实验能力和实验素养。
三、中学生物实验教学英文文献研究存在的问题3.1 研究热点不明显尽管国外在中学生物实验教学方面有着不少的研究成果,但是整体而言,研究热点不够突出,缺乏前沿性和创新性。
目前国外的研究多集中在实验教学设计、实验教学方法和实验教学评价等方面,缺乏对实验教学理论和实践的深入探讨和研究。
3.2 实验教学成果转化率低国外的研究成果在实践中的转化率并不高。
由于文化和教育体系的差异,一些国外的实验教学理论和方法并不完全适用于我国的中学生物实验教学。
微生物英文文献翻译 嗜线虫沙雷氏菌

昆虫病原线虫共生嗜线虫沙雷氏菌的基因组测序摘要嗜线虫沙雷氏菌,编号21420T(=CGMCC 1.6853T,DZ0503SBS1T),不属于昆虫病原线虫崇明拟异小杆线虫肠杆菌属,具有共生体与治病菌体两种生命周期,与昆虫病原线虫和害虫有多方面的关系。
为了更好得理解沙雷氏菌种这个罕见的特征,我们在这呈现嗜线虫沙雷氏菌21420T的基因组序列,第一个这个物种的基因组序列具有重大意义。
关键词嗜线虫沙雷氏菌共生体单分子实时测序完整基因组嗜线虫沙雷氏菌、编号21420T(=CGMCC1.6853T,DZ0503SBS1T),隶属于肠杆菌科,是一种革兰氏阴性、非孢子生、短杆型的运动型细菌。
作为最具代表性的粘质沙雷氏菌的沙雷氏菌属,观察到这种菌种能被红色素染色(Zhang et。
,2009)。
编号21420T的菌种本来不属于昆虫病原线虫崇明拟异小杆线虫肠杆菌属,是一个新物种。
报告指出,21420T是重要的共生生物,当线虫寄生于目标昆虫时能让线虫生存生长。
与其他沙雷氏菌属物种相比,这种罕见的共生效应已被称作为这种拥有荧光能力的菌种21420T的重要特点。
(Zhang et al.,2008)。
发光杆菌属和异短杆菌属的成员分别与线虫中的异小杆线虫属或斯氏线虫属具有典型的内共生关系。
这些细菌具有相似的生命周期即包括两个明显的角色:昆虫病原体和线虫共生体,并拥有两个不同的调节系统(查斯顿et al.,2011、古德里奇·布莱尔和克拉克,2007)。
在沙雷氏菌属中,一些物种在昆虫寄主中表现出致死效应(莱斯et al.,2002,努涅斯·瓦尔迪兹et al.,2008,帕蒂尔et al.,2011和坦et al.,2006)。
然而,已知的只有很少数成功案例能佐证这些细菌与昆虫病原线虫的共生关系当这些线虫寄生于无脊椎寄主上。
(彼得森和蒂萨,2012、托雷斯·巴拉甘et al.,2011)。
报道称嗜线虫沙雷氏菌21420T与昆虫寄主有同步的死亡率以及其与线虫具有共生关系(Zang et al.,2009)。
微生物英文文献及翻译—原文
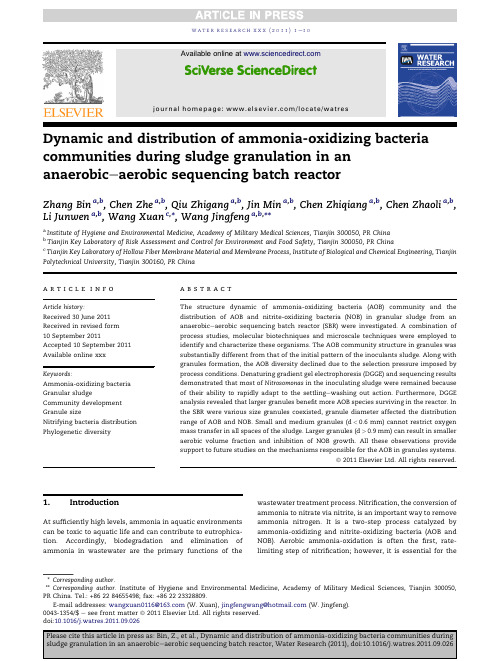
Dynamic and distribution of ammonia-oxidizing bacteria communities during sludge granulation in an anaerobic e aerobic sequencing batch reactorZhang Bin a ,b ,Chen Zhe a ,b ,Qiu Zhigang a ,b ,Jin Min a ,b ,Chen Zhiqiang a ,b ,Chen Zhaoli a ,b ,Li Junwen a ,b ,Wang Xuan c ,*,Wang Jingfeng a ,b ,**aInstitute of Hygiene and Environmental Medicine,Academy of Military Medical Sciences,Tianjin 300050,PR China bTianjin Key Laboratory of Risk Assessment and Control for Environment and Food Safety,Tianjin 300050,PR China cTianjin Key Laboratory of Hollow Fiber Membrane Material and Membrane Process,Institute of Biological and Chemical Engineering,Tianjin Polytechnical University,Tianjin 300160,PR Chinaa r t i c l e i n f oArticle history:Received 30June 2011Received in revised form 10September 2011Accepted 10September 2011Available online xxx Keywords:Ammonia-oxidizing bacteria Granular sludgeCommunity development Granule sizeNitrifying bacteria distribution Phylogenetic diversitya b s t r a c tThe structure dynamic of ammonia-oxidizing bacteria (AOB)community and the distribution of AOB and nitrite-oxidizing bacteria (NOB)in granular sludge from an anaerobic e aerobic sequencing batch reactor (SBR)were investigated.A combination of process studies,molecular biotechniques and microscale techniques were employed to identify and characterize these organisms.The AOB community structure in granules was substantially different from that of the initial pattern of the inoculants sludge.Along with granules formation,the AOB diversity declined due to the selection pressure imposed by process conditions.Denaturing gradient gel electrophoresis (DGGE)and sequencing results demonstrated that most of Nitrosomonas in the inoculating sludge were remained because of their ability to rapidly adapt to the settling e washing out action.Furthermore,DGGE analysis revealed that larger granules benefit more AOB species surviving in the reactor.In the SBR were various size granules coexisted,granule diameter affected the distribution range of AOB and NOB.Small and medium granules (d <0.6mm)cannot restrict oxygen mass transfer in all spaces of the rger granules (d >0.9mm)can result in smaller aerobic volume fraction and inhibition of NOB growth.All these observations provide support to future studies on the mechanisms responsible for the AOB in granules systems.ª2011Elsevier Ltd.All rights reserved.1.IntroductionAt sufficiently high levels,ammonia in aquatic environments can be toxic to aquatic life and can contribute to eutrophica-tion.Accordingly,biodegradation and elimination of ammonia in wastewater are the primary functions of thewastewater treatment process.Nitrification,the conversion of ammonia to nitrate via nitrite,is an important way to remove ammonia nitrogen.It is a two-step process catalyzed by ammonia-oxidizing and nitrite-oxidizing bacteria (AOB and NOB).Aerobic ammonia-oxidation is often the first,rate-limiting step of nitrification;however,it is essential for the*Corresponding author .**Corresponding author.Institute of Hygiene and Environmental Medicine,Academy of Military Medical Sciences,Tianjin 300050,PR China.Tel.:+862284655498;fax:+862223328809.E-mail addresses:wangxuan0116@ (W.Xuan),jingfengwang@ (W.Jingfeng).Available online atjournal homepage:/locate/watresw a t e r r e s e a r c h x x x (2011)1e 100043-1354/$e see front matter ª2011Elsevier Ltd.All rights reserved.doi:10.1016/j.watres.2011.09.026removal of ammonia from the wastewater(Prosser and Nicol, 2008).Comparative analyses of16S rRNA sequences have revealed that most AOB in activated sludge are phylogeneti-cally closely related to the clade of b-Proteobacteria (Kowalchuk and Stephen,2001).However,a number of studies have suggested that there are physiological and ecological differences between different AOB genera and lineages,and that environmental factors such as process parameter,dis-solved oxygen,salinity,pH,and concentrations of free ammonia can impact certain species of AOB(Erguder et al., 2008;Kim et al.,2006;Koops and Pommerening-Ro¨ser,2001; Kowalchuk and Stephen,2001;Shi et al.,2010).Therefore, the physiological activity and abundance of AOB in waste-water processing is critical in the design and operation of waste treatment systems.For this reason,a better under-standing of the ecology and microbiology of AOB in waste-water treatment systems is necessary to enhance treatment performance.Recently,several developed techniques have served as valuable tools for the characterization of microbial diversity in biological wastewater treatment systems(Li et al., 2008;Yin and Xu,2009).Currently,the application of molec-ular biotechniques can provide clarification of the ammonia-oxidizing community in detail(Haseborg et al.,2010;Tawan et al.,2005;Vlaeminck et al.,2010).In recent years,the aerobic granular sludge process has become an attractive alternative to conventional processes for wastewater treatment mainly due to its cell immobilization strategy(de Bruin et al.,2004;Liu et al.,2009;Schwarzenbeck et al.,2005;Schwarzenbeck et al.,2004a,b;Xavier et al.,2007). Granules have a more tightly compact structure(Li et al.,2008; Liu and Tay,2008;Wang et al.,2004)and rapid settling velocity (Kong et al.,2009;Lemaire et al.,2008).Therefore,granular sludge systems have a higher mixed liquid suspended sludge (MLSS)concentration and longer solid retention times(SRT) than conventional activated sludge systems.Longer SRT can provide enough time for the growth of organisms that require a long generation time(e.g.,AOB).Some studies have indicated that nitrifying granules can be cultivated with ammonia-rich inorganic wastewater and the diameter of granules was small (Shi et al.,2010;Tsuneda et al.,2003).Other researchers reported that larger granules have been developed with the synthetic organic wastewater in sequencing batch reactors(SBRs)(Li et al., 2008;Liu and Tay,2008).The diverse populations of microor-ganisms that coexist in granules remove the chemical oxygen demand(COD),nitrogen and phosphate(de Kreuk et al.,2005). However,for larger granules with a particle diameter greater than0.6mm,an outer aerobic shell and an inner anaerobic zone coexist because of restricted oxygen diffusion to the granule core.These properties of granular sludge suggest that the inner environment of granules is unfavorable to AOB growth.Some research has shown that particle size and density induced the different distribution and dominance of AOB,NOB and anam-mox(Winkler et al.,2011b).Although a number of studies have been conducted to assess the ecology and microbiology of AOB in wastewater treatment systems,the information on the dynamics,distribution,and quantification of AOB communities during sludge granulation is still limited up to now.To address these concerns,the main objective of the present work was to investigate the population dynamics of AOB communities during the development of seedingflocs into granules,and the distribution of AOB and NOB in different size granules from an anaerobic e aerobic SBR.A combination of process studies,molecular biotechniques and microscale techniques were employed to identify and char-acterize these organisms.Based on these approaches,we demonstrate the differences in both AOB community evolu-tion and composition of theflocs and granules co-existing in the SBR and further elucidate the relationship between distribution of nitrifying bacteria and granule size.It is ex-pected that the work would be useful to better understand the mechanisms responsible for the AOB in granules and apply them for optimal control and management strategies of granulation systems.2.Material and methods2.1.Reactor set-up and operationThe granules were cultivated in a lab-scale SBR with an effective volume of4L.The effective diameter and height of the reactor was10cm and51cm,respectively.The hydraulic retention time was set at8h.Activated sludge from a full-scale sewage treat-ment plant(Jizhuangzi Sewage Treatment Works,Tianjin, China)was used as the seed sludge for the reactor at an initial sludge concentration of3876mg LÀ1in MLSS.The reactor was operated on6-h cycles,consisting of2-min influent feeding,90-min anaerobic phase(mixing),240-min aeration phase and5-min effluent discharge periods.The sludge settling time was reduced gradually from10to5min after80SBR cycles in20days, and only particles with a settling velocity higher than4.5m hÀ1 were retained in the reactor.The composition of the influent media were NaAc(450mg LÀ1),NH4Cl(100mg LÀ1),(NH4)2SO4 (10mg LÀ1),KH2PO4(20mg LÀ1),MgSO4$7H2O(50mg LÀ1),KCl (20mg LÀ1),CaCl2(20mg LÀ1),FeSO4$7H2O(1mg LÀ1),pH7.0e7.5, and0.1mL LÀ1trace element solution(Li et al.,2007).Analytical methods-The total organic carbon(TOC),NHþ4e N, NOÀ2e N,NOÀ3e N,total nitrogen(TN),total phosphate(TP) concentration,mixed liquid suspended solids(MLSS) concentration,and sludge volume index at10min(SVI10)were measured regularly according to the standard methods (APHA-AWWA-WEF,2005).Sludge size distribution was determined by the sieving method(Laguna et al.,1999).Screening was performed with four stainless steel sieves of5cm diameter having respective mesh openings of0.9,0.6,0.45,and0.2mm.A100mL volume of sludge from the reactor was sampled with a calibrated cylinder and then deposited on the0.9mm mesh sieve.The sample was subsequently washed with distilled water and particles less than0.9mm in diameter passed through this sieve to the sieves with smaller openings.The washing procedure was repeated several times to separate the gran-ules.The granules collected on the different screens were recovered by backwashing with distilled water.Each fraction was collected in a different beaker andfiltered on quantitative filter paper to determine the total suspended solid(TSS).Once the amount of total suspended solid(TSS)retained on each sieve was acquired,it was reasonable to determine for each class of size(<0.2,[0.2e0.45],[0.45e0.6],[0.6e0.9],>0.9mm) the percentage of the total weight that they represent.w a t e r r e s e a r c h x x x(2011)1e10 22.2.DNA extraction and nested PCR e DGGEThe sludge from approximately8mg of MLSS was transferred into a1.5-mL Eppendorf tube and then centrifuged at14,000g for10min.The supernatant was removed,and the pellet was added to1mL of sodium phosphate buffer solution and aseptically mixed with a sterilized pestle in order to detach granules.Genomic DNA was extracted from the pellets using E.Z.N.A.äSoil DNA kit(D5625-01,Omega Bio-tek Inc.,USA).To amplify ammonia-oxidizer specific16S rRNA for dena-turing gradient gel electrophoresis(DGGE),a nested PCR approach was performed as described previously(Zhang et al., 2010).30m l of nested PCR amplicons(with5m l6Âloading buffer)were loaded and separated by DGGE on polyacrylamide gels(8%,37.5:1acrylamide e bisacrylamide)with a linear gradient of35%e55%denaturant(100%denaturant¼7M urea plus40%formamide).The gel was run for6.5h at140V in 1ÂTAE buffer(40mM Tris-acetate,20mM sodium acetate, 1mM Na2EDTA,pH7.4)maintained at60 C(DCodeäUniversal Mutation Detection System,Bio-Rad,Hercules,CA, USA).After electrophoresis,silver-staining and development of the gels were performed as described by Sanguinetti et al. (1994).These were followed by air-drying and scanning with a gel imaging analysis system(Image Quant350,GE Inc.,USA). The gel images were analyzed with the software Quantity One,version4.31(Bio-rad).Dice index(Cs)of pair wise community similarity was calculated to evaluate the similarity of the AOB community among DGGE lanes(LaPara et al.,2002).This index ranges from0%(no common band)to100%(identical band patterns) with the assistance of Quantity One.The Shannon diversity index(H)was used to measure the microbial diversity that takes into account the richness and proportion of each species in a population.H was calculatedusing the following equation:H¼ÀPn iNlogn iN,where n i/Nis the proportion of community made up by species i(bright-ness of the band i/total brightness of all bands in the lane).Dendrograms relating band pattern similarities were automatically calculated without band weighting(consider-ation of band density)by the unweighted pair group method with arithmetic mean(UPGMA)algorithms in the Quantity One software.Prominent DGGE bands were excised and dissolved in30m L Milli-Q water overnight,at4 C.DNA was recovered from the gel by freeze e thawing thrice.Cloning and sequencing of the target DNA fragments were conducted following the estab-lished method(Zhang et al.,2010).2.3.Distribution of nitrifying bacteriaThree classes of size([0.2e0.45],[0.45e0.6],>0.9mm)were chosen on day180for FISH analysis in order to investigate the spatial distribution characteristics of AOB and NOB in granules.2mg sludge samples werefixed in4%para-formaldehyde solution for16e24h at4 C and then washed twice with sodium phosphate buffer;the samples were dehydrated in50%,80%and100%ethanol for10min each. Ethanol in the granules was then completely replaced by xylene by serial immersion in ethanol-xylene solutions of3:1, 1:1,and1:3by volume andfinally in100%xylene,for10min periods at room temperature.Subsequently,the granules were embedded in paraffin(m.p.56e58 C)by serial immer-sion in1:1xylene-paraffin for30min at60 C,followed by 100%paraffin.After solidification in paraffin,8-m m-thick sections were prepared and placed on gelatin-coated micro-scopic slides.Paraffin was removed by immersing the slide in xylene and ethanol for30min each,followed by air-drying of the slides.The three oligonucleotide probes were used for hybridiza-tion(Downing and Nerenberg,2008):FITC-labeled Nso190, which targets the majority of AOB;TRITC-labeled NIT3,which targets Nitrobacter sp.;TRITC-labeled NSR1156,which targets Nitrospira sp.All probe sequences,their hybridization condi-tions,and washing conditions are given in Table1.Oligonu-cleotides were synthesized andfluorescently labeled with fluorochomes by Takara,Inc.(Dalian,China).Hybridizations were performed at46 C for2h with a hybridization buffer(0.9M NaCl,formamide at the percentage shown in Table1,20mM Tris/HCl,pH8.0,0.01% SDS)containing each labeled probe(5ng m LÀ1).After hybrid-ization,unbound oligonucleotides were removed by a strin-gent washing step at48 C for15min in washing buffer containing the same components as the hybridization buffer except for the probes.For detection of all DNA,4,6-diamidino-2-phenylindole (DAPI)was diluted with methanol to afinal concentration of1ng m LÀ1.Cover the slides with DAPI e methanol and incubate for15min at37 C.The slides were subsequently washed once with methanol,rinsed briefly with ddH2O and immediately air-dried.Vectashield(Vector Laboratories)was used to prevent photo bleaching.The hybridization images were captured using a confocal laser scanning microscope (CLSM,Zeiss710).A total of10images were captured for each probe at each class of size.The representative images were selected andfinal image evaluation was done in Adobe PhotoShop.w a t e r r e s e a r c h x x x(2011)1e1033.Results3.1.SBR performance and granule characteristicsDuring the startup period,the reactor removed TOC and NH 4þ-N efficiently.98%of NH 4þ-N and 100%of TOC were removed from the influent by day 3and day 5respectively (Figs.S2,S3,Supporting information ).Removal of TN and TP were lower during this period (Figs.S3,S4,Supporting information ),though the removal of TP gradually improved to 100%removal by day 33(Fig.S4,Supporting information ).To determine the sludge volume index of granular sludge,a settling time of 10min was chosen instead of 30min,because granular sludge has a similar SVI after 60min and after 5min of settling (Schwarzenbeck et al.,2004b ).The SVI 10of the inoculating sludge was 108.2mL g À1.The changing patterns of MLSS and SVI 10in the continuous operation of the SBR are illustrated in Fig.1.The sludge settleability increased markedly during the set-up period.Fig.2reflects the slow andgradual process of sludge granulation,i.e.,from flocculentsludge to granules.3.2.DGGE analysis:AOB communities structure changes during sludge granulationThe results of nested PCR were shown in Fig.S1.The well-resolved DGGE bands were obtained at the representative points throughout the GSBR operation and the patterns revealed that the structure of the AOB communities was dynamic during sludge granulation and stabilization (Fig.3).The community structure at the end of experiment was different from that of the initial pattern of the seed sludge.The AOB communities on day 1showed 40%similarity only to that at the end of the GSBR operation (Table S1,Supporting information ),indicating the considerable difference of AOB communities structures between inoculated sludge and granular sludge.Biodiversity based on the DGGE patterns was analyzed by calculating the Shannon diversity index H as204060801001201401254159738494104115125135147160172188Time (d)S V I 10 (m L .g -1)10002000300040005000600070008000900010000M L S S (m g .L -1)Fig.1e Change in biomass content and SVI 10during whole operation.SVI,sludge volume index;MLSS,mixed liquid suspendedsolids.Fig.2e Variation in granule size distribution in the sludge during operation.d,particle diameter;TSS,total suspended solids.w a t e r r e s e a r c h x x x (2011)1e 104shown in Fig.S5.In the phase of sludge inoculation (before day 38),H decreased remarkably (from 0.94to 0.75)due to the absence of some species in the reactor.Though several dominant species (bands2,7,10,11)in the inoculating sludge were preserved,many bands disappeared or weakened (bands 3,4,6,8,13,14,15).After day 45,the diversity index tended to be stable and showed small fluctuation (from 0.72to 0.82).Banding pattern similarity was analyzed by applying UPGMA (Fig.4)algorithms.The UPGMA analysis showed three groups with intragroup similarity at approximately 67%e 78%and intergroup similarity at 44e 62%.Generally,the clustering followed the time course;and the algorithms showed a closer clustering of groups II and III.In the analysis,group I was associated with sludge inoculation and washout,group IIwithFig.3e DGGE profile of the AOB communities in the SBR during the sludge granulation process (lane labels along the top show the sampling time (days)from startup of the bioreactor).The major bands were labeled with the numbers (bands 1e15).Fig.4e UPGMA analysis dendrograms of AOB community DGGE banding patterns,showing schematics of banding patterns.Roman numerals indicate major clusters.w a t e r r e s e a r c h x x x (2011)1e 105startup sludge granulation and decreasing SVI 10,and group III with a stable system and excellent biomass settleability.In Fig.3,the locations of the predominant bands were excised from the gel.DNA in these bands were reamplified,cloned and sequenced.The comparative analysis of these partial 16S rRNA sequences (Table 2and Fig.S6)revealed the phylogenetic affiliation of 13sequences retrieved.The majority of the bacteria in seed sludge grouped with members of Nitrosomonas and Nitrosospira .Along with sludge granula-tion,most of Nitrosomonas (Bands 2,5,7,9,10,11)were remained or eventually became dominant in GSBR;however,all of Nitrosospira (Bands 6,13,15)were gradually eliminated from the reactor.3.3.Distribution of AOB and NOB in different sized granulesFISH was performed on the granule sections mainly to deter-mine the location of AOB and NOB within the different size classes of granules,and the images were not further analyzed for quantification of cell counts.As shown in Fig.6,in small granules (0.2mm <d <0.45mm),AOB located mainly in the outer part of granular space,whereas NOB were detected only in the core of granules.In medium granules (0.45mm <d <0.6mm),AOB distributed evenly throughout the whole granular space,whereas NOB still existed in the inner part.In the larger granules (d >0.9mm),AOB and NOB were mostly located in the surface area of the granules,and moreover,NOB became rare.4.Discussion4.1.Relationship between granule formation and reactor performanceAfter day 32,the SVI 10stabilized at 20e 35mL g À1,which is very low compared to the values measured for activated sludge (100e 150mL g À1).However,the size distribution of the granules measured on day 32(Fig.2)indicated that only 22%of the biomass was made of granular sludge with diameter largerthan 0.2mm.These results suggest that sludge settleability increased prior to granule formation and was not affected by different particle sizes in the sludge during the GSBR operation.It was observed,however,that the diameter of the granules fluctuated over longer durations.The large granules tended to destabilize due to endogenous respiration,and broke into smaller granules that could seed the formation of large granules again.Pochana and Keller reported that physically broken sludge flocs contribute to lower denitrification rates,due to their reduced anoxic zone (Pochana and Keller,1999).Therefore,TN removal efficiency raises fluctuantly throughout the experiment.Some previous research had demonstrated that bigger,more dense granules favored the enrichment of PAO (Winkler et al.,2011a ).Hence,after day 77,removal efficiency of TP was higher and relatively stable because the granules mass fraction was over 90%and more larger granules formed.4.2.Relationship between AOB communities dynamic and sludge granulationFor granule formation,a short settling time was set,and only particles with a settling velocity higher than 4.5m h À1were retained in the reactor.Moreover,as shown in Fig.1,the variation in SVI 10was greater before day 41(from 108.2mL g À1e 34.1mL g À1).During this phase,large amounts of biomass could not survive in the reactor.A clear shift in pop-ulations was evident,with 58%similarity between days 8and 18(Table S1).In the SBR system fed with acetate-based synthetic wastewater,heterotrophic bacteria can produce much larger amounts of extracellular polysaccharides than autotrophic bacteria (Tsuneda et al.,2003).Some researchers found that microorganisms in high shear environments adhered by extracellular polymeric substances (EPS)to resist the damage of suspended cells by environmental forces (Trinet et al.,1991).Additionally,it had been proved that the dominant heterotrophic species in the inoculating sludge were preserved throughout the process in our previous research (Zhang et al.,2011).It is well known that AOB are chemoau-totrophic and slow-growing;accordingly,numerous AOBw a t e r r e s e a r c h x x x (2011)1e 106populations that cannot become big and dense enough to settle fast were washed out from the system.As a result,the variation in AOB was remarkable in the period of sludge inoculation,and the diversity index of population decreased rapidly.After day 45,AOB communities’structure became stable due to the improvement of sludge settleability and the retention of more biomass.These results suggest that the short settling time (selection pressure)apparently stressed the biomass,leading to a violent dynamic of AOB communities.Further,these results suggest that certain populations may have been responsible for the operational success of the GSBR and were able to persist despite the large fluctuations in pop-ulation similarity.This bacterial population instability,coupled with a generally acceptable bioreactor performance,is congruent with the results obtained from a membrane biore-actor (MBR)for graywater treatment (Stamper et al.,2003).Nitrosomonas e like and Nitrosospira e like populations are the dominant AOB populations in wastewater treatment systems (Kowalchuk and Stephen,2001).A few previous studies revealed that the predominant populations in AOB communities are different in various wastewater treatment processes (Tawan et al.,2005;Thomas et al.,2010).Some researchers found that the community was dominated by AOB from the genus Nitrosospira in MBRs (Zhang et al.,2010),whereas Nitrosomonas sp.is the predominant population in biofilter sludge (Yin and Xu,2009).In the currentstudy,Fig.5e DGGE profile of the AOB communities in different size of granules (lane labels along the top show the range of particle diameter (d,mm)).Values along the bottom indicate the Shannon diversity index (H ).Bands labeled with the numbers were consistent with the bands in Fig.3.w a t e r r e s e a r c h x x x (2011)1e 107sequence analysis revealed that selection pressure evidently effect on the survival of Nitrosospira in granular sludge.Almost all of Nitrosospira were washed out initially and had no chance to evolve with the environmental changes.However,some members of Nitrosomonas sp.have been shown to produce more amounts of EPS than Nitrosospira ,especially under limited ammonia conditions (Stehr et al.,1995);and this feature has also been observed for other members of the same lineage.Accordingly,these EPS are helpful to communicate cells with each other and granulate sludge (Adav et al.,2008).Therefore,most of Nitrosomonas could adapt to this challenge (to become big and dense enough to settle fast)and were retained in the reactor.At the end of reactor operation (day 180),granules with different particle size were sieved.The effects of variation in granules size on the composition of the AOBcommunitiesFig.6e Micrographs of FISH performed on three size classes of granule sections.DAPI stain micrographs (A,D,G);AOB appear as green fluorescence (B,E,H),and NOB appear as red fluorescence (C,F,I).Bar [100m m in (A)e (C)and (G)e (I).d,particle diameter.(For interpretation of the references to colour in this figure legend,the reader is referred to the web version of this article.)w a t e r r e s e a r c h x x x (2011)1e 108were investigated.As shown in Fig.5,AOB communities structures in different size of granules were varied.Although several predominant bands(bands2,5,11)were present in all samples,only bands3and6appeared in the granules with diameters larger than0.6mm.Additionally,bands7and10 were intense in the granules larger than0.45mm.According to Table2,it can be clearly indicated that Nitrosospira could be retained merely in the granules larger than0.6mm.Therefore, Nitrosospira was not present at a high level in Fig.3due to the lower proportion of larger granules(d>0.6mm)in TSS along with reactor operation.DGGE analysis also revealed that larger granules had a greater microbial diversity than smaller ones. This result also demonstrates that more organisms can survive in larger granules as a result of more space,which can provide the suitable environment for the growth of microbes(Fig.6).4.3.Effect of variance in particle size on the distribution of AOB and NOB in granulesAlthough an influence of granule size has been observed in experiments and simulations for simultaneous N-and P-removal(de Kreuk et al.,2007),the effect of granule size on the distribution of different biomass species need be revealed further with the assistance of visible experimental results, especially in the same granular sludge reactors.Related studies on the diversity of bacterial communities in granular sludge often focus on the distribution of important functional bacteria populations in single-size granules(Matsumoto et al., 2010).In the present study,different size granules were sieved,and the distribution patterns of AOB and NOB were explored.In the nitrification processes considered,AOB and NOB compete for space and oxygen in the granules(Volcke et al.,2010).Since ammonium oxidizers have a higheroxygen affinity(K AOBO2<K NOBO2)and accumulate more rapidly inthe reactor than nitrite oxidizers(Volcke et al.,2010),NOB are located just below the layer of AOB,where still some oxygen is present and allows ready access to the nitrite produced.In smaller granules,the location boundaries of the both biomass species were distinct due to the limited existence space provided by granules for both microorganism’s growth.AOB exist outside of the granules where oxygen and ammonia are present.Medium granules can provide broader space for microbe multiplying;accordingly,AOB spread out in the whole granules.This result also confirms that oxygen could penetrate deep into the granule’s core without restriction when particle diameter is less than0.6mm.Some mathematic model also supposed that NOBs are favored to grow in smaller granules because of the higher fractional aerobic volume (Volcke et al.,2010).As shown in the results of the batch experiments(Zhang et al.,2011),nitrite accumulation temporarily occurred,accompanied by the more large gran-ules(d>0.9mm)forming.This phenomenon can be attrib-uted to the increased ammonium surface load associated with larger granules and smaller aerobic volume fraction,resulting in outcompetes of NOB.It also suggests that the core areas of large granules(d>0.9mm)could provide anoxic environment for the growth of anaerobic denitrificans(such as Tb.deni-trificans or Tb.thioparus in Fig.S7,Supporting information).As shown in Fig.2and Fig.S3,the removal efficiency of total nitrogen increased with formation of larger granules.5.ConclusionsThe variation in AOB communities’structure was remarkable during sludge inoculation,and the diversity index of pop-ulation decreased rapidly.Most of Nitrosomonas in the inocu-lating sludge were retained because of their capability to rapidly adapt to the settling e washing out action.DGGE anal-ysis also revealed that larger granules had greater AOB diversity than that of smaller ones.Oxygen penetration was not restricted in the granules of less than0.6mm particle diameter.However,the larger granules(d>0.9mm)can result in the smaller aerobic volume fraction and inhibition of NOB growth.Henceforth,further studies on controlling and opti-mizing distribution of granule size could be beneficial to the nitrogen removal and expansive application of granular sludge technology.AcknowledgmentsThis work was supported by grants from the National Natural Science Foundation of China(No.51108456,50908227)and the National High Technology Research and Development Program of China(No.2009AA06Z312).Appendix.Supplementary dataSupplementary data associated with this article can be found in online version at doi:10.1016/j.watres.2011.09.026.r e f e r e n c e sAdav,S.S.,Lee, D.J.,Show,K.Y.,2008.Aerobic granular sludge:recent advances.Biotechnology Advances26,411e423.APHA-AWWA-WEF,2005.Standard Methods for the Examination of Water and Wastewater,first ed.American Public Health Association/American Water Works Association/WaterEnvironment Federation,Washington,DC.de Bruin,L.M.,de Kreuk,M.,van der Roest,H.F.,Uijterlinde,C., van Loosdrecht,M.C.M.,2004.Aerobic granular sludgetechnology:an alternative to activated sludge?Water Science and Technology49,1e7.de Kreuk,M.,Heijnen,J.J.,van Loosdrecht,M.C.M.,2005.Simultaneous COD,nitrogen,and phosphate removal byaerobic granular sludge.Biotechnology and Bioengineering90, 761e769.de Kreuk,M.,Picioreanu,C.,Hosseini,M.,Xavier,J.B.,van Loosdrecht,M.C.M.,2007.Kinetic model of a granular sludge SBR:influences on nutrient removal.Biotechnology andBioengineering97,801e815.Downing,L.S.,Nerenberg,R.,2008.Total nitrogen removal ina hybrid,membrane-aerated activated sludge process.WaterResearch42,3697e3708.Erguder,T.H.,Boon,N.,Vlaeminck,S.E.,Verstraete,W.,2008.Partial nitrification achieved by pulse sulfide doses ina sequential batch reactor.Environmental Science andTechnology42,8715e8720.w a t e r r e s e a r c h x x x(2011)1e109。
PNAS生物英文文献分享
Methods
Patient Behavior and Voxel-Based Morphometry Analyses.
Electrophysiological Recordings Behavior Tests In Vivo Imaging Quantifying Microglial Chemotaxis. Blood and Spleen Cell Harvest. Isolation of Microglia from Adult Mouse Brain. Quantitative Real-Time PCR. Primary Mouse Microglia ProteinExtractionandELISAs Immunohistochemistry. NF-κB Reporter Assay. Statistical Analysis.
Microglial NFκB-TNFα hyperactivation induces obsessive–compulsive behavior in mouse models of progranulin-deficient frontotemporal dementia
Reporter:
Background
理毛行为(grooming behavior) 是指动物个体对其本身或对同种其他个体身体表面(毛发、皮肤或羽毛) 各
种形式的照看和关注,包括对身体表面有条理的梳理,有时也用嘴唇和舌头舔毛发和皮肤。在此基础上,Pérez et al . 提出理毛行为是通过观察或接触对身体表面的一个或多个位点近距离探查,同时分开毛发捡出盐粒和皮肤寄 生物,这一定义被多数学者广泛接受。 理毛行为可分为:自我理毛(autogrooming) 和相互理毛(allogrooming),自我理毛(autogrooming) 多用于研 究抑郁、焦虑、恐惧或躯体不适对个体行为的影响;相互理毛除对上述问题研究外,还可观察动物的社会行为。
肠道微生物英文文献pig
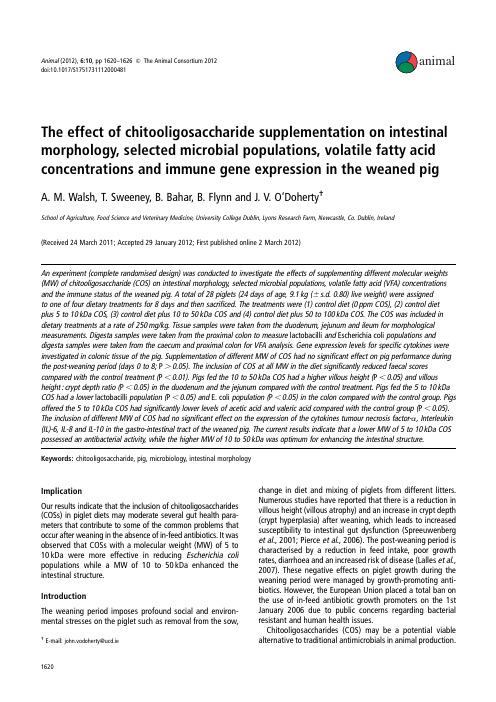
Animal(2012),6:10,pp1620–1626&The Animal Consortium2012doi:10.1017/S1751731112000481The effect of chitooligosaccharide supplementation on intestinal morphology,selected microbial populations,volatile fatty acid concentrations and immune gene expression in the weaned pig A.M.Walsh,T.Sweeney,B.Bahar,B.Flynn and J.V.O’Doherty-School of Agriculture,Food Science and Veterinary Medicine,University College Dublin,Lyons Research Farm,Newcastle,Co.Dublin,Ireland(Received24March2011;Accepted29January2012;First published online2March2012)An experiment(complete randomised design)was conducted to investigate the effects of supplementing different molecular weights (MW)of chitooligosaccharide(COS)on intestinal morphology,selected microbial populations,volatile fatty acid(VFA)concentrations and the immune status of the weaned pig.A total of28piglets(24days of age,9.1kg(6s.d.0.80)live weight)were assignedto one of four dietary treatments for8days and then sacrificed.The treatments were(1)control diet(0ppm COS),(2)control diet plus5to10kDa COS,(3)control diet plus10to50kDa COS and(4)control diet plus50to100kDa COS.The COS was included in dietary treatments at a rate of250mg/kg.Tissue samples were taken from the duodenum,jejunum and ileum for morphological measurements.Digesta samples were taken from the proximal colon to measure lactobacilli and Escherichia coli populations and digesta samples were taken from the caecum and proximal colon for VFA analysis.Gene expression levels for specific cytokines were investigated in colonic tissue of the pig.Supplementation of different MW of COS had no significant effect on pig performance during the post-weaning period(days0to8;P.0.05).The inclusion of COS at all MW in the diet significantly reduced faecal scores compared with the control treatment(P,0.01).Pigs fed the10to50kDa COS had a higher villous height(P,0.05)and villous height:crypt depth ratio(P,0.05)in the duodenum and the jejunum compared with the control treatment.Pigs fed the5to10kDa COS had a lower lactobacilli population(P,0.05)and E.coli population(P,0.05)in the colon compared with the control group.Pigs offered the5to10kDa COS had significantly lower levels of acetic acid and valeric acid compared with the control group(P,0.05). The inclusion of different MW of COS had no significant effect on the expression of the cytokines tumour necrosis factor-a,Interleukin (IL)-6,IL-8and IL-10in the gastro-intestinal tract of the weaned pig.The current results indicate that a lower MW of5to10kDa COS possessed an antibacterial activity,while the higher MW of10to50kDa was optimum for enhancing the intestinal structure. Keywords:chitooligosaccharide,pig,microbiology,intestinal morphologyImplicationOur results indicate that the inclusion of chitooligosaccharides (COSs)in piglet diets may moderate several gut health para-meters that contribute to some of the common problems that occur after weaning in the absence of in-feed antibiotics.It was observed that COSs with a molecular weight(MW)of5to 10kDa were more effective in reducing Escherichia coli populations while a MW of10to50kDa enhanced the intestinal structure.IntroductionThe weaning period imposes profound social and environ-mental stresses on the piglet such as removal from the sow,change in diet and mixing of piglets from different litters. Numerous studies have reported that there is a reduction in villous height(villous atrophy)and an increase in crypt depth (crypt hyperplasia)after weaning,which leads to increased susceptibility to intestinal gut dysfunction(Spreeuwenberg et al.,2001;Pierce et al.,2006).The post-weaning period is characterised by a reduction in feed intake,poor growth rates,diarrhoea and an increased risk of disease(Lalles et al., 2007).These negative effects on piglet growth during the weaning period were managed by growth-promoting anti-biotics.However,the European Union placed a total ban on the use of in-feed antibiotic growth promoters on the1st January2006due to public concerns regarding bacterial resistant and human health issues. Chitooligosaccharides(COS)may be a potential viable alternative to traditional antimicrobials in animal production.-E-mail:john.vodoherty@ucd.ie 1620Chitosan is a natural biopolymer derived by alkaline deacety-lation of chitin,which is the principal component of protective cuticles of crustaceans such as crabs,shrimps,prawns,lobsters and cell walls of some fungi such as aspergillus(Qin et al., 2006).Both chitin and chitosan are biopolymers composed of glucosamine and N-acetylated glucosamine(2-acetylamino-2-deoxy-D-glucopyranose)units linked by b(1to4)glycosidic bonds(Koide,1998).Low molecular weight(MW)COS is a water-soluble derivative of chitosan due to shorter chain lengths(Kim and Rajapakse,2005).Recently,both chitosan and its derivatives have generated considerable interest due to their biological activities,including antimicrobial,antitumour, immunoenhancing effects and the acceleration of wound healing(No et al.,2002;Liu et al.,2006)There is considerable variation in the literature on the biological properties of COS (Jeon et al.,2001;Liu et al.,2006).Most of this variation is partly due to the widely different MW used across studies.It is hypothesised that the biological properties of COS may be influenced by its MW and COS will enhance selected indices of health in weaned piglets.Material and methodsAll procedures described in this experiment were conducted under an experimental licence from the Irish Department of Health in accordance with the cruelty to Animals Act1876 and the European Communities(Amendments of the Cruelty to Animals Act1976)Regulations.Experimental dietsThe experiment was designed as a complete randomised block design and comprised four dietary treatments.Thedietary treatments were as follows:(1)control diet(0ppm COS),(2)control diet plus5to10kDa COS,(3)control diet plus10to50kDa COS and(4)control diet plus50to100kDa COS.The COS was sourced from Kitto Life Co.Ltd(Kyungki-do,Seoul,Korea)and was supplemented in the experimental diets at a concentration of250ppm.The diets were fed for 8days ad libitium,after which time the pigs were humanely sacrificed.The diets were formulated to have similar diges-tible energy(16MJ/kg)and standardised ileal digestible (SID)lysine(14g/kg)contents.All amino acids requirements were met relative to SID lysine(National Research Council, 1998).The ingredient composition and chemical analysis of the dietary treatments are presented in Table1.Animals and managementA total of28piglets(progeny of large white3(large white3landrace sows))were selected from a commercial pig unit at24days of age.The piglets had a weaning weight of9.1kg(s.d.50.80)and were blocked on the basis of litter of origin and live weight(n57).The piglets were individu-ally housed in fully slated pens(1.7m31.2m).They were individually fed and had ad libitum access to feed and water. The house temperature was thermostatically controlled at 308C throughout the experiment.This study was not a growth performance study but some performance data were recorded.The piglets were weighed at the beginning of the experiment(day0)and at the end of the experiment(day8). Food was available up to thefinal weighing and all remaining food was weighed back for the purpose of cal-culating feed efficiency.Pigs were observed for clinical signs of diarrhoea and a scoring system was applied to indicate the presence and severity of this as described by Pierce et al. (2006).Faeces scores were assigned daily for individual pigs from day0and continued until day8.The following faeces scoring system was used:15hard faeces,25slightly soft faeces in the pen,35soft,partially formed faeces,45loose, semi-liquid faeces and55watery,mucous-like faeces.Gut morphological analysisThe piglets were humanely sacrificed on day8by a lethal injection of Euthatal(pentobarbitone sodium BP–Merial Animal Ltd,Sandringham House,Essex,UK)at a rate of1ml/ 1.4kg BW.On removal of the digestive tract,sections of the duodenum(10cm from the stomach),the jejunum(60cm from stomach)and the ileum(15cm from caecum)were excised andfixed in10%phosphate-buffered formalin.The preserved segments were prepared using standard paraffin-embedding techniques.The samples were sectioned at5m m Table1Composition and chemical analysis of experimental diets (as-fed basis)Items Starter diet* Ingredient(g/kg)Whey permeate125.0 Wheat444.2 Soya bean meal142.5 Whey protein isolate130.0 Full-fat soybean80.0 Soya oil65.0 Vitamins and minerals 5.0 Lysine HCL 4.5 DL-methionine 1.6L-threonine 2.2 Analysis(g/kg,unless otherwise stated)DM892.5 CP(N36.25)224.2 GE(MJ/kg)18.2 Ash43.7 NDF110.3 Lysine-16.5 Methionine and cysteine-9.9 Threonine-10.7 Tryptophan- 2.5 Calcium-8.0 Phosphorous- 6.0 DM5dry matter;GE5gross energy.Starter diet provided(mg/kg completed diet):Cu,175;Fe,140;Mn,47;Zn, 120;I,0.6;Se,0.3;retinol,1.8;cholecalciferol,0.025;alpha-tocopherol,67; phytylmenaquinone,4;cyanocobalamin,0.01;riboflavin,2;nicotinic acid,12; pantothenic acid,10;choline chloride,250;thiamine,2;pyridoxine,0.015.*COS was included in dietary treatments T2–T4at a rate of250mg/kg.-Calculated for tabulated nutritional composition(Sauvant et al.,2004).Chitooligosaccharide in piglet diets1621thickness and stained with haemotoxylin and eosin(Pierce et al.,2006).Villous height and crypt depth were measured on the stained sections(43objective)using a light micro-scopefitted with an image analyser(Image Pro Plus,Media Cybernetics,Buckinghamshire,UK).Measurements of15well oriented and intact villi and crypts were taken for each seg-ment.Villous height was measured from the crypt–villous junction to the tip.Crypt depth was measured from the crypt–villous junction to the base.Results were expressed as the mean villous height or crypt depth in micrometres. Intestinal microfloraFor microbial analysis,digesta samples(,1061g)were aseptically recovered from the proximal colon of each pig immediately post slaughter.Digesta samples were stored in sterile containers(Sarstedt,Wexford,Ireland),placed on ice and transported to the laboratory within2h.A1.0g sample was removed from the digesta sample,serially diluted (1:10)in9.0ml aliquots of maximum recovery diluents (Oxoid,Basingstoke,UK)and spread plated(0.1ml aliquots) onto selective agars,as follows:Lactobacillus spp.were isolated on de Man,Rogosa and Sharp(MRS)agar(Oxoid) with an overnight(18to24h)incubation at378C in an atmosphere enriched with5%CO2,as recommended by the manufacturers(Oxoid).The Escherichia coli species were isolated on MacConkey agar(Oxoid)following aerobic incubation at378C for18to24h(O’Doherty et al.,2010). Target colonies of Lactobacilli and E.coli were identified by Gram stains and colony morphology(Salanitro et al.,1977). The API50CHL(BioMerieux,Biomerieux,Craponne,France) kit was used to confirm suspect Lactobacilli spp.Suspect E. coli colonies were confirmed with API20E(BioMerieux, France).This API system identifies the suspect colonies by measuring their ability to produce cytochrome oxidase. Typical colonies of each bacteria on each agar were counted, log transformed and the numbers of bacteria were expressed per gram of digesta after being serially diluted.Volatile fatty acid(VFA)analysisSamples of digesta from individual pigs were taken from the caecum and the proximal colon to measure the VFA concentration and molar proportions of VFAs.The VFA con-centrations in the digesta were determined using gas liquid chromatography according to the method described by Pierce et al.(2007).A1-g sample was diluted with distilled water (2.53weight of sample)and centrifuged at14003g for4min(Sorvall GLC–2B laboratory centrifuge,Dupont, Wilmington,DE,USA).Then,1ml of the subsequent super-natant and1m l of internal standard(0.5g3-methyl-n-valeric acid in1l of0.15mol/l oxalic acid)were mixed with3ml of distilled water.Following centrifugation to remove the precipitate,the sample wasfiltered through Whatman 0.45m m polyethersulphone membranefilters into a chromato-graphic sample vial.A1-m l sample was injected into a model 3800Varian gas chromatograph with a25m30.53mm i.d. megabore column(coating CP-Wax58(FFAP)–CB(no. CP7614))(Varian,Middelburg,the Netherlands).RNA extraction and complementary DNA(cDNA)synthesis Tissue samples were collected from the mesenteric side of the colon,rinsed with ice-cold sterile phosphate-buffered saline(Oxoid)and stripped of overlying smooth muscle cells. Approximately1to2g of the porcine colon tissue was cut into small pieces and placed in tubes containing15ml of RNAlater(Applied Biosystems,Foster City,CA,USA)and immediately stored at2208C pending RNA extraction.Total RNA was extracted from colon tissue samples(25mg)using a GenElute Mammalian Total RNA Miniprep Kit(RTN70, Sigma-Aldrich,St Louis,MO,USA)according to the manu-facturer’s instructions.To eliminate possible genomic DNA contamination,total RNA samples were subjected to DNAse I(AMPD1,Sigma-Aldrich)treatment according to the man-ufacturer’s protocol.Then RNA purification was performed using a phenol–chloroform extraction method(Chomczynski and Sacchi,2006).The total RNA was quantified using a NanoDrop-ND1000Spectrophotometer(Thermo Fisher Scien-tific,Wilmington,DE,USA)and the purity was assessed by determining the ratio of the absorbance at260and280nm. All total RNA samples had260/280nm ratios above1.8.In addition,RNA integrity was verified by visualisation of the18 and28S ribosomal RNA bands stained with ethidium bromide after gel electrophoresis on1.2%agarose gels(Egel,Invitro-gen Inc.,Carlsbad,CA,USA).Total RNA(1m g)was reverse transcribed(RT)using the RevertAid H minusfirst strand cDNA synthesis kit(Fermentas GmbH,St Leon-Rot,Germany)with oligo dT primers.Thefinal RT product was adjusted to a volume of120m l using nuclease-free water.Real-time quantitative PCRAll primers for the selected cytokines,genes such as Inter-leukin-1a(IL-1a),IL-6,IL-10,tumour necrosis factor(TNF-a) and the reference genes b-actin(ACTB),b2-microglobin (B2M),glyceraldehyde-3-phosphate dehydrogenase(GAPDH) and peptidylprolyl isomerise A(PPIA)are presented in Table2. Amplification was carried out in a reaction volume of20m l containing10m l SYBR Green Fast PCR Mastermix(Applied Biosystem),forward and reverse primer mix(1m l),8m l DEPC treated water and1m l of template cDNA.Quantitative real-time PCR was carried out using an ABI PRISM7500Fast sequence detection system for96-well plates(Applied Biosys-tem).The thermal cycling conditions were as follows:an initial denaturation step at958C for10min,40cycles of958C for15s, followed by608C for1min.Dissociation analyses of the PCR product were performed to confirm the specificity of the resulting PCR products.All samples were run in triplicate.The cycle threshold value(C t)is defined as the fractional cycle number at whichfluorescence passes thefixed threshold.The mean C t values of triplicates of each sample were used for calculations.Normalisation of quantitative PCR dataNormalisation of the C t values obtained from real-time PCR was performed by(i)transforming the raw C t values into relative quantities using the formula,relative quantities5 (PCR efficiency)D C t,where D C t is the change in the C t valuesWalsh,Sweeney,Bahar,Flynn and O’Doherty 1622of the sample relative to the highest expression (minimum C t value),(ii)using geNorm,a normalisation factor was obtained from the relative quantities of four most stable housekeeping genes (GAPDH,B2M,ACTB and PPIA)and (iii)the normalised fold change or the relative abundance of each of the target genes was calculated by dividing their relative quantities by the normalisation factor.Statistical analysisThe experimental data were analysed as a randomised block design using the GLM procedure of SAS (2004).The individualpig served as the experimental unit.Food intake was inclu-ded as a covariate in the model for villous height,crypt depth and villous height to crypt depth ratio in the digestive tract.The microbial counts were log transformed.The data were checked for normality using the Proc Univariate function of SAS.The means were separated using the Tukey–Kramer Test.Probability values of ,0.05were used as the criterion of statistical significance.All results are presented in the tables as least square means 6standard error of the means (s.e.).ResultsPerformance and faecal scoringThe average faecal scores of the pigs are presented in Table 3.The supplementation of different MW of COS had no significant effect on the growth performance of the pig during the 8-day experimental period (P .0.05).However,the inclusion of COS at all MW in the diet significantly reduced faecal scores com-pared with the control treatment (P ,0.01).MicrobiologyThe effect of COS supplementation at different MW on selected microbial populations in the colon of the pig is shown in Table 3.Pigs offered diets containing 5to 10kDa COS had a lower E.coli number compared with the control (P ,0.05)and the 50to 100kDa COS (P ,0.05)treatments.The 10to 50kDa treatment had a neumerically lower E.coli number compared with the control group (P 50.09).Pigs offered diets containing 5to 10kDa COS had a significantly lower population of lacto-bacilli in the colon compared with the control group (P ,0.05)and the 50to 100kDa COS diet (P ,0.01).Pigs offered 50to 100kDa COS had a higher lactobacilli number than pigs offered 10to 50kDa COS (P ,0.05).The supplementation of different MW of COS had no significant dietary effect on the lacto-bacilli :E.coli ratio in the colon of the pig.Table 2Porcine-specific primers used for real-time PCR 1.Forward primer sequence (50-30)Gene 2.Reverse primer sequence (50-30)T m (8C)IL-6 1.AGACAAAGCCACCACCCCTAA59.82.CTCGTTCTGTGACTGCAGCAGCTTATC 62.7IL-8 1.TGCACTTACTCTTGCCAGAGAACTG 61.92.CAAACTGGCTGTTGCCTTCTT 61.7IL-10 1.GCCTTCGGCCCAGTGAA 57.62.AGAGACCCGGTCAGCAACAA 59.4TNF-a 1.TGGCCCCTTGAGCATCA55.22.CGGGCTTATCTGAGGTTTGAGA 60.3GAPDH 1.CAGCAATGCCTCCTGTACCA 62.22.ACGATGCCGAAGTTGTCATG 62.1B2M 1.CGGAAAGCCAAATTACCTGAAC 59.02.TCTCCCCGTTTTTCAGCAAAT 60.0ACTB 1.CAAATGCTTCTAGGCGGACTGT 59.02.TCTCATTTTCTGCGCAAGTTAGG 60.0PPIA1.CGGGTCCTGGCATCTTGT58.02.TGGCAGTGCAAATGAAAAACTG56.5IL 5interleukin;TNF 5tumour necrosis factor;GAPDH 5glyceraldehyde-3-phosphate dehydrogenase;B2M 5b 2-microglobin;ACTB 5genes b -actin;PPIA 5peptidylprolyl isomerise A.Primers were designed using Primer Express TM software and were synthesisedby MWG Biotech (Milton Keynes,UK).Table 3Effect of COS supplementation at different MW on faecal scoring,selected microbial populations in the proximal colon and the total VFA concentration and the proportions of VFAs in the caecum of the weaned pig (least square means and s.e.;n 57)Dietary treatmentsControl 5to 10kDa 10to 50kDa50to 100kDas.e.SignificanceFaeces scoring Days 0to 84.06b 3.31a 3.44a 3.38a 0.124**Proximal colonic bacterial population (log cfu/g of digesta)Escherichia coli5.94b 4.34a 4.71a 5.81b 0.477*Lactobacilli spp.7.39bc 6.24a 6.56ab 7.56c 0.347*VFA concentrations in the caecum Total VFA (mmol/g of digesta)95.8770.25103.00116.7913.006ns Acetic acid 67.36b 45.77a 70.30b 79.20b 8.543*Propionic acid 19.8416.5123.3927.05 3.616ns Isobutyric acid 0.770.490.810.790.157ns Butyric acid 6.45 6.14 6.817.51 1.575ns Isovaleric acid 0.67b 0.45a 0.68b 0.83b 0.092*Valeric acid0.790.881.011.410.282nsCOS 5chitooligosaccharide;MW 5molecular weight;VFA 5volatile fatty acid.Probability of significance:*P ,0.05;**P ,0.01;ns,P ,0.05.Means with the same superscript alphabets within rows are not significantly different (P .0.05).Chitooligosaccharide in piglet diets1623Volatile fatty acidsThe effects of COS supplementation at different MW on the VFA concentrations in the caecum are shown in Table3.The supplementation of different MW of COS had a significant effect on the concentrations of acetic acid(P,0.05)and isovaleric acid(P,0.05)in the caecum.Pigs fed5to10kDa COS had lower levels of acetic acid and isovaleric acid compared with the control(P,0.05),10to50kDa COS (P,0.05)and50to100kDa COS(P,005).There was no significant effect of MW on VFA concentrations(P.0.05)in the proximal colon(data not shown).Gut morphologyThe effects of varying COS MW on villous height,crypt depth and the villous height:crypt depth ratios in the gastro-intestinal tract are shown in Table4.Pigs fed the10to 50kDa COS had a higher villous height in the duodenum and the jejunum compared with the control group(P,0.05), 5to10kDa COS(P,0.01)and50to100kDa COS diets (P,0.05).There was no effect of dietary treatment on crypt depth in the duodenum(P.0.05).Pigs offered the10to 50kDa COS had a higher villous height:crypt ratio in the duodenum and the jejunum compared with the control group(P,0.05)and the5to10kDa COS diet(P,0.01).Cytokine gene expression analysisThe effects of COS supplementation on the immune response in colon tissues of the pig are shown in Table5.The supplementation of different MW of COS had no significant effect on the expression of the cytokines TNF-a,IL-6,IL-8 and IL-10(P.0.05)in the gastro-intestinal tract of the pig. DiscussionThe hypothesis of the current experiment is that the biolo-gical properties of COS may be influenced by its MW and COS will enhance selected indices of health in weaned pig-lets.It was demonstrated in the current study that the lower MW of5to10kDa possessed antibacterial activity while the higher MW of10to50kDa was optimum for enhancing intestinal structure.Dietary supplementation of COS at the low MW of5to 10kDa decreased both lactobacilli and E.coli counts,while the10to50kDa COS numerically decreased E.coli popula-tions in the colon of the pig.In a study by Liu et al.(2008), COS supplementation at different concentrations reduced E. coli concentrations in the caecum of the weanling pig.E.coli is considered to be one of the most important causes of post-weaning diarrhoea in weaned pigs;therefore,a reduction inTable4Effect of COS supplementation at different MW on villous height,crypt depth and the villous height:crypt depth ratio in the gastro-intestinal tract of the weaned pig(least square means and s.e.)Dietary treatments Control5to10kDa10to50kDa50to100kDa s.e.Significance Covariate(intake) Villous height(m m)Duodenum284.0a256.0a326.3b266.2a17.38*ns Jejunum271.6a270.7a316.5b260.8a16.15*ns Ileum239.8268.3251.5242.915.07ns ns Crypt depth(m m)Duodenum305.7330.2280.1311.718.98ns ns Jejunum294.1298.4281.6268.420.93ns ns Ileum207.5242.8228.2239.811.29ns ns Villous:crypt depth ratioDuodenum 1.0a0.8a 1.2b0.9a0.08*ns Jejunum0.9a0.9a 1.2b 1.0ab0.06*ns Ileum 1.2 1.1 1.1 1.00.06ns nsCOS5chitooligosaccharide;MW5molecular weight.Probability of significance:*P,0.05;**P,0.01;ns,P,0.05.Means with the same superscript alphabets within rows are not significantly different(P.0.05).Table5Effect of COS supplementation at different MW on the immune response in unchallenged proximal colon tissues(leastsquare means of fold change in normalised relative gene expression with their s.e.;n57animals)Dietary treatments Control5to10kDa10to50kDa50to100kDa s.e.SignificanceColonTNF-a0.3660.3530.3760.3620.0568nsIL-60.2480.3590.3180.3220.0645nsIL-80.3850.5440.3700.3580.0797nsIL-100.3640.3420.3110.3070.0614ns COS5chitooligosaccharide;MW5molecular weight;TNF5tumour necrosis factor;IL5interleukin.Probability of significance:*P,0.05;**P,0.01;ns,P,0.05.Walsh,Sweeney,Bahar,Flynn and O’Doherty1624E.coli populations may reduce the incidence of diarrhoea in post-weaned pigs(Fairbrother et al.,2005).Although many species of E.coli are commensal,high levels of specific E.coli (like ETEC)will increase the risk of disease.Unfortunately, ETEC numbers were not measured in the current study.In the current study,the faecal score was decreased in pigs fed the COS diets compared with the control.These results suggest that the supplementation of the5to10kDa and10 to50kDa COS reduces E.coli populations in the colon, resulting in a lower faecal score in the post-weaning period. The50to100kDa COS led to a reduced diarrhoea score but no reduction in E.coli populations;therefore,this MW of COS may be working as a bulking agent to affect the faecal score.The50to100kDa COS may retard the rate of passage through the intestine and may have the ability to absorb water.In the current study,it was demonstrated that supple-mentation of5to10kDa COS had the strongest antimicrobial effect against both lactobacilli and E.coli.This is in agreement with other studies in which low MW COS(5to10kDa)were shown to possess strong antibacterial properties compared with higher MW COS and the antibacterial properties of COS increased at a low MW of,5kDa against Gram-negative such as E.coli(Zheng and Zhu,2003;Kittur et al.,2005).In a study by Liu et al.(2010),COS supplementation decreased E.coli populations compared with the control in the caecum of weaned pigs,while Jeon et al.(2001)observed a anti-microbial effect of COS against Gram-positive bacteria such as Lactobacilli under in-vitro conditions.To explain COS antibacterial activity,two mechanisms have been proposed.Thefirst mechanism is that the posi-tively charged COS reacts with negatively charged molecules at the microbial cell surface,thereby altering cell perme-ability(Chung and Chen,2008).Therefore,COS may interact with the membrane of the cell to alter cell permeability. However,as evident from the current study,this activity may differ with varying MW as the50to100kDa group had no inhibitive effect on the selected microbial populations,while the MWs of5to10kDa and10to50kDa COS had the strongest inhibitive effect.The other antibacterial mechan-ism is the binding of COS with DNA to inhibit RNA synthesis (Liu et al.,2004).It has been proposed that COS penetrates the nuclei of the bacteria and interferes with RNA and pro-tein synthesis.It is noteworthy that all the COS samples used in the current study were soluble in aqueous solutions.Kim and Rajapakse(2005)found that COS with a MW of .30kDa were not effective as antibacterial agents due to their poor solubility in aqueous solutions at a neutral pH. Volatile fatty acids are the major end products of bacterial metabolism in the large intestine(Macfarlane and Macfarlane, 2003).Both protein and carbohydrate fermentation contribute to the production of acetic acid;however,branched-chain fatty acids such as isovaleric acid are produced from protein fermentation(Mackie et al.,1998).In the current study,the5 to10kDa group had the lowest selected microbial populations while also reducing isovaleric acid and acetic acid concen-trations in the caecum.The shift in the production of the fermentation end products is reflected in the reduction of the selected microbial populations.The quantity of VFA produced depends on the amount and composition of the substrate and on the type of microbes present in the large intestine (van Beers-Schreurs et al.,1998).Reduced VFA concentrations indicate that lower amounts of substrate were fermented as a result of a lower microbial activity in the caecum(Htoo et al.,2007).Villous height is generally reduced and crypt depth is increased,which may explain the increased occurrence of diarrhoea and reduced growth after weaning(Pluske et al., 1996).The inclusion of10to50kDa COS in the present study was found to increase the villous height and villous:crypt depth ratio in the duodenum and also in the jejunum com-pared with the control group.Very little data have been published on the effects of COS MW on gut morphology in weaned piglets;thus,the exact mechanism for the increase in villous height and villous:crypt depth ratio is unclear.It may be hypothesised that low MW COS has the potential to promote intestinal morphology through cell proliferation. The COS has been shown to influence colonic cell prolifera-tion,crypt depth and crypt circumference in mice(Torzsas et al.,1996).A study carried out by Liu et al.(2008),on different con-centrations of COS,demonstrated that200mg/kg of COS increased villous height and villous:crypt ratio in the jeju-num and ileum(Liu et al.,2008).The possible explanation for this improved intestinal structure was that COS is com-posed of N-acetyl glucosamine(Kim and Rajapakse,2005), which may bind to certain types of bacteria and possibly interfere with their adhesion to the gut tissue of host animals (Ofek et al.,2003;Liu et al.,2008).This result is in agree-ment with Moura˜o et al.(2006),who reported that an increase in villi length in the ileum of weaned rabbits was correlated to a lower intestinal microflora.A decrease in bacteria load has been shown to increase the proliferation of epithelial cells,which leads to an improved intestinal mor-phology and increased villous height(Moura˜o et al.,2006). In the present study,in pigs fed the lower MW of5to10kDa COS,a strong antimicrobial effect on both Lactobacilli and E.coli populations was observed,with no effect on villous structure,while the higher MW of10to50kDa resulted in a reduction in E.coli numbers in comparison with the control and was optimum for improving villous integrity.There were no effects of COS supplementation in colon tissue on any of the cytokines analysed.This overall lack of an effect on these inflammatory cytokines implies that COS inclusion in the diet had no effects on immune gene expression of the pigs.Mori et al.(1997)also demonstrated that chitin and its derivatives do not stimulate the production of IL-6,IL-1and TNF-a byfibroblasts.In our study,no dif-ferences were observed on growth performance between days0and8post-weaning.In conclusion,MW is an important factor to consider when investigating the biological properties of COS.On the basis of the current study,the lower MW of5to10kDa possessed antibacterial activity while the higher MW of10to50kDaChitooligosaccharide in piglet diets1625。
生物学英文文献通用引用参考文献格式
生物学英文文献通用引用参考文献格式全文共6篇示例,供读者参考篇1How to Properly Credit the Smart ScientistsHave you ever wondered how all those big books and fancy papers about plants, animals, and tiny creatures get written? Well, the super smart scientists who study biology don't just make everything up themselves. They read what other scientists have already learned and discovered, and then they build upon that knowledge with their own experiments and observations.But here's the tricky part – they have to give proper credit to all the scientists whose work they used and referenced. It's like if you copied your friend's math homework without giving them credit – that would be considered cheating, right? Well, in the science world, it's super important to always give credit where it's due. That's why there are special rules and formats for how scientists cite (that's a fancy word for "credit") the work of other scientists in their own writing.These citation rules make sure that every scientist gets properly recognized for their hard work and brilliant discoveries.It also helps other scientists easily find and double-check the original sources that a new piece of writing is based on. Pretty neat, huh?So, what do these special citation formats look like? Well, there are a few different styles that scientists use, but one of the most common for biological papers is called the "Author-Date" style. Let me break it down for you.Let's say a scientist named Jane Doe wrote an awesome book in 2018 all about the mating habits of gorillas. If another scientist, like John Smith, wanted to mention some of Jane's findings in his own paper, he would cite her work like this in the body of his writing:"Gorillas have been observed engaging in some pretty wacky mating rituals (Doe, 2018)."See how John gave credit to Jane Doe right there, along with the year her book was published? That's an in-text citation. Pretty simple, right?But that's not all! At the end of John's paper, there would also be a "References" section where he lists out all the full citations for every source he mentioned, like this:Doe, J. (2018). The Wild Mating Rituals of Gorillas. Primate Press.This full citation includes the author's full name, the publication date, the title of the work, and even which publishing company put it out. With all those details, any other scientist could easily look up Jane's original book if they wanted to learn more.Sometimes, scientists might cite a chapter from an edited book, a scientific journal article, a website, or some other type of source instead of a whole book. But the same basic principles apply – always give credit to the original authors and include key details like titles, dates, and publishers. That way, the proper scientists get the kudos they deserve!These citation rules might seem a bit fussy at first, butthey're actually super important for maintaining integrity and giving props in the scientific community. So the next time you read an incredible book about the mysteries of biology, remember – behind all those cool facts and discoveries are tons of scientists meticulously crediting each other's work. How's that for teamwork?篇2How to Cite Biology Papers ProperlyHi there! My name is Jamie and I'm going to teach you all about how to cite biology papers and books in the right way. Citing means giving credit to the authors who wrote the stuff you used for your report or project. It's really important to do this so you don't accidentally steal someone else's hard work!There are a few different styles for citing biology sources, but the main ones are APA and CSE. APA stands for American Psychological Association, and CSE means Council of Science Editors. Both of these styles have very specific rules on how to list out the citations.Let's start with APA style, since that's probably the one you'll use the most in school. When you cite something from a biology journal in APA, it looks like this:Author's Last Name, First Initial. Second Initial. (Year Published). Article title capitalized like a book title. Journal Name in Italics, Volume#(Issue#), Page range.So for example, if I wanted to cite a paper called "Frog Feeding Behaviors" by scientists John Smith and Jane Doe that was published in 2018 in volume 25, issue 2 of the Journal of Amphibian Research on pages 125-138, it would look like this:Smith, J. D., & Doe, J. (2018). Frog feeding behaviors. Journal of Amphibian Research, 25(2), 125-138.For books in APA style, it's a little different:Author's Last Name, First Initial. Second Initial. (Year Published). Book title capitalized like a sentence. Publisher Location: Publisher Name.Like if I cited a book called "The Lives of Reptiles" written by James Lee and published in 2015 by Oxford University Press in New York City, it would be:Lee, J. (2015). The lives of reptiles. New York City: Oxford University Press.Now let's talk about CSE style. This one is used a lot in super professional science journals and papers. For journal articles in CSE, the citation looks like this:Author(s) Surname(s) Followed by Initials. Article Title With Only Proper Nouns Capitalized. Journal Name in Normal Typeface. Year;Volume(Issue):Full Page Range.So for that same frog paper I cited earlier by Smith and Doe in APA style, it would be:Smith JD, Doe J. Frog feeding behaviors. J Amphib Res. 2018;25(2):125-138.For books in CSE style, it's:Author(s) Last Name Initials. Book Title Capitalized Like a Sentence. Place of Publication: Publisher Name; Year.So that reptile book by James Lee would be cited as:Lee J. The lives of reptiles. New York City: Oxford University Press; 2015.Those are the basics of citing in APA and CSE styles! There are some little extra rules too, like if there are more than 7 authors you write out the first 6 and then "et al." And for website sources you include the URL and access date. But overall those examples cover the most common types of citations you'll need for biology papers and reports when you're in elementary and middle school.The most important thing is to just make sure you carefully write down ALL the details about the sources you used - the authors' names, the article or book title, the journal or publisher, the year, volume/issue, and page numbers. That way you can put together a citations section at the end and give proper credit to all the scientists and scholars whose work you learned from.Citing is just a way to be responsible and play by the rules of good science - so get into that habit early! Let me know if you need any other citation formatting tips.篇3How to Cite Biology Books and PapersHi there! Today I'm going to teach you all about how scientists and students cite or reference the books and papers they use when writing about biology. It's really important to give credit to the authors and researchers whose work you are using. That way, other people can find and read the original sources too!There are a few different styles that are commonly used for citations in biology. The main ones are APA, MLA, CSE, and Chicago. Each one has a specific way of formatting the citations so they look neat and consistent. It's kind of like having different uniform styles for different sports teams!APA StyleLet's start with APA style, which stands for the American Psychological Association. This one is used a lot in fields like biology, psychology, and medicine.the year the book was published in parentheses, the book title in italics, and then the publisher information. For example:Dawkins, R. (1976).The selfish gene. Oxford University Press.For a paper or journal article in APA, it goes: Author(s) last name, initials. (Year). Article title.Journal Name, Volume(Issue), page numbers.Like this:Watson, J. D., & Crick, F. H. (1953). A structure for deoxyribose nucleic acid.Nature, 171(4356), 737-738.MLA StyleNext up is MLA, the Modern Language Association style. This one is more common for English and literature classes, but some biology courses use it too.first name, a period, thebook titlein italics, the publisher, a comma, and the publication year. Like:Dawkins, Richard.The Selfish Gene. Oxford UP, 1976.For an article, it's the author's last name, a comma, first name, a period, "Article Title."Journal NameVolume.Issue (Year): page range. For example:Watson, James D., and Francis H. Crick. "A Structure for Deoxyribose Nucleic Acid."Nature171.4356 (1953): 737-38.CSE & Chicago StylesTwo other common styles in biology are CSE (Council of Science Editors) and Chicago. I'll show you examples of how those look.CSE book citation:Dawkins R. 1976.The selfish gene. Oxford (United Kingdom): Oxford University Press.CSE journal article:Watson JD, Crick FH. 1953. A structure for deoxyribose nucleic acid.Nature171(4356):737-738.Chicago book style:Dawkins, Richard.The Selfish Gene. Oxford: Oxford University Press, 1976.Chicago journal article:Watson, James D., and Francis H. Crick. "A Structure for Deoxyribose Nucleic Acid."Nature171, no. 4356 (1953): 737-38.Those all look a little different, but they include the same key information - author(s), title, publication details, and page numbers for articles. The styles just format and order things in a particular way.Why Cite Sources?You might be wondering, why is it so important to cite sources properly? Well, there are a few big reasons:It gives credit to the authors and researchers whose ideas and discoveries you are using in your own work. That's only fair!It allows your readers to find the original sources if they want to read more about a particular topic. The citations act like thorough reference lists.It shows that you have done solid research from reliable, published sources rather than just making things up.Citing correctly prevents you from accidentally plagiarizing someone else's writing, which is unethical.Following the appropriate style shows you understand the rules and expectations for academic writing in your field.So in summary, always be sure to keep track of the books, journal articles, and other sources you use when writing about biology topics. Then cite them properly using the style required by your teacher, publication, or discipline. It's a crucial skill for any student or scientist!Let me know if you need any clarification or have additional questions about citation styles. Proper sourcing is super important, so I want to make sure you've got it down!篇4How to Cite Sources in Biology PapersHi kids! Today we're going to learn about how to properly cite the sources you use when writing biology papers and reports. Citing sources is really important because it gives credit to the people who did the original research and wrote the books or articles you are using. It also allows people reading your paper to find and check those original sources themselves if they want to learn more.When you cite a source, you include some key pieces of information about it, such as the name(s) of the author(s), the title of the book/article, the year it was published, and some other details depending on whether it's a book, journal article, website, etc. This information is formatted in a specific way according to established citation styles used in biology and other sciences.The most common citation style used in biology is called "Author-Date" style. It was developed by the Council of Science Editors (CSE) and has two main components:In-text citations within the body of your paperA reference list at the end listing all the sources you citedLet's start with in-text citations first. Whenever you mention a fact, idea, or finding that came from one of your sources, you need to include a brief citation inside parentheses. For a book or article by one or two authors, you list the author's last name(s) and the year of publication like this:(Miller 2012)or(Jackson and Smith 2018)If there are three or more authors, you write the last name of the first author listed followed by "et al." which means "and others":(Williams et al. 2020)If you're quoting something word-for-word from the source, you also include the page number(s) where the quote appears:(Miller 2012, p. 297)The other key part is the reference list at the very end of your paper. This is where you list out all of the complete citation details for every source you cited within your paper. The references are listed in alphabetical order by the last name of the first author. The format looks like this:Book:Author(s) Last Name, First Initial(s). Year Published. Book Title (italicized). Place of Publication: Publisher Name.For example:Hickman, C.P., L.S. Roberts, and F.M. Hickman. 1988. Integrated Principles of Zoology. St. Louis: Times Mirror/Mosby College Publishing.Journal Article:Author(s) Last Name, First Initial(s). Year Published. Article Title. Journal Name (italicized) Volume(Issue):Page Numbers.For example:Weber, J.N. and B.K. Baksi. 1976. Geological implications of a redetermination of the decay constant for 187Re. Earth and Planetary Science Letters 31(1):129-138.For websites, you include the author(s) if available, the date the website was published or last updated, the title of the page or document, the URL, and the date you accessed the website.There are a few other small variations for things like books with editors instead of authors, translated books or articles, articles with DOI numbers, and other specific cases. But those cover the most common citation formats you'll need.Citing sources properly shows that you've done your research, gives credit to other scholars, and allows your readers to trace your information back to the original publications. Getting used to this format now will make it much easier when you get to higher levels of education. Let me know if you have any other questions!篇5How to Cite Science Books and Papers Like a ProHave you ever read a really cool book or paper about animals, plants, or other living things? Maybe it taught you fascinating facts about dinosaurs, or how bees make honey, or the different kinds of frogs in the rainforest. After learning all that amazing stuff, you probably wanted to share what you discovered with your friends and family!But wait, there's something important you need to do first. Whenever you talk about facts and information you learned from a book, website, or scientific paper, you have to give credit to the author or authors who did all the hard work of researching and writing about that topic. That's called a citation.Citations are like thank-you notes for writers and scientists. They let everyone know where you got your information from, and that you didn't just make it all up yourself. Plus, if someone wants to learn more about that subject, the citation tells them exactly which book or paper to look for.There's a special way to write citations for science books and papers, called a "reference format." It's kind of like a secret code that researchers around the world use to share sources with each other. Here's how it works:For a book, you list:The author's last name and first initialThe year the book was publishedThe title of the bookThe city where the book was publishedThe name of the publisherSo if you learned about elephants from a book called "Amazing Elephants" written by Jane P. Doe and published in 2020 by Creature Books in New York City, the citation would look like this:Doe, J.P. (2020). Amazing Elephants. New York City: Creature Books.For a paper published in a scientific journal, you list:The author's last name and first initialThe year the paper was publishedThe title of the paperThe name of the journalThe volume and issue number of the journalThe page numbers where the paper appearsLet's say you read a fascinating paper called "How Butterflies Get Their Colors" by scientists Sam M. Itton and Alex Z. Ander, published in 2022 in Volume 12, Issue 3 of the journal "Incredible Insects" on pages 57-68. The citation would be:Itton, S.M. & Ander, A.Z. (2022). How Butterflies Get Their Colors. Incredible Insects, 12(3), 57-68.Writing citations might seem like a bit of work, but it's an important skill to learn. Following the proper reference format shows that you respect other people's hard work and ideas. It also makes it much easier for people to find and read the same books and papers you enjoyed so they can learn new things too!So next time you discover mind-blowing facts about the natural world, make sure to jot down all the details you need to cite your sources. Your teachers, parents, and all the other science lovers out there will be really impressed by your responsible research skills!篇6A Curious Kid's Guide to Citing Bio SourcesHey there, young scientists! Have you ever wondered how all those big brainy biologists keep track of all the books, journals, and websites they use for their research? Well, let me tell you, it's not just a messy pile of papers and scribbled notes. They follow some pretty cool systems to give proper credit to the smart folks whose work they're building on.These systems are called citation styles, and they're like special codes or formats that tell you exactly how to write down the details about a source you used. That way, if someone else wants to check out that same source, they know right where to look!One of the most common citation styles in biology is called APA, which stands for American Psychological Association. These APA rebels have their own unique way of formatting things. For example, if you cited a book, it would look something like this:Author's Last Name, First Initial. (Year Published). Book Title: Subtitle if Any. Publisher Name.See? It's got the author, the year it was published, the title, and who put it out there for the world. Neat and tidy!But what if you need to cite a science journal article instead? No problem, the APA has you covered:Author(s) Last Name(s), Initial(s). (Year Published). Article title. Journal Name, Volume(Issue), Page range.This format includes the author(s), the year, the article name, the journal it was published in, the volume and issue numbers, and the pages it was on. Phew, that's a mouthful!Now, some of you young bio brainiacs might be using a different style guide called CSE, which is preferred by the Council of Science Editors. Their formats look a little different:Book:Author(s) Initial(s). Title of Book. Edition if not first. Place of Publication: Publisher Name; Year.Journal:Author(s) Initial(s). Article title. Abbreviated Journal Name. Year;Volume(Issue):Inclusive page range.See how the CSE style separates things a bit differently and includes some extra details like the edition and place of publication? Scientists sure are sticklers for the nitty-gritty!The key thing to remember is that whenever you use someone else's words or ideas in your own bio writing, you need to give them props by citing exactly where you got thatinformation from. It's only fair, right? You wouldn't want someone swiping YOUR brilliant science finds without giving you credit!So there you have it, a whistle-stop tour of how thosebig-kid biologists cite their sources. Pretty snazzy, huh? Who knows, maybe one day you'll be the ones writing upcutting-edge research that other scientists have to cite! But for now, just focus on learning all the amazing things biology has to teach us about this wildly wonderful world.Keep exploring and asking questions, young naturalists! The adventure of science awaits!。
分子生物学英文文献

Mobile Genetic Elements 2:6, 267-271; November/December, 2012; © 2012 Landes BioscienceLETTER TO THE EDITORLETTER TO THE EDITORGAA repeats were shown to be the most unstable trinucleotide repeats in the pri-mates genome evolution by comparison of orthologous human and chimp loci.2 The instability of the GAA repeat in the first intron of the frataxin gene X25 is particu-larly well studied since it causes an inher-ited disorder, Friedreich ataxia (FRDA).3-6 I n Friedreich ataxia, once the length of the GAA repeat inside the frataxin gene (FXN GAA) reaches a certain threshold, the combined probability of its expan-sions and deletions in progeny of affected parents is about 85%.7 Deletions and con-tractions of the repeat in intergenerational transmissions can reach hundreds of base pairs.7 However, the FXN GAA repeat is much more stable in somatic cells.8 I t is relatively stable in blood, but shows some instability in dorsal root ganglia,9 which is responsible for some of the neurodegen-erative symptoms of Friedreich ataxia.5 GAA repeats were shown to be stable in FRDA fibroblasts cell lines and neuronal stem cells.10The question why the FXN GAA repeat is so much more stable in somatic cells than in intergenerational transmis-sions remains open. Recent studies in FRDA iPSCs that are closer to embryonic cells than somatic cells models, showed expansions of the GAA repeat with 100% probability.10,11 It is intriguing that all cells Complexes between two GAA repeats within DNA introduced into Cos-1 cellsMaria M. KrasilnikovaPennsylvania State University; University Park, PA USAKeywords: replication, GAA repeat, Friedreich ataxia, genome instability, chromatinCorrespondence to: Maria M. Krasilnikova; Email: muk19@ Submitted: 10/08/12; Revised: 12/09/12; Accepted: 12/10/12/10.4161/mge.23194in the iPSC cell lines that were analyzed were synchronously adding about two GAA repeats in each replication.The studies focused on the FXN GAA repeat provided many valuable insights; however, human genome contains many other GAA repeats: the human X chro-mosome, for instance, contains 44 GAA stretches with more than 100 repeats in each. About 30 GAA repeats were detected on the chromosome 4.12 GAA repeats mostly originated from the 3' end of the poly A associated with Alu elements.13I t is not known what makes repeats with the GAA motif most unstable com-pared with other trinucleotide repeats. It is possible that GAA repeats instability is caused by their ability to form non-B DNA structures. In vitro, GAA repeats can form triplexes,14,15 and sticky DNA structures.16 At the same time, hairpins 17 and paral-lel duplexes 18 have also been observed. When transcription is going through a GAA repeat, it can also form an R-loop, a DNA-RNA complex that leaves one of the complementary strands single-stranded.19 However, it is unclear whether these struc-tures indeed form in mammalian cells. If we assume that the instability of the GAA repeat is indeed associated with the struc-ture formation, it is still unclear why the structures would form in early embryo-genesis when the GAA expansion event in Friedriech ataxia is believed to occur,7 and do not form in somatic cells where the GAA repeat was shown to be more stable. I n our recent study, we hypothesize that the differences in chromatin structure are at least partially responsible for the differ-ences in the GAA repeats stability.1The propensity of GAA repeat to form a triplex structure may strongly depend on the structure of chromatin at the repeat and surrounding area.1 Consistent with other studies, we observed that formation of chromatin at an SV40-based plasmid introduced into mammalian cells occurs gradually: 8 h after transfection there are only occasional nucleosomes at the plas-mid, while by 72 h the nucleosome struc-ture is already regular.20 Our analysis of replication stalling at the repeat revealed that the repeat affects replication only in the first replication cycle, when chromatin is still at the formation stage. We believe that replication stalling at GAA is caused by a triplex structure that the GAA repeat adopts during transfection or inside the cell. In the subsequent replication cycles, replication was completely unaffected by the presence of the repeat, which is likely to be due to the inhibition of triplex for-mation by tight chromatin packaging.1Here we show the data that strengthen our previous observations and extend it to one more structure: a complex betweenWe have recently shown that GAA repeats severely impede replication elongation during the first replication cycle of transfected DNA wherein the chromatin is still at the formation stage.1 Here we extend this study by showing that two GAA repeats located within the same plasmid in the direct orientation can form complexes upon transient transfection of mammalian Cos-1 cells. However, these complexes do not form in DNA that went through several replication rounds in mammalian cells. We suggest that formation of such complexes in mammalian genomes can contribute to genomic instability.We studied replication of several SV40-based plasmids that contained two (GAA)57 repeats located at different posi-tions in Cos-1 cells (Figs. 1–3). I n each case, the cells were transiently transfected with 1 μg of each plasmid, and replication intermediates were isolated after about 30 h. This allowed us to observe replica-tion arcs that resulted from the plasmids that replicated for more than two rounds. However, some residual amount of the first replication cycle arcs can also be registered. Replication stalling at GAA repeats only occurs during the first repli-cation cycle of an SV40-based plasmid,1 hence we did not observe it in our system.For each of the plasmids, and for all patterns of restriction digests that we studied, we observed complexes between the two (GAA)57 repeats (indicated by red arrows in each of the figures). The migration of those complexes was differ-ent depending on the digest pattern, so the complexes were at different positions in 2D gel patterns, in agreement with our expectations based on their shapes.We did not observe replication stalling associated with these complexes. When this complex is formed, it migrates signifi-cantly slower on 2D gels; the replication of plasmids that contain such complexes should result in an extra replication arc originating from the complex position. However, the number of molecules that form this complex is significantly lower than the overall number of plasmids, and there may be not enough material to observe their replication.For the situation when the two GAA repeats were located in two different frag-ments upon PvuI digest (Fig. 1), we showed that the spot 3 (Fig. 1D ) (also indicated by an arrow in Fig. 1A ) con-tains both fragments: the spot hybridized to the probes corresponding to either of them (Fig. 1A and B ). However, the com-plex appears at the position that migrates slower than unreplicated plasmid in the second dimension upon AflI I I and ScaI digest when both repeats belong to the same fragment (Fig. 2). We suggest that this fragment contains a loop generated by the interaction between the two GAA repeats (Fig. 2C ) that slows it down in the second dimension, and has little effect on the mobility in the first dimension sinceThe method of two-dimensional elec-trophoresis 22,23 allowed us to analyze the replication progression through a DNA fragment containing two GAA repeats. In this method, the replication intermediates are isolated under non-denaturing condi-tions, digested by a restriction enzyme, and separated on two consecutive gel runs in perpendicular directions. The first direction runs in 0.4% agarose (that separates mostly by mass), and the second direction runs in 1% agarose (that sepa-rates by both mass and shape of a DNA molecule).two GAA stretches. Two GAA repeats has been shown to readily form complexes, such as “sticky DNA,” in vitro,16 but it is not obvious whether it can also form inside the mammalian cells. The sticky DNA requires more than one GAA stretch to form.21 We studied the interaction of two GAA repeats located within the same plas-mid, but since the human genome contains at least several hundreds of long GAA motif repeats,12,13 this structure can theoretically form in the genomic environment as well. However, more experiments are needed to detect its formation in genome.Figure 1. A complex between two (GAA)57 repeats within the same plasmid. Plasmid replication intermediates were isolated from Cos-1 cells 30 h after transient transfection. Intermediates were digested by restriction enzymes indicated in the plasmid maps, and separated by two-dimension-al neutral-neutral agarose gel electrophoresis as described previously.1 The gel was transferred to a nylon membrane and hybridized to one of the probes indicated in the plasmid maps as green lines. A position of the complex at the 2D gel pattern depends on the restriction digest of the replication intermediates (indicated by a red arrow). (A ) Two-dimensional electrophoresis of replication intermediates digested by PvuII that places each repeat within a separate fragment. The membrane was hybridized with probe 1 indicated in (C ). The names of the plasmids GAAGAA, GAACTT, etc., reflect the orientation of the GAA repeats within the plasmid (GAAGAA means that the two GAA stretches are in the direct orientation). (B ) The same membrane was stripped of probe 1, and re-hybridized with probe 2 (C ). (C ) The scheme of the plasmid that was used in the experiment in (A and B ). Two different fragments that resulted from the PvuII digest are shown in red and blue. The positions of GAA repeats are shown in black. They can be in the direct or the reverse orientations in this plasmid. (D ) The scheme of the 2D gel in (A ). Spot 1: unreplicated blue fragment, spot 2: unreplicated red fragment that appears because of the cross-contamination of probe 1 with probe 2 due to their preparation from the same plasmid with a restriction digest. Spot 3: a complex between the red and the blue fragments. Spikes 3-2 and 3-4 may result from double-stranded breaks in the plasmid during transfection that make one of the arms of the complex in spot 3 shorter.it has the same mass as the unreplicated fragment.The complexes formed only when the two GAA stretches were positioned on a plasmid as direct repeats (GAAGAA and CTTCTT in the plasmid names). The inverted repeats GAACTT and CTTGAA did not form complexes as shown in Figures 1 and 2. This is in agreement with the sticky DNA formation in supercoiled plasmids containing two GAA repeats that has been previously shown in vitro.16 In sticky DNA, the two GAA strands that are in the antiparallel orientation, and the CTT strand, form a stable complex stabilized by Mg2+-dependent reverse-Hoogsteen triads. However, the sticky DNA complex fell apart upon heating in the presence of EDTA, which removes the Mg2+ ions necessary for its stability,16 while we did not detect any changes in spot 3 upon heating the intermediates with EDTA (Fig. 3B). We suggest that in our case the complex may be different from the canonical sticky DNA. It may be based on Hoogsteen base pairing where the Mg2+ is not needed and a slightly acidic pH has a stabilizing effect.24 It has been shown that this type of structure forms within long GAA stretches in vitro even at a pH that is close to neutral.15 We also cannot exclude that the complexes are hemicatenated molecules connected at GAA repeats with Watson-Crick pairing.25The complexes between the two GAA repeats persisted only until the plasmids went through one replication round. DpnI restriction enzyme is a frequent-cutter that digests all DNA that contains strands syn-thesized in bacteria: it cleaves DNA that is methylated at GATC by dam methyl-ase, which is only present in bacteria, but not in mammalian cells. Extensive DpnI digest that we performed, cleaved the ini-tial DNA used in transfection, as well as the products of the first replication cycleA complex between the two repeats within the same fragment slow down its progres-sion in the second dimension of the 2D gel. The same plasmid as in the Figure 1 was used in this experiment, however, they were digested with different enzymes. (A) Replication intermediates were digested with AflIII and ScaI, placing both repeats within the same fragment. The complex of two GAA repeats results in a slowly migrating structure that is shown by a red arrow. (B) A map of the digest of the same plasmid as in Figure 1 with restriction enzymes ScaI and AflIII. Here both of the repeats are located within the same fragment shown in blue. (C) The scheme of the 2D gel in . Spots 1 and 2 are the same as in Figure 1D. Spot 3: a looped intermediate that resulted from the interaction of the two GAA repeats.A complex between the two GAA repeats does not form in plasmids that went through more than two replication rounds in mammaliancells. Two-dimensional gels of replication intermediates of a plasmid containing two (GAA)57 repeats were obtained as described in the Figure 1) Two-dimensional gel of replication intermediates digested by AflIII (placing the two repeats at two different fragments). A red arrow indi-cates the position of the complex between the two GAA-containing fragments. (B) The same replication intermediates were incubated at 80°C in the presence of 10 mM EDTA for 10 min; the pattern of the 2D gel did not change. (C) The same intermediates were additionally digested with10 units of DpnI for 2 h prior to loading. The spot at the position indicated by an arrow in Figure 1 A is not present in this picture. An additional spot that appeared in this pattern is likely not a part of the pattern, and is probably due to some contamination. (D) A map of the plasmid that was used inFigure 1A and B. Spot 1, unreplicated blue fragment; spot 2, unreplicated red fragment (which appeared due to contamination of probe 1 with other plasmid sequences). Spot 3, a complex between the blue and the red fragments. A very faint duplicate Y arc from replication of the second fragment originates from spot 2. The spikes originating from spot 3 can be interpreted the same way as11. Ku S, Soragni E, Campau E, Thomas EA, Altun G, Laurent LC, et al. Friedreich’s ataxia induced plu-ripotent stem cells model intergenerational GAA·TTC triplet repeat instability. Cell Stem Cell 2010; 7:631-7; PM I D:21040903; /10.1016/j.stem.2010.09.014.12. Siedlaczck I , Epplen C, Riess O, Epplen JT. Simple repetitive (GAA)n loci in the human genome. Electrophoresis 1993; 14:973-7; PM I D:7907288; /10.1002/elps.11501401155.13. Chauhan C, Dash D, Grover D, Rajamani J, MukerjiM. Origin and instability of GAA repeats: insights fromAlu elements. J Biomol Struct Dyn 2002; 20:253-63;PMID:12354077; /10.1080/07391102.2002.10506841.14. Gacy AM, Goellner GM, Spiro C, Chen X, Gupta G, Bradbury EM, et al. GAA instability in Friedreich’sAtaxia shares a common, DNA-directed and intraal-lelic mechanism with other trinucleotide diseases. MolCell 1998; 1:583-93; PMI D:9660942; http://dx.doi.org/10.1016/S1097-2765(00)80058-1.15. Potaman VN, Oussatcheva EA, Lyubchenko YL, Shlyakhtenko LS, Bidichandani SI, Ashizawa T , et al.Length-dependent structure formation in Friedreich ataxia (GAA)n*(TTC)n repeats at neutral pH. NucleicAcids Res 2004; 32:1224-31; PMID:14978261; http:///10.1093/nar/gkh274.16. Sakamoto N, Chastain PD, Parniewski P , OhshimaK, Pandolfo M, Griffith JD, et al. Sticky DNA: self-association properties of long GAA.TTC repeats inR.R.Y triplex structures from Friedreich’s ataxia. MolCell 1999; 3:465-75; PMID:10230399; http://dx.doi.org/10.1016/S1097-2765(00)80474-8.17. Heidenfelder BL, Makhov AM, Topal MD. Hairpinformation in Friedreich’s ataxia triplet repeat expansion.J Biol Chem 2003; 278:2425-31; PMI D:12441336;/10.1074/jbc.M210643200.18. LeProust EM, Pearson CE, Sinden RR, Gao X. Unexpected formation of parallel duplex in GAA and TTC trinucleotide repeats of Friedreich’s ataxia. J MolBiol 2000; 302:1063-80; PM D:11183775; http:///10.1006/jmbi.2000.4073.19. McIvor EI, Polak U, Napierala M. New insights into repeat instability: role of RNA•DNA hybrids. RNABiol 2010; 7:551-8; PMI D:20729633; http://dx.doi.org/10.4161/rna.7.5.12745.20. Chandok GS, Kapoor KK, Brick RM, Sidorova JM, Krasilnikova MM. A distinct first replication cycleof DNA introduced in mammalian cells. NucleicAcids Res 2011; 39:2103-15; PMID:21062817; http:///10.1093/nar/gkq903.21. Sakamoto N, Ohshima K, Montermini L, Pandolfo M, Wells RD. Sticky DNA, a self-associated complexformed at long GAA*TTC repeats in intron 1 of thefrataxin gene, inhibits transcription. J Biol Chem2001; 276:27171-7; PMI D:11340071; http://dx.doi.org/10.1074/jbc.M101879200.22. Krasilnikova MM, Mirkin SM. Analysis of tripletrepeat replication by two-dimensional gel electro-phoresis. Methods Mol Biol 2004; 277:19-28;PMID:15201446.23. Friedman KL, Brewer BJ. Analysis of replicationintermediates by two-dimensional agarose gel elec-trophoresis. Methods Enzymol 1995; 262:613-27; PM I D:8594382; /10.1016/0076-6879(95)62048-6.24. Frank-Kamenetskii MD, Mirkin SM. T riplex DNA structures. Annu Rev Biochem 1995; 64:65-95; PM D:7574496; /10.1146/annurev.bi.64.070195.000433.25. Lucas I, Hyrien O. Hemicatenanes form upon inhibition of DNA replication. Nucleic Acids Res 2000; 28:2187-93; PM D:10773090; /10.1093/nar/28.10.2187.26. McLay DW, Clarke HJ. Remodelling the paternal chromatin at fertilization in mammals. Reproduction 2003; 125:625-33; PM D:12713425; /10.1530/rep.0.1250625.because they contain one strand synthe-sized in bacteria.The replication intermediates digested with DpnI did not contain the spot 3, cor-responding to the complex between two GAA stretches (Fig. 3C ). We suggest that the absence of the complex is due to the chromatin coverage of the plasmid that accompanies replication. This is similar to our observation that GAA repeats only block replication during the first replica-tion round, until the chromatin is formed. The replication blockage that we have pre-viously observed is consistent with forma-tion of a triplex that occurs in transfected DNA only prior to nucleosome cover-age.1 Here, the complex between the two (GAA)57 repeats also occurred only with-out the chromatin structure. The absence of the complex in replicated DNA also shows that the complexes that we observe are not an artifact of the isolation and sub-sequent treatment of our intermediates, since then they would exist in at least some fraction of the replicated DNA as well.The question remains whether the non-B DNA structures can form within GAA repeats in mammalian cells since their formation requires DNA stretches that are not folded in chromatin. A win-dow when these complexes can form during development is the spermatogen-esis when the maturing sperm chromatin changes from nucleosome- to protamine-bound assembly.26 Another opportunity to form complexes comes when the chroma-tin of a sperm and an egg restructure after the fusion of the gamets.26,27 This is asso-ciated with degradation of protamines and nucleosome deposition, as the zygote DNA may lack a compact chromatin structure.28 It should be noted that the expansions in Friedreich ataxia were traced to the early divisions of the zygote.7An opportunity for the complexes to form may also exist in cancer cells. It is known that some regions of their genome are overmethylated and convert in hetero-chromatin, while other regions are under-methylated, which may promote a loose chromatin packaging.29,30It is not clear whether the two-repeats complexes would compete with triplex structure formation within each individ-ual (GAA)57 repeat. It is possible that both of them exist and contribute to overallgenomic instability. However, a separate study is necessary to determine whether these structures indeed have a biological role.Disclosure of Potential Conflicts of InterestNo potential conflicts of interest weredisclosed.Acknowledgments This study was supported by NI H grant GM087472, and research grant from Friedreich’s Ataxia Research Alliance toMMK.References 1. Chandok GS, Patel MP , Mirkin SM, Krasilnikova MM.Effects of Friedreich’s ataxia GAA repeats on DNAreplication in mammalian cells. Nucleic Acids Res2012; 40:3964-74; PM D:22262734; http://dx.doi.org/10.1093/nar/gks021.2. Kelkar YD, Tyekucheva S, Chiaromonte F , MakovaKD. The genome-wide determinants of humanand chimpanzee microsatellite evolution. GenomeRes 2008; 18:30-8; PMI D:18032720; http://dx.doi.org/10.1101/gr.7113408.3. Sharma R, Bhatti S, Gomez M, Clark RM, MurrayC, Ashizawa T, et al. The GAA triplet-repeat sequencein Friedreich ataxia shows a high level of somaticinstability in vivo, with a significant predilection forlarge contractions. Hum Mol Genet 2002; 11:2175-87; PM I D:12189170; /10.1093/hmg/11.18.2175.4. Pandolfo M. The molecular basis of Friedreichataxia. Adv Exp Med Biol 2002; 516:99-118;PM D:12611437; /10.1007/978-1-4615-0117-6_5.5. Pandolfo M. Friedreich ataxia. Arch Neurol 2008;65:1296-303; PM I D:18852343; http://dx.doi.org/10.1001/archneur.65.10.1296.6. Campuzano V, Montermini L, Moltò MD, PianeseL, Cossée M, Cavalcanti F , et al. Friedreich’s ataxia:autosomal recessive disease caused by an intronic GAAtriplet repeat expansion. Science 1996; 271:1423-7; PM ID:8596916; /10.1126/sci-ence.271.5254.1423.7. De Michele G, Cavalcanti F , Criscuolo C, Pianese L,Monticelli A, Filla A, et al. Parental gender, age at birthand expansion length influence GAA repeat intergener-ational instability in the X25 gene: pedigree studies andanalysis of sperm from patients with Friedreich’s ataxia.Hum Mol Genet 1998; 7:1901-6; PMI D:9811933; /10.1093/hmg/7.12.1901.8. De Biase I , Rasmussen A, Monticelli A, Al-MahdawiS, Pook M, Cocozza S, et al. Somatic instability of theexpanded GAA triplet-repeat sequence in Friedreich ataxia progresses throughout life. Genomics 2007;90:1-5; PMID:17498922; /10.1016/j.ygeno.2007.04.001.9. De Biase I , Rasmussen A, Endres D, Al-Mahdawi S,Monticelli A, Cocozza S, et al. Progressive GAA expan-sions in dorsal root ganglia of Friedreich’s ataxia patients.Ann Neurol 2007; 61:55-60; PMID:17262846; http:///10.1002/ana.21052.10. Du J, Campau E, Soragni E, Ku S, Puckett JW,Dervan PB, et al. Role of mismatch repair enzymesin GAA·TTC triplet-repeat expansion in Friedreichataxia induced pluripotent stem cells. J Biol Chem2012; 287:29861-72; PMID:22798143; http://dx.doi.org/10.1074/jbc.M112.391961.29. Watanabe Y, Maekawa M. Methylation of DNAin cancer. Adv Clin Chem 2010; 52:145-67; PM D:21275343; /10.1016/S0065-2423(10)52006-7.30. Kulis M, Esteller M. DNA methylation and cancer.Adv Genet 2010; 70:27-56; PMID:20920744; /10.1016/B978-0-12-380866-0.60002-2.27. Spinaci M, Seren E, Mattioli M. Maternal chromatinremodeling during maturation and after fertilization in mouse oocytes. Mol Reprod Dev 2004; 69:215-21; PM ID:15293223; /10.1002/mrd.20117.28. I mschenetzky M, Puchi M, Gutierrez S, MontecinoM. Sea urchin zygote chromatin exhibit an unfolded nucleosomal array during the first S phase. J Cell Biochem 1995; 59:161-7; PM D:8904310; /10.1002/jcb.240590205.。
生物英文文献
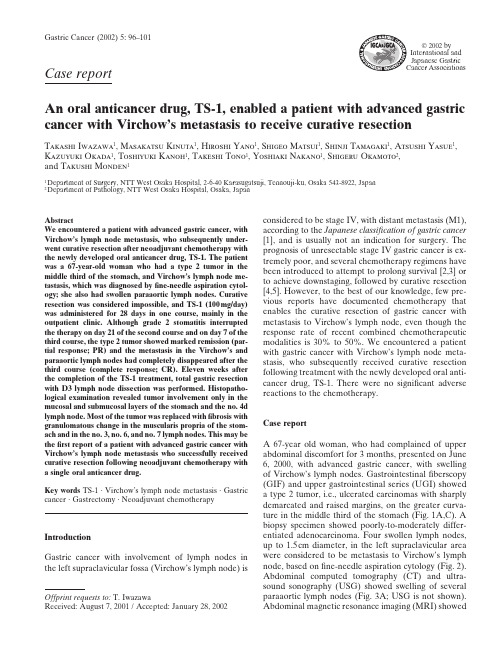
2002 by International and Japanese Gastric Case reportAn oral anticancer drug, TS-1, enabled a patient with advanced gastric cancer with Virchow’s metastasis to receive curative resectionT akashi I wazawa 1, M asakatsu K inuta 1, H iroshi Y ano 1, S higeo M atsui 1, S hinji T amagaki 1, A tsushi Y asue 1,K azuyuki O kada 1, T oshiyuki K anoh 1, T akeshi T ono 1, Y oshiaki N akano 1, S higeru O kamoto 2,and T akushi M onden 11Department of Surgery, NTT West Osaka Hospital, 2-6-40 Karasugatsuji, Tennouji-ku, Osaka 543-8922, Japan 2Department of Pathology, NTT West Osaka Hospital, Osaka, Japanconsidered to be stage IV, with distant metastasis (M1),according to the Japanese classification of gastric cancer [1], and is usually not an indication for surgery. The prognosis of unresectable stage IV gastric cancer is ex-tremely poor, and several chemotherapy regimens have been introduced to attempt to prolong survival [2,3] or to achieve downstaging, followed by curative resection [4,5]. However, to the best of our knowledge, few pre-vious reports have documented chemotherapy that enables the curative resection of gastric cancer with metastasis to Virchow’s lymph node, even though the response rate of recent combined chemotherapeutic modalities is 30% to 50%. We encountered a patient with gastric cancer with Virchow’s lymph node meta-stasis, who subsequently received curative resection following treatment with the newly developed oral anti-cancer drug, TS-1. There were no significant adverse reactions to the chemotherapy.Case reportA 67-year old woman, who had complained of upper abdominal discomfort for 3 months, presented on June 6, 2000, with advanced gastric cancer, with swelling of Virchow’s lymph nodes. Gastrointestinal fiberscopy (GIF) and upper gastrointestinal series (UGI) showed a type 2 tumor, i.e., ulcerated carcinomas with sharply demarcated and raised margins, on the greater curva-ture in the middle third of the stomach (Fig. 1A,C). A biopsy specimen showed poorly-to-moderately differ-entiated adenocarcinoma. Four swollen lymph nodes,up to 1.5cm diameter, in the left supraclavicular area were considered to be metastasis to Virchow’s lymph node, based on fine-needle aspiration cytology (Fig. 2).Abdominal computed tomography (CT) and ultra-sound sonography (USG) showed swelling of several paraaortic lymph nodes (Fig. 3A; USG is not shown).Abdominal magnetic resonance imaging (MRI) showedGastric Cancer (2002) 5: 96–101AbstractWe encountered a patient with advanced gastric cancer, with V irchow’s lymph node metastasis, who subsequently under-went curative resection after neoadjuvant chemotherapy with the newly developed oral anticancer drug, TS-1. The patient was a 67-year-old woman who had a type 2 tumor in the middle third of the stomach, and Virchow’s lymph node me-tastasis, which was diagnosed by fine-needle aspiration cytol-ogy; she also had swollen paraaortic lymph nodes. Curative resection was considered impossible, and TS-1 (100mg/day)was administered for 28 days in one course, mainly in the outpatient clinic. Although grade 2 stomatitis interrupted the therapy on day 21 of the second course and on day 7 of the third course, the type 2 tumor showed marked remission (par-tial response; PR) and the metastasis in the V irchow’s and paraaortic lymph nodes had completely disappeared after the third course (complete response; CR). Eleven weeks after the completion of the TS-1 treatment, total gastric resection with D3 lymph node dissection was performed. Histopatho-logical examination revealed tumor involvement only in the mucosal and submucosal layers of the stomach and the no. 4d lymph node. Most of the tumor was replaced with fibrosis with granulomatous change in the muscularis propria of the stom-ach and in the no. 3, no. 6, and no. 7 lymph nodes. This may be the first report of a patient with advanced gastric cancer with V irchow’s lymph node metastasis who successfully received curative resection following neoadjuvant chemotherapy with a single oral anticancer drug.Key words TS-1 · Virchow’s lymph node metastasis · Gastric cancer · Gastrectomy · Neoadjuvant chemotherapyIntroductionGastric cancer with involvement of lymph nodes in the left supraclavicular fossa (Virchow’s lymph node) isOffprint requests to: T. IwazawaReceived: August 7, 2001 / Accepted: January 28, 2002thickening of the gastric wall and tumor invasion to the gastric serosa (Fig. 1E). The patient was given a diagno-sis of stage IV (cT3, cN3, cP0, cH0, cM1) advanced gastric cancer with extensive lymph node metastasis,even though no distant metastasis to the liver, lung,bone, or peritoneum was diagnosed by CT, USG, or bone scintigraphy. The performance status of this pa-tient was grade 0, and laboratory examination results were within the normal ranges, except for a high level of carbohydrate antigen (CA)19-9 (283U/ml). Because curative resection was impossible for this patient, che-motherapy, using TS-1, was started, on 22 June, 2000.TS-1, 100mg, was administered orally every day for 28 days, followed by a 14-day cessation as one course;the drug was administered mainly in the outpatient clinic. One course resulted in the complete disappear-ance of the swollen Virchow ’s lymph nodes, but slightly swollen paraaortic lymph nodes still remained on USG.GIF showed marked reduction of the gastric tumor, but the presence of malignant cells was demonstrated by biopsy. During the second course of TS-1 administra-tion, the patient had grade 2 stomatitis, so that the administration of TS-1 was interrupted on day 21. Al-though the third course of the treatment started after 35days of rest, grade 2 stomatitis interrupted the adminis-tration again, on day 7. After this treatment, effective-ness was evaluated with UGI, GIF, CT, USG, and MRI.UGI and GIF revealed that the type 2 tumor had changed to an ulcer scar with fold convergence and a small elevated lesion (Figs. 1B,D; 4A), in which adeno-carcinoma was proven by histological examination of the biopsy specimen. Dynamic abdominal MRI showed marked reduction of wall thickness after TS-1 adminis-tration and, finally, no serosal tumor invasion was dem-onstrated (Fig. 1F). Abdominal CT did not show anyregional or paraaortic lymph node swelling (Fig. 3B),Fig. 1.A,B Upper gastrointestinal series shows a protruding lesion with a crater on the greater cur-vature of the middle third of the stomach before treatment (A ); the crater and margin of the tumor were flattened after treatment (B ). Evaluation of the response was partial response (PR). C,D Endo-scopic findings show an irregularly shaped tumor with a crater before treatment (C ); the lesion had markedly regressed and flattened after treatment (D ). E,F Abdominal dynamic magnetic resonance imaging (MRI) shows the thickness of gastric wall with high intensity (arrow ) before treatment (E );the gastric wall became thinner (arrow ) and the serosal surface became smooth after treatment (F )abdominal USG showed a marked reduction of para-aortic lymph nodes (data not shown), and Virchow ’s lymph node was not palpable. The serum level of CA19-9 decreased to within the normal range, at 18U/ml.Therefore, we concluded that curative resection could be achieved.Total gastrectomy with splenectomy and D3 lymph node dissection was performed on November 8, 2000,and no invasion to neighboring organs, no peritoneal dissemination, and no hepatic metastasis was recog-nized, and peritoneal cytology was negative. Histo-pathological examination showed submucosal invasion of a predominantly mucinous adenocarcinoma in a small elevated gastric lesion. Only xanthoma cells in fil-trated the ulcer scar (Fig. 4A,B,C,D,E). Metastasis was found in only one lymph node, along the right gastroepi-ploic vessels (no. 4d), and no cancer cells were found in any other lymph nodes, including the paraaortic lymph nodes (no. 16a2 and 16b1). Necrosis and disappearance of the tumor, with granulomatous change, were ob-served in lymph nodes along the lesser curvature (no.3), infrapyloric lymph nodes (no. 6), and lymph nodes along the left gastric artery (no. 7) (Fig. 4F). Eventually,the final stage was determined to be T1, N1, P0, CY0,H0, Mx, and the curability of the surgical procedure was B (no residual tumors, but not evaluable as “curability A ”). No signs of recurrence have been revealed by any examination 1 year after the surgery.DiscussionUnresected gastric cancer has been treated by several regimens of combined chemotherapy. Some random-ized control reports have documented that chemo-therapy for gastric cancer patients with grade 0–2performance status improved survival compared with best supportive care [6–8]. FAMTX (5-fluorouracil [5-FU] combined with Adriamycin [ADM] and Meth-otrexate [MTX]) is considered to be standard chemo-therapy in Western countries [9,10]; however, it has not been accepted in Japan because of its severe toxicity.Fig. 2.Fine-needle aspiration cytology of Virchow ’s lymph node revealed a large number of adenocarcinoma cells with clear nuclei, a high nuclear/cytoplasmic (N/C) ratio, and mitosis. Papanicolaou stain, ϫ1000Fig. 3A,B.Enhanced abdominal com-puted tomography (CT) showed that lymph nodes around the abdominal aorta (no. 16a2) were swollen (arrow ) before treatment (A ); the swollen lymph nodes disappeared after treatment (B )According to a J apanese Clinical Oncology Group (J COG) study, FP (5-FU combined with cisplatin [CDDP]) therapy has better response rates than UFTM (UFT [tegafur, uracil] combined with mitomycin C [MMC]) and 5-FU alone [11], and continuous low-dose FP is used widely in Japan because of its high response rate, which is equal to that of the original FP protocol, with less toxicity [12]. The response rates of these che-motherapy regimens have improved to 30%–50%, but no regimen yields better survival than continuous injec-tion of 5-FU alone. Most patients suffer side effects, and often need long hospitalization for systemic chemo-therapy, and thus, more effective anticancer drugs with milder toxicity are needed.TS-1 is a newly developed oral anticancer drug, which consists of tegafur, gimeracil, and oteracil potassium at a molecular ratio of 1:0.4:1, based on the biochemical modulation of 5-FU [13]. Gimeracil competitively in-hibits dihydropyrimidine dehydrogenase, is produced in various organs, including tumor tissues, and rapidly degrades 5-FU [14]. Oteracil potassium is an inhibitor of orotate phosphoribosyltransferase that catalyzes theFig. 4.A Macroscopic findings show anulcer scar with fold convergence andneighboring small elevated lesion on thegreater curvature in the middle third ofthe stomach B–F Histological findingsshowed that the gastric tumor was re-placed by fibrosis with granulomatouschanges and xanthoma cell infiltration inthe ulcer scar (B, C, D) and regionallymph nodes (F). Dominantly mucinousadenocarcinoma with tubular adenocarci-noma invaded the submucosal layer of theelevated lesion (B, F). B H&E, ϫ4; CH&E, ϫ40; D H&E, ϫ100; E H&E, ϫ40;F H&E, ϫ100phosphorylation of 5-FU, a process that is considered to be responsible for the toxic effects of 5-FU. Oteracil potassium is mainly distributed in the gastrointestinal tract after oral administration to rats, and induces ame-lioration of the gastrointestinal toxicity induced by 5-FU [15]. TS-1 induced a 53.6% response rate for gastric cancer in an early phase II study [16] and a response rate of 49% in a late phase II study [17], with a 35.7% adverse reaction rate in the early phase II study and a 20% adverse reaction rate in the late phase II study. Not only is the response rate the highest for a single agent but also this oral anticancer drug does not require patient hospitalization, because of its mild toxicity. TS-1 was more effective for lymph node metastasis (re-sponse rate of cervical lymph nodes, 68.4%; abdominal lymph nodes, 49.2%) than for the primary lesion (32.6%), lung metastasis (22.2%), or liver metastasis (35.1%) in a phase II study. The present patient had lymph node metastasis at a distant site (Virchow’s and paraaortic lymph nodes), but no metastasis to other organs, and no invasion to surrounding organs. Also,the performance status of the patient was grade 0, andshe had no problems ingesting food. Therefore, this patient was a good candidate for neoadjuvant chemo-therapy with the oral anticancer drug, TS-1. In fact, the metastasis in Virchow’s lymph node completely disap-peared (CR) and the gastric tumor was reduced by more than 50% by TS-1; consequently, curative surgical resection could be performed. Histopathological exami-nations showed viable cancer cells to exist only in the mucosal and submucosal layer of stomach and in a group 1 lymph node, but not in any group 2 and group 3 lymph nodes, including paraaortic lymph nodes. More than two-thirds of the gastric tumor was replaced by fibrosis with granulomatous changes, in particular in the submucosal lesion and some regional lymph nodes. The response was classified as category grade 2, moderate change, according to Japanese classification of gastric carcinoma. The final stage was T1 N1 P0 CY0 H0 Mx, and the level of curability of the surgery was B.A few reports in Japan have documented the success-ful treatment of gastric cancer with Virchow’s lymph node metastasis by chemotherapy. Ohyama et al. [18] reported a patient with advanced gastric cancer with Virchow’s and paraaortic lymph node metastasis who completely responded to a four-drug combination che-motherapy. Pathological examination revealed no tu-mor cells in the primary lesion or in any dissected nodes, including Virchow’s nodes, although recurrence devel-oped 18 months after surgery [18]. Three reports have documented that Virchow’s lymph node metastasis disappeared after low-dose FP chemotherapy, and that, consequently, gastrectomy could be performed, al-though paraaortic lymph node metastasis was histologi-cally proven in all three patients [19–21]. Nakaguchi et al. [22] reported that Virchow’s lymph node metastasis disappeared after treatment with an oral anticancer drug, 5Ј-deoxy-5-fluorouridine (5Ј-DFUR), and, con-sequently, distal gastrectomy was performed, but it was not curative surgery because of paraaortic lymph node metastasis. Therefore, the present report appears to be the first report of curative resection of advanced gastric cancer after the disappearance of Virchow’s lymph node metastasis induced by neoadjuvant chemotherapy with a single oral anticancer drug. Complete response should be confirmed by longer observation. Although it is not yet known whether the overall survival of this patient has been improved, this case suggests that TS-1 is an effective anticancer drug for advanced gastric cancer with extended lymph node metastasis. More-over, this oral agent has the advantage of not requiring hospitalization for patients with good performance sta-tus, because of its mild toxicity.Acknowledgment The authors gratefully acknowledge the assistance of Dr. Ogura, who provided UGI films before the treatment.References1.J apanese Gastric Cancer Association. J apanese classification ofgastric carcinoma. 2nd English ed. Gastric Cancer 1998;1:10–24.2.Preusser P, Wilke H, Achterrath W, Fink U, Lenaz L, HeinickeA, et al. Phase II study with the combination etoposide, doxoru-bicin, and cisplatin in advanced measurable gastric cancer. J Clin Oncol 1989;7:1310–7.3.Boku N, Ohtsu A, Shimada Y, Shirao K, Seki S, Saito H, et al.Phase II study of a combination of irinotecan and cisplatin against metastatic gastric cancer. J Clin Oncol 1999;17:319–23.4.Nakajima T, Ota K, Ishihara S, Oyama S, Nishi M, Ohashi Y, et al.Combined intensive chemotherapy and radical surgery for incur-able gastric cancer. Ann Surg Oncol 1997;4:203–8.5.Yonemura Y, Sawa T, Kinoshita K, Matsuki N, Fushida S,Tanaka S, et al. Neoadjuvant chemotherapy for high-grade advanced gastric cancer. World J Surg 1993;17:256–62.6.Murad AM, Santiago FF, Petroianu A, Rocha PRS, RodriguesMAG, Rausch M. Modified therapy with 5-fluorouracil, doxoru-bicin, and methotrexate in advanced gastric cancer. Cancer 1993;72:37–41.7.Glimelius B, Hoffman K, Haglund U, Nyren O, Sjoden PO. Initialor delayed chemotherapy with best supportive care in advanced gastric cancer. Ann Oncol 1994;5:189–90.8.Pyrhonen S, Kuitunen T, Nyandoto P, Kouri M. Randomizedcomparison of fluorouracil, epidoxorubicin and methotrexate (FEMTX) plus supportive care with supportive care alone in patients with non-resectable gastric cancer. Br J Cancer 1995;71: 587–91.9.Wils JA, Klein HO, Wagener DJT, Bleiberg H, Reis H, KorstenF, et al. Sequential high-dose methotrexate and fluorouracil com-bined with doxorubicin – a step ahead in the treatment of advanced gastric cancer: a trial of the European Organization for Research and Treatment of Cancer Gastrointestinal Tract Cooperative Group. J Clin Oncol 1991;9:827–31.10.Kelsen D, Atiq OT, Saltz L, Niedzwiecki D, Ginn D, Chapman D,et al. FAMTX versus etoposide, doxorubicin, and cisplatin: a random assignment trial in gastric cancer. J Clin Oncol 1992;10: 541–8.11.Shimada Y, Shirao K, Ohtsu A, Hyodo I, Saito H, Yamamichi N,et al. Phase III study of UFT ϩ MMC versus 5-FU ϩ CDDP versus 5-FU alone in patients with advanced gastric cancer: JCOG study 9205. Proc Am Soc Clin Oncol 1999;18:1043.12.Chung YS, Yamashita Y, Nakata B, Nitta A, Inoue T, HirayamaK, et al. Combination therapy of 5-FU and low dose CDDP for advanced and recurrent gastric cancer. Jpn J Cancer Chemother 1995;22:149–51.13.Shirasaka T, Nakano K, Takechi T, Satake H, Uchida J, FujiokaA, et al. Antitumor activity of 1M tegafur-0.4M 5-chloro-2,4-dihydroxypyridine-1M potassium oxonate (S-1) against human colon carcinoma orthotopically implanted into nude rats. Cancer Res 1996;56:2602–6.14.Shirasaka T, Shimamoto Y, Ohshimo H, Yamaguchi M, Kato T,Yonekura K, et al. Development of a novel form of an oral 5-fluorouracil derivative (S-1) directed to the potentiation of the tumor selective cytotoxicity of 5-fluorouracil by two biochemical modulators. Anticancer Drugs 1996;7:548–57.15.Takechi T, Nakano K, Uchida J, Mita A, Toko K, Takeda S, et al.Antitumor activity and low intestinal toxicity of S-1, a new formu-lation of oral tegafur, in experimental tumor models in rats.Cancer Chemother Pharmacol 1997;39:205–11.16.Sugimachi K, Maehara Y, Horikoshi N, Shimada Y, Sakata Y,Mitachi Y, et al. An early phase II study of oral S-1, a newly developed 5-fluorouracil derivative for treating patients with advanced and recurrent gastrointestinal cancers. Oncology 1999;57:202–10.17.Sakata Y, Ohtsu A, Horikoshi N, Sugimachi K, Mitachi Y,Taguchi T. Late phase II study of novel oral fluoropyrimidineanticancer drug S-1 (1M Tegafur-0.4M gimestat-1M otastat potassium) in advanced gastric cancer patients. Eur J Cancer 1998;34:1715–20.18.Ohyama S, Komatsu O, Nakajima T, Ohta K, Takahashi T,Yanagisawa A. Case report of pathological complete remission with FLEP therapy. In: Nakajima T, Yamaguchi T, editors.Multimodality therapy for gastric cancer. Berlin Heidelberg New York Tokyo: Springer-Verlag; 1999. pp. 104–7.19.Umehara Y, Okubo T, Sano Y, Sakamoto R, Nakamura T,Tsuchiya Y, et al. A case of advanced gastric remnant carcinoma with Virchow’s metastasis treated with neoadjuvant chemo-therapy (low dose CDDP ϩ 5-FU) followed by surgical resection.Jpn J Cancer Chemother 1995;22:277–9.20.Kajihara K, Ishikawa H, Akama, F, Ninomiya H, Shigeta K, SanoI, et al. A case of advanced gastric cancer with Virchow’s metasta-sis responding remarkably to combination chemotherapy of low-dose CDDP and 5-FU. Jpn J Cancer Chemother 1998;25:585–8.21.Wada Y, Kamiya N, Asano S, Shinya F. A case of advancedgastric cancer with Virchow’s and paraaortic lymph node me-tastases successfully resected after combined chemotherapy of low-dose CDDP and 5-FU. Jpn J Cancer Chemother 2001;28:79–82.22.Nakaguchi K, Nakano Y, Kitahara T, Onoe K, Nagamine H,Fukuda H. A resected case of gastric carcinoma with complete remission of Virchow’s node metastasis by 5Ј-DFUR administra-tion. Jpn J Cancer Chemother 1990;17:2101–4.。
- 1、下载文档前请自行甄别文档内容的完整性,平台不提供额外的编辑、内容补充、找答案等附加服务。
- 2、"仅部分预览"的文档,不可在线预览部分如存在完整性等问题,可反馈申请退款(可完整预览的文档不适用该条件!)。
- 3、如文档侵犯您的权益,请联系客服反馈,我们会尽快为您处理(人工客服工作时间:9:00-18:30)。
Application of α-amylase and Researchα-amylase to be widely distributed throughout microorganisms to higher plants. The International Enzyme classification number is EC. 3.2.1.1, acting on the starch from the starch molecules within the random cut α a 1,4 glycosidic bond to produce dextrin and reducing sugar, because the end product of carbon residues as Α configuration configuration, it is called α-amylase. Now refers to α-amylase were cut from the starch molecules within the α-1,4 glycosidic bond from the liquefaction of a class of enzymes.α-amylase is an important enzyme, a large number of used food processing, food industry, brewing, fermentation, textile industry and pharmaceutical industries, which account for the enzyme about 25% market share. Currently, both industrial production to large-scale production by fermentation α-amylase. α-amylase in industrial applications1.1 The bread baking industry, as a preservative enzymes used in baking industry, production of high quality products have been hundreds of years old. In recent decades, malt and microbial α-amylase, α-amylase is widely used in baking industry. The enzymes used for making bread, so that these products are much larger, better colors, more soft particles.Even today, baking industry have been α-amylase from barley malt and bacterial, fungal leaf extract. Since 1955 and after 1963 in the UK GRAS level validation, fungal amylase, has served as a bread additive. Now, they are used in different areas. Modern continuous baking process, add in f lour α-amylase can not only increase the fermentation rate and reduce dough viscosity (improving product volume and texture) to increase the sugar content in the dough, improved bread texture, skin color and baking quality, but also to extend the preservation time for baked goods. In the storage process, the bread particles become dry, hard, not crisp skin, resulting in deterioration of the taste of bread. These changes collectively referred to as degenerate. Each year simply because the losses caused by deterioration of bread more than 100 million U.S. dollars. A variety of traditional food additives are used to prevent deterioration and improve the texture and taste of baked goods. Recently, people started to pay attention enzyme as a preservative, preservative agent in improving the role of the dough, as amylopectin, amylase enzyme and a match can be effectively used as a preservative. However, excessive amylase causes a sticky bread too. Therefore, the recent trend is the use of temperature stability (ITS) α a amylase activity are high in starch liquefaction, but the baking process is completed before the inactivation. Despite the large number of microbes have been found to produce α-amylase, but with the temperature stability of the nature of the α-amylase only been found in several microorganisms.1.2 starch liquefaction and saccharification of the main α-amylase starch hydrolysis product market, such as glucose and fructose. Starch is converted into high fructose corn syrup (HFCS). Because of their high sweetness, are used in the soft drink beverage industry sweeteners. The liquefaction process is used in thermal stability at high temperature α-amylase. α-amylase in starch liquefaction ofthe application process is already quite mature, and many relevant reports.1.3 fiber desizing modern fiber manufacturing process in knitting yarn in the process will produce large amounts of bacteria, to prevent these yarn faults, often increase in the surface layer of the yarn can remove the protective layer. The surface layer of the material there are many, starch is a very good choice because it is cheap and easy to obtain, and can be easily removed. Starch desizing α-amylase can be used, it can selectively remove the starch without harming the yarn fibers, but also random degradation of starch dextrin soluble in water, and are easily washed off. 1.4 Paper Industry amylase used in the paper industry mainly to improve the paper coating starch. Paste on the paper is primarily to protect the paper in the process from mechanical damage, it also improved the quality of finished paper. Paste to improve the hardness and strength of paper, enhanced erasable paper, and is a good paper coating. When the paper through two rolls, the starch slurry is added the paper. The process temperature was controlled at 45 ~ 6O ℃, need a stable viscosity of starch. Grinding can also be controlled according to different grades of paper starch viscosity. Nature of the starch concentration is too high for the sizing of paper, you can use part of α-amylase degradation of starch to adjust.1.5 Application of detergents in the enzyme is a component of modern high-efficiency detergents. Enzymes in detergents in the most important function is to make detergents more modest sound. Automatic dishwasher detergents early is very rough, easy to eat when the body hurts, and on ceramics, wood tableware can also cause damage. α-amylase was used from 1975 to washing powder. Now, 90% of the liquid detergents contain an amylase, and automatic dishwasher detergents α-amylase on demand is also growing. α 1 amylase ca2 + is too sensitive to low ca2 + in the stability of poor environment, which limits an amylase in the remover in. And, most of the wild-type strains produced an amylase on raw materials as one of the oxidants detergents are too sensitive. Keep household detergents, this limitation by increasing the number of process steps can be improved. Recently, two major manufacturers of detergents NovozymesandGcncncoreInternational enzyme protein technology has been used to improve the stability of amylase bleaching. They leucine substitution of Bacillus licheniformis α-amylase protein in the first 197 on the methionine, resulting in enzymes of the oxidant component of resistance increased greatly enhanced the oxidation stability of the enzyme stability during storage better. The two companies have been pushing in the market these new products.1.6 Pharmaceutical and clinical chemical analysis with the continuous development of biological engineering, the application of amylase involved in many other areas, such as clinical, pharmaceutical and analytical chemistry. Have been reported, based on the liquid α-amylase stability of reagents have been applied to automatic biochemical analyzer (CibaComingExpress) clinical chemistry system. Amylase has been established by means of a method of detecting a higher content of oligosaccharides, is said this method is more than the effective detection method of silver nitrate.2.1 Research amylase α-amylase enzymes in domestic production and application in 1965, China began to apply for a 7658 BF Bacillus amyloliquefaciens amylase production of one, when only exclusive manufacturing plant in Wuxi Enzyme. 1967 Hangzhou Yi sugar to achieve the application of α-amylase production of caramel new technology can save 7% ~ 10% malt, sugar, increase the rate of 10%.1964, China began a process of enzymatic hydrolysis of starch production of glucose. In September l979 injection of glucose by the enzyme and identification of new technology and worked in North China Pharmaceutical Factory, Hebei Dongfeng Pharmaceutical Factory, Zhengzhou Songshan applied pharmaceutical units and achieved good economic benefits. Compared with the traditional acid to improve the yield of 10% Oh, cost more than 15%. In addition to enzyme for citric acid production in China, glutamic acid fermentation system for beer saccharification, fermentation, rice wine, soy sauce manufacture, vinegar production also has been studied and put into production successfully.2.2 Overseas Researc h α-amylase, present, and in addition a large number of T for conventional mutation breeding, the overseas production has been initially figure out the regulation of α-amylase gene, the transduction of the transformation and gene cloning techniques such as breeding. The Bacillus subtilis recombinant gene into the production strain to increase α-amylase yield of 7 to 10 times and has been used in food and the wine industry, for breeding high-yield strains of α-amylase to create a new way.2.3 domestic and foreign research institutions and major research direction as α-amylase is an important value of industrial enzymes, weekly discussion group and outside it was a lot of research. Representative of the domestic units: Sichuan University, major research produc tion of α-amylase strains and culture conditions; Jiangnan University, the main research structure of α-amylase and application performance, such as heat resistance, acid resistance; Northwest universities, major research denatured α-amylase and the environment on the mechanism of α-amylase; South China University of Technology, the main α-amylase of immobilization and dynamic nature; there Huazhong Agricultural University, Chinese Academy of Sciences Institute of Applied Ecology in Shenyang, Tianjin University, Nankai University, College of Life Sciences, Chinese Academy of Agricultural Sciences, Chinese Academy of Sciences Institute of Microbiology and a number of research institutions on a variety of bacterial α-amylase production of a amylase gene cloning and expression. Representative of foreign research units are: Canada UniversityofBritishColumbia, they were a pancreatic amylase structure and mechanism of in-depth research; Denmark's Carlsberg Research Laboratory of the main structure of barley α-amylase domain and binding sites; U.S. WesternRegionalResearchCenter major study α-amylase in barley and the role of antibiotics and the barley α-amylase active site.3, α-amylase conclusion has become the industrial application of one of the most important enzymes, and a large number of micro-organisms can be used for efficient production of amylase, but large-scale commercial production of the enzyme is still limited to some specific fungi and bacteria. For the effective demandfor α-amylase more and more, this enzyme by chemical modification of existing or improved technology through the white matter are. Benefit from the development of modern biotechnology, α an amylase in the pharmaceutical aspects of growing importance. Of course, the food and starch indust ries is still the main market, α amylase in these areas, a demand is still the largest.Journal of Southeast University(English Edition)2008 24(4)。