Qcapture pro软件操作说明
QTP11操作手册整理

第一章欢迎使用Quick Test Professional1.1QTP的背景知识◆QTP是HP公司花了45个亿收购的美科利产品套件之一◆QTP是继WR产品之后推出的以VBS内嵌语言的工具◆QTP是一款用于功能测试的自动化测试工具◆QTP可以和HP的QC产品协作进行自动化测试开发(BPT)◆QTP是一款容易掌握但价格很高的测试自动化工具HP Quick Test Professional支持功能测试和回归测试自动化,用于每个主要软件应用程序和环境,此解决方案使用关键字驱动的测试概念,简化了测试创建和维护过程,它使测试人员能够使用专业的捕获技术直接从应用程序屏幕中捕获流程来构建测试案例。
测试专家还可以通过集成的脚本和调试环境完全访问内在测试和对象属性。
自动化测试包括单元测试自动化,性能自动化,功能自动化。
QTP就属于是功能自动化测试。
1.2QTP文档的概述本手册分成十章课程,在每一个课程中你都会以Quick Test 内附的范例Mercury旅游网站为例作为练习的对象,建立并执行自动化测试脚本(script)。
当你完成手册的课程之后,就可以讲这些技巧应用在你的网站上面了:◆Quick Test Professional简介:比较自动测试与手动测试的差别,介绍Quick TestProfessional的测试流程,并熟悉Quick Test使用者接口,以及Mercury旅游范例网站。
◆录制测试脚本:教导你如何录制测试脚本,并且对测试脚本Keyword View做个介绍◆执行并分析测试脚本:示范如何执行测试脚本以及检查测试脚本执行的结果◆建立检查点:说明如何在测试脚本中建立检查点以验证网站上的信息,是你预期的◆参数化:示范如何通过参数化,是你可以在测试脚本中使用多组资料执行测试脚本◆建立输出值:教导你如何将网页上的数据,输出到参数中◆使用万用字符表示法:教导你如何在测试脚本中使用万用字符◆将测试脚本切割成多个测试动作:如何将测试脚本切割成多个动作,让脚本更加模块化◆从这里出发:告诉你哪里可以获得更多的Quick Test的信息。
Qcapturepro软件操作说明
此菜单为高级设置菜单
在这里也可以选择拍摄,也可以点击basicdialog如图41返回原基本对话菜单拍摄;功能和原菜单没有区别,只是选项位置发生变化。
这里可以进行软件安装驱动位置,读取原有设定数值,可视范围和采集范围的调节等。
(图41)
在图像选项卡里(如图:42)可以对要捕捉的图像进行设置,如新建图像、活动图像、连续图像等等。
3.获得菜单:
视频/数字捕获
一般视频捕获
数字/视频捕获(Digital/videocapture)
点击软件上的 (Digital/videocapture)可以弹出功能菜单。
如图:
点击preview可以进行预览,然后在选定好图象的情况下,可以点击snap进行拍摄。
你可以在这里设定6个setting值,右键点击出现saveas可以直接储存,并可以在以后的工作中,直接使用此6个setting。
你已经完成此摄像头在Windows98和WindowsMe系统下的安装。
这个介绍将帮助你在Windows2000系统下安装软件和摄像头驱动程序
1关闭计算机或者拔下摄像头
2运行我们的安装程序(QCaptureSuiteinstaller)
(必须登陆Administratorprivileges安装本软件驱动程序)
(图42)
(图43)
在预览选项卡里可以设置曝光时间、区域、缩放。
(图44)
在捕捉选项卡里也可以设置如时间、面层、捕捉区域。
(图45)
在综合选项卡里可以设置拍摄方式等。
4.序列菜单:
音序器工具条
合并文件
剪切结构
复制结构
删除结构
粘贴结构
增加结构
摘录结构
Tracepro学讲义习教程

Tracepro的系统设置
View>Customize
此处可以设置Tracepro操 作界面中运行方面的参数, 如导航区的位置,模型的 显示方式,模型的颜色, 背景的颜色等等。
13.01.2021
Tracepro模拟步骤
建立模型 光学特性 光源设定 分析功能
13.01.2021
13.01.2021
File>Open
Insert>Part
Tracepro建模
光学软件建模
同时,Tracepro可 以将其他程序建好 的模型,直接读取, 简单方便。如图, 通过Tracepro打开 OSLO文档
13.01.2021
Tracepro光学 模型进行属性的设置光学特 性在Tracepro的模拟中非常 重要,模拟的目的是模拟结 果与实际更为接近。所以光 学特性的定义就是给模拟效 果一个好的起始。
光学软件建模
Tracepro与很多光学模拟软件如ZEMAX,OSLO,Code V等是共用的, 所以可以直接用Tracepro打开这些软件保存的文档。
13.01.2021
Tracepro建模
Tracepro自建模
Tracepro软件本身提供了一个强大 的模型库,使用者可以根据自己的 需要选择不同的模块来建立模型。 其路径就是 :Insert>
Tracepro中并未涵 盖所有我们需要 的介质,但是在 Tracepro中可以根 据自身的需要编 辑特定的面,材 料,薄膜,折射 率等光学介质。
13.01.2021
Tracepro光源设定
Tracepro光源的设定有三种方法:
1.Tracepro自建光源模型,然后进行光源属性定义. 2.Tracepro光源库,其中有部分已经定义好光源参数的光 源 实体模型。 3.光源文件导入。Insert>Source选择需要插入的光源文件.对 于光源文件,有几种符合的格式(*.ray,*.dat,*.src)
ICAP Q Qtegra 软件操作规程

iCAP 7000 Qtegra 软件操作规程1.确认实验条件准备1.1室内湿度达到22~25度,湿度为40~65%,且保持恒定。
1.2打开排风设备, 确认稳压器供电稳定,零地电压<5v1.3确认氩气供应充足,分压调至0.6Mpa. 钢瓶内总压不小于1.5Mpa。
开大量流吹扫仪器半小时(若仪器长是间未开,建议大流量吹扫2小时以上)1.4确认冷却循环水水量充足,打开冷却循环水(确保仪器大量吹扫后开水机),查看水压,未点火之前为85psi.点火后约为75psi。
水温是否设定在20度1.5 安装好蠕动泵管,开泵,设定雾化器流量0.5l/min. 检查进样排废情况。
2.点燃等离子体2.1 打开仪器主机左侧电源开关,双击仪器控制软件 , 打开软件控制界面板. 如下图所示.2.2 确认所有联锁正常,如下图所示, 全部亮绿灯后, 方可以点燃等离子体.2.3 点击控制面板上的, 弹出如下对话框,按实际需要设定点火后的参数. Warm up仪器预热时间, 通常设定为15~20 minutes. Spectrometer Optimization光谱仪优化,建议勾选, Run performance Check 及perform Detection Limit Check为仪器性能检查, 日常测试可不勾选.若使用手动进样, 则将Use Manual Sampling 勾选上. 并设定wash time通常都设定为30s, 若测定样品比较容易残留管路, 可将值设大些, Uptake time 表示样品提升时间,根据进样管路长度设定,通常设定为30s.设置完成后,点击OK, 仪器开始自动预热,按软件提示,将样品管放出纯水中.约20min分钟后,仪器预热及光谱仪优化成功.软件提示success.如下图所示.检查log view (下图红框)中的光谱仪优化后的x,y 值, 要求分别控制在±3以内.2.4 若安装了新的炬管或炬管拆下清洗后重新安装,则需在分析样品前做炬管准直.点击控制面板中的torch alignment。
Qcapture pro软件操作说明
Qcapture pro软件操作说明目录硬件驱动安装 (2)软件程序安装 (6)软件使用说明 (16)1.文件菜单 (17)2.编辑菜单 (17)3.获得菜单 (21)4.序列菜单 (25)5.提高菜单 (26)6.进程菜单 (29)7.措施菜单 (33)8.窗口菜单 (37)9.帮助菜单 (38)这个介绍将帮助你在Windows 98和Windows Me系统下安装软件和摄像头驱动程序1关闭计算机或者拔下摄像头2运行我们的安装程序(QCapture Suite installer)(必须登陆Administrator privileges安装本软件驱动程序)3打开你的摄像头如果你是第一次安装这个摄像头的驱动程序,你需要等待提示为"Building driver information database"的对话框完成安装。
你已经完成此摄像头在Windows 98和Windows Me系统下的安装。
这个介绍将帮助你在Windows 2000系统下安装软件和摄像头驱动程序1关闭计算机或者拔下摄像头2运行我们的安装程序(QCapture Suite installer)(必须登陆Administrator privileges安装本软件驱动程序)3打开你的摄像头4插入光盘并打开驱动安装程序(1)如果你是第一次安装这个摄像头的驱动,你必须做这个第四步骤(2)每一次你在这个系统下添加新的摄像头,你需要重新修复这个安装程序(3)如果你已经在这个驱动下使用过这个摄像头,这个程序只是一个升级的补丁,可以不安装此步骤在你插入摄像头几秒以后,系统将提示你找到硬件和驱动程序。
(如果系统比较慢,请稍等30秒种)Windows 2000系统将提示你这个驱动没有签名点击Yes如:图一(图一)你已经完成此摄像头在Windows 2000系统下的安装。
这个介绍将帮助你在XP Professional系统下安装软件和摄像头驱动程序1关闭计算机或者拔下摄像头2运行我们的安装程序(QCapture Suite installer)(必须登陆Administrator privileges安装本软件驱动程序)3打开你的摄像头4插入光盘并打开驱动安装程序(1)如果你是第一次安装这个摄像头的驱动,你必须做这个第四步骤(2)每一次你在这个系统下添加新的摄像头,你需要重新修复这个安装程序(3)如果你已经在这个驱动下使用过这个摄像头,这个程序只是一个升级的补丁,可以不安装此步骤在你插入摄像头几秒钟后,你会发现系统弹出Found New Hardware Wizard 点击Next 如:图二(图二)系统将通报你这个驱动没有签名点击Continue Anyway 如:图三(图三)完成找到的硬件安装向导你已经完成此摄像头在XP Professional系统下的安装。
Cool Edit Pro 2[1].0使用指南
![Cool Edit Pro 2[1].0使用指南](https://img.taocdn.com/s3/m/7893286725c52cc58bd6bef8.png)
Cool Edit Pro 2.0使用指南Cool edit pro V2.0是由Syntrillium Software公司出品,(以下简称CEP)比原来的1.2版增加如下功能(仅仅列举两项,由此可见一斑):多轨录音从64轨增至128轨;直接导入MP3文件。
它之所以自称“专业(pro)”,因为它具备各种专业的音频处理功能(超过45种效果)和很高的取样速率支持(最高32bit,192k采样速率),同时它的各项自定义功能更是体贴入微。
你可千万别被它的级别所吓倒,虽然它的功能强大,但是也容易上手,而且对系统的要求也不高。
本人的机器配置,我觉得你一定比我强:老奔166MMX、SD128内存、40G硬盘、8速光驱、15寸显示器――你没在笑我吧?好了,别笑了,功夫不负有心人,跟我一齐领略其中的妙处吧,用不了多久,你就是一位专业的录音师了。
安装后运行CEP,它有两副面孔:多轨混音窗、单轨音频编辑窗,见图1、图2。
可以用左上角的转换按钮在两个窗口之间互换。
顾名思义,对一个波形文件录制编辑操作用单轨窗,多轨录制或混合用多轨混音窗。
各部分名称见图1a 。
为节省篇幅,鉴于其功能专业,本文着重介绍常用及实用功能。
与windows相关的程序安装等基础操作从略。
我们就以制作一曲配乐小诗为例,权当是小试牛刀吧。
其它作品的制作,与此类似,可举一反三。
切换至单轨窗口,如图3。
在菜单上依次选取选项/录制调音台!打开录音控制窗口,如图6。
在你要录音的信号源下打上对勾,注意,这跟windows的音量控制正好相反,这里是哪个有对勾,录制的就是哪个信号源。
我们不是要录下自己朗读的小诗么?所以,在话筒下面打上对勾。
如果没有,就从选项里面的属性调出!先不要关闭窗口,然后,右键单击电平表,点选最上面的“监视录音电平”,试着对话筒说话,调整好与话筒的距离并用音源窗口的滑杆调整话筒音量,使电平表低于0db(不出现红色)的情况下尽量大些,一般-6db即可。
第十二章 自动测试工具QTP的使用

QTP的安装和配置 12.1 QTP的安装和配置
这时,如果在其他应用程序的界面上做任何的操作,QTP并 不会将其录制下来,而是仅录制与Flight程序相关的界面操作。 按F4键停止录制后,将得到如图12-5所示的录制结果。在关 键字视图中,可看到录制的测试操作步骤,每个测试步骤涉及的 界面操作都会在Active Screen界面显示出来。
(1)单击Quick Test Professional 安装程序,程序引导安装。 (2)出现许可协议安装界面,选择“我接受该许可证协议中的条款”,点击“是”。 (3)在弹出的许可证类型中选择“单机版”,点击“下一步”。 (4)填写注册信息,点击“下一步”。维护号是随着你的Quick Test Professional包装提 供的。 (5)在弹出的启用Quick Test Professional远程执行界面中选择“自动设置这些选项”, 点击“下一步”。 (6)在设置Internet Explorer高级选项中选择“我将手动选择这些选项”,点击“下一 步”。 (7)在选择安装类型界面中,选择“完全”,点击“下一步”。 (8)自定义安装的目标文件夹。(QTP及其插件的安装仅支持英文路径,也就是说不能 在包含中文命名的文件夹目录中安装QTP或QTP的插件。) (9)等待安装,安装完成后弹出客户注册界面(不用点击“立即注册”),点击“下一 步”。 (10)完成后,在之后弹出的界面中选择“重启电脑”,点击“完成”。 (11)重启完成后,在界面中单击“完成”,出现图12-1所示界面。点击“取消”。
QTP的安装和配置 12.1 QTP的安装和配置
(6)使用QTP编写第一个自动化测试脚本图12-4 Flight程 序界面 设置成仅录制Flight程序后, 选择菜单 “Automation | Record”, 或按快捷键F3,QTP将自动启动 指定目录下的Flight程序,出现如 图12-4所示的界面,并且开始录 制所有基于Flight程序的界面操作。
QTP工具教程

QTP测试工具教程第一部分第一章 QTP 简介1.1自动化测试的好处如果你执行过人工测试,你一定了解人工测试的缺点,人工测试非常浪费时间而且需要投入大量的人力。
使用人工测试的结果,往往是在应用程序交付前,无法对应用程序的所有功能都作完整的测试。
使用QuickTest可以加速整个测试的过程,并且建置完新版本的应用程序或网站后,可以重复使用测试脚本进行测试。
以QuickTest执行测试,就与人工测试一样。
QuickTest会仿真鼠标的动作与键盘的输入,不过QuickTest比人工测试快了很多。
1.2 QuickTest工作流程1.录制测试脚本前的准备在测试前需要确认你的应用程序及QuickTest是否符合测试需求?确认你已经知道如何对应用程序进行测试,如要测试哪些功能、操作步骤、预期结果等。
同时也要检查一下QuickTest的设定,如Test Settings以及Options对话窗口,以确保QuickTest会正确的录制并储存信息。
确认QuickTest以何种模式储存信息。
2.录制测试脚本操作应用程序或浏览网站时,QuickTest会在Keyword View 中以表格的方式显示录制的操作步骤。
每一个操作步骤都是使用者在录制时的操作,如在网站上点击了链接,或则在文本框中输入的信息。
3.加强测试脚本在测试脚本中加入检查点,可以检查网页的链接、对象属性、或者字符串,以验证应用程序的功能是否正确。
将录制的固定值以参数取代,使用多组的数据测试程序。
使用逻辑或者条件判断式,可以进行更复杂的测试。
4.对测试脚本进行调试修改过测试脚本后,需要对测试脚本作调试,以确保测试脚本能正常并且流畅的执行。
5.在新版应用程序或者网站上执行测试脚本通过执行测试脚本,QuickTest会在新本的网站或者应用程序上执行测试,检查应用程序的功能是否正确。
6.分析测试结果分析测试结果,找出问题所在。
7.测试报告如果你安装了TestDirector(Quality Center),则你可以将发现的问题回报到 TestDirector(Quality Center)数据库中。
TracePro交互式优化工具

这是一个Side emitting LED,可以通过描光计算验证大多数 光线实现全反射,以及场角是否达到符合要求的角度
爱尔发科技上海分公司 TracePro交互式优化工具
12
导入TracePro
•只需通过Export按钮就可以实现模型无缝导入TracePro •确认下TracePro中各模组的特性与优化工具是否相同 •从这部分可是,之后功能仅在标准等级及专家等级中实现
2
优化工具等级应用
• TracePro 交互式优化工具在不同的等级中有不 同的功能
‐ 在TracePro 简易等级LC中,此优化工具可以构造多 曲面透镜或反射罩,交互式描光计算,基于已有 的图形构造TracePro模型 ‐ TracePro 标准和专家等级中,具有此工具所有完 整功能
爱尔发科技上海分公司 TracePro交互式优化工具
可以更 改直线 成样条 曲线的
可以通过分段更细,以及利用控制点达到精确构造模型
爱尔发科技上海分公司 TracePro交互式优化工具
10
完善设计
这时候检查分段,然后设定属性,你可以在左边窗口中很方 便的察看这些信息。
爱尔发科技上海分公司 TracePro交互式优化工具
11
交互式描光计算验证几何模型
18
最终优化结果
本案例通过84次运行后,我们可以发现其配光曲线已经非常接近我 们设定的目标值。同时也符合我们当初的设计要求:0-40度之间仅少 量光线,大部分集中在70度附近
爱尔发科技上海分公司 TracePro交互式优化工具
19
Misc. Bells and Whistles
•TracePro交互式优化工具还可以用在设计菲涅耳透镜中 •本版本可以设计多达3种不同类型的菲涅透镜: 等宽,等高,DOE
QTP工具使用培训_基础应用

QTP工具使用培训_基础应用QTP (Quick Test Professional) 是一款功能强大的自动化测试工具,用于自动化执行软件功能测试和回归测试。
在这篇文章中,我将简要介绍QTP工具的基本应用和使用培训。
1.脚本录制和回放:QTP可以通过录制用户在应用程序上的操作来创建测试脚本,并可以回放这些脚本以执行测试。
录制和回放功能可以大大减少测试工作的时间和工作量。
2.对象识别和操作:QTP可以通过对象识别机制自动识别应用程序的各种用户界面元素,如按钮、文本框、复选框等,并可以对这些元素执行各种操作,如输入文本、点击按钮等。
3. 数据驱动测试:QTP可以从外部数据源(如Excel文件、数据库等)获取测试数据,并将这些数据应用于测试脚本,从而实现数据驱动的自动化测试。
4.条件和循环:QTP提供了条件和循环语句,可以根据不同的条件执行不同的操作,或者在特定条件下重复执行一些操作。
这使得测试脚本的编写更加灵活和复杂。
5.错误处理和异常处理:QTP可以捕捉和处理测试中的错误和异常情况,以便及时发现问题并采取相应的措施。
错误处理和异常处理功能可以保证测试的稳定性和可靠性。
以上仅是QTP工具的基本应用,QTP还提供了许多其他高级功能,如断言、日志记录、控制流程等。
要熟练地使用QTP工具,通常需要参加相关的培训课程。
1.QTP工具介绍:培训课程开始时,会对QTP工具进行详细介绍,包括其功能特点、适用范围、安装和配置等方面的内容。
学员可以通过这部分课程了解QTP工具的基本知识。
2.脚本录制和回放:接下来,学员将学习如何使用QTP工具进行脚本录制和回放。
培训课程会详细介绍录制和回放功能的使用方法,并提供实际的案例来进行演示和讲解。
3.对象识别和操作:学员将学习如何使用QTP工具进行对象识别和操作。
培训课程会教授学员如何使用对象识别器对应用程序进行对象识别,并演示和讲解如何对各种界面元素进行操作。
4.数据驱动测试:培训课程将介绍如何使用QTP工具进行数据驱动测试。
TracerDAQpro 使用说明
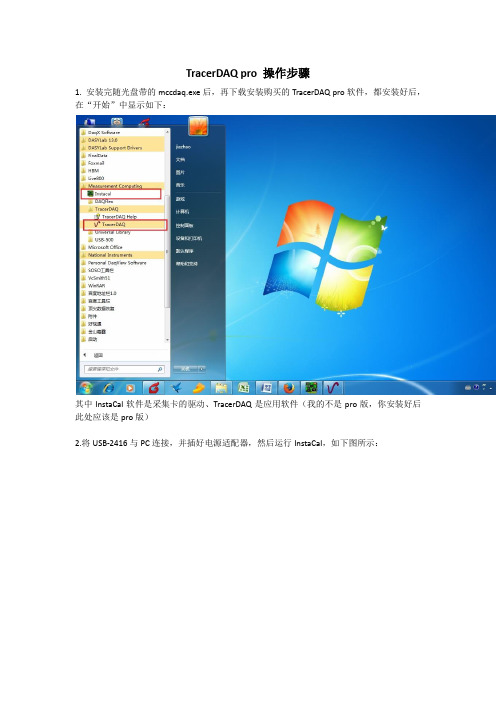
TracerDAQ pro 操作步骤1. 安装完随光盘带的mccdaq.exe后,再下载安装购买的TracerDAQ pro软件,都安装好后,在“开始”中显示如下:其中InstaCal软件是采集卡的驱动、TracerDAQ是应用软件(我的不是pro版,你安装好后此处应该是pro版)2.将USB-2416与PC连接,并插好电源适配器,然后运行InstaCal,如下图所示:正常情况下,InstaCal检测到USB-2416,并显示该卡的图标,分配编号(Board0)。
3.双击上图中Board#0图标,如下图所示(配置通道和设置采样率)。
选择Analog-In Channels 选项卡,显示如下:(1)在Sensor Category中选择测量信号类型,只有两个选项:voltage和thermocouples。
5个测温通道按类型选择相应的热电偶即可,其余5个电流通道和5个电压通道都选择电压测量即可(因为通过变送器都转为了电压)。
(2)在ConnectionType中选择单端、差分,对本应用而言,电压测量选择“单端”,热偶测量选择“差分”。
(3)Data rate是通道的数据率(但不是最终的采样速率),这个东西不好说清楚,只能是它正比于最终的采样率,选择一个合适的值即可,太大了,容易引入噪声。
设置好后,点击“确认”退出。
注意:在InstaCal中设置完成后,最好不要退出InstaCal,最小化即可。
4. 运行TracerDAQ(你的是TracerDAQ pro),显示如下:选中第1项“Strip Chart”,点击运行,如下图所示:这里要着重说明一下channel和lane的区别。
这两个词汇都是TracerDAQ pro中的概念,channel是测量通道(用ch表示),TracerDAQ pro可以测量48个channel;lane是显示窗口,如上图中的灰色区域,就是一个lane,TracerDAQ pro最多有8个lane。
Surgic Pro2 App 说明书

1 IntroductionThis application (Surgic Pro2 App) can display and save operation data such as rotation speed and torque by connecting to Surgic Pro2 (hereinafter referred to as the control unit) via Bluetooth. Connecting the control unit to Osseo100+ (option) enables display and storage of the ISQ value displayed on Osseo100+.The contents of this operation manual may differ depending on the terminal or the application version. We kindly ask for your understanding.2 Precautions for Handling and Operation Read these safety cautions thoroughly before use and operate the product properly.These indicators are to allow you to use the product safely, prevent danger and harm to you and others. These are classified by degree of danger, damage and seriousness. All indicators concern safety, be sure to follow them.Contents1. Introduction ......................................................... 12. Precautions for Handling and Operation .. (1)3. Connection to the Control Unit ............................... 23 –1Bluetooth connection .. (2)3 –2Pairing (2)3 –3Re-pairing ....................................................................... 34. Home Screen . (4)4 –1Function list (4)4 –2Data Log icon .................................................................. 45. Data Log Screen (5)5 –1Data Log screen .............................................................. 55 –2Torque and rotation speed showing/hiding selection ............ 65 –3Storing operation data ...................................................... 75 –4Change in dentist/patient information ................................. 75 –5Registration of implant system name and program name ..... 95 –6Tooth number selection .................................................... 95 –7Displaying the status of the control unit . (10)6. Viewer Screen (12)6 –1Function list .................................................................. 126 –2Selection of the file to view ............................................. 137. Connection to Optional Products .......................... 147 –1Connection to Link Module .............................................. 147 –2Connection to Osseo 100+ (14)8. Storage of Treatment Data (17)3 Connection to the Control Unit3 – 1 Bluetooth connectionTo use this application, you must pair the control unit with the iPad on which this application is installed. Pairing is required only for the first time. See “3 – 2 Pairing” for pairing method. After that, when the control unit is turned on while the application is running, the connection is performed automatically.3 – 2 Pairing1 Turn on the main power switch of Surgic Pro2.2 Press and hold the Setting key for 2 seconds or moreto display “BLE SET”.3Press the Enter key.4Press the TORQUE key and select “PC”.5Press the Enter key.6Launch the App.7Touch the Setting icon.8 Touch “Start”.Wait for a while until “Bluetooth Pairing Request” isdisplayed.9Enter the code “123456” and touch “Pair”.Connection to the Control Unit10 When “Connection Successful” is displayed on theapplication, pairing is completed.NOTICE●When the terminal and control unit are paired for the second time or later, the entry of the pairing key may not be required. Even in this case, the pairing will be completed without any problems.3 – 3 Re-pairingWhen you pair a terminal to a second control unit, or when you pair a terminal to a control unit again after deleting thepairing information by the Link Function of the control unit, perform the re-pairing of the control unit and the terminal.1 Launch the App.2Touch the Setting icon. 3 Touch “Initialize”.4 Touch “OK”.5 Perform pairing again according to “3 – 2 Pairing”.4 Home ScreenWhen this application is started, the Home screen is displayed. This screen allows pairing operation. Touch the Data Log icon to save the operation data. To check the recorded operation data, touch the Viewer icon.4 –1Function list4 –2Data Log iconTouch the Data Log icon to go to the Data Log screen. See “5 Data Log Screen”.5 Data Log ScreenTouch the Data Log icon on the Home screen to display the Data Log screen. On this screen, the values displayed on the control unit screen can be checked on the display of your terminal. When the motor is rotated, it automatically draws a graph of the rotation speed and torque.In this screen, the displayed values can be saved as operation data. Calibration and error are displayed depending on the condition of the control unit.5 – 1Data Log screen1112131415161718Check connection status to the foot control and battery level.No display: Not connectedData Log ScreenCheck the coolant solution flow level displayed on the control unit.5 –2Torque and rotation speed showing/hiding selection1 Touch the Setting icon.12 Touch “ON” and “OFF” to select whether to show orhide the graph drawing.3 Select the orientation of the PDF files to be saved.23Data Log Screen5 – 3Storing operation data12341 Touch “SAVE”.2 Select the format to save and check the file name. You can choose between two formats: PDF formatand CSV format. File names are automatically determined based on the patient ID and date. 3 Touch “SAVE” to save operation data and display thesaved file.4Touch the “×” icon to return to the Data Log screen.5 – 4 Change in dentist/patient information1Touch the dentist/patient information change icon to open the dentist/patient information change dialog.1Data Log Screen5 –4–1Registration of new dentist/patient information 215 431 Touch “DENTIST” or “PATIENT”.2 Touch the “+” icon to display the patient or dentistinformation registration dialog.3 Enter the ID and name.4Touch the “” icon.5 Touch the “” icon to return to the Data Log screen.5 –4–2Editing and deleting dentist/patient information 13254761 Touch “PATIENT” or “DENTIST”.2Touch the dentist or patient you want to edit or delete.3 Flick left.4 Touch “EDIT” or “DELETE”.EDIT: Edit the registered dentist or patient informationDELETE: Delete registered dentist or patientinformation 5 If “EDIT”, modify the dentist or patient information.6 Touch the “” icon.7 Touch the “” icon to return to the Data Log screen.Data Log Screen5 – 5 Registration of implant system name and program nameYou can register the implant system name and program name by touching the below in the IMPLANT SYSTEM and thePROGRAM displays on the Data Log screen. The default is “---”.5 –6 Tooth number selectionTouch the tooth number selection icon to display the tooth number selection dialog. In this dialog, you can change thenumbering method, select teeth to be treated, and record the treatment history.1321 To change the numbering method, touch “UNIVERSAL”. You can select the UNIVERSAL and FDImethods. 2 Touch the tooth icon to select the tooth to be treated. The selected tooth icon will flash in blue, and thenumber at the center will be the number of the tooth selected.3 To record the treatment history, touch “NO HISTORY”,“UNDER TREAT”, or “FIN TREAT”. “NO HISTORY” isthe default value for all teeth.4 Touch the “” icon to determine.To cancel the selection, touch the “” icon.Data Log Screen5 –7Displaying the status of the control unitThe status of the connected control unit can also be checked on the terminal.5 –7–1Calibration modeThe connected control unit enters calibration mode.5 –7–2SLEEP modeThe connected control unit enters SLEEP mode.5 –7–3Error code displayIf an error occurs in the connected control unit and an error code is displayed on the LCD, the following is displayed in the application.211 Touch “TROUBLESHOOTING” to check the content ofthe error.2 If the control unit does not recover from the error,touch the “” icon. It returns to the screenimmediately before the error. If you have already obtained the operation data, you can save it.Data Log Screen 5 –7–4Communication error displayIf “COM ERR” is displayed on the connected control unit, the following is displayed in the application.211 Touch TROUBLESHOOTING to check the content of theerror.2 If the control unit does not recover from the error,touch the “” icon. It returns to the screenimmediately before the error. If you have already obtained the operation data, you can save it.6 Viewer ScreenIn the Viewer screen, the saved operation data can be checked. The Viewer screen can be opened even if it is not connected to the control unit.6 – 1Function list2829303132Viewer Screen6 – 2 Selection of the file to view1 Select the patient.2Touch the search bar to display the list of saved files. 23Touch the file to view.7 Connection to Optional Products7 – 1 Connection to Link ModuleWhen the control unit and Link Module are connected, VarioSurg 3 can be operated with the wireless foot control of Surgic Pro2. When VarioSurg 3 is operated, the control unit is in the LINK mode. The Data Log screen is as shown inbelow.7 – 2 Connection to Osseo 100+Bluetooth connection between Osseo 100+ and the control unit is enabled. (Refer to the Osseo 100+ operation manual for the pairing method and connection method.)7 –2–1Connection to Osseo 100+You can save the ISQ VALUE data (GRAPH data, patient data, tooth numbers, etc.) in the storage of your terminal in the following way. The data is saved in both CSV and PDF formats.1 Connect Osseo 100+ and your terminal to the control unit via Bluetooth. The terminal is not directly connected to Osseo 100+.2 Move the control unit to ISQ mode.When the control unit and Osseo 100+ areconnected, press and hold the LINK key of the controlunit for more than 2 seconds. If “ISQ” is displayed onthe LCD display of the control unit, it switches to ISQmode.3 Launch the App.4 Touch the Data Log icon on the Home screen todisplay the Data Log screen.5 When the ISQ value is measured with Osseo 100+under this condition, the ISQ value displayed on thecontrol unit is also displayed on the screen of theterminal. Touch “SAVE” to save the ISQ VALUE data tothe terminal storage and the PDF is automaticallydisplayed.Connection to Optional Products7 –2–2Editing ISQ dataThe data saved in CSV can be edited by moving a tooth number or deleting ISQ data.1Touch “EDIT”. 12 Touch the checkbox of the ISQ value you want to edit. –“SELECT ALL” icon: You can select all checkboxes. –“DESELECTION” icon: You can deselect all checkboxes. (Selecting all checkboxes changes theicon)23 If you want to move the tooth number, see “Moving the tooth number”, and if you want to delete ISQ data, see “Deleting ISQ data”.Moving the tooth number1Touch “MOVE”.12 Touch the tooth you want to move to. (The selected tooth and its number are displayed in yellow) 3Touchicon.324 The confirmation dialog box is displayed. Touch “OK”if you want to move the tooth number.Connection to Optional ProductsDeleting ISQ data1 Touch “DELETE”.12 The confirmation dialog box is displayed. Touch “OK” ifyou want to delete ISQ data.8 Storage of Treatment DataWhen the operation data is saved for the first time, the folder “SurgicPro2” is automatically generated under the storage of the terminal. In the SurgicPro2 folder, a “CSV” file and a “PDF” file are created and stored in either file according to the format of the saved operation data.OPERATION DATEOPERATION DATEOPERATION DATEOPERATION DATEOPERATION DATEOPERATION DATE。
tracepro使用指南
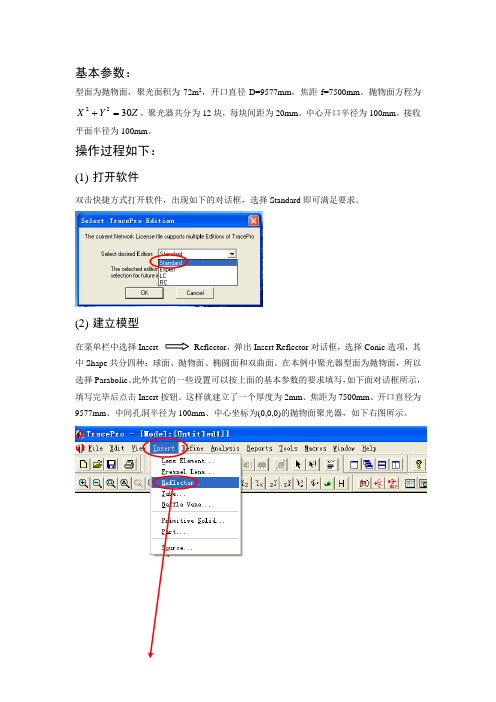
基本参数:型面为抛物面,聚光面积为72m 2,开口直径D=9577mm ,焦距f=7500mm 。
抛物面方程为 Z Y X 3022=+,聚光器共分为12块,每块间距为20mm 。
中心开口半径为100mm 。
接收平面半径为100mm 。
操作过程如下:(1) 打开软件双击快捷方式打开软件,出现如下的对话框,选择Standard 即可满足要求。
(2) 建立模型在菜单栏中选择Insert Reflector ,弹出Insert Reflector 对话框,选择Conic 选项,其中Shape 共分四种:球面、抛物面、椭圆面和双曲面。
在本例中聚光器型面为抛物面,所以选择Parabolic 。
此外其它的一些设置可以按上面的基本参数的要求填写,如下面对话框所示,填写完毕后点击Insert 按钮。
这样就建立了一个厚度为2mm 、焦距为7500mm 、开口直径为9577mm 、中间孔洞半径为100mm 、中心坐标为(0,0,0)的抛物面聚光器,如下右图所示。
要想从不同角度观察模型,可以从通过以下菜单进行操作。
其中和按钮比较常用,为全局放大,为对模型进行旋转观测。
要想观测模型的不同效果可以点击菜单栏View选项,有Silhouettes、Render、Wireframe、Hidden Line四个选项可供选择。
(3)分割聚光器按要求聚光器共分为12块,每块间距为20mm。
此处应用布尔运算对聚光器进行分割。
首先创建X向尺寸为10000mm(要比聚光器的开口直径大一些),Y向尺寸为20mm(为每块聚光镜的间距尺寸),Z向尺寸为5000mm(要比聚光器开口深度略大)的薄板,具体参数设置如下对话框所示。
薄板创建完成后,点击鼠标右键,出现下拉菜单,选择Rotate选项,对应弹出Rotation Selection 对话框,按对话框中参数填写完成按Copy按钮。
此操作共进行5次。
最终完成结果图如下所示。
Ctrl键加鼠标左键依次选择抛物镜面和各个薄板,点击鼠标右键,选择Subtract选项,对其进行布尔减运算。
TracePro交互式优化工具使用说明

1.Introduction1.IntroductionTracePro®Interactive Optimizerhelps users generate and also accomplish the optimization process of the Optical Elements and whole system-quickly and accurately.It provides a convenient and intuitional user interface to create radial free-form optical element(s).While useful for luminaire design,this tool can also be used to optimize LED second optics,reflective optics,projector system,solar concentrator and any other optical system needed optimization.The utility is for use with all TracePro editions and requires the most recent release of TracePro7.0and Microsoft Windows XP or later version.For more information on TracePro,or if you need technical support,please contact Lambda Research Corporation.About Lambda Research CorporationFounded in1992,Lambda Research Corporation is a privately held company based in Littleton, mbda provides optics software and services for government and industry worldwide.The company is an industry pioneer in the areas of stray light analysis,optical system design and analysis,scattering theory,optical testing,process control software and custom software development.Technical SupportIf you are having trouble with TracePro or have questions,please contact your distributor or Lambda Research Corporation directly.Technical support is available to customers with current support contracts.Additional information is also available via:•the World Wide Web at •the user to user e-mail list tracepro-talk•the new version e-mail list tracepro-updatesTo subscribe to one of the e-mail lists,submit a request online at /lists/listinfo.You can call us between the hours of9:00am and5:30p.m.(U.S.Eastern Time)Monday through Friday or reach us by e-mail.Lambda Research Corporation25Porter RoadLittleton MA01460Phone:(978)486-0766Fax:(978)486-0755support@2.Getting Started2.Getting StartedInteractive optimizer offers an intuitive graphical user interface.Its multi-window design makes it easy to initiate a prototype design and monitor the optimization process with the instant simulation data returned from TracePro.This manual generally assumes a working knowledge of Windows.When Interactive Optimizer launched,a MDI window is initiated for starting a new optimization plan.The Interactive Optimizer user interface consists of:•Profile editor window•Toolbox panel•Property window•Export panel•Optimization control panel•Optimization log•Options panelBelow you can find instructions for some of the most basic Surface Source Property Generator operation More:•Profile editor window•Toolbox panel•Property window•Export panel•Optimization control panel•Optimization log•Options panel2.1Interactive Optimizer InterfaceInteractive Optimizer is a pure graphical user interface application.It helps users generate many kinds of freeform geometry and simulate its optical system performance in TracePro®.Furthermore it manipulates TracePro®to accomplish the optimization through DDE channel.To understand the interfaces of Interactive Optimizer,a simple description about each child windows are necessary,they are:3.Interactive Profile EditorOptical designers always have a lot of brilliant ideas to create optical systems.The optics geometry shape that they want to use in their system it’s not a primitive geometry,like sphere or block.Thus,how to create a desired geometry shape is an important issue.Even some people can’t100%simulate their optical system in TracePro,just because of complicate model creating problem.And here,Interactive Optimizer can help designer create their complicate optical components quickly and accurately.Interactive Optimizer provides Interactive Profile Drawer to easily create geometry.In Drawer,user can use straight line and spline to draw an enclosed loop to represent geometry’s profile.And without limiting the number of node point,the profile can fully matches use’s desire.The finished profile can be directly export to TracePro as a3D solid object.Or this profile can be the initial design of a system optimization process.Furthermore,it provides real-time2D raytrace function to speed up create a better initial design.There are a lot of features,such like drawing profile,raytrace,paste background bitmap and so on,that are included in Interactive Profile Drawer.So,for convenient operation,there is an independent“Toolbox”panel to switch Profile Drawer to different function.More:•Interactive Profile Drawer-Segment•Interactive Profile Drawer-Object•Interactive Profile Drawer-Rays•Interactive Profile Drawer-Bitmap3.1Segment ModeAdd Segment/Control PointTo add a segment/control point into the segment,first right-click on the wanted position of the segment and then click on the"Add Segment/Control Pont"command from the pop-up menu.Delete Segment/Control PointRight-click on the wanted segment/control point and then click on the"Delete"command from the pop-up menu.Segment Type SelectionRight-click on the interested segment and then choose the wanted segment type from the pop-up menu. Now there are five segment types provided:•Line:Straight line is used to connect the two adjacent segment points.•Spline:Spline curve is used to fit the control points between the two adjacent segment points.•Sphere:Spherical curve is used to connect the center control point and the two adjacent segment points.•Ellipse:Elliptical curve is used to connect the center control point and the two adjacent segment points.•Conic:Conic curve is used to fit the control points and the two adjacent segment points.Adjust Object ShapeThe shape of the object can be modified by dragging the segment/control points among the segments. 3.2Object ModeAddRight-click on the editing area to determine the center position height of the new object.Then click on the "New Object"command from the pop-up menu will add a new object into the editor window.MoveSelect the wanted object by first locating the mouse on any of the segments of it.Then move the mouse cursor with the left button depressed will move the selected object.DeleteSelect the wanted object by first locating the mouse on any of the segments of it.Then right-click the mouse and select“Delete Object”from the pop-up menu will delete the selected object.3.3Rays ModeAddTo start tracing a single ray,pressing the mouse left button at the interested start position and then drag the mouse to determine the direction of the emitting ray.Two functions are also provided for generating ray array,i.e., ray fan or ray sequence:•Ray fan–First,press and drag the left button to decide the initial ray position and emit direction.Hold on the left button and,meanwhile,press the[ctrl]key.Then drag the mouse around to decide the expanding angle of the ray fan.Once done,release the mouse button and the[ctrl]key,and the ray fan will be added into the editor window.•Ray sequence-First,press and drag the left button to decide the initial ray position and emit direction.Hold on the left button and,meanwhile,press the[Shift]key.Then drag the mouse to decide the extending range of the ray sequence.Once done,release the mouse button and the[shift]key,and the ray sequence will be added into the editor window.Delete RayRight-click on the interested ray and select“Delete Ray”from the pop-up menu will delete the selected ray.Clear all raysRight-click the mouse and select“Clear all rays”from the pop-up menu will delete the whole rays.3.4Bitmap ModeAddTo paste the grabbed picture,right-click on the editing area to determine the center position of the pasted image.Then click on the"Add bitmap from clip board"command from the pop-up menu,the stored picture in the clipboard will be pasted into the editor window.DeleteRight-click on the center point of the pasted bitmap and then click on the“Delete”command from the pop-up menu will delete the pasted bitmap.AdjustThe pasted bitmap can be rotated or scaled by dragging the control points of the bitmap frame.4.ToolboxThe ToolBox Panel is the control panel for users to select the manage mode of the Profile Editor Window.In each manage mode,users can implement different actions to the displayed objects in the model.More:•Toolbox-Mode4.1ModeSegWhen Seg mode is selected,users can reshape the object profile by making adjustment to the segment/control point position in the Profile Editor Window.The way how the segment/control points are connected will base on the curve type selection of each segment.ObjWhen Obj mode is selected,users can select to add,delete,or move an arbitrary object in the model.RaysWhen Rays mode is selected,the raytrace function is enabled,and this helps give a quick check to the designmodel.Show RaysWhen Show Rays icon is checked,the traced rays will be instantly shown in the Profile Editor Window.BitmapWhen Bitmap mode is selected,users can paste,modify,or delete the grabbed image in the Profile Editor Window.Show BitmapWhen Show Bitmap icon is checked,the pasted picture will be shown as the background image in the Profile Editor Window.Opacity TunnerThrough the Opacity Tuner,users can directly tune the opacity of the pasted bitmap.Unit SelectorUsers can select the unit of the editor window to be mm,cm,or m.5.PropertyThe Property Editor allows users define the environment and object property in the model.More:•Property Editor-General Tab•Property Editor-Object Tab5.1General TabThe refractive index data are shown in the Refractive Indices ers can set the refractive index value of each item from the table.5.2Object TabThe detailed property information of an object will be shown in this ers can select to modify the item they want and the corresponding will be highlighted in the Profile Editor Window.6.ExportTo open the Export Panel,click on menu button:"Export".To generate geometry model and apply properties,use Export function to create a complete model including its optics properties in TracePro.Through DDE link,objects with the designated surface profiles can be directly added into the model window of TracePro.The creation mode and the applied property of each object can be checked and modified in the Export PanelMore:•Export Optical Element(s)•Creation Mode6.1Optical Element(s)This window generates optics object(s)in TracePro.Each object's geometry profile bases on”Editor Window”.And then,by different“Creation mode”,3D shape could be“Radial Symmetry”,“Biaxial”andproperty.Export7.OptimizationThere are4regions in the optimization window.They are“Saving Optimization Log Options”,“Optimization Variables List”,“Optical Element Export Options”and“Definitions of Optimization Operands”.All parameters in this window will determine whether Interactive Optimization Utility links TracePro successfully and how to accomplish this optimization.While everything is ready,click"Start"button to begin optimization.More:•Optimization-Options•Optimization-Variables•Optimization-Operands•Optimization-Objects7.1OptionsInteractive Optimization Utility uses DDE(Dynamic Data Exchange),a Windows protocol to share information with TracePro.To establish a full optimization,utility exports geometry to current document, commands that TracePro apply properties to exported object(s),and then initiates raytrace and saves simulation result.The whole optimization process would be saved.Thus,the file path and log file name have to be defined in advance.7.2VariablesAll variables will be listed in this panel.It’s just a simple viewer to monitor all variables in an easy way.We suggest not changing any value in this panel.That may cause some problems.The ideal way to modify variable-related values is through the Property window's Object Tab.Additional VariableIn some complicated case,we need some more advanced optimization skill to optimize our ually advanced optimization skill goes along with using After-scheme.To insert a new user-defined variable,first step is right click on this panel,and insert a user-defined variable.After setting its initial value,upper and lower limits, this variable’s name would be recognized in After-scheme.This new variable can be used to be one parameter of all commands in After-scheme.7.3OperandsAfter you have initiated the design of geometry shape,you need to set up the merit functions for you design system.For the following optimization process,it will take all operands as references and considering individual weight to evaluate the error value of each run.There are five different kinds of operands can be used.They are Flux,CIExy,CIEu’v’,Irradiance Profile and Candela Profile.Besides,each operand has different way to set up.Operand Type-FluxThe calculation of flux operand’s error value bases on the difference value between the target value and total flux of selection area on the observation plane.Operand Type-CIE u'v'&CIE xyThe calculation of CIE operand’s error value bases on the color difference on CIE map between the target color and the average color on selected region on observation plane.Operand Type-Irradiance ProfileThe calculation of Irr Profile operand’s error value bases on the irradiance/illumunance profile similaritybetween the target profile and the profile gotten from observation plane.Operand Type-FluxThe calculation of Irr Profile operand’s error value bases on the irradiance/illumunance profile similarity between the target profile and the profile gotten from observation plane.7.4ObjectsDuring optimization process,Interactive Optimizer follows the variables that optimization algorithm7.Optimizationgenerates to export one or more optics that need to be optimized into TracePro in each iteration.After creating optics,next steps are performing raytrace and analyzing its result.Here,this objects panel manages how to export optics and including applying material property on it.The detailed about exporting object,such as definition of parameters and creation mode,see Export.After-schemeThe last column named“After-scheme”is the only distinction between Export window and this panel.If there’s other specific actions must be executed after creating geometry,people can add additional code at this column.It’s compatible with TracePro Scheme Commands and all commands provided by Interactive Optimizer. Double-click the grid,a Scheme editor window pops up.After coding,press“Apply”button to save it.Scheme ExecutionTo pre-execute the content in after-scheme column,Right click on the grid,a menu pops up.Three different actions as follow:8.Optimization LogThe Optimization Log window helps user monitor the optimization progress.While performing optimization, this window shows up automatically.More:•Optimization Log-Graphs•Optimization Log-Trand Chart8.1GraphsAll iteration will be recorded by Interactive er can check each time simulation result(s)through this graph panel.And all useful analysis values are listed on this panel too.ListGraphsSwitch to Graphs tab,while the selected row is changed,the graphs panel will update to the correlated simulation result map.After selecting a row,if system saved multiple maps,user can choose analysis map through Graph selector.8.2Trand ChartThe trend chart of the Error Value is displayed in this ers can monitor the optimization process by keeping track on the Error Value.By default,this plot will be automatically updated by the simulated result throughout the optimization process.Once the optimization has multiple targets,user can choose to individually view the error value trend chart of each target or just the sum of error values for targets.Interactive Optimization use Simplex as optimization algorithm that uses4kinds of method,including Reflection,Expansion,Contraction and Shrinkage,to manipulate the simplex and try to find the local minimum. So each iteration point in trend chart uses color to indicate its corresponding Simplex Algorithm action.9.OptionsThe Options Panel allows you to specify the drawing preferences and decide the preferred way to initiate the optimization process.More:•Options-Drawing Tab•Options-Optimization Tab9.1Drawing TabIn this tab,it allows you to specify the colors for the drawing items in the profile editor window.Below is a list of drawing items that you can modify:Background,Curve,Highlight curve,Selected Curve, Ray,Highlight Ray,Selected Ray,Ray Fan,Ray Sequence9.2Optimization TabIn this tab,it allows you to specify the way of initiating the Downhill Simplex Method.Two ways are provided:[Generate by Character length]or[Generate by Variable limits].9.3Tool-Reset DDEInteractive Optimizer uses DDE(Dynamic Data Exchange),a Windows protocol to share information with TracePro.Once the utility fails keeping connection with TracePro,users just need to click the[Reset DDE]menu button and the utility will fix the issue automatically.。
Autodesk ReCap Pro 与现实捕捉项目的高效工作方法说明书

Creation of 3D point clouds
Cleanup, regioning, measurement, viewing, etc.
Get ready for downstream
workflow
Import / Indexing Raw Scans
IMPORTING parse the raw scans and convert the raw scan into .rcc files or intermediate files INDEXING compute the derived information and creating the indexing structure for the point cloud
ReCap Project File Types
• Support files o RCS: Indexed 3D point cloud o RCC: Support structured scan related workflow o Thumbnail: Mirror ball in indexing page o Llt: Texture mapping for the mirror balls in 3D preview during registration
Moving Your Project Around
• Files missing? • Slow to open the project?
• Folder structured changes? • Linked files are located on network drive?
Moving Your Project Around
Working Efficiently with ReCap Pro on Reality Captured Projects
Tracepro学习教程PPT课件
Raytrace Options 光线模 拟的环境参数设定,其中有光 源的波长,光源的单位,热环 境系数等。
2021/6/23
第24页/共54页
Tr a c e p r o 分 析 功 能
• 照度分析参数设置
如图:照度分析的参数设置表。 Smooting 选定将光斑的显示更 加平滑 Map Count 是照度计算点的数目, 当计算点的数目增大到一定程度 时,照度值也不再变化,此时得 到合适的模拟值
Tr a c e p r o 的 操 作 设 置
• View>Preference
此处可以设置Tracepro操作 界面中显示方面的参数,如 界面的显示单位,缩放时的 倍率,显示光线的颜色,方 式等等。
2021/6/23
第4页/共54页
Tr a c e p r o 的 系 统 设 置
• View>Customize
如图:有两种3D模型的导入方式
2021/6/23
File>Open
第15页/共54页
Insert>Part
Tr a c e p r o 建 模
• 光学软件建模
同时,Tracepro可 以将其他程序建好 的模型,直接读取, 简单方便。如图, 通过Tracepro打开 OSLO文档
2021/6/23
第16页/共54页
第21页/共54页
Tr a c e p r o 光 源 设 定
• Tracepro光源的设定有三种方法:
1 . Tr a c e p r o 自 建 光 源 模 型 , 然 后 进 行 光 源 属 性 定 义 .
2.Tracepro光源库,其中有部分已经定义好光源参数的光 源实体模型。
QTP操作基本教程
QTP操作基本教程QTP(QuickTest Professional)是一款由惠普公司研发的自动化功能测试工具,用于测试Web、桌面和移动应用程序。
QTP具有强大的脚本录制和回放功能,使得测试人员可以快速创建和执行自动化测试脚本。
本文将介绍QTP的基本操作教程,包括工作环境设置、录制与回放脚本、调试和修改脚本等内容。
第一步:安装和设置QTP2.启动QTP,创建一个新的测试工程。
3.在“测试资源”面板中添加需要测试的应用程序。
4.设置对象识别设置,以便QTP能够识别应用程序中的各种对象。
第二步:录制和回放脚本1.点击“录制”按钮,选择录制模式(标准、关键字或混合模式)。
2.在录制过程中,操作应用程序以执行测试用例。
3.在录制结束后,停止录制并保存脚本。
4.回放脚本以验证应用程序的功能是否正常。
第三步:修改和优化脚本1.检查录制生成的脚本,确保所有操作都正确识别和执行。
2.如有必要,手动添加断言和验证点来验证应用程序的输出结果。
3.修改脚本以确保它可以适应不同的测试场景。
4.优化脚本以提高执行效率和准确性。
第四步:调试脚本1.使用调试工具来逐步执行脚本并查看每个操作的执行情况。
2.在调试过程中,观察应用程序和测试对象的状态,以确定问题出现的原因。
3.使用断点和监视点来暂停脚本的执行并检查变量和对象的值。
4.修复脚本中的错误和问题,并重新执行。
第五步:扩展脚本功能1.使用QTP提供的函数库来实现更复杂的测试逻辑和操作。
2.添加循环和条件语句来实现多次重复和分支执行。
3.封装重复使用的代码段为函数或动作,以提高脚本的可重用性。
4.使用数据驱动测试的技术,让脚本可以从外部数据源读取测试数据。
第六步:生成和分享测试报告1.设置测试运行参数,如执行时间、测试环境等。
2.执行测试脚本,并在执行过程中监测测试进度和结果。
3.生成测试报告,包括测试用例的执行情况、错误和警告等信息。
4.将测试报告分享给项目团队和相关利益相关者,以便他们了解测试进度和结果。
QC测试管理工具使用手册精品文档12页

HP Quality Center 测试管理工具使用手册修订记录目录1概述 (1)1.1背景 (1)1.2目的 (1)1.3预期读者 (1)2用户组及权限 (1)2.1用户组 (1)2.2组权限 (2)3使用指南 (3)3.1“需求” (3)3.1.1需求编写 (3)3.1.2常用操作 (3)3.2“测试计划” (4)3.2.1案例编写 (4)3.2.2常用操作 (5)3.3“测试实验室” (6)3.3.1测试执行 (6)3.3.2常用操作 (6)3.4“缺陷” (6)3.4.1提交缺陷 (6)3.4.2常用操作 (7)1 概述1.1 背景目前的使用的testlink在编写用例时候比较麻烦,不能够迅速的编写用例,只有使用xml’格式才可以导入到testlink中,或者使用excel 格式,但是其中excel也必须加入编码才能够导入进入,客观上增加了软件测试工程师编写用例的难度。
其次testlink 只能对用例进行管理,产生的bug 必须再一次通过bug管理系统提交,一定程度上,浪费了时间。
使用的测试管理工具是HP Quality Center 10.0(以下简称QC),QC是Mercury Interactive公司推出的基于WEB的测试管理工具。
QC能够帮助你组织和管理软件测试过程的每个阶段,包括测试需求管理、测试计划、测试案例测试、测试执行和缺陷跟踪。
1.2 目的为了指导QC用户更好的使用QC进行日常工作,特编写本文档。
1.3 预期读者本文档预期读者为:QC普通用户。
2 用户组及权限2.1 用户组QC中的用户包括项目管理员及普通用户,普通用户分为开发人员、测试人员、业务人员和其它人员,各种人员职责如下表所示:注:一个用户可以拥有多个角色,例如,项目开发者做软件编码时属于开发人员范畴,做技术测试时属于测试人员范畴。
2.2 组权限注:“删除”权限,只有项目管理员具有,需要删除操作时可找项目管理员进行。
- 1、下载文档前请自行甄别文档内容的完整性,平台不提供额外的编辑、内容补充、找答案等附加服务。
- 2、"仅部分预览"的文档,不可在线预览部分如存在完整性等问题,可反馈申请退款(可完整预览的文档不适用该条件!)。
- 3、如文档侵犯您的权益,请联系客服反馈,我们会尽快为您处理(人工客服工作时间:9:00-18:30)。
Qcapture pro软件操作说明目录硬件驱动安装 (2)软件程序安装 (6)软件使用说明 (16)1.文件菜单 (17)2.编辑菜单 (17)3.获得菜单 (21)4.序列菜单 (25)5.提高菜单 (26)6.进程菜单 (29)7.措施菜单 (33)8.窗口菜单 (37)9.帮助菜单 (38)这个介绍将帮助你在Windows 98和Windows Me系统下安装软件和摄像头驱动程序1关闭计算机或者拔下摄像头2运行我们的安装程序(QCapture Suite installer)(必须登陆Administrator privileges安装本软件驱动程序)3打开你的摄像头如果你是第一次安装这个摄像头的驱动程序,你需要等待提示为"Building driver information database"的对话框完成安装。
你已经完成此摄像头在Windows 98和Windows Me系统下的安装。
这个介绍将帮助你在Windows 2000系统下安装软件和摄像头驱动程序1关闭计算机或者拔下摄像头2运行我们的安装程序(QCapture Suite installer)(必须登陆Administrator privileges安装本软件驱动程序)3打开你的摄像头4插入光盘并打开驱动安装程序(1)如果你是第一次安装这个摄像头的驱动,你必须做这个第四步骤(2)每一次你在这个系统下添加新的摄像头,你需要重新修复这个安装程序(3)如果你已经在这个驱动下使用过这个摄像头,这个程序只是一个升级的补丁,可以不安装此步骤在你插入摄像头几秒以后,系统将提示你找到硬件和驱动程序。
(如果系统比较慢,请稍等30秒种)Windows 2000系统将提示你这个驱动没有签名点击Yes如:图一(图一)你已经完成此摄像头在Windows 2000系统下的安装。
这个介绍将帮助你在XP Professional系统下安装软件和摄像头驱动程序1关闭计算机或者拔下摄像头2运行我们的安装程序(QCapture Suite installer)(必须登陆Administrator privileges安装本软件驱动程序)3打开你的摄像头4插入光盘并打开驱动安装程序(1)如果你是第一次安装这个摄像头的驱动,你必须做这个第四步骤(2)每一次你在这个系统下添加新的摄像头,你需要重新修复这个安装程序(3)如果你已经在这个驱动下使用过这个摄像头,这个程序只是一个升级的补丁,可以不安装此步骤在你插入摄像头几秒钟后,你会发现系统弹出Found New Hardware Wizard 点击Next 如:图二(图二)系统将通报你这个驱动没有签名点击Continue Anyway 如:图三(图三)完成找到的硬件安装向导你已经完成此摄像头在XP Professional系统下的安装。
QCapture pro软件安装说明首先在光驱中插入QCapture Suite 如:图四,自动弹出下图(图四)点击install QCapture Suite 如:图四(图五)点击next 如:图五(图六)提醒您取下或关闭摄像头,点击next 如:图六(图七)点击Browse选择安装路径,点击next 如:图七(图八)这里可以选择安装主程序和photoshop和image的插件,点击next如:图八(图九)安装过程出现自动配置。
如:图九(图十)点击Finish,完成QCapture Suite安装。
如:图十QCapture Suite软件安装完成,下面进行QCapture Pro的安装。
在光驱中插入QCapture Pro光盘,自动出现下图:(图11)点击install QCapture Pro 如:图11(图12)点击next 如:图12(图13)点击next 如:图13(图14)选择安装模式,典型、简洁、自定义三种模式点击Browse选择安装路径如:图14。
点击next如:图14。
(图15)定义好在开始菜单和使用时软件名称点击next 如:图15(图16)安装进程如:图16(图17)安装完成,选择安装后是否立即重新启动机器。
建议立即重新启动。
点击Finish完成安装。
如:图17重新返回光盘开始画面,点击Install Capture Support 如:图18(图18)点击install Capture Support 如:图18(图19)点击next 如:图19(图20)点击yes 如:图20(图21)选择是否打开软件介绍,点击next 如:图21(图22)点击Browse选择安装路径,点击next 如:图22(图23)选择安装后是否立即重新启动机器点击Finish完成安装。
如:图23软件安装全部完成。
Qcapture pro软件使用说明书首先请注意,此软件要求采集卡,摄像头和加密狗同时存在才可运行。
采集卡请确认安装在电脑主板的空余插槽上。
如没有加密狗,会出现如图24:(图24)Qcapture pro is running in a full-feature mode. You may acquire,process,measure,and print your images. qcapture pro revert to a demonstration mode in 13 days.To purchase Qcapture pro please contact your dealer.Qcapture pro是一个在整体特征的情况下才能运行的。
你可以捕获,加工处理,测量和打印你的图片。
Qcapture pro将在13天内回复你一个示范说明。
欲购买Qcapture pro请联系你的经销商。
如摄像头没有安装,会出现如图25:(图25)1.文件菜单:新建打开图象数据库重新装入关闭保存另存为档案退出这里显示4个历史记录,可以直接点击打开打开和保存图象(open/save as)工具栏上的和按钮分别对应了打开和保存操作。
您可以打开或保存为多种格式的文件。
这里你可以打开已经拍摄过的图片进行更加细致的加工,也可以对图片和所要拍摄的图片进行简单的比较。
2. 编辑菜单:撤消剪切复制粘贴粘贴新的粘贴设置aoi注释颜色列表透镜列表转换复制到aoi循环旋转图象调整大小局部缩放信息调色板参数选择点击粘贴设置选项如图26(图26)点击编辑菜单里的注释选项出现如图27:(图27)常用的几个图片选取和标注功能,可以复制,粘贴,剪切,删除等。
在这里也可以使标注的文字镶嵌入图片中,点标注后的功能键即可点击颜色列表选项出现如:图28(图28)在列表里可以选择不同的荧光染料.点击透镜列表如:图29(图29)在透镜列表里可以新建、编辑透镜的倍率、介质等条件。
点击转换选项如图30(图30)可以把图片转换成不同颜色类型。
点击旋转图象选项如图31(图31)可以向左或向右旋转翻转图片。
点击信息选项如:图32(图32)可以看到图片相关信息,如大小、时间、格式等。
参数选择:(图33)Application 申请表如:图33 这里可以选择更新比率(图34)Document 文件档案如:图34 这里可以存贮你设定好的所有数值(图35)status bar 状态栏如:图35这里可以调节软件的右下的状态栏中显示的象素值、AOI数值AOI范围刻度单位等。
注:此菜单为默认设置为好,改变会影响摄像头部分运行程序。
3. 获得菜单:视频/数字捕获一般视频捕获数字/视频捕获(Digital/video capture)点击软件上的(Digital/video capture)可以弹出功能菜单。
如图:点击preview可以进行预览,然后在选定好图象的情况下,可以点击snap进行拍摄。
你可以在这里设定6个setting值,右键点击出现save as可以直接储存,并可以在以后的工作中,直接使用此6个setting。
曝光时间可以对pvw和acq进行同时调节由于环境光线的差异以及镜头光圈的大小,采集的图象有时会过亮或过暗,这与您设置的曝光时间有关。
若使用自动曝光,请您选择自动曝光选项(如图36的Auto exp area),这时在图象中心出现一个矩形框,请确保矩形框内的亮度符合您的环境真实亮度。
在调节面层(binnin)的时候,如果担心曝光会有影响,请在Adjust Exp…前面打上勾,这样可以自动随着binnin调节曝光点击more,进入更多的功能菜单点击advance,进入高级选项(图36)点击more后进入此图:在多功能菜单中,可细致调节可视范围以及采集范围,调节好数值后会出现一个相应的蒙板,可以移动确认。
(注:视野范围只可缩小,不可扩大)调节可视范围(pvw)如图38和采集范围(acq)如图39.采集深度(Capture Depth)这里的下拉菜单里包括4个选项如图37,随着bit数的降低,可以拍摄黑白图片(注:前两种为彩色,后两种为黑白图片)可以在这里调节:gain,gamma,和offse数值(图37)(图38)(图39)图40点击auto white balance如图37出现如图40的界面,也可以手动调节白平衡,在调节中,会出现一个自选框,移动到自己认为白的地方即可;也可使用自动白平衡,选择空的画面,或者认为图片大部分已经颜色较好的情况下,在use last…前打上勾,点击calculate键如图40;也可使用相对颜色进行具体调节,在RGB 的数字框上可以手动调节白平衡,红、绿、兰增益的调节使您可以得到满意的图象色彩如图37。
通过在工具栏上下浮动钮,在增益属性页中调节红增、绿、兰即可。
比如您觉得颜色偏红,可以适当的减小红增益。
点击Advance进入此图此菜单为高级设置菜单在这里也可以选择拍摄,也可以点击basic dialog如图41返回原基本对话菜单拍摄;功能和原菜单没有区别,只是选项位置发生变化。
这里可以进行软件安装驱动位置,读取原有设定数值,可视范围和采集范围的调节等。
(图41)在图像选项卡里(如图:42)可以对要捕捉的图像进行设置,如新建图像、活动图像、连续图像等等。
(图42)(图43)在预览选项卡里可以设置曝光时间、区域、缩放。
(图44)在捕捉选项卡里也可以设置如时间、面层、捕捉区域。
(图45)在综合选项卡里可以设置拍摄方式等。
4.序列菜单:音序器工具条合并文件剪切结构复制结构删除结构粘贴结构增加结构摘录结构合并图片附属样品序列器差别水准跑平均的选择音序器工具条(图46)点击operation如:图46可以进行设置,出现下图:(图47)在frame rate中,数值越大,图片转换时间越短(如图47)可以选择3中不同的播放形式,循环,连续,自动倒转(如图47)(图48)在序列菜单中选择几张图片,然后软件会将几张图片合成一个图像文件(如:图48)在上图可以清楚地看出三张图片被合并成文件名为:untitle024(1/3)的文件,1/3分母表示的是图片的总和,分子表示的是第几张图片。