财务报表分析与运用杰拉尔德课后答案英文版第三章
财务报表分析与运用杰拉尔德课后答案英文版第三章
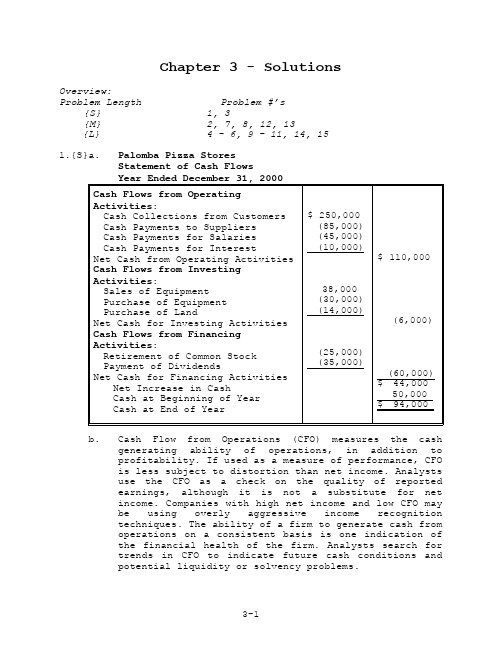
Chapter 3 - SolutionsOverview:Problem Length Problem #’s{S} 1, 3{M} 2, 7, 8, 12, 13{L} 4 - 6, 9 - 11, 14, 151.{S}a.Palomba Pizza StoresStatement of Cash Flowsb. Cash Flow from Operations (CFO) measures the cashgenerating ability of operations, in addition toprofitability. If used as a measure of performance, CFOis less subject to distortion than net income. Analystsuse the CFO as a check on the quality of reportedearnings, although it is not a substitute for netincome. Companies with high net income and low CFO maybe using overly aggressive income recognitiontechniques. The ability of a firm to generate cash fromoperations on a consistent basis is one indication ofthe financial health of the firm. Analysts search fortrends in CFO to indicate future cash conditions andpotential liquidity or solvency problems.Cash Flow from Investing Activities (CFI) reports how the firm is investing its excess cash. The analyst must consider the ability of the firm to continue to grow and CFI is a good indication of the attitude of management in this area. This component of total cash flow includes the capital expenditures made by management to maintain and expand productive capacity.Decreasing CFI may be a forecast of slower future growth.Cash Flow from Financing (CFF) indicates the sources of financing for the firm. For firms that require external sources of financing (either borrowing or equity financing) it communicates management's preferences regarding financial leverage. Debt financing indicates future cash requirements for principal and interest payments. Equity financing will cause future earnings per share dilution.For firms whose operating cash flow exceeds investment needs, CFF indicates whether that excess is used to repay debt, pay (or increase) cash dividends, or repurchase outstanding shares.c. Cash payments for interest should be classified as CFFfor purposes of analysis. This classification separates the effect of financial leverage decisions from operating results. It also facilitates the comparison of Palomba with other firms whose financial leverage differs.d. The change in cash has no analytic significance. Thechange in cash (and hence, the cash balance at the end of the year) is a product of management decisions regarding financing. For example, the firm can show a large cash balance by drawing on bank lines just prior to year end.e. andf.There are a number of definitions of free cash flows.In the text, free cash flow is defined as cash from operations less the amount of capital expenditures required to maintain the firm’s current productive capacity. This definition requires the exclusion of costs of growth and acquisitions. However, few firms provide separate disclosures of expenditures incurred to maintain productive capacity. Capital costs of acquisitions may be obtained from proxy statements and other disclosures of acquisitions (See Chapter 14).In the finance literature, free cash flows available to equity holders are often measured as cash from operations less capital expenditures. Interest paid isa deduction when computing cash from operations as itis paid to creditors. Palomba’s free cash flow available to equity holders is calculated as follows:Net cash flow from operating activities less net cash for investing activities:$110,000 - $6,000 = $104,000The investment activities disclosed in the problem do not indicate any acquisitions.Another definition of free cash flows, which focuses on free cash flow available to all providers of capital, would exclude payments for interest ($10,000 in this case) and debt. Thus, Palomba’s free cash flow available to all providers of capital would be $114,000.1 Sales - bad debt expense - increase in net receivablesc. The bad debt provision does not seem to be adequate.From 1997 - 2001 sales increased by approximately 40%, while net receivables more than doubled, indicating that collections have been lagging. The ratios calculated in part b also indicate the problem. While bad debt expense has remained fairly constant at 5% of sales over the 5 year period, net receivables as a percentage of sales have increased from 29% to 49%;cash collections relative to sales have declined. Other possible explanations for these data are that stated payment terms have lengthened or that Stengel has allowed customers to delay payment for competitive reasons.3.{S}Niagara CompanyStatement of Cash Flows 20011 Can also be used to calculate cash inputs, decreasing that outflow to $645 while increasing cash expensesto $100.3-44.{L}a.G Company1 Note that these two items cannot be calculated separately from theinformation available.b.M CompanyNote: This is not a true receipts and disbursements schedule as it shows certain amounts (e.g., debt) on a net basis rather than gross. Such schedules (and cash flow statements) prepared from published data can only show some amounts net, unless supplementary data are available.c. The cash flow statements are presented with the incomestatement for comparison purposes in answering Part d.Note: 2000 COGS and operating expense are combined as there is insufficient information to separate them.d. Both companies are credit risks. Although both areprofitable, their CFO is increasingly negative. If current trends continue they face possible insolvency.However, before rejecting both loans outright, it is important to know whether CFO and income differ because the companies are doing poorly or because they are growing too fast.Both companies increased sales over the 5 year period;Company M by 50%, Company G by more than 300%. Are these sales real (will cash collections materialize)?If they are "growing too fast," it may be advisable to make the loan but also to force the company to curtail its growth until CFO catches up. One way to verify whether the gap is the result of sales to poor credit risks is to check if the growth in receivables is "proportional" to the sales growth. Similar checks can be made for the growth in inventories and payables. In this case, the inventory of M company has doubled from 1996 to 2000 while COGS increased by only 56%. The inventory increase would be one area to investigate further.There is a significant difference in the investment pattern of the two companies. Company M has made purchases of PPE each year, while Company G has made little net investment in PPE over the period. Yet Company G has grown much faster. Does this reflect the nature of the business (Company G is much less capital intensive) or has Company G used off balance sheet financing techniques?The cash from financing patterns of the two companies also differ. Both tripled their total debt over the period and increased the ratio of total debt to equity.Given Company M's slower growth (in sales and equity), its debt burden has grown much more rapidly. Despite this, Company M has continued to pay dividends and repurchase stock. Company G has not paid dividends and has issued new equity. These two factors account for its larger increase in equity from 1996 to 2000.Based only on the financial data provided, G looks like the better credit risk. Its sales and income are growing rapidly, while M's income is stable to declining on modestly growing sales. Unless further investigation changes the insights discussed here, you should prefer to lend to Company G.5.{L}a. (i)Statement of Cash Flows - Indirect MethodCash from operations:Net income $1,080Add noncash expense: depreciation 600 Add/Subtract changes in working capital:Accounts receivable (150)Inventory (200)Accruals 80Accounts payable 120 (150)$1,530 Cash from investing:Capital expenditures 1,150Cash from financing:Short term borrowing 550 Long-term repayment (398) Dividends (432)$(280) Net change in cash $ 100The worksheet to create the cash flow statement is presented above. Each balance sheet change (other than cash) is accounted for and matched with its corresponding activity. As a last check, the net income and the add-backs of non-cash items are balanced and “closed” to their respective accounts (PP&E and retained earnings) providing the amounts of capital expenditures and dividends.a. (ii) Statement of Cash Flows - Direct MethodCash from Operations:Cash collections $9,850Cash payments for merchandise (6,080)Cash paid for SG&A (920)Cash paid for interest (600)Cash paid for taxes (720)$1,530 Cash for Investing Activities:Capital expenditures (1,150) Cash for Financing Activities:Short-term borrowing 550Long-term debt repayment ( 398)Dividends ( 432)$( 280) Net Change in Cash $ 100The worksheet to create the cash flow statement is presented below. Each balance sheet change (other than cash) is accounted for and matched with its corresponding activity. Furthermore the operating account changes are matched to their corresponding income statement item. As a last check, the net income is balanced and “closed” to retained earnings providing the amount of dividends.Note that there is no difference between the indirect and direct methods in the cash flow statement and in the worksheet for cash for investing and financing activities,6.{L}a. Exhibit 3P-3 does not provide the (changes in the)individual components that make up the changes inworking capital. As such, to create the direct methodcash flow statement, we must obtain the informationdirectly from the balance sheet. This procedure doesnot necessarily yield the same cash flow componentsusing the direct method as those provided by thecompany in its indirect method calculations.Differences may arise when1.there are acquisitions/divestments2.there are foreign exchange adjustments3.the firm aggregates or classifies investingaccruals together with operating ones.In this case, the differences are minimal as indicated below. (The calculations required for the direct method cash flow statement are presented in Exhibit 3S-1 along with the assumptions used to generate the statement)* Assumed change in interest payable to conform to interest paid. ** From the indirect methodAs noted in Box 3-2, from 1996 to 2000, the company generated free cash flow (CFO less net capital expenditures) of $1.5 million, during the first six months the A. M. Castle added another $309 thousand. However, Box 3-2 also showed that over the five-year period, Castle paid nearly $50 million in dividends and borrowed nearly $130 million to finance its investments and acquisitions. This trend continued in the first six months of 2001 during which the firm borrowed an additional $4.664 million to help pay its dividends and meet capital expenditure needs.Cash generated from operations from 1996 through the end of the first 6 months of 2001 was $76 million but the company spent $154 million to replace productive capacity and for investments and acquisitions. When free cash flows is calculated on this basis (i.e. CFO –CFI) there is a shortfall of $78 million. This shortfall as well as dividend payments were financed by borrowing over the same period.The inability to meet its capital and dividend needs from operations clearly indicated that either the dividend would have to be reduced or the company would not be able to remain competitive and/or grow as needed.7.{M}a.•The Swedish GAAP cash flow statements (CFS) begin with pretax and pre-financial items whereas the U.S. GAAPCFS show adjustments to net income.•The net financial items aggregate interest costs and interest income from various sources (includingdividends and interest from associated companies andother interest income) .•Swedish GAAP CFS aggregate all changes in working capital; U.S. GAAP CFS provide detailed disclosure ofthe operating changes in components of working capital;non-operating changes are reported as components ofinvesting activities.•Swedish GAAP combines cash and cash equivalents, financial receivables (primarily receivables fromassociated companies) and financial liabilities(current and long-term debt) in a measure called netfinancial assets or liabilities. SFAS 95 shows thechange in cash and cash equivalents with changes infinancial receivables reported as components of CFO andCFI. Changes in current and long-term debt are reportedin cash from financing activities.b.The cash flow statement is shown on page 16.c. Disadvantages:(1)Aggregation of all changes in operating or workingcapital accounts combines cash consequences ofoperating and investing activities. As noted inthe chapter, investing activities tend to distortcash flow from operations.(2)The use of net financial items tends to obscuresoperating, investing, and financing activities.Although disclosure is available to facilitate itscalculation, no separate disclosure of actual cashoutflow for interest (financing) costs isprovided.(3)The inclusion of financial liabilities (borrowingand repayment) and financial receivables in liquidfunds distorts cash flows from both investing andfinancing activities. This approach also hampersthe analysis of free cash flows discussed in thechapter. It is also unclear what basis was used bythe company to allocate a portion of the financialreceivables to operating activities and theremainder to the net financial position category.[Part c is continued on page 17]3-167. c. (continued from page 15)Advantages:(1)The separate display of pre-interest and pre-taxcash flows permits a comparison across companieswith different capital structures and tax regimes.(2)Detailed disclosure of investment cash flows(acquisition and other) may facilitate analysis offree cash flows.8.{M}a. Differences between U.S. and IAS GAAP (see text page98):•IAS GAAP is permissive regarding the classification of interest and dividends received,interest paid, and dividends paid: these cashflows may be reported either as components of CFOor CFI (interest and dividends received) and CFF(interest and dividends paid). Roche classifiesinterest and dividends received as CFI andinterest and dividends paid as CFF.•Bank overdrafts may be reported as components of cash and cash equivalents in IAS GAAP; the changein bank overdrafts would not be reported as partof the statement of cash flows. U.S. GAAP requirestheir classification as liabilities and therefore,as components of financing cash flows. Rochefootnote 24 indicates that overdrafts are reportedas short-term debt but is unclear as to howchanges are reported in the cash flow statement.•Companies using IAS GAAP and the direct method are not required to report the reconciliation from netincome to CFO.b.Cash flow statement on page 18.Note that conversion to SFAS 95 results in only a smalldifference in CFO as the classification differenceslargely balance. However both CFF and (especially) CFIare quite different (both level and trend). The majordifference is that the large 2000 investment inmarketable securities is shown as a CFI outflow underIAS 7 but an increase in cash and marketable securitiesunder SFAS 95 assuming that the marketable securitieswould be considered cash equivalents under US GAAP.Roche footnote 19 contains general information aboutits marketable securities, but not enough detail todetermine which investments would be considered cashequivalents.3-18c. Advantage: IAS recommends separate disclosure of cashoutflows for maintenance expenditures and capital expenditures for growth; when available that can be a significant benefit.Disadvantages:(1)Available alternatives for the treatment ofinterest and dividends received, interest paid,and dividends paid (see answer to part a) maydistort CFO, CFI, and CFF and hamper comparisonswith companies using US GAAP or (for companiesusing IAS GAAP) choosing different alternatives.(2)For companies using the direct method, when thereconciliation from net income to CFO is notreported it is impossible to determined whetherchanges in operating assets and liabilities (e.g.inventory) are due to operating or other factors.9.{L}The cash flow statement shows a steady deterioration in CFO;albeit CFO remains positive. Income (before extraordinary items) on the other hand increases steadily at approximately 8%-10% per year.To explain the discrepancy between the pattern of income and CFO, we first compute the direct method cash flow statement and then compare the cash flow components with their income statement counterparts.The (abbreviated) cash flow statement under the direct method is presented below:The required calculations for the operating items are presented in Exhibit 3S-2 on page 21. The last item “other”is the plug amount used to arrive at the CFO presented in the indirect cash flow statement (Exhibit 3P-4).Exhibit 3S-2Worksheet for Operating Items for Direct Method SoCFThe comparison of the cash flow and income statement components is presented below:Credit and collections do not seem to be responsible for the deterioration in CFO. A comparison of cash collections with sales indicates that collections increased at a slightly faster pace than sales. The collections/sales ratio increased from 99.61% in 1992 to 99.84% in 1994.Inventory, however, is another matter. Payments for inventory increased by 37% whereas COGS increased by only 29%. This is indicative of inventory being bought and paid for but not being sold. The proportion of payments to COGS increased accordingly from 98.3% to 104.5% in two years. This 6% increase translates (based on COGS of close to $2,000,000) to an increased annual cash requirement of $120,000.Thus, the first cause of Radloc’s problems seems to be inventories. Its income may be overstated as inventory may have to be written down if it cannot be sold. Even if inventory is eventually sold and the purchases now being made now are able to satisfy future growth, the firm may still face liquidity problems as it requires cash to purchase (and carry) the new inventory.However, as CFO is still positive the firm may still be a good candidate for credit.Further insights as to the impact of growth can be seen if we compare free cash flow (CFO - CFI) with income and CFO.(100,000)(50,000)-50,000100,000150,000Although income rises, CFO and free cash flow fall. CFO exceeds income in 1992 and 1993 as the noncash depreciation addback increases CFO relative to income. By 1994, however, CFO, (although positive) falls below income. This indicates that the firm may have problems in covering the replacement of current productive capacity.Free cash flow is negative in 1993 and 1994 and “barely” positive in 1992. This indicates that the firm’s growth (in addition to inventory) requires cash that Radloc cannot supply internally.Where did the cash come from?In 1993, it met its cash requirements by issuing stock; in 1994 the firm’s short term debt increased considerably as it drew down its revolving credit lines.Thus, the loan should not be granted as the firm seems to be facing an increasing liquidity crisis..Note : Radloc is an anagram for Caldor, a chain of discount stores. The data in Exhibit 3P-4 were taken from Caldor’s published financial statements. Caldor filed for Chapter 11 bankruptcy soon after the 1994 statements were published.10.{L}a. This part of the question requires an understanding ofSFAS 95, which governs the preparation of the Statementof Cash Flows. SFAS 95 permits use of either the director indirect method. As an initial step under eithermethod, the effect of the Kraft acquisition must beremoved as follows:The transactional analysis worksheet and statement ofcash flows are shown on pages 25 and 26 respectively.b. The simplest calculation would be operating cash flowless capital expenditures: $5,205 - $980 = $4,225million. But many variations are possible.The more important part of the question is theconnection between free cash flow and future earningsand financial condition. Possible uses of free cashflow include:1) Repayment of debt resulting in lower interest costand higher earnings. This also reduces debt ratiosand improves interest coverage, possibly leadingto higher debt ratings.2) Repurchase of equity may raise earnings per shareand (if repurchased below stated book value orreal value per share) increase these.3) Acquisitions (such as Kraft) that may providefuture growth, better diversification, lower risk,etc.4) Expenditures to fund internal growth throughcapital spending, research and development, newproduct costs, etc.* The net issuance or repurchase of equity is computed by reconciling the stockholders' equity account:Reconciliation of Stockholders' Equity12/31/87 balance $ 6,8231988 net income 2,337Dividends declared (941)Total $ 8,21912/31/88 balance (7,679)Decrease in stockholders' equity (repurchase) $ 540Philip Morris Companies, Inc. Worksheet for Statement of Cash FlowsIndirect Methodc. If the acquired inventories and receivables are soldthe proceeds will be reported as cash flow fromoperations (CFO). As their acquisition was reported ascash used for investment, CFO will be inflated. Thiswill occur if Kraft reduces its required level ofinventories and receivables because of operatingchanges (such as changes in product lines or creditterms) or the use of financing techniques that removethese assets from the balance sheet.11.{L}a. The first step is to match the items from the indirectcash flow statement with their corresponding items onthe income statement as below.1* It is possible the pension credit may also be included in “cost of products sold.”1 As a result of this matching, depreciation expense and restructuring expense offset and are eliminated from the direct method cash flow statement.* In Note H, Westvaco provides (as required by SFAS 95) the amount of interest and income tax paid. Our calculations must be adjusted to reconcile with these amounts. We have applied the adjustment to cash expenses, although it is possible that it should be applied to cash paid for inputs** Other income of $29 from income statement less (from indirect cash flow statement) gains on asset sales $18, plus currency losses of $3.6 and “other” of $3.8. [29 – 18 + 3.6 + 3.8 = 18)b. There are limited insights available from a singleyear’s direct method cash flow statement. However, we can compare some cash flow relationships with their income statement analogues:COGS to sales 70.3Cash inputs to cash collections 69.5%Selling, research, and admin. expense to sales 8.3% Cash expenses to cash collections 11.8% The second set of ratios shows the more significant difference. Westvaco’s cash expenses as a % of cash collections are much higher than the income statement relationships. The explanation (see chapter 12) is that Westvaco had a large noncash pension credit, which reduced net expenses.c. The company increased CFO (from $391 million in 1997 to$583 million in 2000) and substantially reduced its capital expenditures (see note H) from $621 million in 1997 to $229 million in 1999, generating the free cash flow needed to make acquisitions. Additional data used in Figure 3-1 tells the same story:FCF2 = CFO – CFI (where CFI = capital expenditures plus cash flows for acquisitions and from divestitures)The company borrowed funds in 1997 but reduced that debt in 1998 and 1999; outflows for dividends are lower but not significantly so. Thus, Westvaco used higher CFO and borrowing, combined with lower capital expenditures, to finance its 2000 acquisitions.12.{M}a. Hertz Corp. ($ millions)b.As reported, cash flow from operations shows steady improvement over the period 1989 - 1991, changing from a negative to a positive amount. After adjustment, the trend is eliminated; cash flow from operations is lower in 1991 than in either 1989 or 1990. The improvement in reported cash flow from operations was the result of reducing Hertz's net investment in rental equipment.d.Reported cash flow for investing shows little change over the three-year period. After reclassification of equipment purchases and sales, cash flow for investing drops by more than half in 1991. After reclassification it reflects the sharp drop in net car and truck purchases in that year.e.Free cash flow can be defined as cash flow from operations less investment required to maintain productive capacity. Ifwe assume that Hertz's investments are solely to maintain existing capacity, then free cash flow equals cash flow from operations less cash flow for investing:Note that reclassification of purchases and sales of revenue equipment has no effect on free cash flow:Thus by defining free cash flow in a manner which subtracts out all expenditures required to maintain the operating capacity of the firm, whether capitalized or not and regardless of classification, the effects of accounting and reporting differences can be overcome.This solution requires, of course, the identification of the amounts of such items.f. When equipment is purchased, the full amount isreported as an operating cash outflow. For leased equipment, only the periodic lease payments are reported as operating cash outflows. Thus, for Hertz, leasing increases reported cash flow from operations. g. When equipment purchases are classified as investingcash flows, then leasing reduces operating cash flows relative to purchases. That is because the outflow connected with purchases (or any other capitalized expenditure) is never classified as an operating outflow. [See Chapter 11 for a detailed analysis of this issue.]13.{M}a.Assumptions:1.Subsidies and other revenues are shown as a componentof cash flows from operating activities because theyinclude revenues and cash (subsidies) presumablyreceived from the government. We have assumed (and itappears so from data provided) that this item was notincluded in income (part of funds from operations). assets from consolidation are defined (elsewhere inRepsol’s financial statements –not provided in theproblem) as non-cash items resulting from accountingdifferences within the consolidated group. These areshown as a component of cash from operating activitiesto offset any items included in income.Note that Repsol’s statement of sources and applications of funds does not show the change in cash.The net change in cash in the table above reflects all changes except the effect of currency changes. If we separate out the actual change in cash and equivalents(65 in 1998, 297 in 1999) we can produce a statementthat is similar to the US GAAP format:b. A sources and uses statement does not recognizedifferences among operating, investing, and financing activities. SFAS 95 requires grouping of similar transactions in these three categories. Separate disclosure of the cash consequences of operating activities facilitates (1) an evaluation of the earnings and cash generating ability of the firm, (2) the quality of revenue and expense recognition principles used to prepare the financial statements, and (3) the computation of free cash flows.Separate disclosure of investing activities permits an assessment of capital expenditures, growth, and investments in other entities. Information about financing activities shows how the company finances its capital needs and dividend payments. Although the sources and uses format provides these data (and in gross form as required by SFAS 95) for investing and financing activities, it does not provide the disclosure by category; In contrast, SFAS 95 facilitates the analysis of free cash flows and other analytical measures.c.Separate disclosure of the components of (1) the changein working capital accounts, (2) non-cash income and expense, (3) net assets from consolidation, (4) whether any restructuring charges are included and where they were reported, and (5) debt repaid or reclassified would be useful.。
财务会计课后习题答案(英文原版)第3单元
2A
Simple
3A 4A 5A
Moderate Moderate Moderate
*6A*
Moderate
1B
Simple
2B
Simple
3B 4B 5B
Moderate Moderate Moderate
3-2
Correlation Chart between Bloom’s Taxonomy, Study Objectives and End-of-Chapter Exercises and Problems
1A, 2A, 3A, 4A, 5A, 6A 1A, 2A, 3A, 4A, 5A, 6A 1A, 2A, 3A, 5A, 6A 6A
1B, 2B, 3B, 4B, 5B 1B, 2B, 3B, 4B, 5B 1B, 2B, 3B, 5B
*6.
Prepare adjusting entries for accruals.
7
*7.
Describe the nature and purpose of an adjusted trial balance. Prepare adjusting entries for the alternative treatment of prepayments.
9, 10
*8.
22
11
12
Study Objective Q3-1 Q3-3 Q3-4 Q3-1 Q3-6 Q3-8 Q3-9 Q3-8 Q3-9 Q3-10 Q3-11 Q3-12 Q3-13 Q3-19 Q3-20 Q3-17 Q3-18 BE3-3 BE3-4 BE3-5 BE3-6 E3-2 E3-3 E3-4 E3-5 E3-6 E3-7 E3-8 E3-9 E3-11 P3-1A P3-2A P3-3A Q3-10 Q3-18 BE3-2 BE3-8 E3-7 E3-2 P3-4A E3-11 P3-5A P3-6A P3-1B P3-2B P3-3B P3-4B P3-5B Q3-7 BE3-1 Q3-5 E3-6 Q3-2 E3-1 Knowledge Comprehension Application Analysis Synthesis Evaluation
智慧树答案财务报表分析(全英文)知到课后答案章节测试2022年
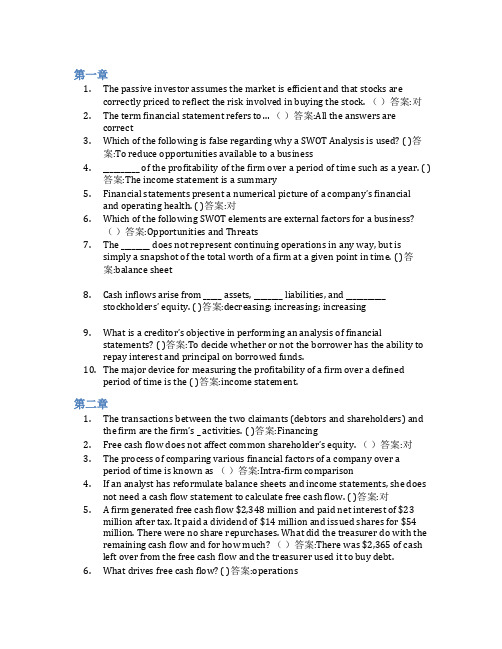
第一章1.The passive investor assumes the market is efficient and that stocks arecorrectly priced to reflect the risk involved in buying the stock. ()答案:对2.The term financial statement refers to… ()答案:All the answers arecorrect3.Which of the following is false regarding why a SWOT Analysis is used? ( )答案:To reduce opportunities available to a business4.__________ of the profitability of the firm over a period of time such as a year. ( )答案:The income statement is a summary5.Financial statements present a numerical picture of a company’s financialand operating health. ( )答案:对6.Which of the following SWOT elements are external factors for a business?()答案:Opportunities and Threats7.The ________ does not represent continuing operations in any way, but issimply a snapshot of the total worth of a firm at a given point in time. ( )答案:balance sheet8.Cash inflows arise from _____ assets, ________ liabilities, and ___________stockholders’ equity. ( )答案:decreasing; increasing; increasing9.What is a creditor’s objective in performing an analysis of financialstatements? ( )答案:To decide whether or not the borrower has the ability to repay interest and principal on borrowed funds.10.The major device for measuring the profitability of a firm over a definedperiod of time is the ( )答案:income statement.第二章1.The transactions between the two claimants (debtors and shareholders) andthe firm are the firm’s _ activities. ( )答案:Financing2.Free cash flow does not affect common shareholder’s equity. ()答案:对3.The process of comparing various financial factors of a company over aperiod of time is known as ()答案:Intra‐firm comparison4.If an analyst has reformulate balance sheets and income statements, she doesnot need a cash flow statement to calculate free cash flow. ( )答案:对5. A firm generated free cash flow $2,348 million and paid net interest of $23million after tax. It paid a dividend of $14 million and issued shares for $54million. There were no share repurchases. What did the treasurer do with the remaining cash flow and for how much? ()答案:There was $2,365 of cashleft over from the free cash flow and the treasurer used it to buy debt.6.What drives free cash flow? ( )答案:operations7.Reformulated balance sheets inform analysts about the firm’s strategy forrunning the business. ( )答案:对8.Which of the following activities is NOT an investing activity? ()答案:borrowing money9.An operating asset is ( )答案:used to produce goods or services to sell tocustomers in operations.parison of financial statements highlights the trend of the _________ of thebusiness. ( )答案:All the answers are correct第三章1.Low profit margins always imply low return on net operating assets. ()答案:错2.Which the following measure drive return on common equity (ROCE)positively? ()答案:Gross margin3.Under what condition would a firm’s return on common equity (ROCE) beequal to its return on net operating assets (RNOA)? ()答案:The SPREAD is zero, that is, return on net operating assets (RNO4. A reduction in the advertising expense ratio increase return on commonequity? ( )答案:对5. A firm should always purchase inventory and supplies on credit rather thanpaying cash. ()答案:错6. A firm has a return of 11.2 percent on net operating assets of $400 million, ashort term borrowing rate of 4.0 percent after tax and a return on operating assets of 8.5 percent. What is the firm’s operating liability leverage? ()答案:0.600 borrowing cost drive return on common equity (ROCE) negatively. ( )答案:对8.Which of the following would explain an observed decrease in return onequity, all else equal? ()答案:Increase in interest rate on debt9.The following information is from reformulated financial statements (inmillion) what is the firm’s ROCE and RNOA? ( )答案:15.0% and 13.0%10.Under what condition would a firm’s return on net operating assets (RNOA)be equal to its return on operating assets (ROOA)? ( )答案:The operatingliability leverage spread (OLSPREAD) is zero, that is, ROOA equals theimplicit borrowing rate for operating liabilities.第四章1.What measures tells you that a firm is a no-growth firm? ( )答案:A firm haszero or negative residual earnings growth2.Which the following item is part of unusual (transitory) income? ( )答案:Gainon the disposal of property3.Firms can grow earnings, but not create (share) value ()答案:对4.The following number were calculated from the financial statements for afirm for 2012 and 2011:How much of the change in ROCE from 2011 to 2012 is due to financing activities? ()答案:3.37%5.Transitory earnings are current earnings that are likely to be maintained inthe future. ( )答案:错6.Which of the following could cause return on net operating assets to increase,all other things equal? ()答案:Increase in inventory turnover7.Below is selected information from TricorpReturn on net operating assets forYear 1 is: ( )答案:15.4%.8.RE represents extra profit available to the company/shareholders this iswhat drives growth in a company’s (share) value. ()答案:对9.Return on operating assets is a measure of which of the following? ()答案:Efficiency10.Below is selected information from Tricorp company Which of the followingis correct concerning changes at Tricrop from Year 1 to Year 2? ( )答案:RNOA Decreased, ROCE Decreased第五章1. A firm can create future income by temporarily increasing its bad debtallowance. ()答案:对2.Which of the following item are managed to increase gross revenue? ()答案:Increase receivables3.Increasing profit margins by underestimating expenses creates net operatingassets. ( )答案:对4.Why do analysts compare cash flow from operations with earnings to assessthe quality of the earnings? ()答案:The difference between earnings andcash flow from operations is explained by the accruals, and the accruals aret he “soft” part of earnings that can be manipulated.5. A decrease in warranty liabilities increases net sales. ( )答案:错6.IBM reported a 3 percent increase in income for its first quarter of 2000,beating analysts’ estimates. But it also reported a decline in revenue. Its stock price dropped in response to the report. Which of the following statement isincorrect for the drop in stock price on an earnings increase? ()答案:Theasset turnover is expected to increase.7.Low depreciation charges forecast losses in future income statements. ( )答案:对8.Which of the following is least likely to be associated with low-qualityearnings? ()答案:Decrease in borrowings.9.Accounting quality analysis is not part of the wider analysis of sustainableearnings. ()答案:错10.Which of the following is not an indicator of accounting Manipulation? ()答案:Loss on sale of discontinued business segments第六章1.If the intrinsic value of a stock is greater than its market value, which of thefollowing is a reasonable conclusion? ( )答案:The market is undervaluing thestock.2.The _______ is defined as the present value of all cash proceeds to the investorin the stock. ( )答案:intrinsic value3.FCF and DDM valuations should be ____________ if the assumptions used areconsistent. ( )答案:similar for all firms4.Because the DDM requires multiple estimates, investors should ( )答案:carefully examine inputs to the model and perform sensitivity analysis onprice estimates.5. A preferred stock will pay a dividend of $2.75 in the upcoming year, andevery year thereafter, i.e., dividends are not expected to grow. You require areturn of 10% on this stock. Use the constant growth DDM to calculate theintrinsic value of this preferred stock. ( )答案:$27.506.At the end of 2012, you forecast that a firm’s free cash flow for 2013 will be$430 million. If you forecast that free cash flow will grow at 5% per yearthereafter, what is the enterprise value? Use a required return of 10 percent.( )答案:8,600millionpany X has negative free cash flow but strong earnings that yield areturn on equity of 27 percent. Which of the following statements is morelikely to be true? ( )答案:the company is investing heavily8.At the end of 2012, you forecast the following cash flows (in millions) for afirm with net debt of $759 million: You forecast that free cash flow will growat a rate of 4% per year after 2015. Use a required return of 10% to calculateboth the fir ms’ enterprise value and the value of the equity at the end of 2012?( )答案:7,900million, 7,141 million9.Value is based on expected dividends, but forecasting dividends is notrelevant to value as a practical matter. ()答案:对10. A firm that has higher free cash flow have a higher value? ()答案:错第七章1.The following are earnings and dividend forecasts made at the end of 2012for a firm with $20.00 book value per common share at that time. The firmhas a required equity return of 10% per year. Forecast return of commonequity and residual earnings for the year of 2015. ()答案:ROCE is 15.71%and RE is 1.492. A firm cannot maintain a ROCE less than required return and stay in businessindefinitely. ()答案:错rmation indicates that a firm will earn a return on common equity aboveits cost of equity capital in all years in all years in the future, but its sharetrade below book value. Those share must be mispriced. ()答案:对4.The following are ROCE forecasts made for a firm at the end of 2010. ROCE isexpected to continue at the same level after 2013. The firm reported bookvalue of common equity of $3.2 billion at the end of 2010, with 500 millionshared outstanding. If the required equity return is 12%, what is the pershare value of these shares? ()答案:$6.405.Residual earnings valuation does not work well for companies like Coca-cola,Cisco System, or Nike, which have substantial assets, like brands, R&D assets, and entrepreneurial know-how off the books. A low book value must giveyou a low valuation. ( )答案:错6. A firm with book value of $15.60 per share and 100 percent dividend payoutis expected to have a return on common equity of 15% per year indefinitelyin the future. Its cost of equity capital is 10%. Calculate the intrinsic price tobook ratio. ()答案:1.57.Which of the following items are the drivers of Residual earnings? ( )答案:Return on common equity and growth in book value8.In September 2008 the shares of Dell, Inc, the computer maker, traded at $20.50 each. In its last annual report, Dell had reported book value of $3, 735million with 2, 060 million shares outstanding. Analysts were forecastingearnings per share of $1.47 for fiscal year 2009 and $1.77 for 2010 Dell paysno dividends. Calculate the per-share value of Dell in 2008 based on theanalysts’ forecasts, with an additional forecast that residual earnings willgrow at the anticipated GDP growth rate of 4 percent per year after 2010.Use a required return of 10 percent. the BPS at the end of fiscal-year 2008will be ( )答案:$1.8139.Calculate the per-share value of Dell in 2008 based on the analysts’ forecasts,with an additional forecast that residual earnings will grow at the anticipated GDP growth rate of 4 percent per year after 2010. Use a required return of 10 percent. ( )答案:24.84第八章1.Abnormal earnings growth is always equal to growth of (change in) residualearnings. ()答案:对2. A firm’s earnings are expected to grow at a rate equal to the required rate ofreturn for its equity,12%.what is the trailing P/E ratio? ()答案:9.333.what is the forward P/E ratio?( )答案:8.334. A P/E ratio for a bond is always less than that for a stock. ()答案:错5.which of the following statement is correct? ()答案:the normal forwardP/E and the normal trailing P/E always differ by 1.06.The following are earnings and dividend forecasts made at the end of 2010.The firm has a required equity return of 10% per year. Forecast abnormalearnings growth for 2012. ( )答案:0.3257.Forecast abnormal earnings growth for 2013. ( )答案:0.1658.Calculate the normal forward P/E for this firm. ( )答案:109.Firm can increase its earnings growth but not affect the value of its equity ()答案:对10.In early fiscal year 2009, analysts were forecasting $3.90 for Nike’s earningsper share for the fiscal year ending May 2009 and $4.45 for 2010, with adividend per share of 92 cents (0.92) expected for 2009. Forecast the cum-dividend earnings growth rate for 2010. ()答案:16.46%第九章1.Which of the following situation diversification dose not reduce risk?( )答案:returns on securities in the portfolio are perfectly correlated2. A statistical measure of the variability of a distribution around its mean isreferred to as __________. ( )答案:the standard deviation3.Normal distribution of returns can characterize the risk of investing in abusiness? ()答案:错4. A set of possible values that a random variable can assume and theirassociated probabilities of occurrence are referred to as __________. ()答案:probability distribution5.Below are the reformulate balance sheet for two firms with similar revenues.Amounts are in millions of dollars. Which firm look more risky forshareholders? Note that cash has been treated as operating cash. ( )答案:Firm Bing the CAPM, ß is a measure of: ( )答案:share price volatility7.Which of the following is not a measure of risk? ( )答案:correlationcoefficient8.Below are the reformulate income statement for two firms in the same line ofbusiness. Amounts are in millions of dollars. Which firm look more risky forshareholders? Reformulate the income statements: ( )答案:Firm A9.which of the following statement is not correct? ( )答案:variation in return onnet operating assets is only driven by profit margins10.Financing risk is driven by_____ ( )答案:All the answers are correct.第十章1.___________ is the extra required return that a lender demands to compensatefor the risk that the borrower will default. ( )答案:Default premium2.Which of the following statement is not the objective in reformulatingfinancial statement for credit analysis?( )答案:groups assets and liabilitiesin such a way as to evaluate the firm’s underlying profitability.3.______ is the error of forecasting that a firm will not default when in fact itdoes. ( )答案:A Type I error4.which of the following is the Off-balance sheet financing? ( )答案:All theanswers are correct5.which of the following statement is not correct? ( )答案:Pro forma analysisforecasts is not useful for credit analysis.6.The following numbers are extracted from the financial statements for a firmfor 2011 and 2012. Amounts are in millions of dollars. At the end of 2011, the firm’s 80 million shares traded at $25 each, but by the end of 2012 theytraded at $15.Calculate Z-score for 2011 ( )答案:2.687.Calculate Z-score for 2011 ( )答案:1.098.After analyzing the default risk for a five-year bond with a maturity value of$1,000 and an 8percent annual coupon, an analyst estimates the requiredreturn for the bond at 7percent per year. The bond has just been issued at aprice of $1,000. What is the value of the bond at a 7 percent required return?( )答案:1040.989.What is the yield-to-maturity with a market price of $1,000? ( )答案:8%10.What is the expected return of buying the bond at a price of $1,000? ( )答案:8%。
财务报表分析与运用杰拉尔德课后答案英文版第十章
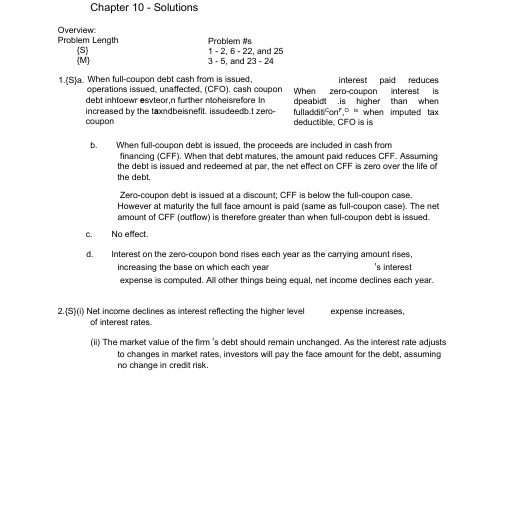
Chapter 10 - SolutionsOverview:Problem Length{S} {M}When full-coupon debt cash from is issued,operations issued, unaffected, (CFO). cash coupon debt inhtoewr e svteor,n further ntoheisrefore In increased by the t a xndbeisnefit. issudeedb.t zero-couponb.When full-coupon debt is issued, the proceeds are included in cash fromfinancing (CFF). When that debt matures, the amount paid reduces CFF. Assuming the debt is issued and redeemed at par, the net effect on CFF is zero over the life of the debt.Zero-coupon debt is issued at a discount; CFF is below the full-coupon case.However at maturity the full face amount is paid (same as full-coupon case). The net amount of CFF (outflow) is therefore greater than when full-coupon debt is issued.c. No effect.d.Interest on the zero-coupon bond rises each year as the carrying amount rises, increasing the base on which each year 's interestexpense is computed. All other things being equal, net income declines each year.2.{S}(i) Net income declines as interest reflecting the higher levelexpense increases,of interest rates.(ii) The market value of the firm 's debt should remain unchanged. As the interest rate adjuststo changes in market rates, investors will pay the face amount for the debt, assuming no change in credit risk.Problem #s1 - 2, 6 - 22, and 25 3 - 5, and 23 - 241.{S}a. interest paid reducesWhen zero-coupon interest is dpeabidt .is higher than whenfulladditi C on F ,O iswhen imputed tax deductible, CFO is is3.{M}a. Reported dataAMR Corp US Airways1998 1999 1998 1999 Cash and short-termjnv estme nts $ 2,073 $ 1,791 $ 1,210 $ 870Net receivables 1,543 1,134 355 387Inven tories 596 708 228 226Other curre nt assets 663 791 571 613 Curre nt assets $ 4,875 $ 4,424 $ 2,364 $ 2,096Acco unts payable 1,152 1,115 430 474Accrued liabilities 2,122 1,956 1,016 1,276Air traffic liability 2,163 2,255 752 635Notes payable andcurre nt porti on LT debt 202 538 71 116 Curre nt liabilities $ 5,639 $ 5,864 $ 2,269 $ 2,501 Net work ing capital (764) (1,440) 95 (405)Curre nt ratio 0.86 0.75 1.04 0.84Quick ratio 0.64 0.50 0.69 0.50Cash ratio 0.37 0.31 0.53 0.35b. Un like other payables, the air traffic liability willnot require cash outlays (other tha n low margi nal costs); i n stead this obligati on is satisfied ascustomers use their tickets on flights. The air trafficliability should therefore be excluded fromcomputati ons of short-term liabilities.While not part of the questi on, it is worth no ti ng that two of the three 1998 ratios are higher for US Airways tha n for AMR. While the ratios of both compa nies decli ned in 1999, the decli ne in US Airways ' ratios was greater. The 1999 declinein US Airways ' air traffic liabilityAMR Corp US Airways1998 19991998 1999Curre nt liabilities(reported) $5,639 $5,864 $2,269$2,501Air traffic liability (2,163)(2,255)(752) (635) Curre nt liabilities(adjusted)$3,476 $3,609$1,517 $1,866Net work ing capital 1,399815847230(adjusted)Curre nt ratio 1.40 1.23 1.56 1.12 Quick ratio 1.04 0.81 1.03 0.67 Cash ratio0.600.500.800.47As expected, all of America n Airli n es' liquidity measures improve whe n the air traffic liabilityisremoved from curre nt liabilities.However the adjustme nts in the table above overstate the firms ' liquidity, especially for AMR. A porti onof the air traffic liability relates to freque nt flyer programs (37% of AMR s 1999 liability and 13% of USAirways '1999 liability). AMR s freque flyer obligati on is based on the in creme ntal nt costs of fuel, food, and reservatio n s/ticketi ng costs (US Airw ays ' approach is similar but in cludes in sura nee and other compe n sati Thus some porti on of the air traffic c.Adjusted dataOnbility does represe nt n ear-term cash outlays.d.US Airways ' short stro n ger tha n curre -term liquidity position appears to be American ' s at December 31, and cash 1999 nt ratio ratio are that same. However, quick ratio and quids ratios evaporate whe nboth higher the higher the air liability is eliminated. This liability is lower for USAirways (relative to total curre nt liabilities). adjusted data show that all three liquidity ratios are higher for AMR than for US Airways.as its andthe curre nt trafficThe e.in dicates that fewer customers were willi ng to purchasetickets in adva nee, presumably due to the deteriorate nin the compa ny s finan cial positi on. In con trast,America n's air traffic liability in creased, althoughthe growth should be compared to past fluctuati ons andto growth for the rest of the in dustry.US Airways filed for ban kruptcy in August 2002.Proceeds equal $100,000/(1.12) 5$56,7424.(M}ad. Cash flow from operati ons is higher whe n zero-coup onbonds are issued because in terest is n ever reported as an operat ing cash outflow.[Note the infinite cashbasis coverage ratio.] In terest coverage, however, is lower after the first year,and decli nes as in terestexpense increases over time, reflecting the steadily increasing principal amount. Full-coupon bonds (if soldat par) result in a constant cash outflow from operations and constant interest expense. Given the Null Company's "steady state," the interest coverage ratio is constant on both accrual and cash flow bases.e. Given the tax deductibility of accrued interest on zero-coupon bonds, cash operations will be higher for both cases. The reported cash flow differences will remain unchanged. zero-coupon case, cash flow from operations more misleading as the firm must generate cash fromoperations to repay the debt at maturity. The obligation must be repaid, regardless of its cash flow classification.5. {M}a. The $US carrying amount = 1,282/1.37 =$936 millionb. Because the notes have no coupon, they were issued at adiscount. The difference between the face amount and the amount computed in part a must be unamortized discount.c. Interest expense (CHF millions) would be 7% X 1,282 = CHF 90d.Adding the 1999 interest computed in part c to the carrying amount at December 31, 1998: 90 + 1,282 = CHF 1,372 millione. The most obvious explanation is the change in the exchange rate from 1.37 to 1.60.In $US, 1999 interest expense = 7% X $$936 = $65 million, making the carrying amount at December 31, 1999 equal to $1,001 million [$936 + $65]. This is much closer to the carrying amount computed at 1,618/1.60 = $1,011 million.A second factor is that interest expense in CHF is computed quarterly, based on average rates for each period. The CHF carrying value at December 31, 1999 equals the 1998 carrying value + 1999 interest expense+ translation loss [Swiss franc decline increases the CHF debt amount].but unpaid flow fromFor the is even sufficientf. (i) Cash from operati ons is higher each year whe n zerocoup on no tes are issued because there is no cash in terest.(ii) Interest expense rises each year (excluding the effect of exchange rates)because it is based on a (rising) $US carrying amount.g. The rise in the value of the dollar (decli ne in Swissfranc) in creases in terest expe nse in CHF.6. {S}(i) In terest expe nse = In terest paid + cha nge in bonddisco unt$8,562 = $7,200 + $1,362(ii) = Market rate x [face value - disco unt]=.12 x [face value - $8,652]Therefore, face value = ($8,562/.12) + $8,652 = $80,000 (iii) Coup on rate = in terest paid/face value=$7,200/$80,000 = 9%7. {S}a.An in terest rate rise would decrease the market value of the fixed rate bonds buthave no effect on the variable rate bon ds. The effect on the fixed rate bonds woulddepe nd on their durati on.b.An in terest rate rise would in crease FIF's in terestexpense because more than half of its bonds have variable rates as well as a smallporti on of its bank loa ns.c. A finance compa ny seeks to match the in terest rate sen sitivity of its debt to that ofits earning assets.It is likely that FIF's fixed rate receivablesin creased over the 1996 - 2000 period and the compa nyin creased its fixed rate debt to lock in the spreadbetwee n fixed rate in terest in come and expe nse.d.For a finance compa ny, an an alyst is in terested inknowing how well the compa ny has matched the in terest rate sen sitivity ofits finan cial assets andliabilities. Whe n fair value estimates of finan cialassets are not provided the fair value of debt has very limited usef uln ess.8. {S}a. FIF has swapped variable rate in terest fixed rate (5.2%) payments payme nts for on a no ti onal amount of $25 millio n.b.In terest received = $25 milli on X receive rateIn terest paid = $25 millio n X 5.2% (both years)c. The swap reduced the sen sitivity to cha n ges in in terestrates by con vert ing part of the variable rate obligati on to one with fixed rates.9. {S}a. and b. In Y millio nsThe yen amounts were obta ined by multipl ying the dollar amounts by the exchange rate. For example, for the 2.14% bo nd at December 31, 1998, $55 X 113.60 =6,248.[Note : the yen amounts are roun ded.] rates are 3.86% and 5.34% respectively.c. It appears that both bonds were issued that at a disco unt,creat ing amortizati on each creases we add the 1999 the carry ing toamount year. If rate, it appears that in crease the in terestcoupon the effectived. One possible motivati on is to finance Japa n eseoperatio ns that are con ducted in yen. A sec ond is that, as a well-k nown company, BMY may be able to borrow more cheaply by borrow ing in yen and swapp ingthe yen proceeds into US dollars.10. {S}a. The adva n tage is that, whe n Takeda' s shareprice rose, the debt was conv erted into equity,stre n gthe ning the bala nee sheet. As conv ertible no tesare issued with a conv ersi on price that exceeds thethe n market price, the compa ny effectively sold com monshares at a premiu m. In additi on, because of thecon versi on feature, the in terest rate would have bee nbelow the rate required by noncon vertible no tes.The disadva n tage is that the debt was conv erted com mon shares at a time whe n Takeda could have sold new shares at a much higher price, obta ining the same capital at a lower cost.b. Reported data (Ye n millions)1998 1999 Total debt 44,482 21,338Equity829,381 907,373 Total capital 873,863 928,711Debt/total capital5.1%2.3%The more tha n 50% debt decrease was the largest factor reduci ng the debt/total capital ratio.Adjusted data (Ye n millioThis an alysis un derscores chapter; the an alyst must based on market con siderati ons. results in a more appropriate leverage measure.11. {S}a.There were two ben efits: a lower in terest rate tha n on noncon vertible debt of thesame maturity and the possibility of future conv ersi on. If conv ersi on takes place Roche will have sold shares for 25% more tha n their the n market price.b. First, you must compute the effective rate on the bonds con sideri ng their coup on rateand the disco untface value at which they were sold. In terestinto c.As the market price of Takeda shares was well above the1998, the conv ertible equity. con versi on price in beclassified as (subtracti ng 22,000 amount to equity) Takeda from 1998 to 1999 capital ratio was small:After that from debt and add ing 's debt was virtually un cha nged and the decli ne in the debt should adjustme nt the same debt/totalthe discussi on in classify con vertible Properclassifi the debtfrom expe nsefor 2000 would equal the effective rate multiplied bythe issue amount of 101.22 billion prorated for the portion of the bonds were outstanding. The carrying amount at December 31, 2000 the issue amount (101.22) plus the excess expense over interest at the coupon rate. c.If the Yen appreciates (declines) franc, then both interest expense amount of the debt will rise (fall).d.At the issue date the bonds should be considered debt because their conversion price is well above the market price. They should be considered equity market price is only when thesufficiently above the that conversion can be considered market pricehighly likely.12.{S}a. The advantages to Network Associates compared full-coupon with nonconvertible bonds were: (i) Lower interest rate(ii) No cash interest expense (iii)Higher cash flow from operations(iv) The likelihood that the debt would be converted to common shares before itsmaturity in 20 yearsb.The first year interest expense on the bonds is $16.44 million [4.75% X $346 million (39.106% X $885)]. As the bonds were issued in February 1998 interest expense for 1998 would have been below that amount. interest Assuming 1998 in expense of $15 million results amount of $361 million a carrying ($346 + $15).Thus 1999 interest expense can be estimated as $17.15 million (4.75% X $361million), close to the amount in the cash flow statement. This represents, therefore, the noncash interest expense for 1999.c. At a common stock price of $66.25, the conversion value of the bonds was:$1,280 million [$885 X ($66.25/$45.80)]At this price conversion is highly likely and the convertible bonds should be treated as equity. d. At a common stock price of $4, the conversion value of the bonds was $77.3 million[$885 X ($4/$45.80)]. At this price conversion is highly unlikely and the convertible bonds should be treated as debt.Yen (105 x 96.4%) year forwhich thewould equal of interest against the Swiss and the carryinge.Issuing bonds with an embedded put advantage of lowering the interest rate, will accept a lower rate in return for the put option.The disadvantage is that NET may be required to redeem sb o mndeh o rldaellrsofisthliekeblyonhdassif put option. As option exercise company 's financial condition shares are selling ata low price, option exercise may strain the company ' s financial condition further.13. {S}(i) If Munich Re had sold its shares of Allianz in June 2000 it would have incurred alarge capital gains tax.In addition, it would have had to sell the large block of shares at a discount to the market price of Allianz.By selling the exchangeable notes, Munich has postponedthe effective sale date, in the expectation that capital gains taxes would be reduced (they were). In addition, assuming the bonds are exchanged for Allianz shares, it sold those shares at a premium of 28% to the market price.The major disadvantage is that Munich Re retains the risk of ownership of Allianz shares. If Allianz shares do not rise by the maturity date of the notes, Munich will still hold the shares and will be required to repay the debt. In addition, Munich will have to pay interest expense on the notes until they mature or are exchanged, although it will also receive any dividends declared by Allianz. [Note : in December 2002 the market price of Allianzshares was ?100, far below the ?509 price at which the bonds are exchangeable.]option has the as investors exercise only weakenedif and the thethe(ii)If Munich Re had sold notes without the exchange feature it would have had to offer a higher interest rate, incurring higher interest expense. In addition, if the notes areexchanged, Munich Re will not have to repay the debt and interest expense willdecline as bonds are exchanged for Allianz shares.The disadvantage is that Munich Re has given up the possibility of a large increase inthe value of Allianz shares. Munich has also lost the flexibility of beingable to choose the period in which is recognizes the gain on the sale of Allianzshares.14. {S}a. Future redemption depends on conditions markets at each in the credit would “reset ”date. Investors redemption if more attractive Swiss choose francinvestments were available. That would be the case, for example, if (SFR) PepsiCo 's credit rating had declined.PepsiCo would redeem bonds if alternative financing sources are available or if SFRdebt is no longer desirable. The latter depends on PepsiCo 's exposure to SFRassets at that time or, if the debt was swapped for debt in another currency,conditions in the swap market at that time.b. The obligations should be classified as debt. One might argue that, because there is nostated maturity date, these bonds are “permanent ”capital and should be consideredequity. However the periodic reset provisions suggest that, at some point, eitherPepsiCo or investors will choose the redemption option. As investors can forceredemption, the bonds should be classified as debt.15. {S}a. An investor who is willing to accept the risk of lossof principal might find the high returns on these bonds attractive.b. In a period without insurance losses, Scor will be required to pay the high stated interestrates on these bonds, increasing interest expense, reducing reported income, andreducing the interest coverage ratio.c. In a period with in sura nee losses, Seor will be on theserequired to pay little or no in terest in ereas ing net in bon ds,come and the in terest coverage ratio.d. These bonds hedge Seor' s in sura nee risk. In terestexpe nse on these bonds will be high in periods without losses and low in periodswith losses. As a result they reduee the variability of Seor ' s reported net in eome.16. {S}a. The preferred shares should be eategorized as debt. Thedivide nd is set by periodie auet ions and the eompa ny may redeem them at any time. In effeet, they are a form of short-term debt that the eompa ny can exte nd as longas it is willi ng to pay the rate dema n ded by themarket. Should the eompa ny find a cheaper source of financing, it is likely to callthe preferred issue.[They were called in Ju ne 2001.]b. The ratio calculati on before and after adjustme nt is:17. {S}a. The fair value of Wal- Mart' s debt decli ned relative tobook value from 1-31-99 to 1-31-00. Interest rates musthave rise n duri ng that time period, as higher rates reduce the prese nt value offuture payme n ts.b. The fair value at 1-31-99 was above book value, implyi ng that (on that date) in terestrates were belowthe average rate of 7.2% on Wal-Mart debt. Thus the eompa ny could have borrowedat those lower rates,before rates in creased, redue ing its average rate.18. {S}a.rates were Wal-Mart may have believed that variable likely to fall and/or remain below fixed rates overthe swap period. Swapping fixed for variable under that assumption, reduce interest expense. rates would,swaps would increase interest expense. The second riskb. One risk that variable rates would rise so that theis coun terparty risk -the risk that the other party tothe swap would be unwilling to pay. The second risk would apply only when interestrate changes require payments to Wal-Mart.c. When interest rates rise, the value of the right toreceive the fixed rate of 5.75% declines, reducing the fair value of the swap. Weknow from problem 17a that interest rates rose from 1-31-99 to 1-31-00.19. {S}a. The market value of AMR 's fixedrate debt issues fellrelative to that book value at December 31, 1999, implying interest reduce rates musthave risen. Higher rates the fixed rate present value ofpayments associated withdebt.b. The interest rate must have been below 10.2% as the present value exceeds bookvalue.c. Because the interest rate on variable rate debt floats,fair value should not change except as a result of changes in credit quality.20. {S}a. Because the average floating rate was below the average fixed rate, th e swaps reducedAMR 's interest expense.b. AMR's swaps convert fixed rate to variable rate debt; AMR exchanged the right toreceived fixed rates for an obligation to pay variable rates. When interest rates rise,the value of the right to receive fixed rates declines, reducing the fair value of theswap. From the answer to problem 19a, we know that interest rates fell in 1999. Therise in interest rates therefore decreases the fair value of the swaps.c. AMR's debt nearly doubled in 1999, increasing its exposure to changes in interest ratesas much of its debt is fixed rate. Both the notional and fair value of AMR's swapsdeclined in 1999, reducing their offsetting effect on market risk. Both of these factorsincreased AMR 's exposure.21. {S}a. An argument for inclusion is that, for Fannie Mae, theissuance and retirement of debt are recurring operatingshould gains that are (as also included.the accountingbe included inand losses should discussed loss. Hedging chapter) or any or loss results hedging earnings as effects other economicHowever, Fannie Mae may be an exception. As stated in part a, the company routinely issues and retires debt, suggesting that gains and losses should be included in operating earnings. Before doing so, the analyst should try to determine whether the gains or losses for the particular quarter are unusual or reflect interest ratechanges over multiple periods, suggesting that the gains or losses should (analytically) be spread over several quarters.b.c.activities whose consequences operatingearnings.should be includedAn argument for exclusion is that gains or losses fromindebt repurchase reflect entire period the edceobnt obme ic changes during the included in operating which managemweanst cohuot s teantoding realize the gain. earnings forAn argument for including the hedging hedging activities are part of Fannie operating activities.An argument for exclusion is that the hedging loss was unusually large operating e a ion distortsWe believe st h oaut lbde excludedTghaeinsseagnadinlsosasneds firms. decisions because mafyronmotoypi e rldatginagin refinancing despiteoapnedraltoinsg seosffset and should notthe in peri odloss is that Mae ' snormal the trend offrom debt earningsretirement from in the for most resulteconomic gain management{S}a. The $300 million gain should be excluded from Arco 's operating earnings for 1997 because the gain results from the appreciation of Lyondell shares in prior years (possibly including years prior to the bond issuance). b. Arco may have chosen to issue the exchangeable notes to(i) maintain its controlling interest in Lyondell for strategic reasons (ii) postpone the income tax consequences of sale (iii)obtain a higher price for the shares than themarket price at that time (iv)avoid an unfavorable to the effectimpact on sale proceeds dueon Lyondell a large block of' s share price of sellingshares (v) retain the flexibilityto report the gain in a choiceperiod of management ' sOn Arco 's balance sheet, in Lyo ndell thethe investment shares is reduced by the cost sharesofexchanged; debt is reduced by the carrying value of the notes (after-tax)retired; equity is increased by the gain.The income statement reports the gain on the sale and the related income tax expense.The transaction is noncash. However Arco 's cash flow statement will report (as an adjustment to net income in the cash from operations section) the amount of the gain and any deferred income tax effect.22.c.basis{M}a. Adding prin cipal and in terest payme nts:PV of $20 million, payable in 10 years + PV of 20 payme nts of $1 millio n each Financing cash in flow = proceeds = 1PV factor (n=20, r=.04) = .45639 x $20,000,000 = $ 9,127,800 2PV factor (n=20; r=.04) = 13.59033 x $1,000,000 = $13,590,330On Jan uary 1,2000, cash and debt liability are each in creased by $22,718,130expe n se, show n as accrued in terest on December 31, 1994 bala nee sheet Jan uary 1,2001:In terest payme nt of $1,000,000 (no impact on expe nse)-$905,074 Reduction of bo nd premium = $1,000,000 $94,926-$94,92623. $ 9,127,800 13,590,330$22,718,130In terest expe nse(in come tax ignored)Year e nded December 31,2000: July 1: $22,718,130 x .04 = $908,725In terest payme nt of $1,000,000 (no impact on expe n se) Reduction of bo nd premium = $1,000,000 $91,275Debt bala nee on July 1 = $22,718,130 $22,626,855-$908,725 -$91,275December 31: $22,626,855 x .04 =$905,074 in terest Calculati ons:Year e n ded December 31,2001:July 1: $22,531,929 x .04 = $901,277 interest expe nse In terest payme nt of $1,000,000 (no impact on expe nse) Reduction of bo nd premium = $1,000,000 $98,723 -$901,277 Debt bala nee on July 1 = $22,531,929 $22,433,206 -$98,723 December 31: $22,433,206 x .04 = $897,328 in terest expe n se, show n as accrued in terest on December 31, 1995 bala nee sheet. Jan uary 1,2002:In terest payme nt of $1,000,000 (no impact on expe nse) Reduction of bo nd premium = $1,000,000 $102,672Debt bala nee on Ja n uary 1 = $22,433,206 $22,330,534Operati ng cash outflow2600 : One interest payment on July 1, 1994, $1,000,000 2001: Two in terest payme nts of $1,000,000 each, Jan uary 1 and July 1, $2,000,000Bala nee sheet impacts_______2000: effect of bond issua nee reduct ion of bond premium at July 1 in terest payableat December 31 in terest expe nse reduces equity 2001: reducti on of in terest payable and bond premium at January 1 reduct ion ofbond premium at July 1 in terest payable at December 31 in terest expe nse reduces equity-$897,328 -$102,672 onb. The purchase price must be equal to the face amount si nee the market in terest rate isequal to the coup on rate. 2 3The carry ing amount of the bonds on July 1,2003 willbe $21,997,050. 4 The gain from repurchase is the differenee between the purchase price and carryi ng amou nt: $20,000,000 - $21,997,050 = $1,997,050. It is a gainbecause a liability has bee n ext in guished for a lesser asset amount. Because of the cha nge in in terest rates since the bonds were issued, Derek has captured the rema ining bond premium. The jour nal entry would be:Bonds payable 20,000,000Premium on bonds payable 1,997,050Cash 20,000,000Gai n on exti nguishme nt 1,997,050This can be show n, as well, by using prese nt values: purchase price = prese nt value of $20,000,000, to be repaid in 6.5 years:PV factor (n=13, r=.05) = .53032 x $20 million = $10,606,400 plus PV of 13 payments of $1,000,000 each: PV factor (n=13, r=.05) = 9.39357 x $1,000,000 = $9,393,570; total is $20,000,000.Prese nt value of $20,000,000, to be repaid in 6.5 years: PV factor (n=13, r=.04) = .60057 x $20 millio n = $12,011,400 plusPV of 13 payments of $1,000,000 each: PV factor (n=13, r=.04)=9.98565 x $1,000,000 = $9,985,650; total = =$21,997,050. Thecarrying amount could also be determ ined by exte nding thean alysis in part A (reduc ing the bond premium at the time of each in terest payme nt) to July 1,2003.c. The gain is not a comp onent of continuing, operat ing in come but should beconsidered nonrecurring. It is a consequence of the change in interest rates ratherthan the firm's operating activities, and cannot be expected to recur.d. 1. The gain provides a on e-time in crease in reported net in come.2 The decrease in leverage (as a lower amount of higher coup on debt is issued toreplace the lower coup on debt) may help the firm avert or delay tech ni caldefault on bond cove nan ts. The repurchase may also allow the firm to elimi nate limit ing cove nan ts on this specific debt issue. Thus eve nif new debt must be issued to raise the funds n eeded for repurchase, thefirm may wish to retire the bond issue.。
中级财务会计英文版.课后答案(Chap03)
Cost of goods available for sale:
Beginning inventory(600 x $80)$ 48,000
Purchases:
1,000 x $ 95$95,000
800 x $10080,000175,000
Cost of goods available(2,400 units)$223,000
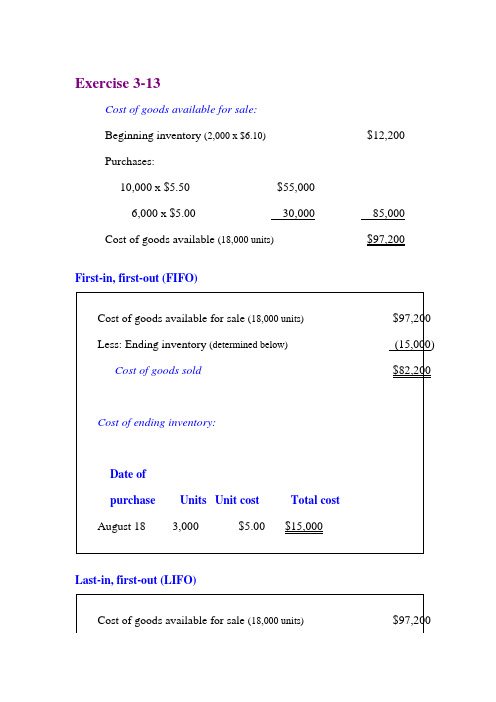
First-in, first-out (FIFO)
Cost of goods available for sale(2,400 units)$223,000
Less: Ending inventory(below)(80,000)
Cost of goods sold$143,000
Cost of ending inventory:
6,000(from 8/8 purchase)5.5033,000
Aug. 254,000(from 8/8 purchase)5.5022,000
3,000(from 8/18 purchase)5.0015,000
Total15,000$82,200
Ending inventory= 3,000 units x $5.00 =$15,000
Cost of ending inventory:
Date of
purchaseUnitsUnit costTotal cost
August 183,000$5.00$15,000
Last-in, first-out (LIFO)
Cost of goods available for sale(18,000 units)$97,200
6,000 @ $5.00
财务会计英语版课后答案

Chapter 1Page 81.Classify following items as either an expense (E),a revenue(R),an asset(A),or a liability( L);Cash, buildings, salaries of the sales force, $5 owed to a company for work performed, Mortgage to a bank, sales.Answer:Cash—A Buildings—A Salaries of the sales force—E$5 owed—L Mortgage to a bank—L Sales—R2. Classify each of the following as n operating (O), bank (I) , or financing (F) in a statement of cash flows; Wage paid to workers, Cash received form a bank in the form of a mortgage, cash dividends paid to a supplier of inventory, Cash paid to purchase a new machine.Answer:Wage paid—O Cash of mortgage-- F Cash dividends paid -- FCash paid to supplier of inventory—O Cash paid to purchase a machine—IPage111.List several economic decisions that rely on accounting information.Answer:·Whether to grant a loan·How much to pay for a share of common stock.·Whether to grant a rate increase to an electric utility·How much in damages the loser of a lawsuit must pay ·How much of a bonus to pay a plant manager·Whether to enter a new market2. Why do financial statements have footnotes, and what kinds of information might you find in them?Answer:Financial statements have footnotes because financial disclosure is a complex business. The notes tell us some of the specifics about the company environment , what accounting methods the company has used, what the accounting numbers might be if alternative methods had been used, and some of the major contingencies that are not formally included in the statement proper.Page 201.Describe the process of setting accounting standards. What are the roles of all the parties you mention?Answer:The FASB, a private, not-for-profit organization ,sets GAAP in the U.S. It publicly declares an agenda, promulgates "ExposureDrafts" of proposed standards, holds open meetings, and invites input from interested parties. The FASB has been delegated this authority by the SEC, a government agency with legal authority to determine GAAP.2.Think of an example, like the executive compensation example in the chapter, where incentives might exist to bias accounting numbers one way or another.Answer:There are other examples, but here is one that is different. A taxpayer has incentives to bias reported income downward in order to minimize income tax payments. However, it is important to understand that tax accounting rules are different from GAAP, and this book is about GAAP. Chapter 14 covers GAAP for taxes in more detail.Other examples include:·An entrepreneur seeking a loan from a bank or funding from a venture capitalist might have incentives to bias accounting numbers to look favorable.·A firm that is subject to scrutiny for earning excess profits(e.g.,an oil company)might have incentives to bias accounting numbers to look less favorable.·A utility subject to rate regulation might have an incentive tobias accounting numbers to look less favorable in order to gain more generous increases in its rates. (At this writing, there is a rather severe controversy about whether electric utilities in California are genuinely in financial difficulty and should be allowed to continue to impose large rate increase.)Chapter 2Page 381 Define assets, liabilities, and equities.Gave an example ofeach. How are assets valued? How are liabilities valued? Answer:An asset is a probable future economic benefit obtained or controlled by an entity as a result of a past transaction. Cash marketable securities, accounts receivable, inventories, prepaid expenses, patents, copyrights, trademarks, and property, plant and equipment are all examples of assets. A liability isa probable future sacrifice of economic benefits arisingfrom present obligations of an entity to transfer assets or provide services as a result of a past transaction or event.Accounts payable, accrued liabilities, unearned revenues, warranties, and bonds payable are all examples of liabilities.Accounting valuation of assets uses severaldifferent methods, including market value, expected realizable value, lower of cost or market, present value of future cash flows, and historical cost. Accounting valuation of liabilities is the expected amount that will be paid, perhaps adjusted for the time value of money.2. Explain what is meant by the entity concept. Answer:The entity is the person or organization about which accounting's financial history is being written.3 .A company signs a ten-year employee contract with a vicepresident. The salary is $ per year, guaranteed. Is this contract an asset? Would it appear on the balance sheet?Explain.Answer:The rights conveyed by the contrat may be an asset from an economic point of view, but they are not an asset under GAAP. The contract would not appear on the balance sheet as an asset, because GAAP does not record executory contracts, which are contracts that require future performance form both parties. That is ,GAAP views the contract as determining what services will be provided, no asset is recognized under GAAP.(Neither is a liability for payment recognized until services have beenperformed.)4 .A company purchased a parcel of land 10 years ago at a cost of $.The land has recently been appraised at $. At what value is the land carried in the balance sheet? How does the appraisal affect the carrying value in the balance sheet? Answer:The land is on the balance sheet at its historical cost of $.The carrying value of the land is unaffected by the appraisal. Page 421、Define debit and credit .What kind of balance ,debit or credit ,would you expect to find in the inventory T-account?In the Common Stock T-account?Answer:A debit is an entry on the left side of a T-account. A credit is an entry on the right side of a T-account. We would except to find a debit balance in Inventory, and credit balances in Bonds Payable and Common Stock. The reason is the convention that increases in assets are debits and increases in liabilities and equities are credits.2、If the trial balances, it means that you have analyzed all the effects of transactions correctly. True or false?Explain.Answer:False. A balanced means that the trial balance is consistent, not necessarily correct. For example. If an arbitrary entry is made that debits Cash and credits Common Stock for an equal amount, the trial balance will balance but it will be wrong. An accounting can receipt of cash and the issuance of common stock, but it alone can not make cash or additional common shares.3﹑Suppose Web sell leases a portion of its space to another company. Web sell’s accounts are debited and credited to record this transaction?Answer:Web sell would debit Cash and a liability, Rent Received in Advance, for the prepayment.Chapter 3Page 571. Define revenue and expense. How does one decide to list an item as revenue in an income statement? What is matching? Answer:Revenues are increases in net assets resulting from operations over a period of time .Expense are decreases in net assets resulting from operations over a period of time .Revenue isrecognized the earnings process is substantially complete , a transaction2. Give an example not found in the text , of an expense that is paid for in cash in a prior accounting period .In a subsequent accounting period.Answer:There are many allowable responses . An example is a patent that is purchased and paid for in one year and used in next .3. Give an example, not found in the text , of a revenue that is received in cash in a prior accounting period . In a subsequent accounting period .Answer:An example is a house painting contractor that receives payment for one-third of the contract price before beginning the painting .4. Explain why it is right to think of an asset as a cost and an expense as an expired cost .Answer:An asset is a future benefit . And there is an opportunity cost associated with not selling it for cash or exchanging it to settleChapter 6Page 120:1.The following table lists the adjustments and has an X in thecolumn indicating the approach:2. We first take adjustment for prepaid insurance and insurance expense. It would be easy to think of this adjustment as focusing on how much of the insurance coverage remained, as opposed to how much was used. In fact, the same type of logic could be used---computing a monthly rate for the coverage and applying that to the months reminding, instead of the months used.Now take adjustment for depreciation expense and accumulated depreciation. Estimating the value of the equipment at year end might be easy, for example, if there is a market for used equipment, or very difficult, for example, if the equipment was specially designed for Websell. Once a value estimate for the equipment at year end is obtained, depreciation expense would be the change in value over the year.Page 1231.$5000×(1+0.06)^10=$5000×1.79085=$8954.242.$5000×(1+0.06/2)^(10×2)=$5000×(1+0.03)^20=$5000×1.80611=$9030.563. $1000×(1.05)^3+$1000×(1.05)^2+$1000×(1.05)^1=$3310.134. ($1000×0.05/5)^13+$1000×(1+0.05/5)^10+$1000×(1+0.05/5)^5=($1000×(1.01)^15)+($1000×(1.01)^10)+($1000×(1.01)^5) =$1160.97+$1104.62+$1051.01=$3316.6Page 1241.x×.(1.07)^3=$3000 x=$3000/(1.07)^3=$2448.892. Calculate the present value at 10% of $1300 received two years from now. If that is greater than $1000, you are better offwith the $1300 to be received in two years. If its present value is less that $1000, you better off with $1000 now. $1300/(1.10)^2=$1074.38Therefore, you are better off receiving $1300 two years from now.Another way to do this problem is to take the future value at 10% of $1000. At the end of two years, the $1000 would compound up to:$1000×(1.10)^2=$1210,Which is less than you would have at that point if you took the $1300.3.The most I would be willing to pay is the present value at 8% of the stream of $1000 payment:$1000/(1.08)^1+$1000/(1,08)^2+$1000/(1,08)^3=$925.926+857.339+793.832=$ 2577.1(rounded)Chapter 8Page 1681.Aging takes the balance in accounts receivable at the end of the year, and sorts it by how long ago the transaction occurred that gave rise to that receivable. Experience has shown that “older” accounts have less likelihood of ever being collected.Percentages of likely uncollectibles for each category are applied to the totals in that category , and the results added to obtain an estimate of the allowance for uncollectibles required to value properly the estimated amount that will be collected from the accounts receivable. The bad debts expense then falls out as a “plug” in the allowance for uncollectibles.The percentage-of-sales method just estimates bad debt expense as a percent of sales, and plug the balance in the allowance account.2. Cash (118)Accounts receivable (118)12/31/2003(to recognize collection of cash from companies owing service co. from 2002 sales)Allow ance for doubtful accounts (7)Accounts receivable (7)12/31/2003(to write off accounts we know will not be collected) Ac counts receivable (125)Sales reven ue (125)12/31/2003(to recognize revenue and to anticipate collection of the receivable)If we focus on recording the bad debts expense that is associated with billings for 2003, we would record.06×$=$7500 in baddebts expense.B ad debts expense………………………………………7.5 Allowan ce for doubtful accounts…………………………7.5 12/31/2003(to record bad debt expense in anticipation of not collecting 100% of receivables)Method one: focus on the percentage of sales expected not to be collected.Allowance for doubtful accounts(10.5 is the “plug”,i.e., the number that drops out)Now we move to 2004, where events now proceed as expected . Collections are $117.5 thousand. Cash………………………………………………..117.5 Accounts receivable…………………………………117.512/31/2004(to recognize collection of cash form companies owing service co. from 2003 sales)Allowance for doubtful ac counts………………………7.5 Accounts receivable………………………………….7.512/31/2004(to write off accounts we know will not be collected)Accounts receivable (125)Sales revenue (125)12/31/2004(to recognize revenue and to anticipate collection of the receivable)If we focus on recording the bad debts expense that is associated with billings for 2004, we would record.06×$=$7500 in bad debts expense.Bad debts expense……………………………………7.5 Allowance for doubtful acco unts…………………………7.5 12/31/2003(to record bad debt expense in anticipation of not collecting 100% of receivables)The allowance for doubtful accounts using the peentage-of-sales method looks like this:Method one: focus on the percentage of sales expected not to be collected.Allowance for doubtful accountsOnly the entries recording bad debt expense are different using the aging method. Instead of the above entries recording bad debt expense, we would have the following analysis: Each year, we would adjust the balance in the allowance for doubtful accounts so that the net receivable ends up at $. That is, we would solve $-X=$,and find that the ending balance in the allowance for doubtful accounts must be $7500.Analyzing the account, we would determine that at 12/31/2003 we must add $4500 to the allowance for doubtful accounts: Bad debts expense………………………………..4.5 Allowanc e for doubtful accounts…………………….4.512/31/2004(to record bad debt expense in anticipation of not collecting 100% of receivables)At 12/31/2004, we must add $7500 to the allowance for doubtful accounts:Bad debts expense………………………………..7.5 Allowan ce for doubtful accounts…………………….7.512/31/2004(to record bad debt expense in anticipation of not collecting 100% of receivables)Using aging, the allowance for doubtful accounts T-account looks like this:Method two: focus on the ending balance in the allowance for doubtful accounts.Allowance for doubtful accountsChapter 9Page 1831.LIFO is last-in first-out. It means that in computing ending inventoryand cost of goods sold, the cost of items sold is assigned in reverse chronological order of their purchase, beginning from the most regent items purchased in a period. FIFO is first-in, first-out .It means that in computing ending inventory and cost of goods sold, the cost of items sold is assigned in chronological order of their purchase, beginning from the goods on hand at the beginning of the period. Average cost means that in computing ending inventory and cost of goods sold, the average unit cost of the beginning inventory and items purchased in a period is used to determine the cost of goods sold and remaininginventory.2.Yes, it is still a positive net present value project. In fact, its netpresent value is higher than when the purchase was made at$1.05 per unit, since the cash outflow is reduced but the cash inflow remains the same. The cash outflow on 12/31/01 when purchases are at $0.95 per unit is $114.This means the net cash flow at 12/31/01 is ($4) instead of ($16),and the NPV for Widget Company is:NPV=-100-$4/1.1+$10/ (1.1^2) +$144/ (1.1^3) =$12.82First, we redo the case of FIFO. The inventory T-account is:Widget Co. Inventory Account under FIFO Flow AssumptionInventory (FIFO)Ending inventory values can be read from the above T-account. Net incomes are:Widget Incomes using FIFONow we redo the case of FIFO. First, the inventory T-account is: Widget Co. Inventory Account under FIFO Flow AssumptionInventory (FIFO)Ending inventory values can be read from the above T-account. Net incomes are:Page 186To calculate the market-to-book ratios and accounting returns on equity: Market-to-book Ratios under Average CostAccounting Rates of Return under Average CostCollecting the results for FIFO from the chapter and these results for average cost, we have:Market-to-book Ratios under Various Cost Flow AssumptionAccounting Rates of Return under Various Cost Flow AssumptionAs is apparent, the market-to-book ratios and accounting rates of return for average cost are between for LIFO and FIFO.2. Because it has more recent costs on the balance sheet in the inventory account, FIFO has market-to-book ratios closer to 1regardless of whether prices rise or fall.Chapter 10Page 1961. The total profit on the transaction is the sales price of $880.00 less the original cost of $734.03:Sales price of securities $880.00Less : original cost ($735.03)Profit on transaction $144.97The cash flows were: $735.03 out on January1, 2001, and $880.00 in on January 3, 2003.There were profit in 2001, 2002, and 2003.In 2001, therewas a profit of $81.17.In 2003,there was a profit of $5.00.2. The unadjusted book value of the security on December 31,2002 was $793.83.If the market value of the security on that date was $790.00,an adjustment reducing its carrying value by $3.83 is required to write it down to its market value: Unrealized loss on market value securities-trading ……3.83 Marketable securities –trading ………… 3.83 If the security were sold for $810.00 on January 3, 2003, the entry would be:Cash ………………………………810.00Marketable securities –trading ………………790.00Gain on marketable securities-trading …………20.001/03/2003(To record the sale of the Marketable securities—trading )Page 1981. When a securities is classified as trading security, profits or losses show up on the income statement in every period from when the security is purchased until when it is sold. when a security is classified as available-for-sale ,profits or losses only show up on the income statement in the period in which the security is sold.2. the unadjusted book value of the security on December31,2002 was $793.83.If the market value of the security on that date was $790.00,an adjustment reducing it’s carrying value by $3.83 is required to write it down to it’s market value. however unlike the trading security case ,the unrealized loss is an equity account ,not a temporary account:Unrealized loss on marketable securities-available-for-sale 3.38 Marketable securities –trading ………………3.83To record the sale of the security for $810.00 on January 3,2003: Cash ………810.00Unrealized gain on marketable securities-available-for-sale(58.80-3.83) ………54.97Marketable securities-trading …………790.00Realized gain on marketable securities-available-for-sale ……………74.9712/31/2002(To mark-to-market the Marketable securities—available-for-sale)Chapter 111.a. Under straight-line depreciation, the depreciation expense each year is$600-$100/5 years=$100 per year.b. Under double-declining balance depreciation, the depreciation expense each year is given in the following table:c. Under sum-of-year’-digits depreciation, the depreciation expense each year is given in the following table:Sum-of years’-digits depreciation2. Intangible assets are most often shown in one line that is cost net of amortization. Tangible assets are sometimes shown in three lines: cost , accumulated depreciation, and net .3. Economic depreciation is the change in the economic value of the asset. Economic depreciation can be appreciation when the asset increases in value. We seen this already with marketable debt securities, which sometimes increase in valuebecause of unpaid interest4.It is easy and fulfills the requirement of GAAP to provide depreciation using a systematic and rational method. No GAAP depreciation method likely correctly reflects economic depreciation anyway ,so a simple expedient may be good enough.1.Sraight-line depreciation is $100 per year ($300/3 years).Double-declining balance depreciation is given in the following table:2.For straight-line depreciation,the entry is the same each year:Depreciation expense (100)Accumulateddepreciation (100)For double-declining balance depreciation,the entries are: Year1Depr eciation expense (200)Accu mulated depreciation (200)Year2Depreciation expense………………………………66.67 Acc umulated depreciation………………………66.67 Year3.declining balance because depreciation expense under straight-line is only $100,while under double-declining balance depreciation expense is $200.4.If the company buys one asset every year and each asset lasts three years,then in year 4 it will have three assets.Under straight-line depreciation,each of those assets generates a depreciation expense of $100;therefore total depreciation expense would be 3*$100,or $300.Under double-declining balance depreciation,total depreciation expense depends on the age of each asset.The company would have one asset in its first year of life,one in its second year of life,and one in its third year.Therefore,totaldepreciation expense would be:$200+$66.67+$33.33=$300,the same as under straight-line.Both depreciation methods give the same total depreciation because:1.Both methods fully depreciate the assets over their lives.2.The cost of the assets has remained constant.3.The company is in a steady state in which the number ofnew assets purchased in a period equals the number ofold assets being retired in that period.。
财务报表分析(英文版)标准答案
Chapter 8Return On Invested Capital And Profitability AnalysisReturn on invested capital is important in our analysis of financial statements. Financial statement analysis involves our assessing both risk and return. The prior three chapters focused primarily on risk, whereas this chapter extends our analysis to return. Return on invested capital refers to a company's earnings relative to both the level and source of financing. It is a measure of a company's success in using financing to generate profits, and is an excellent measure of operating performance. This chapter describes return on invested capital and its relevance to financial statement analysis. We also explain variations in measurement of return on invested capital and their interpretation. We also disaggregate return on invested capital into important components for additional insights into company performance. The role of financial leverage and its importance for returns analysis is examined. This chapter demonstrates each of these analysis techniques using financial statement data.•Importance of Return on Invested CapitalMeasuring Managerial EffectivenessMeasuring ProfitabilityMeasuring for Planning and Control •Components of Return on Invested CapitalDefining Invested CapitalAdjustments to Invested Capital and IncomeComputing Return on Invested Capital•Analyzing Return on Net Operating AssetsDisaggregating Return on Net Operating AssetsRelation between Profit Margin and Asset TurnoverProfit Margin AnalysisAsset Turnover Analysis•Analyzing Return on Common EquityDisaggregating Return on Common EquityFinancial Leverage and Return on Common EquityAssessing Growth in Common Equity•Describe the usefulness of return measures in financial statement analysis. •Explain return on invested capital and variations in its computation.•Analyze return on net operating assets and its relevance in our analysis. •Describe disaggregation of return on net operating assets and the importance of its components.•Describe the relation between profit margin and turnover.•Analyze return on common shareholders' equity and its role in our analysis. •Describe disaggregation of return on common shareholders' equity and the relevance of its components.•Explain financial leverage and how to assess a company's success in trading on the equity across financing sources.1. The return that is achieved in any one period on the invested capital of a companyconsists of the returns (and losses) realized by its various segments and divisions. In turn, these returns are made up of the results achieved by individual product lines and projects. A well-managed company exercises rigorous control over the returns achieved by each of its profit centers, and it rewards the managers on the basis of such results. Specifically, when evaluating new investments in assets or projects, management will compute the estimated returns it expects to achieve and use these estimates as a basis for its decision to invest or not.2. Profit generation is the first and foremost purpose of a company. The effectiveness ofoperating performance determines the ability of the company to survive financially, to attract suppliers of funds, and to reward them adequately. Return on invested capital is the prime measure of company performance. The analyst uses it as an indicator of managerial effectiveness, and/or a measure of the company's ability to earn a satisfactory return on investment.3. If the investment base is defined as comprising net operating assets, then netoperating profit (e.g., before interest) after tax (NOPAT) is the relevant income figure to use. The exclusion of interest from income deductions is due to its being regarded asa payment for the use of money from the suppliers of debt capital (in the same waythat dividends are regarded as a payment to suppliers of equity capital). NOPAT is the appropriate amount to measure against net operating assets as both are considered to be operating.4. First, the motivation for excluding nonproductive assets from invested capital isbased on the idea that management is not responsible for earning a return on non-operating invested capital. Second, the exclusion of intangible assets from the investment base is often due to skepticism regarding their value or their contribution to the earning power of the company. Under GAAP, intangibles are carried at cost.However, if their cost exceeds their future utility, they are written down (or there will be an uncertainty exception regarding their carrying value in the auditor's opinion).The exclusion of intangible assets from the asset base must be based on more substantial evidence than a mere lack of understanding of what these assets represent or an unsupported suspicion regarding their value. This implies that intangible assets should generally not be excluded from invested capital.5. The basic formula for computing the return on investment is net income divided bytotal invested capital. Whenever we modify the definition of the investment base by, say, omitting certain items (liabilities, idle assets, intangibles, etc.) we must also adjust the corresponding income figure to make it consistent with the modified asset base.6. The relation of net income to sales is a measure of operating performance (profitmargin). The relation of sales to total assets is a measure of asset utilization or turnover—a means of determining how effectively (in terms of sales generation) the assets are utilized. Both of these measures, profit margin as well as asset utilization,determine the return realized on a given investment base. Sales are an important factor in both of these performance measures.7. Profit margin, although important, is only one aspect of the return on invested capital.The other is asset turnover. Consequently, while Company B's profit margin is high, its asset turnover may have been sufficiently depressed so as to drag down the overall return on invested capital, leading to the shareholder's complaint.8. The asset turnover of Company X is 3. The profit margin of Company Y is 0.5%. Sinceboth companies are in the same industry, it is clear that Company X must concentrate on improving its asset turnover. On the other hand, Company Y must concentrate on improving its profit margin. More specific strategies depend on the product and industry.9. The sales to total assets (asset turnover) component of the return on invested capitalmeasure reflects the overall rate of asset utilization. It does not reflect the rate of utilization of individual asset categories that enter into the overall asset turnover. To better evaluate the reasons for the level of asset turnover or the reasons for changes in that level, it is helpful to compute the rate of individual asset turnovers that make up the overall turnover rate.10. The evaluation of return on invested capital involves many factors. Theinclusion/exclusion of extraordinary gains and losses, the use/nonuse of trends, the effect of acquisitions accounted for as poolings and their chance of recurrence, the effect of discontinued operations, and the possibility of averaging net income are justa few of many such factors. Moreover, the analyst must take into account the effectsof price-level changes on return calculations. It also is important that the analyst bear in mind that return on invested capital is most commonly based on book values from financial statements rather than on market values. And finally, many assets either do not appear in the financial statements or are significantly understated. Examples of such assets are intangibles such as patents, trademarks, research and development activities, advertising and training, and intellectual capital.11. The equity growth rate is calculated as follows:[Net income – Preferred dividends – Common dividend payout] / Average common equity.This is the growth rate due to the retention of earnings and assumes a constant dividend payout over time. It indicates the possibilities of earnings growth without resort to external financing. The resulting increase in equity can be expected to earn the rate of return that the company earns on its assets and, thus, further contribute to growth in earnings.12. a. The return on net operating assets and the return on common stockholders' equitydiffer by the capital investment base (and its corresponding effects on net income).RNOA reflects the return on the net operating assets of the company whereas ROCE reflects the perspective of common shareholders.b. ROCE can be disaggregated into the following components to facilitate analysis:ROCE = RNOA + Leverage x Spread. RNOA measures the return on net operating assets, a measure of operating performance. The second component (Leverage x Spread) measures the effects of financial leverage. ROCE is increased by adding financial leverage so long as RNOA>weighted average cost of capital. That is, if the firm can earn a return on operating assets that is greater than the cost of the capital used to finance the purchase of those assets, then shareholders are better off adding debt to increase operating assets.13. a. ROCE can be disaggregated as follows:equitycommon Average Sales Sales dividends Preferred - income Net ⨯ This shows that “equity turnover” (sales to average common equity) is one of the two components of the return on common shareholders' equity. Assuming a stable profit margin, the equity turnover can be used to determine the level and trend of ROCE. Specifically, an increase in equity turnover will produce an increase in ROCE if the profit margin is stable or declines less than the increase in equity turnover. For example, a common objective of discount stores is to lower prices by lowering profit margins, but to offset this by increasing equity turnover by more than the decrease in profit margin.b. Equity turnover can be rewritten as follows:equitycommon Average assets operating Net assets operating Net Sales ⨯ The first factor reflects how well net operating assets are being utilized. If the ratio is increasing, this can signal either a technological advantage or under-capacity and the need for expansion. The second factor reflects the use of leverage. Leverage will be higher for those firms that have financed more of their assets through debt. By considering these factors that comprise equity turnover, it is apparent that EPS cannot grow indefinitely from an increase in these factors. This is because these factors cannot grow indefinitely. Even if there is a technological advantage in production, the sales to net operating assets ratio cannot increase indefinitely. This is because sooner or later the firm must expand its net operating asset base to meet rising sales or else not meet sales and lose a share of the market. Also, financing new assets with debt can increase the net operating assets to common equity ratio. However, this can only be pursued to a point —at which time the equity base must expand (which decreases the ratio).14. When convertible debt sells at a substantial premium above par and is clearly held byinvestors for its conversion feature, there is justification for treating it as the equivalent of equity capital. This is particularly true when the company can choose at any time to force conversion of the debt by calling it in.Exercise 8-1 (35 minutes)a. First alternative:NOPAT = $6,000,000 * 10% = $600,000Net income = $600,000 – [$1,000,000*12%](1-.40) = $528,000Second alternative:NOPAT = $6,000,000 * 10% = $600,000Net income = $600,000 – [$2,000,000*12%](1-.40) = $456,000b. First alternative:ROCE = $528,000 / $5,000,000 = 10.56%Second alternative:ROCE = $456,000 / $4,000,000 = 11.40%c. First alternative:Assets-to-Equity = $6,000,000 / $5,000,000 = 1.2Second alternative:Assets-to-Equity = $6,000,000 / $4,000,000 = 1.5d. First, let’s compute return on assets (R NOA):First alternative: $600,000 / $6,000,000 = 10%Second alternative: $600,000 / $6,000,000 = 10%Second, notice that the interest rate is 12% on the debt (bonds). More importantly, the after-tax interest rate is 7.2% (12% x (1-0.40)), which is less than RNOA. Hence, the company earns more on its assets than it pays for debt on an after-tax basis. That is, it can successfully trade on the equity—use bondholders’ funds to earn additional profits.Finally, since the second alternative uses more debt, as reflected in the assets-to-equity ratio in c, the second alternative is probably preferred. The shareholders would take on additional risk with the second alternative, but the expected returns are greater as evidenced from computations in b.Exercise 8-2 (40 minutes)a. NOPAT = Net income = $10,000,000 x 10% = $1,000,000b. First alternative:NOPAT = $1,000,000 + $6,000,000*10% = $1,600,000Net income = $1,600,000 – ($2,000,000 ⨯ 5% x [1-.40]) = $1,540,000Second alternative:NOPAT = $1,000,000 + $6,000,000*10% = $1,600,000Net income = $1,600,000 – ($6,000,000 ⨯ 6% x [1-.40]) = $1,384,000c. First alternative: ROCE = $1,540,000 / ($10,000,000 + $4,000,000) = 11%Second alternative: ROCE = $1,384,000 / ($10,000,000 + $0) = 13.84%d. ROCE is higher under the second alternative due to successful use ofleverage—that is, successfully trading on the equity. [Note: Asset-to-Equity is1.14=$16 mil./$14 mil. (1.60=$16 mil./$10 mil.) under the first (second)alternative.] The company should pursue the second alternative in the interest of shareholders (assuming projected returns are consistent with current performance levels).a. RNOA = 2 x 5% = 10%b. ROCE = 10% + 1.786 x 4.4% = 17.86%c. RNOA 10.00%Leverage advantage 7.86%Return on equity 17.86%Exercise 8-4 (30 minutes)a. Computation and Interpretation of ROCE:Year 5 Year 9Pre-tax profit margin .......................................................... 0.112 0.109 Asset turnover .................................................................... 0.46 0.44 Assets-to-equity ................................................................. 3.25 3.40 After-tax income retention * .............................................. 0.570 0.556 ROCE (product of above) .................................................. 9.54% 9.07% * 1-Tax rate.ROCE declines from Year 5 to Year 9 because: (1) pre-tax margin decreases by approximately 3%, (2) asset turnover declines by roughly 4.3%, and (3) the tax rate increases by about 3.8%. The combination of these factors drives the decline in ROCE—this is despite the slight improvement in the assets-to-equity ratio.b. The main reason EPS increases is that shareholders had a large amount ofassets and equity working for them. Namely, the company grew while return on assets and return on equity remained fairly stable. In addition, the amount of preferred stock declined, as did the amount of preferred dividends. With this decline in the cost of carrying preferred stock, earnings available to common stock increased.(CFA Adapted)a. RNOA = 3 x 7% = 21%b. ROCE = RNOA + LEV x Spread = 21% + (1.667 x 8.4%) = 35%c. Net leverage advantage to common equityReturn on net operating assets .................................. 21%Leverage advantage .................................................... 14%Return on common equity (rounding difference) ..... 35%Exercise 8-6 (30 minutes)a. At the present level of debt, ROCE = $157,500 / $1,125,000 = 14%.In the absence of leverage, the noncurrent liabilities would be substituted with equity. Accordingly, there would be no interest expense with all-equityROCE without leverage = $184,500 / $1,800,000 = 10.25%.14% with leverage but only 10.25% without leverage.b. NOPAT = $157,500 + [$675,000 x 8% x (1-.50)] = $184,500RNOA = $184,500 / ($2,000,000-$200,000) = 10.25%c. The company is utilizing borrowed funds in its capital structure. Since theROCE is greater than RNOA, the use of financial leverage is beneficial to stockholders. Specifically, the after cost of debt is 4% and the financial leverage (NFO/Equity) is $675,000 / $1,125,000 = 60%. Therefore,ROCE = RNOA + LEV x Spread = 10.25% + 0.60 x (10.25% - 4%) = 14%, as before. The favorable effect of financial leverage is given by the term [0.60 x (10.25% - 4%)] = 3.75%.1. c2. a3. cExercise 8-8 (20 minutes)(Assessments of profit margin and asset turnover are relative to industry norms.)a. Higher profit margin and lower asset turnover.b. Higher asset turnover and lower profit margin.c. Higher profit margin and similar/lower asset turnover.d. Higher asset turnover and similar/lower profit margin.e. Higher asset turnover and lower/similar profit margin.f. Higher asset turnover and similar/higher profit margin.g. Higher asset turnover and lower profit margin.Exercise 8-9 (20 minutes)The memorandum to Reliable Auto Sales President would include the following points:•Both Reliable and Legend Auto Sales are perpetually investing $100,000 in automobile inventory.•Legend Auto Sales is able to generate more profit than Reliable because it is turning over its inventory (10 cars) more often. Specifically, Legend is turning its inventory over 10 times per year while Reliable is turning its inventory over only 5 times per year. Hence, given the same investment in automobile inventory, Legend is twice as profitable as Reliable.•Encourage Reliable to sacrifice some return on each sale to increase the inventory turnover. By slightly reducing price, relative to that charged by Legend, Reliable predictably will find that overall profitability increases. This is because while profit per sale declines, the number of units sold and, therefore, inventory turnover will increase. These factors predictably yield increased return on assets.Computation of Asset (PP&E) Turnover [computed as Sales / PP&E (net)]: Northern: $12,000 / $20,000 = 0.60Southern: $6,000 / $20,000 = 0.30This implies that Northern generates $0.60 in sales per year for each $1 investment in PP&E. In contrast, Southern generates $0.30 in sales per year for each $1 investment in PP&E. This shows that Northern is able to generate twice the return for each $1 invested in PP&E. Assuming equal profit margins, Northern will report a higher return on assets because of the volume of sales that the company is able to generate with its investment in PP&E (at least in the short run).Exercise 8-11 (15 minutes)Low volume operations mean that fixed costs, which in the case of automakers are substantial, must be absorbed by a low number of units produced. Since the lower of cost or market rule implies that inventory cannot be priced higher than expected sales price less costs of disposal plus a normal profit margin, much of that excess cost must be charged to the period incurred. In this case, that means the fourth quarter financial statements absorb much of this cost. This is probably the most likely accounting-based reason for the fourth quarter losses described in the news release.Problem 8-1 (30 minutes)a. 1. Quaker Oats does not reveal its computation of this return. Accordingly, wemake some simple computations and assumptions: (i) For simplicity, focus on one share, (ii) The dividend is $1.56 for Year 11, (iii) The average stock price is $55 and the price increase for Year 11 is $14—based on the beginning price of $48 and the ending price of $62. Using this information, we compute return to a share of stock as follows:= [Dividend per share + Price increase per share] / Average price per share = [$1.56 + $14] / $55= 28.3%However, if we use the beginning price of $48 per share, we get closer to the company's 34% return:= [$1.56 + $14] / $48= 32.4%2. The return on common equity is based on the relation between net incomeand the book value of the equity capital. In contrast, Quaker Oats’ “return t o shareholders” uses dividends plus market value change in relation to the market price per share (cost of investment to shareholders.)b. The company must have derived the 3.6% from price, market, and otherfactors that are not disclosed. Conceptually, this 3.6% should reflect the added risk of an investment in Quaker Oats’ stock vis-à-vis a risk-free security such as a U.S. Treasury bond.c. Quaker does not reveal its computations. It may disclose a variety of interestrates on long-term debt that it carries in the notes to financial statements.Based on data available to it, but not to the financial statement reader, it probably computed a weighted-average interest rate from which it deducted the tax benefit in arriving at the 6.4% cost of debt.a. Computation of Return on Invested Capital Measures:As a first step, we construct the company’s income statement.Sales (500,000 units @ $10). ................................................ $5,000,000 Fixed costs ....................................................................... 1,500,000 Variable costs (500,000 units @ $4). ............................. 2,000,000 Labor costs (20 employees x $35,000). ......................... 700,000 Income before taxes .......................................................... 800,000 Taxes (50% rate) ................................................................. 400,000 Net income .......................................................................... $ 400,000(1) RNOA = [$400,000 + ($2,000,000 x 7.5%)(1-0.50)] / ($8,000,000-$2,00,000)= $475,000 / $6,000,000 = 7.92%(2) ROCE = [$400,000 - ($1,000,000 x 6%)] / $3,000,000 = 11.33%Fixed costs ($1,500,000 x 1.06) ......................................................... 1,590,000 Variable costs ($550,000 units @ $4) .............................................. 2,200,000 Income before labor costs and taxes ............................................. $1,710,000 To obtain a 10% return on long-term debt and equity capital, Zear will need a numerator of $600,000 given an invested capital base of $6,000,000. The required operating income to yield this $600,000 amount is computed as: Net income + Interest expense x (1 - 0.50) = $600,000Net income + ($2,000,000 x 7.5%) x (1-0.50) = $600,000Net income = $525,000Assuming taxes at a 50% rate, Zear needs pre-tax income of $1,050,000, computed as:Income before labor and taxes ............ $1,710,000Labor costs ........................................... ?Pre-tax income ...................................... $1,050,000This implies:Labor costs = $660,000 orAverage wage per worker = $660,000 / 22 employees = $30,000 per employee Since the current salary level is $35,000, Zear cannot achieve its target return level and give a salary raise to its employees.(CFA Adapted)a. ROCE = $1,650 / $3,860 = 42.7%b. NOPAT = ($2,550 + $10) x (1-0.35) = $1,664NOA = $7,250-$3,290 = $3,960RNOA (using year-end NOA balance) = $1,664 / $3,960 = 42%The effect of financial leverage, thus, is only 0.7% as NFO/NFE are insignificant. Most of Merck’s ROCE in this year is derived from operating results.Pre-tax income to sales 0.36Net income to sales 0.23Sales/current assets 1.47Sales / fixed assets 2.97Sales / total assets 0.98Total liabilities / equity 0.88L-T liabilities / equity 0.03a. 1. RNOA = NOPATAvg. NOANOPAT = [$186,000 + $2,000 - $120,000 - $37,000 + $1,000] x 50% = $16,000 Note: we include income from equity investments under the assumptions that these are operating rather than financial investments. We also include the cumulative effect as operating in the absence of information to the contrary. Minority interest and discontinued operations are nonoperating (minority interest is therefore, treated as equity in the ROCE computation).NOA Year 6 = $138,000 - $29,000 - $7000 - $3,600 = $98,400 NOA Year 5 = $105,000 - $23,000 - $2,000 - $2,000 = $78,000RNOA = $16,000 / ([$98,400 + $78,000]/2) = 18.14%2. ROCE = Net income - Preferred dividendsAverage common equityROCE = ($10,000 –$0) /[($55,400* + $47,800*)/2] = 19.38% *Note: minority interest is treated as equity. If Minority interest is ignored, the ROCE is 19.8%b. NFO = NOA - EquityYear 6: $43,000; Year 5: $30,200LEV = Avg. NFO / Ave Equity = ([$43,000 + $30,200] / 2) / ([$55,400* + $47,800*] /2)= 0.71NFE = NOPAT – Net incomeYear 6: $6,000NFR = NFE / Avg. NFO = $6,000 / ([$43,000 + $30,200] / 2) = 16.4%Spread = RNOA – NFR = 18.14% - 16.4% = 1.74%ROCE = RNOA + LEV x Spread = 18.14 + 0.71 x 1.74% = 19.38%94% (18.14%/19.38%) of Zeta’s ROCE is derived for m operating activities. The company is effectively using leverage, however, as indicated by the positive spread, but the leverage does not contribute significantly to Zeta’s return on equity and may not be worth the added risk.a. ROCE = [Net income –preferred dividends] / stockholders’ equity**end of year in this problemROCE Year 5: [$14 – $0] / $125 = 11.2%ROCE Year 9: [$34 - $0] / $220 = 15.5%RNOA Year 5 = ($35 x 0.50) / ($52 + $123) = 10.0%RNOA Year 9 = ($68 x 0.50) / ($63 + $157) = 15.5%ROCE = RNOA + Leverage x SpreadYear 5: 10.0% + 1.2% = 11.2%Year 9: 15.5% + 0 = 15.5%b. Texas Talcom’s ROCE has increased form years 5 to 9. The source is thisincrease, however, has been an increase in RNOA as the leverage effect is zero in Year 9 since its long-term debt has been retired. Given the RNOA increase, additional leverage might be explored as a way to increase shareholder returns.Selling price per unit ...................... $6.00 $5.00 $50.00 $50.00 Unit cost ........................................... $5.00 $4.00 $32.50 $30.00Analysis of Variation in Product A SalesIncreased quantity at Yr 6 prices (3,000 x $5) ........................ $ 15,000 Price increase at Yr 6 quantity (7,000 x $1) ........................... 7,000 Quantity increase x price increase (3,000 x $1) .................... 3,000 Analysis of Variation in Product A Cost of SalesIncreased quantity at Yr 6 cost (3,000 x $4) ........................... (12,000) Increased cost at Yr 6 quantity (7,000 x $1) ........................... (7,000) Cost increase x quantity increase (3,000 x $1) ...................... (3,000) Net Variation (Increase) in Gross Margin for Product A ............. $ 3,000Analysis of Variation in Product B SalesDecreased quantity at Yr 6 prices (300 x $50) ....................... $ (15,000) Analysis of Variation in Product B Cost of Sales:Decreased quantity at Yr 6 cost (300 x $30) .......................... 9,000 Increased cost at Yr 6 quantity (900 x $2.50) ......................... (2,250) Cost increase x quantity decrease (300 x $2.50) . (750)Net Variation (Decrease) in Gross Margin for Product B ............ $ (7,500)Summary of Net Variation in Margins for Products A and BNet increase from product A ......................................................... $ 3,000 Net decrease from product B ........................................................ (7,500) Net Decrease in Gross Margin ...................................................... $ (4,500)a.SPYRES MANUFACTURING COMPANYComparative Common-Size Income StatementsYear Ended December 31 IncreaseYear 9 Year 8(Decrease)Net sales ............................. 100.0% 100.0% 20.0% Cost of goods sold ............ 81.7 86.0 14.0 Gross margin on sales ...... 18.3 14.0 57.1 Operating expenses .......... 16.8 10.2 98.0 Income before taxes .......... 1.5 3.8 (52.6) Income taxes ...................... 0.4 1.0 (52.0) Net income ......................... 1.1 2.8 (52.9)b. Performance in Year 9 is poor when compared with Year 8. One bright spot isthe percentage of Cost of Goods Sold to Sales, which decreased in Year 9.However, Operating Expenses climbed sharply. This sharp climb in operating expenses is unexpected since there is usually a larger fixed cost component comprising these costs compared with that for Cost of Goods Sold.Management should further check operating expenses. If operating expenses had remained at the Year 8 level of 10.2%, income would have been up favorably for Year 9. Operating expenses may have included a future-directed component such as advertising or training costs. Also, management would want to follow up on the change in gross margin. The sharp improvement in gross margin may have been due to factors such as the liquidation LIFO inventory layers or, alternatively, to something more fundamental with the activities of the firm.。
国际财务管理JeffMadura英文第八版chap5case答案

国际财务管理JeffMadura英文第八版chap5case答案Chapter 5 Case Study use of currency derivative instruments1.the table shows how the option choices have changed for Blades. If it wants to ensure no morethan 5% above the spot rate, the option with the exercise price of $.00756 should be considered, although the premium on that option now has increased to be worth 2% of the exercise price (more expensive). The option premium is higher than what the firm normally prefers to pay. The firm could pay a lower premium by purchasing the alternative option with an exercise price of $.00792, but that exercise price is 10% above the existing spot rate. So if the firm is to continue to use options, it must accept either paying a higher premium than it would prefer, or a higher exercise price that limits the effectiveness of the hedge. If it decides to use an option, the tradeoff is paying a premium of $1417.50 to limit the payables amount to $99000 or paying a premium of $1890 to limit the payables amount to $94500. The preferred option depends on the firm’s assessment about the yen, but many analysts would select the higher premium (an extra $472.50) to pay for the lower limit on payables.2.Blades could also remain unhedged, but given its previous desire to hedge because of thevolatile movements even before the event, it would have an even stronger desire to hedge once the event caused more uncertainty-increasing event, Blades should seriously consider futures contracts as an alternative to options. Thus, the firm could purchase a futures contract and lock in its future payment at the same futures price as before the event.3.The expectation of the future spot rate would be equal to the futures rate, $.006912. Forexample, suppose speculators expect the yen to appreciate. They would buy yen futures now. If the yen appreciates, they will buy the yen at the futures rate in two months and sell them at the spot rate prevailing at that time. Thus, if the market expectation is that the yen will appreciate, all speculators will engage in similar actions, which would place upward pressure on the futures rate and downward pressure on the expected future spot rate. This process continues until the futures rate is equal to the expected future spot rate. Therefore, the expected spot rate at the delivery date is equal to the futures rate, $.006912.4.① remain unhedged: expected spot rate $.006912Amount of yen payables 12500000Cost in two months ($.006912 * 12500000) $86,400.00② purchase one futures contract: futures price per unit $.006912Amount of yen payables 12500000Cost in two months ($.006912 * 12500000) $86,400.00③ purchase two optionsOptions information option1 option 2Exercise price $.00756 $.00792Premium per unit $.0001512 $.0001134Units in contract 6,250,000 6,250,000Total premium Exercise? Amount paid for yen Total paidTwo options, exercise $1890.00 NO $86400 $88290Price of $.00756Two options, exercise $1417.50 NO $86400 $87917.50Price of $.00792One option of each $ 1653.75 1-no; 2-no $86400 $ 88053.75Exercise priceSo, the optimal choice, given the expected future spot rate in Q3 and given that the decision is made solely on a cost basis, is to purchase futures contract, which would result in an actual cost on the delivery date of $86400. Although remaining unhedged also has an expected cost of $86400, actual costs incurred on the delivery date to purchase yen may deviate substantially from this value, depending on the movements of the yen between the order date and the delivery date. Consequently, the firm will probably prefer using a futures contract over remaining unhedged.5.No, as mentioned in the case, the yen is very volatile and, therefore, the actual costs incurredmay turn out to be lower had the firm employed either an option to hedge the yen payable or remained unhedged. By employed a futures contract to hedge, which locks the firm into the price it will pay to buy the yen at the delivery date, the firm forgoes any cost advantage that may unhedged and employing options afford the firm with the flexibility to buy yen at the spot rate;this flexibility is not available with a futures contract.6.If the futures rate remains at its current level while the expected spot rate at the delivery dateincreased($.006912 + 2*0.0005=$.007912), remaining unhedged will become more expensive than hedging with a futures contract. However, as the spreadsheet shows, the option with the exercise price of $.00756 would now be exercised. Nevertheless, since both options have an exercise price greater than the futures rate of $.006912, and since the expected futurespot rate is greater than the futures rate, the futures contract is again the best choice for the firm. Spreadsheet: ① remain unhedged: expected spot rate $.007912Amount of yen payables 12500000Cost in two months ($.006912 * 12500000) $98,900.00② purchase one futures contract: futures price per unit $.006912Amount of yen payables 12500000Cost in two months ($.006912 * 12500000) $86,400.00③ purchase two o ptionsOptions information option1 option 2Exercise price $.00756 $.00792Premium per unit $.0001512 $.0001134Units in contract 6,250,000 6,250,000Total premium Exercise? Amount paid for yen Total paidTwo options, exercise $1890.00 YES $94,500.00 $96,390.00 Price of $.00756Two options, exercise $1417.50 NO $98,900.00 $100,317.50 Price of $.00792One option of each $ 1653.75 1-YES; 2-no $96,700.00 $ 98,353.75Exercise price。
财务报表分析(英文版)答案
Chapter 3Analyzing Financing ActivitiesBusiness activities are financed through either liabilities or equity. Liabilities are obligations requiring payment of money, rendering of future services, or dispensing of specific assets. They are claims against a company's present and future assets and resources. Such claims are usually senior to holders of equity securities. Liabilities include current obligations, long-term debt, capital leases, and deferred credits. This chapter also considers securities straddling the line separating liabilities from equity. Equity refers to claims of owners to the net assets of a company. While claims of owners are junior to creditors, they are residual claims to all assets once claims of creditors are satisfied. Equity investors are exposed to the maximum risk associated with a business, but are entitled to all residual rewards associated with it. Our analysis must recognize the claims of both creditors and equity investors, and their relationship, when analyzing financing activities. This chapter describes business financing and how this is reported to external users. We describe two major sources of financing—credit and equity—and the accounting underlying reports of these activities. We also consider off-balance-sheet financing, including Special Purpose Entities (SPEs), the relevance of book values, and liabilities "at the edge" of equity. Techniques of analysis exploiting our accounting knowledge are described.1. The two major source of liabilities, for both current and noncurrent liabilities, areoperating and financing activities. Current liabilities of an operating nature—such as accounts payable and operating expense accruals—represent claims on resources from operating activities. Current liabilities such as notes payable, bonds, and the current maturities of long-term debt reflect claims on resources from financing activities.2. The major disclosure requirements (in SEC FRR, Section 203) for financing-relatedcurrent liabilities such as short-term debt are:a. Footnote disclosure of compensating balance arrangements including those notreduced to writingb.Balance sheet segregation of (1) legally restricted compensating balances and (2)unrestricted compensating balances relating to long-term borrowing arrangements if the compensating balance can be computed at a fixed amount at the balance sheet date.c. Disclosure of short-term bank and commercial paper borrowings:i. Commercial paper borrowings separately stated in the balance sheet.ii. Average interest rate and terms separately stated for short-term bank and commercial paper borrowings at the balance sheet date.iii. Average interest rate, average outstanding borrowings, and maximum month-end outstanding borrowings for short-term bank debt and commercial papercombined for the period.d. Disclosure of amounts and terms of unused lines of credit for short-termborrowing arrangements (with amounts supporting commercial paper separately stated) and of unused commitments for long-term financing arrangements.Note that the above disclosures are required for filings with the SEC but not necessarily for disclosures in published annual reports. It should also be noted that SFAS 6 states that certain short-term obligations should not necessarily be classified as current liabilities if the company intends to refinance them on a long-term basis and can demonstrate its ability to do so.3. The conditions required by SFAS 6that demonstrate the ability of the company torefinance it short-term debt on a long-term basis are:a. The company has actually issued a long-term obligation or equity securities toreplace the short-term obligation after the date of the company's balance sheet but before its release.b. The company has entered into an agreement with a bank or other source of capitalthat permits the company to refinance the short-term obligation when it becomes due.Note that financing agreements that are cancelable for violation of a provision that can be evaluated differently by the parties to the agreement (such as “a material adverse change” or “failure to maintain satisfactory operations”) do not meet thesecond condition. Also, an operative violation of the agreement should not have occurred.4. Since the interest rate that will prevail in the bond market at the time of issuance ofbonds can never be predetermined, bonds usually are sold in excess of par (premium) or below par (discount). This premium or discount represents, in effect, an adjustment of the coupon rate to the effective interest rate. The premium received is amortized over the life of the issue, thus reducing the coupon rate of interest to the effective interest rate incurred. Conversely, the discount also is amortized, thus increasing the effective interest rate paid by the borrower.5. The accounting for convertibility and warrants impacts income and equity as follows:a. The convertible feature is attractive to investors. As a result, the debt will beissued at a slightly lower interest rate and the resulting interest expense is less (and conversely, equity is increased). Also, diluted earnings per share is reduced by the assumed conversion. At conversion, a gain or loss on conversion may result when equity instruments are issued.b. Similarly, warrants attached to bonds allow the bonds to pay a lower interest rate.As a result, interest expense is reduced (and conversely, equity is increased). Also, diluted earnings per share is affected because the warrants are assumed converted.6. It is important to the analysis of convertible debt and stock warrants to evaluate thepotential dilution of current and potential shareholders if the holders of these options choose to convert them to stock. This potential dilution would represent a real wealth transfer for existing shareholders. Currently, this potential dilution is given little formal recognition in financial statements.7. SFAS 47requires note disclosure of commitments under unconditional purchaseobligations that provide financing to suppliers. It also requires disclosure of future payments on long-term borrowings and redeemable stock. Required disclosures include:For purchase obligations not recognized on purchaser's balance sheet:a. Description and term of obligation.b. Total fixed and determinable obligation. If determinable, also show these amountsfor each of the next five years.c. Description of any variable obligation.d. Amounts purchased under obligation for each period covered by an incomestatement.For purchase obligations recognized on purchaser's balance sheet, payments for each of the next five years.For long-term borrowings and redeemable stock:a. Maturities and sinking fund requirements for each of the next five years.b. Redemption requirements for each of the next five years.8. a. Information about debt covenant restrictions are available in the details of thebond indentures of a company. Moreover, key restrictions usually are identified and discussed in the financial statement notes.b. The margin of safety as it applies to debt contracts refers to the slack that thecompany has before it would violate any of the debt covenant restrictions and be in technical default. For example, if the debt covenant mandates a maximum debt to assets ratio of 50% and the current debt to assets ratio is 40%, the company issaid to have a margin of safety of 10%. Technical default is costly to a company. Thus, as the margin of safety decreases, the relative level of company risk increases.9. Analysis of the terms and conditions of recorded liabilities is an area deserving ananalyst's careful attention. Here, the analyst must examine critically the description of debt, its terms, conditions, and encumbrances with a desire to satisfy him/her as to the ability of the company to meet principal and interest payments. Important analyses in the evaluation of liabilities are the examination of features such as:•Contractual terms of the debt agreement, including payment schedule•Restrictions on deployment of resources and freedom of action•Ability to engage in further financing•Requirements relating to maintenance of working capital, debt to equity ratio, etc.•Dilutive conversion features to which the debt is subject.•Prohibitions on disbursements such as dividendsMoreover, we review the audit report since we expect auditors to require satisfactory recording and disclosure of all existing liabilities. Auditor tests include the scrutiny of board of director meeting minutes, the reading of contracts and agreements, and inquiry of those who may have knowledge of company obligations and liabilities.The analysis of contingencies (and commitments) also is aided by financial statement analysis. However, the analysis of contingencies and commitments is more challenging because these liabilities typically do not involve the recording of assets and/or costs. Here, the analyst must rely on information provided in notes to the financial statements and in management commentary found in the text of the annual report and elsewhere. Due to the uncertainties involved, the descriptions of commitments, and especially contingent liabilities, in the notes are often vague and indeterminate. This means that the burden of assessing the possible impact of contingencies and the probabilities of their occurrence is passed to the analyst. Yet, the analyst assumes that if a contingency (and/or commitment) is sufficiently serious, the auditor can qualify the audit report.The analyst, while utilizing all information available, must nevertheless bring his/her own critical evaluation to bear on the assessment of all existing liabilities and contingencies to which the company may be subject. This process must draw not only on available disclosures and reports, but also on an understanding of industry conditions and practices.10. a. A lease is classified and accounted for as a capital lease if at the inception of thelease it meets one of four criteria: (1) the lease transfers ownership of the property to the lessee by the end of the lease term; (2) the lease contains an option to purchase the property at a bargain price; (3) the lease term is equal to 75 percent or more of the estimated economic life of the property; or (4) the present value of the rentals and other minimum lease payments, at the beginning of the lease term, equals 90 percent of the fair value of the leased property less any related investment tax credit retained by the lessor. If the lease does not meet any of those criteria, it is to be classified and accounted for as an operating lease.With regard to the last two of the above four criteria, if the beginning of the lease term falls within the last 25 percent of the total estimated economic life of the leased property, neither the 75 percent of economic life criterion nor the 90 percent recovery criterion is to be applied for purposes of classifying the lease and as a consequence, such leases will be classified as operating leases.b. Summary of accounting for leases by lessees:1. The lessee records a capital lease as an asset and an obligation at an amountequal to the present value of minimum lease payments during the lease term,excluding executory costs (if determinable) such as insurance, maintenance,and taxes to be paid by the lessor together with any profit thereon. However,the amount so determined should not exceed the fair value of the leasedproperty at the inception of the lease. If executory costs are not determinablefrom provisions of the lease, an estimate of the amount shall be made.2. Amortization, in a manner consistent with the lessee's normal depreciationpolicy, is called for over the term of the lease except where the lease transferstitle or contains a bargain purchase option; in the latter cases amortizationshould follow the estimated economic life.3. In accounting for an operating lease the lessee will charge rentals to expensesas they become payable, except when rentals do not become payable on astraight-line basis. In the latter case they should be expensed on such a basisor on any other systematic or rational basis that reflects the time pattern ofbenefits serviced from the leased property.11. a. The major classifications of leases by lessors are:1. Sales-type leases2. Direct financing leases3. Operating leasesThe criteria for classifying each type are as follows: If a lease meets any one of the four criteria for capitalization (see question 10a above) plus two additional criteria (see below), it is to be classified and accounted for as either a sales-type lease (if manufacturer or dealer profit is involved) or a direct financing lease. The additional criteria are (1) collectibility of the minimum lease payments is reasonable predictable, and (2) no important uncertainties surround the amount of unreimbursable costs yet to be incurred by the lessor under the lease. A lease not meeting these criteria is to be classified and accounted for as an operating lease.b. The accounting procedures for leases by lessors are:Sales-type leases1. The minimum lease payments plus the unguaranteed residual value accruingto the benefit of the lessor are recorded as the gross investment in the lease.2. The difference between gross investment and the sum of the present value ofits two components is recorded as unearned income. The net investmentequals gross investment less unearned income. Unearned income is amortizedto income over the lease term so as to produce a constant periodic rate ofreturn on the net investment in the lease. Contingent rentals are credited toincome when they become receivable.3. At the termination of the existing lease term of a lease being renewed, the netinvestment in the lease is adjusted to the fair value of the leased property tothe lessor at that date, and the difference, if any, recognized as gain or loss.The same procedure applies to direct financing leases (see below.)4. The present value of the minimum lease payments discounted at the interestrate implicit in the lease is recorded as the sales price. The cost, or carryingamount, if different, of the leased property, and any initial direct costs (ofnegotiating and consummating the lease), less the present value of theunguaranteed residual value is charged against income in the same period.5. The estimated residual value is periodically reviewed. If it is determined to beexcessive, the accounting for the transaction is revised using the changedestimate. The resulting reduction in net investment is recognized as a loss inthe period in which the estimate is changed. No upward adjustment of theestimated residual value is made. (A similar provision applies to directfinancing leases.)Direct-financing leases1. The minimum lease payments (net of executory costs) plus the unguaranteedresidual value plus the initial direct costs are recorded as the gross investment.2. The difference between the gross investment and the cost, or carrying amount,if different, of the leased property, is recorded as unearned income. Netinvestment equals gross investment less unearned income. The unearnedincome is amortized to income over the lease term. The initial direct costs areamortized in the same portion as the unearned income. Contingent rentals arecredited to income when they become receivable.Operating leasesThe lessor will include property accounted for as an operating lease in the balance sheet and will depreciate it in accordance with his normal depreciation policy.Rent should be taken into income over the lease term as it becomes receivable except that if it departs from a straight-line basis income should be recognized on such basis or on some other systematic or rational basis. Initial costs are deferred and allocated over the lease term.12. Where land only is involved the lessee should account for it as a capital lease if eitherof the enumerated criteria (1) or (2) is met. Land is not usually amortized.In a case involving both land and building(s), if the capitalization criteria applicable to land (see above) are met, the lease will retain the capital lease classification and the lessor will account for it as a single unit. The lessee will have to capitalize the land and buildings separately, the allocation between the two being in proportion to their respective fair values at the inception of the lease.If the capitalization criteria applicable to land are not met, and at the inception of the lease the fair value of the land is less than 25 percent of total fair value of the leased property both lessor and lessee shall consider the property as a single unit. The estimated economic life of the building is to be attributed to the whole unit. In this case if either of the enumerated criteria (3) or (4) is met the lessee should capitalize the land and building as a single unit and amortize it.If the conditions above prevail but the fair value of land is 25 percent or more of the total fair value of the leased property, both the lessee and the lessor should consider the land and the building separately for purposes of applying capitalization criteria (3) and (4). If either of the criteria is met by the building element of the lease it should be accounted for as a capital lease by the lessee and amortized. The land element of the lease is to be accounted for as an operating lease. If the building element meets neither capitalization criteria, both land and buildings should be accounted for as a single operating lease.Equipment which is part of a real estate lease should be considered separately and the minimum lease payments applicable to it should be estimated by whatever means are appropriate in the circumstances. Leases of certain facilities such as airport, busterminal, or port facilities from governmental units or authorities are to be classified as operating leases.13. In the books of the lessee, the primary consideration regarding leases is theappropriate classification of operating leases. When leases are classified as operating leases, the lease payment is recorded as rent expense. However, lease assets and liabilities are kept off the balance sheet. Because of this, many companies avail themselves of operating lease treatment even when the underlying economics justify capitalizing the leases. If this is done, the asset and liabilities of a company are underreported and its debt-to-equity ratios are biased downward. Often such leases are a form of “off balance sheet” financing. Therefore, an analyst must carefully examine the classification of operating leases and capitalize the leases when the underlying economic justify.14. For the lessor, when a lease is considered an operating lease, the leased assetremains on its books. For the lessee, it will not report an asset or an obligation on its balance sheet.15. When a lease is considered a capital lease for both the lessor and the lessee, thelessor will report lease payments receivable on its balance sheet. The lessee will report the leased asset and a lease obligation totaling the present value of future lease payments.16. a. Rent expenseb. Interest expense and depreciation expense17. a. Leasing revenueb. Interest revenue (and possibly gain on sale in the initial year of the lease)18. Property, plant, and equipment can be financed by having an outside party acquirethe facilities while the company agrees to do enough business with the facility to provide funds sufficient to service the debt. Examples of these kinds of arrangements are through-put agreements, in which the company agrees to run a specified amount of goods through a processing facility or "take or pay" arrangements in which the company guarantees to pay for a specified quantity of goods whether needed or not.A variation of the above arrangements involves the creation of separate entities forownership and the financing of the facilities (such as joint ventures or limited partnerships) which are not consolidated with the company's financial statements and are, thus, excluded from its liabilities.Companies have attempted to finance inventory without reporting on their balance sheets the inventory or the related liability. These are generally product financing arrangements in which an enterprise sells and agrees to repurchase inventory with the repurchase price equal to the original sales price plus carrying and financing costs or other similar transactions such as a guarantee of resale prices to third parties.19. In a defined contribution plan, the employer promises to currently contribute afixed sum of money to the employee’s retirement fund, so it is the contribution that is defined. In a defined benefit plan, the employer promises to pay a periodic pension benefit to the employee after retirement (typically until death), so it is thebenefit that is defined. The risk (or reward) of the investment performance in the former case is borne by the employee and in the latter by the employer.20.Accounting for defined contribution plans is simple: whenever a contribution is made it is recorded as an expense. Defined benefit plans’ accounting is complex and involves currently recording a liability based on future expected benefit payments and an asset to the extent the plan is funded. Pension expense in this case depends on the changes in pension obligation and the return on plan assets.21. (a) Pension obligation: This is the present value of expected benefit payments tothe employee based on current service.(b) Pension asset: this is the fair market value of the plan assets on the date of thebalance sheet.(c) Net economic position of the plan: This is the difference between the fairmarket value of the pension assets and the pension obligation. When this difference is positive the plan is referred to as overfunded and when negative the plan is termed underfunded.(d) Economic pension cost: Economically, pension cost is equal to the change(increase) in pension obligation minus return on plan assets. This is called the funded status. Typically, pension obligation changes because of additional employee service (service cost) and present value effects (interest cost).22. The common non-recurring components are: (a) Actuarial Gain/Loss: This arisesbecause of changes in actuarial assumptions such as discount rates and compensation growth rates. (b) Prior Service Cost: This arises because of changes in pension formulas, usually because of renegotiation of pension contracts. In addition, the return on plan assets can have a recurring or expected component and an unexpected component that is not expected to persist into the future.SFAS 158 has a complex method by which the non-recurring amounts are first deferred, i.e., excluded from current income, and then the opening net deferrals are amortized over the remaining employee service. For this purpose, the excess of actual plan asset return over expected return is netted against actuarial gains or losses and then deferred/amortized using something called the corridor method.Prior service cost is deferred and amortized separately on its own.23. The net periodic pension cost is a smoothed version of the economic pension cost.For determining net periodic pension cost, all non-recurring or unusual components of economic pension cost (e.g., actuarial gain/loss, prior service cost, excess of actual plan return over expected return) are deferred and amortized using a complex corridor method. The rationale for this smoothing mechanism is that the economic pension cost is very volatile. Including this in income would cause income to be very volatile and also hide the true operating profitability of the firm.24. Under the current standard (SFAS 158), the balance sheet recognizes the fundedstatus of the plan. The income statement, however, does not recognize the net economic cost, but a net periodic pension cost in which unusual or non-recurring pension cost components are deferred and amortized. The cumulative net deferrals are included in accumulated other comprehensive income. Under the older standard, SFAS 87, the net periodic pension cost is recognized on the income statement. The balance sheet however, merely recognized the accrued (or prepaid) pension cost, which was simply the cumulative net periodic pension cost.The accrued (or prepaid) pension cost was equal to the funded status minus cumulative net deferrals.25. Under SFAS 158, the difference between the economic pension cost (whicharticulates with the change in the funded status which is recorded in the balance sheet) and the smoothed net periodic pension cost (which is essentially the net deferral for the period) is included in other comprehensive income for the period, which is transferred to accumulated other comprehensive income on the balance sheet.26. Other post employment benefits (OPEBs) are retirement benefits other thanpensions, such as post retirement health care benefits. OPEBs differ from pension on two dimensions: (1) most of them are non-monetary and therefore create difficulties in estimation and (2) because of tax laws, companies rarely fund these benefits.27. The pension note consists of five main parts: (1) an explanation of the reportedposition in the balance sheet, (2) details of net periodic benefit costs, (3) information regarding actuarial and other assumptions, (4) information regarding asset allocation and funding policies, and (5) expected future contributions and benefit payments.28. Since the funded status of the plan is reported on the balance sheet under SFAS158, there is no adjustment to the balance sheet that is required. However, some analysts note that netting pension assets and obligations tends to mask the underlying pension risk exposure and thus recommend showing pension assets and liabilities separately without netting them out.Adjustments to the income statement depend on the purpose of the analysis. The net periodic benefit cost that is reported under SFAS 158 is appropriate if the objective of the analysis is identifying the permanent or core component of income.However, to estimate a period’s economic income it is advisable to use the economic pension cost which includes all non-recurring items.29. The major actuarial assumptions underlying pension accounting are: (a) discountrate (b) compensation growth rate and (c) expected rate of return on pension assets. Less important assumptions include life expectancy and employee turnover. In addition OPEBs also make assumptions about healthcare cost trends.Managers can affect both the post-retirement benefit economic position (or economic cost) and the reported cost. For example, choosing a higher discount rate can reduce the pension obligation and thus improve economic position(funded status). Also, increasing the expected rate of return on plan assets can reduce the reported pension cost (net periodic pension cost).31. Pension risk exposure is the risk that a company is exposed to from its pensionplans. This risk arises because of a mismatch of the risk profiles of pension assets and liabilities, primarily because companies invest pension assets whose returns are not correlated with those of long-term bonds which form the basis for the discount rate assumption affecting the measurement of the pension obligation.The pensions “crisis” in the early 2000s in the U.S. was precipitated by an unusual combination of declining equity values (which lowered the value of pension assets) and declining long-term interest rates, which increased the pension obligations.The net effect was a steep reduction in pension funded status which even resulted in some companies filing for bankruptcy.The three factors that an analyst needs to consider when evaluating pension exposure are: (1) the plan’s funded status relative to the company’s assets (2) the pension intensity, i.e., the size of the pension obligation and assets (without netting) relative to total assets and (3) the extent to which the assets and obligation is mismatched, which can be determined by the proportion of pension assets invested in non-debt securities or assets.32. Current cash flows for pensions (or OPEBs) measure the extent of companycontributions into the plan during the year. For pensions, this is obviously not a good indicator of future cash contributions since contributions are affected by complex factors which eventually affect the funded status of the plan. For OPEBs, current contributions are a somewhat better indicator of future contributions since contributions in a period typically equal benefits paid (since most OPEB plans are unfunded), and benefits are more predictable over time.33. Accumulated benefit obligation (ABO): This is the present value of estimated futurepension benefit payments assuming current compensation. Projected benefit obligations (PBO): This is the present value of estimated future pension benefit payments assuming future compensation on the date of retirement. ABO is closer to the legal obligation.34. The “corridor method” is used for determining the amount of amortization for netgain or loss. Net gain or loss for the period is determined by netting the actuarial gain/loss for the period with the difference between actual and expected return on plan assets. Then the net gain or loss for the period is added to the cumulative net gain or loss at the start of the period. Next a “corridor” for cumulative net gain/loss is determined as the greater of 10% of PBO or 10% of plan assets (whichever is greater). Only the amount of cumulative net gain/loss beyond this corridor (in either direction) is amortized.35. Like the pension obligation, the OPEB obligation is the present value of expectedfuture benefits attributable to employee service to-date. The present value of the expected future benefits is termed EPBO and that portion which is attributable to service to-date is termed the APBO. The APBO is the obligation that is used to estimate the funded status or the economic position of the plan reported on the balance sheet.。
财务管理课后答案第三章
财务管理课后答案第三章Chapter 3Discussion Questions3-1.If we divide users of ratios into short-term lenders, long-term lenders, andstockholders, in which ratios would each group be most interested, and for what reasons?Short-term lenders –liquidity ratios because their concern is with the firm ’s ability to pay short-term obligations as they come due.Long-term lenders –leverage ratios because they are concerned with therelationship of debt to total assets. They also will examine profitability to insure that interest payments can be made.Stockholders –profitability ratios, with secondary consideration given to debt utilization, liquidity, and other ratios. Since stockholders are the ultimate owners of the firm, they are primarily concerned with profits or the return on their investment.3-2.Explain how the Du Pont system of analysis breaks down return on assets. Also explain how it breaks down return on stockholders ’ equity.The Du Pont system of analysis breaks out the return on assets between the profit margin and asset turnover.Return on Assets = Profit Margin × Asset TurnoverassetsTotal SalesSales income Net assets Total income Net ?=In this fashion, we can assess the joint impact of profitability and asset turnover on the overall return on assets. This is a particularly useful analysis because we can determine the source of strength and weakness for a given firm. For example, a company in the capital goods industry may have a high profit margin and a low asset turnover, while a food processing firm may suffer from low profit margins, but enjoy a rapid turnover of assets.The modified form of the Du Pont formula shows:()()Return on assets investment Return on equity =This indicates that return on stockholders’ equity may be influenced by returnon assets, the debt-to-assets ratio or a combination of both. Analysts orinvestors should be particularly sensitive to a high return on stockholders’equity that is influenced by large amounts of debt.3-3. If the accounts receivable turnover ratio is decreasing, what will be happening to the average collection period?If the accounts receivable turnover ratio is decreasing, accounts receivable willbe on the books for a longer period of time. This means the average collectionperiod will be increasing.3-4. What advantage does the fixed charge coverage ratio offer over simply using times interest earned?The fixed charge coverage ratio measures the firm’s ability to meet all fixedobligations rather than interest payments alone, on the assumption that failureto meet any financial obligation will endanger the position of the firm.3-5. Is there any validity in rule-of-thumb ratios for all corporations, for example, a current ratio of 2 to 1 or debt to assets of 50 percent?No rule-of-thumb ratio is valid for all corporations. There is simply too muchdifference between industries or time periods in which ratios are computed.Nevertheless, rules-of-thumb ratios do offer some initial insight into theoperations of the firm, and when used with caution by the analyst can provideinformation.3-6. Why is trend analysis helpful in analyzing ratios?Trend analysis allows us to compare the present with the past and evaluate ourprogress through time. A profit margin of 5 percent may be particularlyimpressive if it has been running only 3 percent in the last ten years. Trendanalysis must also be compared to industry patterns of change.3-7. Inflation can have significant effects on income statements and balance sheets, and therefore on the calculation of ratios. Discuss the possible impact ofinflation on the following ratios, and explain the direction of the impact basedon your assumptions.a.Return on investment.b.Inventory turnover.c.Fixed asset turnover.d.Debt-to-assets ratio.a. assetsTotal incomeNet investment on Return =Inflation may cause net income to be overstated and total assets to be understated causing an artificially high ratio that is misleading.b. InventorySalesturnover Inventory =Inflation may cause sales to be overstated. If the firm uses FIFO accounting, inventory will also reflect ―inflation-influenced ‖ dollars and the net effect will be nil.If the firm uses LIFO accounting, inventory will be stated in old dollars and too high a ratio could be reported.c. assetsFixed Salesover asset turn Fixed =Fixed assets will be understated relative to their replacement cost and to sales and too high a ratio could be reported.d. assetsTotal debtTotal assets total Debt to =Since both are based on historical costs, no major inflationary impact will take place in the ratio.3-8.What effect will disinflation following a highly inflationary period have on the reported income of the firm?Disinflation tends to lower reported earnings as inflation-induced income is squeezed out of the firm ’s income statement. This is particularly true for firms in highly cyclical industries where prices tend to rise and fall quickly.3-9.Why might disinflation prove to be favorable to financial assets?Because it is possible that prior inflationary pressures will no longer seriously impair the purchasing power of the dollar, lessening inflation also means that the required return that investors demand on financial assets will be going down, and with this lower demanded return, future earnings or interest should receive a higher current evaluation.3-10. Comparisons of income can be very difficult for two companies even though they sell the same products in equal volume. Why?There are many different methods of financial reporting accepted by theaccounting profession as promulgated by the Financial Accounting StandardsBoard. Though the industry has continually tried to provide uniform guidelinesand procedures, many options remain open to the reporting firm. Every item onthe income statement and balance sheet must be given careful attention. Twoapparently similar firms may show different values for sales, research anddevelopment, extraordinary losses, and many other items.Chapter 3Problems1. Griffey Junior Wear, Inc., has $800,000 in assets and $200,000 of debt. It reports netincome of $100,000.a. What is the return on assets?b. What is the return on stockhol ders’ equity?3-1. Solution:Griffey Junior Weara.Net income Return on assets (investment) =Total assets$100,00012.5%$800,000=b.Net income Return on equityStockholders' equity=Stockholders' equity total assets total debt$800,000$200,000$600,000Net income $100,00016.67%Stockholder's equity $600,000Return on assets (investment)Return on equity (1Debt/Assets)$2Debt/Assets =-=-====-=00,00025%$800,00012.5%12.5%Return on equity 16.67%(1.25).75====-2. Hugh Snore Bedding, Inc., has assets of $400,000 and turns over its assets 1.5 times per year. Return on assets is 12 percent. What is its profit margin (return on sales)?3-2. Solution:Hugh Snore Bedding, Inc.Sales Assets total asset turnover$400,000 1.5%$600,000Net income Assets Return on assets $48,000$400,00012%Net income$48,000/$600,0008%Sales=?=?==?=?==3One-Size-Fits-All Casket Co.’s income statement for 2008 is as follows:Sales .......................................................................................$3,000,00 0 Cost of goods sold .................................................................. 2,100,000 Gross profit ............................................................................ 900,000 Selling and administrative expense ........................................ 450,000 Operating profit ...................................................................... 450,000 Interest expense ...................................................................... 75,000 Income before taxes ............................................................... 375,000 Taxes (30%) ........................................................................... 112,500Income after taxes .................................................................. $262,500a . Compute the profit margin for 2008.b . Assume in 2009, sales increase by 10 percent and cost of goods sold increases by 25%. The firm is able to keep all other expenses the same. Once again, assume a tax rate of 30 percent on income before taxes. What are income after taxes and the profit margin for 2009?3-3. Solution:One Size-Fits-All Casket Co.a. Profit margin for 2008Net Income$262,500==8.75%Sales$3,000,000b. Sales .............................................................. $3,300,000*Cost of goods sold ........................................ 2,625,000**Gross profit ................................................... 675,000Selling and administrative expense .............. 450,000Operating profit ............................................ 225,000Interest expense ............................................ 75,000Income before taxes ..................................... 150,000Taxes (30%) ................................................. 45,000Income after taxes (2008) ............................. $105,000* $3,000,000 × 1.10 = $3,300,000** $2,100,000 × 1.25 = $2,625,000Profit Margin for 2009Net Income$105,000==3.18%Sales$3,300,000Using the Du Pont method, evaluate the effects of the following relationships for the Butters Corporation.a . Butters Corporation has a profit margin of 7 percent and its return on assets (investment) is 25.2 percent. What is its assets turnover?b . If the Butters Corporation has a debt-to-total-assets ratio of 50 percent, what would the firm’s return on equity be?c . What would happen to return on equity if the debt-to-total-assets ratio decreased to 35 percent?3-4. Solution:Butters Corporationa. Profit margin Total asset turnover Return on asset (investment)7%25.2%25.2%Total asset turnover 7%3.6x=?===b. Return on assets (investment)Return on equity (1Debt/Assets)25.2%(10.50)25.2%0.5050.40%=-=-=3-14. (Continued)c.Return on assets (investment) Return on equity(1Debt/Assets)25.2%(1.35)25.2%0.6538.77%=-=-==5. Assume the following data for Interactive Technology and Silicon Software.Interactive Technology (IT)Silicon Software (SS)Net income…………………..$ 15,000 $ 50,000Sales…………………………150,000 1,000,000Total assets…………………..160,000 400,000Total debt…………………….60,000 240,000Stockholders’ equity………….100,000 160,000a. Compute return on sto ckholders’ equity for both firms using ratio 3a in the text. Whichfirm has the higher return?b. Compute the following additional ratios for both firms.Net income/SalesNet income/Total assetsSales/Total assetsDebt/Total assetsc. Discuss the factors from part b that added or detracted from one firm having a higherreturn on stockholders’ equity than the other firm as computed in part a.3-5. SolutionInteractive Technology and Silicon Softwarea. Interactive SiliconTechnology (IT) Software (SS)Net income$15,000$50,00015% 31.25% Stockholders' equity$100,000$160,000===Silicon Software (SS) has a much higher return on stockholders’equity than Interactive Technology (IT).3-5. (Continued)b. Interactive SiliconTechnology (IT)Software (SS)Net income $15,000$50,00010%5%Sales $150,000$1,000,000Net income $15,000$50,0009.37%12.5%Total assets $160,000$400,000Sales $150,000$1,000,000.937x 2.5xTotal assets $160,000$400,000Debt T otal assets==========$60,000$240,00037.5%60%$160,000$400,000==c. As previously indicated, Silicon Software (SS) has a substantially higher return on stockholder’s equity than Interactive Technology (IT). The reason is certainly not to be found on return on the sales dollar where Interactive T echnology has a higher return than Silicon Software (10% vs. 5%).However, Silicon Software has a higher return than Interactive Technology on total assets (12.5% versus 9.37%). The reason is clearly to be found in total asset turnover, which strongly favors Silicon Software over Interactive Technology (2.5x versus .937x). This factor alone leads to the higher return on total assets.6. Perez Corporation has the following financial data for the years 2007 and 2008:20072008 Sales…………………………$8,000,000 $10,000,000Cost of goods sold……………6,000,000 9,000,000Inventory……………………..800,000 1,000,000a. Compute inventory turnover based on ratio number 6, Sales/Inventory, for each year.b. Compute inventory turnover based on an alternative calculation that is used by manyfinancial analysts, Cost of goods sold/Inventory, for each year.c. What conclusions can you draw from part a and part b?3-6. Solution:Perez Corporation20072008a.Sales$8,000,000$10,000,00010x 10x Inventory8,00,0001,000,000===b. Cost of goods sold$6,000,000$9,000,0007.5x 9xInventory800,0001,000,000===c. Based on the sales to inventory ratio, the turnover hasremained constant at 10x. However, based on the cost ofgoods sold to inventory ratio, it has improved from7.5x to 9x.The latter ratio may be providing a false picture ofimprovement in this example simply because cost of goods sold has gone up as percentage of sales (from 75 percent to90 percent). Inventory is not really turning over any faster.7. The balance sheet for Stud Clothiers is shown below. Sales for the year were $2,400,000,with 90 percent of sales sold on credit.STUD CLOTHIERSBalance Sheet 200XAssets Liabilities and Equity Cash……………………$ 60,000 Accounts payable……………..$ 220,000 Accounts receivable…...240,000 Accrued taxes…………………30,000 Inventory………………350,000 Bonds payable(long-term)……………………150,000 Plant and equipment…... 410,000 Common stock………………..80,000Paid-in capital…………………200,000Retained earnings…………….. 380,000 Total assets………...$1,060,000 Total liabilities and equity…$1,060,000 Compute the following ratios:a. Current ratio.b. Quick ratio.c.Debt-to-total-assets ratio.d.Asset turnover.e.Average collection period.3-7. Solution:Stud Clothiersa.Current assets Current ratioCurrent liabilities$650,000$250,0002.6x===3-7. (Continued)b.(Current assets inventory)Quick ratio Current liabilities$650,000$350,000$250,000$300,000$250,0001.2x -=-===c. Total debtDebt to total assets Total assets$400,000$1,060,00037.74%=== d. Sales Asset turnover Total assets$2,400,000$1,060,0002.26x=== e.Accounts receivableAverage collection period Average daily credit sales($2,400,0000.90)$240,000$240,000/40 days360 days $6,000 per day====8. Using the income statement for Times Mirror and Glass Co., compute the following ratios:a. The interest coverage.b. The fixed charge coverage.The total assets for this company equal $80,000. Set up the equation for the Du Pontsystem of ratio analysis, and compute c, d, and e.c. Profit margin.d. Total asset turnover.e. Return on assets (investment).TIMES MIRROR AND GLASS COMPANYSales .............................................................................. $126,000Less: Cost of goods sold ......................................... 93,000Gross profit ................................................................... $ 33,000Less: Selling and administrative expense ............... 11,000Less: Lease expense ................................................ 4,000Operating profit* ........................................................... $ 18,000Less: Interest expense ............................................. 3,000Earnings before taxes .................................................... $ 15,000Less: Taxes (30%)................................................... 4,500Earnings after taxes ....................................................... $ 10,500*Equals income before interest and taxes.3-8. Solution:Times Mirror and Glass Co.a.Income before interest and taxes Times interest earnedInterest$18,000$3,0006x===3-8. (Continued)b.Income before fixed charges and taxes Fixed charge coverageFixed charges$18,0004,000$3,000$4,000$22,000$7,0003.14x=+=+==c. ===Net IncomeProfit MarginSales$10,500$126,0008.33%d.Sales Total asset turnoverTotal assets$126,000$80,0001.575x===e.Net income Sales Return on assets (investments)Sales Total assets8.33% 1.575x13.12%=?=?=9. Omni Technology Holding Company has the following three affiliates:Personal ForeignSoftware Computers Operations Sales ................................. $40,000,000 $60,000,000 $100,000,000Net income (after taxes) ... 2,000,000 2,000,000 8,000,000Assets ............................... 5,000,000 25,000,000 60,000,000Stockholders’ equity ........ 4,000,000 10,000,000 50,000,000a. Which affiliate has the highest return on sales?b. Which affiliate has the lowest return on assets?c. Which affiliate has the highest total asset turnover?d. Which affiliate has the highest return on stockholders’ equity?e. Which affiliate has the highest debt ratio? (Assets minus stockholders’ equityequals debt.)f. Returning to question b, explain why the software affiliate has the highest return ontotal assets.g. Returning to question d, explain why the personal computer affiliate has a higherreturn on stockholders’ equity than the foreign operations affiliate even though it hasa lower return on total assets.3-9. Solution:Omni Technology Holding Companya. Net income/salesPersonal Foreign Software Computers Operations 5.0% 3.3%8.0%The foreign operation affiliate has the highest return on sales.b. Net income/total assetsPersonal Foreign Software Computers Operations 40.0%8.0%13.3%The personal computer affiliate has the lowest return on assets3-9. (Continued)c. Sales/total assetsPersonal Foreign Software Computers Operations8.0x2.4x 1.7xThe software affiliate has the highest return on total assetturnover.d. Net income/Stockholders’ equityThe Software affiliate has the highest return on stockholder’s equity.e. Debt/total assetsPersonal ForeignSoftware Computers Operations20.0%60.0%16.7%The personal computer affiliate has the highest debt/total assets ratio.f. This is because of its high total turnover ratio of 8.0x times inpart c. g. This is because the personal computer affiliate has a higherdebt ratio (60.0%) than the foreign operations affiliate (16.7%).Personal ForeignSoftware Computers Operations50.0%20.0%16.0%。
财务报表分析与运用 杰拉尔德 课后答案英文版第十一章
Chapter 11 SolutionsOverview:Problem Length Problem #s{S} 1 - 4, 9, 11, 12, 15, 16, 21, 22{M} 5, 7, 8, 10, 13, 14, 17, 18, 20, 23, 24 {L} 6, 19, 251.{S}(i) Interest expense = 12% x $10,000 (beginning balance oflease obligation) = $1,200.(ii)The lease obligation will be reduced by $100 ($1,300 - $1,200) leaving an obligation of $9,900.(iii)Cash from Operations will be reduced by the interest payment of $1,200. Cash from investing activities willnot be affected. (However, the firm will report thecapi tal lease as a “noncash investment and financingactivity.” Cash from financing will be reduced by theamount of the principal payment of $100.(iv)Under an operating lease there is no lease obligation on the balance sheet. The only effect on income isRent Expense of $1,300. Similarly, CFO is reduced by$1,300. (CFI and CFF are not affected).2.{S}(i) In a take-or-pay arrangement, a company contracts tobuy or pay for a certain amount of a supplier’scommodity at a predetermined price over a stated timeperiod. The company, by entering the contract, incursan economic liability. However, since it is only acontract, no accounting liability is recorded on thebalance sheet – it is off balance sheet.(ii) In a sale of receivable, a company “sells” its receivables to a third-party, usually a financialinstitution. Typically, the sale is made at adiscounted price from the face value and the sellermay retain some or all of the default risk. The sale,in substance, is a financing arrangement with thereceivables being used as collateral. However, underGAAP, the transaction is treated as a sale and thedebt does not appear on the balance sheet.(iii)A joint venture represents an investment of 50% or less by one company (the “investor”) in anothercompany. Under GAAP, since ownership is not over 50%,the assets and liabilities of the joint venture neednot be consolidated with the parent’s assets andliabilities. Hence, any debt taken on by the jointventure remains off balance sheet even when theinvestor is liable for the debt.11-13.{S} Effect of choice of interest rate on lessee:4.{S}a. Pallavi must capitalize the lease because the leaseagreement contains a bargain purchase option. Notethat the lease also meets one other capitalizationcriterion: The present value of minimum lease paymentsexceeds 90% of the fair market value of the equipment(see part b for computations).b. The fair market value of the asset is $125,000. Thepresent value of the MLPs is $127,785 (at 8%, thelower of the lessee and lessor rates); the asset mustbe capitalized at the (lower) fair market value. (Notethat the lease obligation is the sum of the presentvalues of the MLPs and the bargain purchase option –the latter is not provided.)11-2c.Leases must be capitalized at the lesser of thepresent value of lease payments or the fair value ofthe lease; in this case, the lease must be capitalizedat the fair value of $125,000.d. The existence of the bargain purchase option requiresdepreciation over the estimated economic life of theasset rather than the (shorter) lease term.e. The option creates the presumption that the asset willbe held past the expiration date of the lease.Otherwise it must be assumed that use of the assetwill revert to the lessor at expiration, requiring thelessee to depreciate the leased asset over the(shorter) lease term.5.{M}a. The following states the effects of Tolrem using thecapital lease method as compared with the operatinglease method.(i) Cash from operations is higher as only theinterest portion of lease expense is deductedfrom operating cash flows; total lease expense isdeducted for operating leases.(ii) Financing cash flow is lower for capital lease, as part of lease rental is treated asamortization of liability and classified asfinancing cash outflow.(iii)Investing cash flow is not affected by the lease treatment. However, the firm will report capitalleases in the statement of cash flows (or afootnote) as noncash investment activities.(iv) Net cash flow reflects the actual rental payment and is unaffected by the financial reportingtreatment of the lease.(v) Debt/equity ratio is higher for capital lease, as it records the present value of minimum leasepayments as debt and reduces net income (andtherefore equity) in first year.(vi) Interest coverage ratio is usually (not always) lower for capital lease method, which reportsinterest expense but also higher EBIT, see (vii).For coverage ratios well above 1.0, the ratiowill decline. If the increase in interest expenseexceeds the increase in EBIT, the ratio willdecline even for firms with very low coverageratios.11-3(vii)Operating income is lower for operating lease because the total lease payment is an operatingexpense; for capital lease, interest portion oflease expense is nonoperating.(viii)Net income is higher for operating lease; total lease expense (interest plus depreciation) ishigher for capital lease.(ix) Deferred tax assets are higher for capital lease;as lease treatment for tax purposes is unaffectedby accounting choice, capital lease will generatea deferred tax asset as taxable income (operatinglease) exceeds pretax income (capital lease).(x) Taxes paid are unaffected by choice of method.(xi) Pretax return on assets is higher for operating leases as pretax income is higher and no assetsare reported as the result of the lease; acapital lease reduces income and reports leaseassets. Post-tax return on assets is higher forthe same reasons.(xii)Pretax return on equity: both pretax income and equity are higher for operating than for capitalleases. The higher pretax income should increasethe ratio in all but exceptional cases. Post-taxreturn on equity should be higher for same reason.However as increase in post-tax income equals(for first year) increase in equity, there may bemore exceptional cases.b. Net income (viii) will be lower for the operatinglease after the "crossover" point. As total net income over the life of the lease is unaffected by the accounting choice, higher net income (operating lease) in the early years must be offset by lower net income in later years.c. Consistent use of the operating lease method in placeof capitalization will not change the direction of the effects shown in part A, but will increase their magnitude. In aggregate, new leases will keep Tolrem from reaching the crossover point for net income, keeping net income and return ratios higher than if the leases were capitalized.11-46.{L}a. and b.4 payment annuity of $10,000 per year at 8%). Assuming zero residualvalue, depreciation = $43,121/5 = $8,624.2Interest expense = 8% x ($43,121 - $10,000) = $2,650Caramino's EBIT is $1,376 higher; Aglianico reportsrental expense but no depreciation expense since itdoes not record an asset. Because total lease expense(depreciation plus interest) is higher than the leaserental, Caramino's EBT is lower by $1,274. After adeferred income tax offset of $510, Caramino's netincome is $764 lower.Caramino's deferred tax debit (asset) results from thedifference between financial reporting (capital lease)and tax reporting (operating lease). The $1,274 timingdifference results in a deferred tax debit of $1,274x .40 = $510c. andd. Comparison of Cash Flow Statementshave been collected by the end of the year.11-5Caramino reports higher cash from operations by $10,000. Since the tax rate is 40%, Aglianico (operating lease firm) reports aftertax operating cash outflow of $6,000. Caramino (capital lease firm) pays no interest but, since it uses the operating lease method for taxes, receives a tax deduction of $4,000 for the annual payment of $10,000. Caramino's aftertax operating cash inflow is $4,000.The difference ($6,000 + $4,000 = $10,000) is recorded by Caramino as a financing cash outflow; this is the amount of the lease payment considered a reduction of the capitalized lease liability for 2002. [Note that the lease payment made on January 1, 2002 has no interest component; there is no accrued interest as the lease has just begun. Interest accrued during the year will be paid January 1, 2003.]e. There is no impact on investing cash flow for eitherfirm. Caramino would report the present value of the capital lease as a noncash investment activity.f. The net cash outflow for each firm is the leasepayment of $10,000 less the tax deduction of $4,000 (40% tax rate). Only the classification of cash flow components is affected by the lease method used.g. By using the capital lease method, Caramino reportshigher debt and lower income. However the firm also reports higher cash from operations. The choice of method may reflect different debt covenants or simplya preference among financial characteristics.11-67.(M) a. Since it is the first year:Capital lease obligations $2,596,031Repayment of capital lease obligations 3,969Capital lease at inception $2,600,000b. Amortization expense =$2,600,000 - $2,479,570 = $120,430Assuming the asset is being amortized on a straightline basis over the lease term, the lease term =$2,600,000/$120,430 = 21.6 or 22 yearsTotal expense = interest + amortization =$120,430 + $223,733 = $344,163c. CFO was reduced by the interest expense of $223,733and CFF was reduced by the “repayment of capital leaseobligations” of $ 3,969d. Free cash flows should be reduced by $2,600,000 – the“cost” of the leased asset.e. (i) Lease expense would be lease payment =$223,733 + $3,969 = $227,702(ii) CFO would be reduced by lease payment of $227,702f. Using 1999 payment only: $223,733/$2,600,000 = 8.6%Using all the payments, we have exact MLP’s for thesix years 1999 –2004. The “thereafter” MLP’s totaling$4,596 thousand are spread over 16 years; i.e. $287.25thousand/year. Equating this stream to the presentvalue of $2,600,000 yields a rate (IRR) of 9.3%.The two methods yield rates within “range” of eachother especially when we consider that the ratederived from the first method is typically downwardbiased.11-78.{M}a. The adjustment involves the addition of the interestcomponent of minimum lease payments to stated interestexpense. The adjustment reflects a partial, de factocapitalization of operating leases.(i)Unadjusted Ratio of Earnings to Fixed Charges:Pretax earnings $ 2,363,646Interest on indebtedness 68,528Earnings before interest and taxes (EBIT) $ 2,432,174Fixed Charges:Interest on indebtedness $ 68,528Unadjusted Ratio of Earnings to Fixed Charges 35.5X(ii) The unadjusted ratio is almost four times the adjusted ratio. Note: the SEC rule that governsthis calculation assumes that the interestcomponent is one-third of the MLP. The trueinterest component may be higher or lower,changing the coverage ratio.b. Reported debt-to-equity = $550,000/$2,233,303 = 0.25c. Calculation of amounts adjusted for leasecapitalization:The Limited, Inc.1999 Working Capital Position and Capitalization Table1 Working capital is reduced by the principal component of the 2000MLPs calculated as$436,670 = [($643,828 - (.06 x $3,452,628)],where $3,452,628 is the present value calculated in note 2 below.2 Present value of MLPs using an interest rate of 6%. The “thereafter”MLPs are spread using the constant rate assumption; ($502,880 in 2005and 2006 and $422,102 in 2007).11-89.{S} Note: all amounts in $millionsa. Debt to equity = ($2,416 + $235)/$4,448 = 0.60b. (i) Interest portion of 2001 payment = $63-$39 = $24Therefore interest rate = $24/$235 = 10.2%(ii)Using the constant rate assumption yields theThe IRR that equates the above to $235 is 7.9%c. Under the constant rate assumption, the payment streamto be discounted at 10.2% isThe present value is $7,435d. Adjusted debt-to-equity is($2,416 + $235 + $7,435)/$4,448 = 2.27The adjustment increases the ratio almost four-fold.The real effect is greater as equity would be lower ifDelta had capitalized its operating leases at theirinception.e. After adjustment, both AMR’s and Delta’s ratios are atsimilar levels of 2.3x.Had the lower rate been used, the present value ofDelta’s operating lease would be significantly higheras would its debt-to-equity ratio.f. The adjustments are appropriate for two reasons(1)To obtain the appropriate levels of the ratio foreach firm. For both companies, the reported ratiosunderstate their financial leverage.(2)For comparison purposes. Before adjustment,Delta’s ratio at 0.6x is 50% lower than AMR’s 0.9x.After adjustment, that superiority is removed asboth firms have similar ratios.11-910.{M}a. The following MLP stream is assumed (€ million):At a rate of 7%, the present value is €505.3 millio nb. (i) €1,294/€14,145 = 0.09(ii)(€1,294 + €505)/€14,145 = 0.13c.Another assumption would be to find a decline ratefrom the initial payment of €166.5 such that the sumof the years 2 to 5 payments using that decline rateequals €275.2; i.e. solve for d i n the followingequation(d + d2 + d3 + d4 ) x €166.5 = €275.2The above can be solved by trial and error and thesolution is d = 67.66% with a MLP stream of €112.6,€76.2, €51.5 and €34.9.Using this MLP stream would increase the present valueof the operating lease obligation.11.{S}a. We use the constant rate assumption, yielding thefollowing payment stream (€ millions)At a discount rate of 7%, the present value is €12,543.b. (i) Reported debt-to-equity = €1,294/€14,145 = 0.09Adjusted for part a:(€1,294 + €12,543)/€14,145 = 0.98(ii) Adjusting for operating leases as well(€1,294 + €12,543 + €505)/€14,145 = 1.0111-1012.{S}a. The cash outflow of $25.6 million represents thedecrease in the balance of sold but uncollectedreceivables ($192.8 - $167.2). It represents netcollections (by Arkla as the firm continues to servicethe receivables) of receivables sold; amountscollected from previously sold receivables were paidto the purchasers of those receivables.b. Receivables sold but uncollected as of 12/31/93 can bededuced to be:Outstanding 3/31/94 $118.7 millionDecrease during quarter 107.7Outstanding 12/31/93 $226.4 millionc. The required adjustments to Arkla's CFO for quartersended:March 31, 1994 March 31, 1995 Cash outflow $107.7 $25.6These amounts are the decrease in receivables soldduring the respective quarters. The adjustment isrequired because the cash flow was recognized when thereceivables were sold rather than when customers paid.This adjustment produces a measure of CFO based onwhen the receivables were collected.13.{S} All amounts in $millionsa. (i) Current ratio was increased by 15% from 1.61 to1.86 as a result of receivable sale.Reported = $686/$369 = 1.86Adjusted = ($686 + $153.1)/($369 + $153.1) = 1.61 (ii) & (iii)Average receivables as reported =.5($546 + $312) = $429Adjusting for sale of receivables would increaseaverage receivables by.5($153.1 + $115) = $134 to $563Reported turnover = $2,951/$429 = 6.88# of days = 365/6.88 = 53 daysAdjusted turnover = $2,951/$563 = 5.24# of days = 365/5.24 = 70 daysAs a result of the receivable sale the cash cyclelooked better than it really was by (70 –53) =17 days and the receivables turnover “improved”from 5.24 to 6.8811-11b. Reported debt/equity = $1,096/$950 = 1.15Debt should be adjusted upwards by the receivablessold to ($1,096 + $153.1 =) $1,249.1 with a resultantdebt to equity ratio of $1,249.1/$950 = 1.31.c. Reported cash flow from operations increased by $154million from ($96) million to $58 million. Theseamounts were inflated by the increase in receivablessold and should be adjusted by that increase:Adjusted CFO 1998 = ($96) – ($115 – $103.3) = ($107.7)Adjusted CFO 1999 = $58 - ($153.1 – $115) = $19.9After removing the effects of the receivable sales,CFO increased by $127.6 million from ($107.7) millionto $19.9 million. The actual level and trend in CFO isconsiderably lower than the amounts reported.14.{M}a.11-12The sale of receivables allowed the company to show an improved receivable turnover and cash cycle; the improvement was more significant for 1999 as the amount of receivables sold increased and sales declined.b. The effect on the current ratio is minimal as the sameamount is added to both numerator and denominator of the ratio and that ratio is close to 1. The debt-to-equity ratio adjustment is more significant in 1999 due to the increase in receivables sold and the lower equity amount.c. As the calculation below indicates, both the level andtrend in CFO are overstated as a result of the sale of receivables.11-1315.{S}a. The cash from investment amounts are equivalent to thechange in the “Receivables sold by Funding topurchaser”. (Reca ll that 1997 was the first year ofreceivable sales.)b.receivable balances 17% to 21% less than their actuallevels.c. The sale of receivables should be reported as cashfrom financing as they are, in effect, borrowings(using receivables as collateral).16.{S} Aluminum producers that have take-or-pay contracts forenergy and/or bauxite have converted significantvariable costs into fixed costs. Therefore, theirmarginal costs are much lower than if these contractshad not been entered into. Under these conditions,aluminum producers will continue production as long asrevenue exceeds marginal costs, even though they losemoney based on total costs.17.{M}a. By transferring receivables to a (unconsolidated)subsidiary, Lucent removed the receivables from itsreceivable balance and reported them as “Investments,”a somewhat different asset category. Analyticaladjustment is required to eliminate the artificialreported “improvements” in receivables turnover, thecurrent ratio and the cash cycle.b. The adjustment requires adding $700 million (inaddition to the balance of uncollected receivables) tothe 1999 accounts receivable and current assets. Theeffect is to increase the growth in receivables,reduce the receivable turnover and increase the numberof days receivables outstanding. This adjustmentreinforces the conclusion (see text page 381) thatLucent’s receivables growth outpaced the growth insales. On the other hand, the adjustment improves the1999 current ratio.11-14Note: The bold values indicate which amounts were altered from Exhibit 11-4. The Exhibit 11-4 amounts for those items affected by the adjustment are shown in parentheses.11-1518.{M}a. Debt should be increased by:$ 20 million (present value of operating lease)5 (guarantee)7 (present value of take-or-pay agreement)$ 32 millionThere is no effect on equity as each obligation isoffset by a corresponding asset:Leased assets for operating leaseReceivable for Crockett's obligation to repay debtSupply agreementThe recomputed debt-to-equity ratio is:($12 + $32)/$20 = 2.2X as compared to .6X beforeadjustmentb. Additional interest expense is:Lease (effective interest rate is about 18%).18 x $20 = $3.6 millionBond guarantee .10 x 5 = 0.5Total $ 4.1 millionBefore adjustment, the interest expense is $1.0 millionand the times interest earned ratio is 5.0, implyingEBIT of $5.0 million.After adjustment, the ratio is:($5.0 + $4.1)/($1.0 + $4.1) = 1.78XNo adjustment has been made for the take-or-paycontract, as it does not affect 1993 interest expense.Adjustments in future years will be based on theimplicit interest rate of 21%.c. Reasons for entering into off-balance-sheet obligations:1. Avoidance of or mitigation of the risk of violatingdebt covenant restrictions.2. Leased assets revert to lessor after eight years,limiting risk of obsolescence.3. Guarantee of Crockett's debt may lower interestcosts, increasing profitability of investment.4. Contract with PEPE secures source of supply andpossibly advantageous pricing.11-16d. Additional information needed for full evaluation:1. (Lease) Useful life of leased assets; conditionsunder which lease can be canceled; nature ofleased assets.2. (Guarantee) Financial condition of Crockett; bondcovenants.3. (Take-or-pay) Alternate sources of supply;quantity to be purchased relative to total needs;price provisions of contract.19.{L}a. As the table below indicates, the declining paymentassumption using a 92% declining rate (the averagerate over the first five years (2000 - 2004)) is agood approximation for JC Penney. The present value is$3,320; a deviation of one-half of one percent fromthe stated present value of $3,302. If the constantpayment assumption is made, the error is about fourpercent.11-17b. Using only the first year payment: Payment = $66 andcurrent portion = $16; therefore interest portion = $50 and interest rate = $50/$417 =12%.Using all payments:Constant payment assumption implies MLP’s of $54 from 2004 through 2017 and $12 in 2018. Equating this payment stream to $417 yields an IRR of 11.8%For the declining payment assumption, we would use a declining rate of 95%, the average of (2000 - 2004).Using this rate yields an IRR of 10.44%The rate seems to be between 10.4%-12%. Given that two of the methods yield estimates closer to the high end of the range, using a rate of approximately 11.5% would be an appropriate estimate.c. The rate used by Sears is somewhat higher than that ofJ.C. Penney. That may be a function of (1)higher credit rating for Penney, (2)differing risk characteristics of the leased properties, or (3) Sears leases were entered into in periods of higher interest rates.d. Given the rapid decline over the first four years, wechoose to use the declining payment assumption. Usinga decline rate of .86 (the average over the first fiveyears) and a discount rate of 11.5% (from part b), the present value of the operating leases is $1,375 million.11-1820.{M} Adjusting for the operating lease results in adeterioration of the ratios in each case.* Year 2000 MLP = $352. Interest portion is equal to 11.5% x $1,325 = $158; Therefore, current portion of debt = $352 -$158 = $194** Present Value of operating leases as calculated in Problem 19 part d.† Assumes interest this year (1999) is approximately equal to next year’s (2000) interest levels.Note: No adjustment is made for pretax income, which maybe higher or lower depending on the age” of the lease.The earlier (later) in the lease term, expense is higher(lower) for the capital lease. On average the expense isidentical.As we do not know the relative age of theleases we assume no change.11-1921.{S} Sears’ MDA reports securitized (credit card) balancessold of $6,579 and $6,626 million in 1999 and 1998respectively. Adjusting for these balances (in 1999)requires adding $6,579 to accounts receivable andcurrent liabilities (assuming the debt is short-term)and increasing CFO by ($6,626 – $6,579) $47 million. Asthe table below indicates, the impact on these threeratios is considerable.22.{S} The adjusted ratios are poorer than those based on Sears’reported data. The adjustment for securitization ofreceivables accounts for far more of the impact than theoperating leases.Note: See problems 11-19, 11-20, and 11-21 for explanation of these adjustments11-2023.{M}a. Using th e constant rate assumption (MLP’s of $59million from 2004 - 2017 and $8 million in 2018), theimplicit interest rate is 4.19%.Note that Texaco has not guaranteed all of this lease.The total present value of the guaranteed portion ofthe lease is approximately ($336/44%) $764 million.b. The rate is somewhat lower than the 5% - 5.5% ratecalculated for Texaco in the chapter (page 385).c. Equilon may have less debt (in relation to theirassets) than Texaco, or the nature of its business (orof the leased assets) may be operationally less risky.The leases may have been entered into when interestrates were especially low.Assets are higher because inventory is replaced with (higher) receivables because of the recognition of manufacturing profit. Assets remain higher throughout the lease term.Revenues are higher in Year 1 as the sales-type lease recognizes a sale whereas the operating lease method does not. In later years, interest revenue from the sales-type lease should be lower than lease revenue for the operating lease. This effect is more pronounced over time; in year 9, interest income is low given the small remaining receivable.The revenue effect increases the asset turnover ratio in the first year. But the revenue effect reduces turnover in the ninth year.11-21Expenses are higher in year 1 due to the recognition of cost of goods sold. In later years, there is no expense for the sales-type lease; the operating lease method reports depreciation expense in every year, however.Initial period income and income-related ratios are higher for the sales-type lease because the sale (and income) is recognized at the inception of the lease. In later years, however, income is higher for the operating lease.Income taxes paid are the same since the lease cannot be considered a completed sale for tax purposes.Cash from operations is higher for the first year due to recognition of the sale (the investment in the lease is classified as an investing cash outflow). In later years the operating lease method shows higher cash from operations as rental income exceeds the interest income recorded for the sales-type lease (income taxes paid are the same).[See Exhibit 11-8 and the accompanying text for further explanation of these effects.]25.{L}a. The present value of the minimum lease paymentsreceivable of $170,271 (at 10%, the lower of lesseeand lessor rates) is more than 90% of the fair marketvalue of $185,250. Therefore, the lessee, Baldes,should capitalize the lease. It would be useful toknow whether the lessee has guaranteed the residualvalue of the leased asset.b. Leased assets $ 170,271Long-term lease obligation 167,298Current portion of lease obligation 2,973Total lease obligation $ 170,271Note that there are no income or cash flow statementeffects at the inception of the lease.11-2211-23c. (i) Balance sheet effects of capital lease:No impact on balance sheet if operating lease method applied. [Deferred tax assets reflecting the difference between total expense under the two methods would also be reported.](ii) Income statement effects of capital lease:1Interest expense for: 2001 = .10 x $170,271 2002 = .10 x $167,298 2Deprecation expense = $170,271/20 for each yearThe income statement would show lease expense of $20,000 each year under the operating lease method.(iii) Statement of cash flow effects of capital lease:The operating lease method reports $20,000 cash outflow from operations for each year.。
财务会计(双语)第三章答案
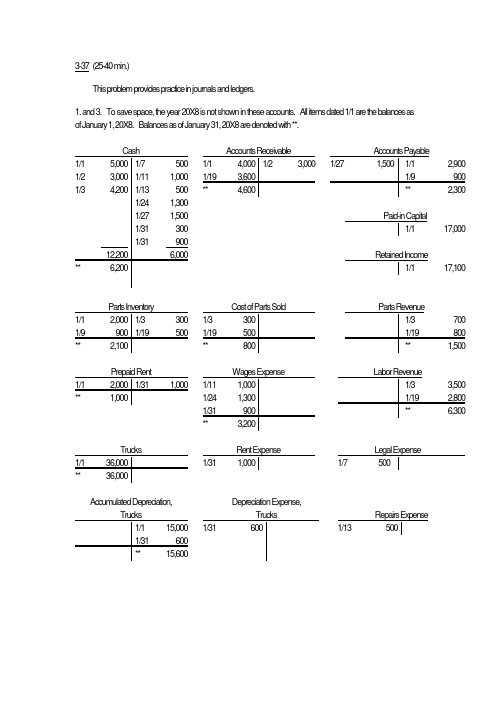
This problem provides practice in journals and ledgers.1. and 3. To save space, the year 20X8 is not shown in these accounts. All items dated 1/1 are the balances asof January 1, 20X8. Balances as of January 31, 20X8 are denoted with **.17,00017,100Accumulated Depreciation, Depreciation Expense,Depreciation Expense,Accumulated Depreciation2. Jan. 2 Cash 3,000Accounts receivable 3,000 Collections on account.Jan. 3 Cash 4,200Parts revenue 700Labor revenue 3,500 Services rendered.Jan. 3 Costs of parts sold 300Parts inventory 300 Cost of parts sold to customers.Jan. 7 Legal expenses 500Cash 500 Paid legal costs.Jan. 9 Parts inventory 900Accounts payable 900 Acquired parts on open account.Jan. 11 Wa ges expense 1,000Cash 1,000 Wa ges paid.Jan. 13 Repairs expense 500Cash 500 Repairs to truck.Jan. 19 Accounts receivable 3,600Parts revenue 800Labor revenue 2,800 Services rendered to hotel.Jan. 19 Cost of parts sold 500Parts inventory 500 Cost of parts sold to hotel.Jan. 24 Wa ges expense 1,300Cash 1,300 Wa ges paid.Jan. 27 Accounts payable 1,500Cash 1,500 Disbursements on account.Jan. 31 Rent expense 1,000Prepaid rent 1,000 Rent expense for January.Jan. 31 Depreciation expense, trucks 600Depreciation expense, equipment 200Accumulated dep., trucks 600Accumulated dep., equipment 200 Depreciation for January.Jan. 31 Gasoline expense 300Cash 300 Paid local service station for gas.Jan. 31 Wa ges expense 900Cash 900 Wa ges paid.3. Answered in conjunction w ith Requirement 1.4.See next page5. C1 Parts revenue 1,500Labor revenue 6,300Income summary 7,800C2 Income summary 7,100Cost of parts sold 800Wages expense 3,200Rent expense 1,000Legal expense 500Repairs expense 500Depreciation expense, trucks 600Depreciation expense, equipment 200Gasoline expense 300C3 Income Summary 700Retained income 7004. HA WKEY E APPLIANCE REPAIR SERVICE, INC.Trial BalanceJanuary 31, 20X8Cash $ 6,200Accounts receivable 4,600Parts inventory2,100Prepaid rent 1,000Trucks 36,000Equipment 8,000Accumulated depreciation, trucks $ 15,600 Accumulated depreciation, equipment 5,200 Accounts payable 2,300 Paid-in capital 17,000 Retained income 17,100 Parts revenue 1,500 Labor revenue 6,300 Cost of parts sold 800Wa ges expense 3,200Rent expense 1,000Legal expense 500Repairs expense 500Depreciation expense, trucks 600Depreciation expense, equipment 200Gasoline expense 300Totals $65,000 $65,0003-38 (35-40 min.) Amounts are in millions of dollars.Post.Ref. Debit Credit 1. a. Cash 2,100Revenues, company-ownedrestaurants 2,100 Cash salesb. Accounts and notes receivable 500Revenues from franchisedrestaurants 500 Fees due from independentowners of outletsc. Inventories 827Notes and accounts payable 827 Purchases on accountd. Cost of goods sold 820Inventories 820 Inventories solde. Depreciation expense 226Accumulated depreciation 226 Depreciation for yearf. Prepaid expenses 42Cash 42 Rents and insurance premiumsg. Operating expenses 37Prepaid expenses 37 Expirationsh. Other liabilities 148Cash 148 Disbursements to reduce liabilitiesi. Cash 590Accounts and notes receivable 590 Collectionsj. Notes and accounts payable 747Cash 747 Disbursements to creditorsk. Interest expense 100Cash 100 Disbursements for interestl. Operating expenses 1,510Cash 1,510 Outlays for miscellaneous expenses2. Beginning balance is 1/1/00. Ending balance is 12/31/00. Double rules are notdrawn for accounts containing a lone number. That number automatically servesas the ending balance.Notes andAccounts andRevenues, Company-Revenues from Prepaid Expenses Depreciation Expense Franchised(e) 226 (b) 500Property and3-38 (continued)3. McDONALD'S CORPORATIONTrial BalanceDecember 31, 2000(In Millions)Cash $ 563Accounts and notes receivable 618Inventories 90Prepaid expenses 367Property and equipment, at cost 22,451Other assets 3,085Accumulated depreciation $ 6,352 Notes and accounts payable 1,739 Other liabilities 9,537 Paid-in capital 1,305 Retained earnings 8,334 Revenues, company-ownedrestaurants 2,100 Revenues from franchisedrestaurants 500 Cost of goods sold 820Operating expenses 1,547Depreciation expense 226Interest expense 100Totals $29,867 $29,8673-39 (35-40 min.) Amounts are in millions of dollars.Post.Ref. Debit Credit 1. a. Inventories 1,750Accounts payable 1,750 Bought inventories on accountb1. Accounts receivable 2,500Sales 2,500 Sales on accountb2. Cost of goods sold 1,600Inventories 1,600 Cost of goods sold on accountc. Cash 2,550Accounts receivable 2,550 Collections from customersd. Accounts payable 1,650Cash 1,650 Disbursements to creditorse. Operating expenses 300Cash 300 Advertisingf. Prepaid expenses 20Cash 20 Rents and insuranceg. Operating expenses 18Prepaid expenses 18 Expirationsh. Other liabilities 110Cash 110 Pay ment in cashi. Interest expense 13Cash 13 Disbursements for interestj. Operating expenses 50Property and equipment, net 50 To record depreciationk. Cash 10Paid-in-capital 10 To record sale of shares2. Beginning balance is 1/1/00. Ending balance is 12/31/00. Double rules are not drawn for accountscontaining a lone number. That number automatically serves as the ending balance.605Property andOther Assets Interest(i) 133-39 (continued)3. KELLOGG COMPANYTrial BalanceDecember 31, 2000(In Millions)Cash $ 618Accounts receivable 629Inventories 654Property and equipment, net 2,591Prepaid expenses 2Other assets 834Accounts payable $ 405 Other liabilities 3,581 Paid-in capital 218 Retained earnings 605 Sales 2,500 Cost of goods sold 1,600Operating expenses 368Interest expense 13Totals $7,309 $7,3094. Cash increased because cash collected on accounts receivable greatly exceeded cash payments onaccounts payable and other cash disbursements.。
财务报表习题答案ir
第一部分学习引导案例案例一:东方电子事件1.财务报表数据的真实性存在一些问题:(1)在市场经济体制下,企业管理当局更多地注重短期利益,尽量减少成本,追逐近期的最大化利润,人为粉饰报表。
(2)由于企业发生的交易或事项据有复杂性和多样化,对帐务的会计处理更多地依赖会计职业判断,给企业管理当局留下可操作的空间。
(3)随着我国金融业务的快速发展,金融工具的种类越来越多,形式日趋复杂,金融工具运用带有很高的投机风险性。
2.行业数据在本例中显示的作用主要体现在:判断企业财务数据的真实性,如毛利率过高,或产品销售量超过市场正常水平等,都可以通过行业数据资料判断出来。
但行业数据只反映了行业内企业的平均情况,由于具体企业之间因其产品品种、经营战略和理财原则的不同,使得财务数据和指标间的差别很大,在这种情况下,用行业平均值或最好值对一个具体企业进行评判时所得到结论的准确性就会大打折扣。
所以对行业数据的使用要注意具体情况。
3.企业在一定的会计期间对外投资所取得的回报。
投资收益包括对外投资所分得的股利和收到的债券利息,以及投资到期收回或在到期前转让债权的款项高于账面价值的差额等。
投资收益不是企业通过自身的生产或劳务供应活动所得;而营业利润是企业在某一会计期间的营业收入和为实现这些营业收入所发生的费用、成本比较计算的结果。
它是企业通过自身的生产经营活动所取得的业务成果。
营业利润这一指标能够比较恰当地代表企业管理者的经营业绩。
4.投资收益是企业的非营业收入,将其列在营业利润中,会误导投资者对公司主营业务前景的判断,影响对企业成长性的客观判断。
案例二西南航空公司赢得优势的关键因素1.航空公司的主要经济特征:(1)高投入;(2)大量融资租赁业务;(3)资产负债率高;(4)受石油价格影响明显。
我国航空公司的现状:改革开放20多年来,我国民航运输业取得了长足的发展。
但相对于国土面积、人口基数、经济发展水平,我国航空运输市场尚处于培育开发的初期,发展潜力巨大。
财务报表分析与运用 杰拉尔德 课后答案英文版第一章
Chapter 1 - SolutionsOverview:Problem Length Problem #s{S} 1 to 23[M] 241.{S}(i) Short-term lenders are concerned primarily withliquidity. Accounting standards would focus primarilyon near-term cash flows and might include cash flowforecasting. Performance reporting would likelyemphasize cash-based measures.(ii) Long-term equity investors are primarily concerned with the earning power of the firm. Income measurement wouldbe the focus of standards for such users.(iii)Tax authorities are concerned with the generation of tax revenue. Accounting standards might limit the abilityof firms to shift income from one period to another andplace strict controls on the recognition and timing(accrual) of both revenues and deductible expenditures.(iv) Corporate managers seek to control their reported earnings, to cast the best possible light on theirstewardship. Accounting standards set by managers wouldbe highly flexible, with little supplementaryinformation and footnote disclosure.2.{S}The matching principle states that revenues should be matchedwith the expenses that generate them. As the revenues and related expenditures may be incurred in different accounting periods, accrual accounting is required to recognize them in the same period.3.{S}The going concern assumption states that the enterprise willcontinue operating in a normal fashion. This assumption permits financial statements to record assets and liabilities based on the cash flows that they will generate as the firm operates. If this assumption were absent, all assets and liabilities would have to be evaluated on a liquidation basis. Accrual accounting could not be used, as the assumption that expenditures would produce future revenues could no longer be made.1-14.{S}Public companies must provide current investors with detailedfinancial statements, mandated by the FASB and the SEC.Because of SEC filing requirements, annual and quarterly financial data are publicly available to potential investors as well. Private companies may not prepare audited financial data. When audited financial statements are prepared, they will lack some disclosures (e.g., earnings per share) and certain SEC-mandated data (such as the management discussion and analysis). In addition, these statements may not be made available to potential investors.5.{S}All public companies in the United States are required toissue financial statements whose form and content are determined by the FASB after much public debate. The SEC oversees this process and supplements these standards with additional disclosure requirements. As U. S. GAAP have an investor and user orientation, they require detailed disclosures. Financial statements issued by non-U.S. firms follow local (in some cases, IASB) accounting standards, with less disclosure. Local standards reflect legal and political requirements and often do not have the same investor protection objective as in the United States. Foreign firms generally do not provide quarterly reports; semi-annual reporting is the norm.6.{S}The FASB sets accounting standards for all audited financialstatements prepared under U.S. GAAP. The SEC has jurisdiction over all public companies. Given the overlapping jurisdiction, the SEC generally relies on the FASB to set standards but supplements those standards with additional disclosure requirements deemed necessary to inform and protect investors in public companies.7.{S}The balance sheet includes only those economic events thatqualify as assets and liabilities. As accounting standards define, in effect, assets and liabilities they determine which economic events are accounted for and which are ignored. Events ignored (such as many contracts) are excluded from the process of preparing financial statements. The recognition rules also influence managers' decisions regarding the form of contractual agreements used to acquire assets and incur liabilities, thereby affecting the preparation of financial statements.1-28.{S}Liabilities represent the assets of the firm funded by tradeand financial creditors. Equity represents the permanent capital of the firm, and is the residual after all liabilities have been satisfied. Thus the distinction between liabilities and equity is the difference between prior claims and permanent capital. Misclassification will over- or understate the firm's reported debt and the degree of leverage or financial risk.9.{S}Historical cost is more reliable as it reflects actual pasttransactions. Market values are less reliable as they may require assumptions and estimates. However, general inflation and specific price changes make historical costs less useful (relevant) as time passes. Market values always have relevance as they represent the current value of the firm's resources. The nature of the markets (liquidity, volatility, and transparency) affects the reliability of the values reported.10.{S} Contra accounts are deductions from asset or liabilityaccounts that accumulate valuation or other adjustments (such as accumulated depreciation) and reduce the asset or liability account to its "net" amount. Adjunct accounts accumulate certain adjustments outside the historical cost framework (such as fair value adjustments for marketable securities under SFAS 115) and other adjustments (for example, premiums and discounts on debt issues). Adjunct accounts are often reported separately.11.{S}Revenues and expenses result from the firm's operatingactivities; gains and losses result from valuation and other non-operating events. The latter are peripheral to the normal activities of the firm and, therefore, should be separated for analytic purposes.12.{S} Comprehensive income includes all changes in equity otherthan transactions with stockholders. It encompasses operating earnings, "non-recurring" items, valuation adjustments, and the cumulative effect of accounting changes. As it includes all changes in stockholders' equity (excluding transactions with owners), comprehensive income is more complete than "income from continuing operations"(most useful for earnings forecasting).1-313.{S}Recurring income refers to income from continuingoperations, the best measure of the operating profits of the firm for that time period, and therefore the best base for forecasting and valuation. Non-recurring items are unusual and/or infrequent in nature, and usually result from non-operating factors.14.{S}The classification of cash flows into three categorieshighlights their differing natures. Cash from operations reports the cash generated or used by the firm's operating activities. Cash for investment measures the outflow for investments in capacity, for acquisitions, or for long-term investments. Cash from financing indicates the source (debt or equity) of any financing required by the firm as well as distributions to preferred and common stockholders.These classifications should be viewed over time as indicators of the firm's liquidity and solvency. The relationship among these classifications is especially important.15.{S}Footnotes are an integral part of the financial statementsand are audited. They supply details that augment financial statement data (e.g. employee benefit plan data).Supplementary schedules may be included within the financial statements (e.g. oil and gas disclosures) but may not be audited.16.{S}The Management Discussion and Analysis is intended toexplain changes and trends in reported income statement, balance sheet, and cash flow items and therefore help financial statement users to interpret these financial statements. The MD&A should discuss trends, including those expected to continue in the future. This discussion should aid the prediction of future cash flows and earnings.1-417.{S} Global accounting standards offer the possibility ofcomparability, as all companies would be required to prepare financial standards using the same accounting methods.There may also be the following disadvantages:(i)Lack of comparability if there is no bodyempowered to enforce uniform application of globalstandards.(ii)Loss of the information provided by reconciliations from one set of accountingstandards to another, which sometimes highlightimportant aspects of a firm’s operations.(iii)D ifferent economic and social structures may require differing accounting standards. Forexample, in an environment where financing comesprimarily from banks rather than through issuanceof shares, accounting standards would beappropriately geared to the needs of creditorsrather than equityholders.18.{S}(i) The opinion should report any changes in accountingprinciples used and may refer to the footnote providingadditional information on the change.(ii) Changes in accounting estimates are not referred to in the auditor’s opinion.(iii)The auditor's report must describe uncertainties when they are material to the firm's financial position.(iv) While the auditor's opinion provides reasonable assurance that there are no material errors in thefinancial statements, it is not a guarantee againsterror or even fraud.Statement on Auditing Standards (SAS)82 (1997), requires auditors to assess the risk of financialstatement fraud.1-519.{S}a. Without knowledge of the effects of accounting changes,the analyst may draw incorrect conclusions about trendswithin the enterprise over time. Comparisons with othercompanies may also be made incorrectly if differencesin accounting methods or the effects of accountingchanges are ignored.b. Changes in accounting methods should be highlighted inthe auditor’s opinion to inform financial statementusers that year-to-year comparability is absent. Theaccounting changes that Roche adopted in 2000 havesignificant effects on reported data.20.{S}The preparer gathers financial data, chooses accountingprinciples and estimates, and assembles the data into financial statements using those methods and estimates. The auditor examines the financial statements for errors, and checks that the accounting methods and assumptions are permissible under GAAP and whether they have been applied consistently over time.21.{S}Companies generally prepare financial statements using theaccounting principles of their home country. When selling securities in a foreign jurisdiction, they may be required to prepare supplementary financial statements using the accounting standards of that country. The cost and inconvenience of this extra work may dissuade the firm from selling securities in that country, thus depriving that country's investors of the opportunity to invest.On the other hand, investors must choose between that firm's securities and those of home country firms using local accounting principles. If the foreign firm uses different accounting principles, investors may make poor investment decisions because of their inability to separate real differences between firms from differences caused by alternative accounting principles.22.{S}a. Because the probability of loss is so low (less thanone in ten thousand), Bonnywill will report no loss. Ifa fire occurs, the firm will then accrue the estimatedloss.b. An alternative method would accrue the expected valueof the loss, computed by multiplying the number ofunits sold by the expected loss per unit. The resultwould be 10,000 x .00009 x $100,000 = $90,000.1-623.{S}a. For firm A the probability of loss is remote (.3%) sothat no liability should be recognized. If an accidentoccurs, the firm would recognize a liability equal tothe expected loss.b. Firm B expects to have 10 workers' compensation claimseach year (10,000/1,000) with a loss of $10,000 perclaim. Thus firm B should accrue $100,000 per year. Thedifference from firm A is that the employee populationis large enough to make the loss predictable.24.{M}a. Note 5 of the Roche 2000 financial statements statesthat CHF1,282 million of the charge was paid in 1999.The same amount is shown within cash flows fromoperating activities.b.The remaining amount is included in Provisions (seeRoche note 26). There is no information as to whetherit is in the current or non-current provisions.c.The remaining provision will be included in cash flowsfrom operating activities when cash is paid.d.Assuming that the price fixing that led to thesettlement was confined to the vitamin business, thesettlement can be viewed as a nonoperating item thatshould reduce the valuation of Roche shares dollar-for-dollar rather than being deducted from the income usedto value the shares.e.However, there are two other arguments. One is that thesettlement may have damaged the vitamin business,reducing its value and, therefore, reducing the valueof the entire firm. T he second argument is that Roche’sbusiness reputation may have been harmed, resulting ina lower value for the firm. [Authors’ note: Rocheannounced an agreement to sell its vitamin division inSeptember 2002.]1-7。
财务报表分析与运用习题

Multiple Choices Exercises for FSA.1.As a general rule, revenue is normally recognized whenA.it is measurable.B.it is measurable and received.C.the earnings process is completed and cash receipt is assured.D.The measurement process is complete.2.If a company recognizes revenue earlier than justified under accrual accounting, which of thefollowing best describes the impact on accounts receivable and inventory, respectively?Accounts Receivable InventoryA. overstated oversatedB. overstated understatedC. understated overstatedD. understated understated3.The following are Samples of unusual or infrequent items EXCEPT:A.Gains or losses from disposal of a portion of a business segment.B.Losses resulting from foreign government expropriation of assets.C.Provisions for environmental remediation.D.Impairments, write-offs, write-downs, and restructuring costs.4.When a company discontinues and disposes of an operation, the action is considered:A.an extraordinary item.B. a prior period adjustment.C. a cumulative effect of a change in an accounting principle.D.separately and shown net of taxes on the income statement.5.Which one of the following is a change in an accounting principles?A. A change from FIFO to LIFO.B.Recording a prior period adjustment.C. A change in the estimated service life of machinery.D.Recording depreciation expense for the first time on machinery purchased five years ago.6.All of the following are general categories of nonrecurring items EXCEPT:A.unusual or infrequent items.B.discontinued operations.C.capitalization of leases.D.accounting changes.7. A firm discovered that it had used an incorrect accounting principles in 1996. On the firm’s 1997financial statements, this firm should report the impact of this error as:A.an extraordinary item.B. A nonrecurring item.C.Part of cost of goods sold.D. A prior period adjustment.8.The completed contract method should be used whenA.There is a reasonable estimate of the costs to be incurred.B.There is a contract price.C.Collectibility of the contract price is uncertain.D.There is a reasonable estimate of the revenues.ing the percentage-of-completion method in accounting for long-term projects, a company canincrease reported earnings by:A.accelerating recognition of project expenditures.B.delaying recognition of project expenditures.C.switching to completed contract accountingD.overestimating the total cost of the project.10.Which of the following would be an example of management attempting to manipulate income?A. a change from a straight-line to an accelerated depreciation in order to increase income.B.recognizing losses in bad years and recognizing gains in good years.C.additional losses are taken in bad yearsD. a gain from the condemnation of property by the city is shown in income from continuingoperations, while a loss on the sale of equipment is shown after income from continuing operations.11. When accounting for merchandising businesses, gross margin equals the difference between:A. net sales and cost of goods sold.B. net sales and operating expenses.C. gross sales and the sum of returns and allowances.D. net sales and the sum of cost of goods sold and operating expenses.11.Which of the following would not contribute to the difference between gross sales and net sales?A.cash refunds for returned products.B.Discounts from listed prices for delayed shipping.C.Allowance off selling prices for defective productsD.Sales made on credit rather than for immediate payment.12.Among the following items, which is added to net income for calculation of cash flows from operatingactivities in the indirect method?A.decrease of inventory.B.Increase of prepaid expenses.C.Decrease of accounts payable.D.Increase of accounts receivable.13.In the Statement of Cash Flows, which of the following best describes whether interest receivedand interest paid, respectively, are classified as operating or investing cash flow?Interest Received Interest paidA. Operating OperatingB. Operating InvestingC. Investing OperatingD. Investing Investing14.FASB is trying to do projects related to international convergence with:A.IASBB.SECC.IOSCOD.Federal Reserve BoardA.InventoryB.TrademarksC.Retained earnings.D.Accounts receivable.16.If a company’s ending inventory is understated by $3, 000 and beginning inventory is overstatedby $5, 000, the company’s operating income will most likely be:A.overstated by $2, 000.B.overstated by $8, 000C.understated by $2, 000D.understated by $8, 00017.Depreciation differs from other types of expenses in that depreciation:A.can be measured more precisely.B.Does not require an immediate cash outlay.C.Is not deductible if it would result in a net loss.D.Can be avoided if the company acquires used assets.18.Which of the following accurately describes the effects of a purchase of treasury stock on acompany’s assets and stockholders’ equity?Assets Stockholders’ EquityA. Decreased DecreasedB. Decreased UnchangedC. Unchanged DecreasedD. Unchanged Unchanged19.A company’s assets and stockholders’ equity are most likely to be reduced by:A.stock splits.B.Cash dividends.C.Stock dividends.D.Reverse stock splits. income equals:B.Income before operation-income taxes.C.Gross margin-operation expenses.D.Income from operations+/-other revenue and expenses.21.If the beginning inventory is $15, 000, the ending inventory is $18, 000, and the COGS is $20,000. So the inventory turnover is:A.100%B.110%C.121%D.124%22.a corporation wants to increase its current ratio from the present level of before it ends itsfiscal year. The action having the desired effect is:A.delaying the next payroll.B.Writing down impaired assets.C.Paying current payables from cash.D.Selling current marketable securities for cash at their book value.23.A firm’s most recent quarterly statement shows a current ratio greater than one. Just before theclose of the statement, the company paid large amounts to creditors. The fee of the payments was to:A.decrease net working capital.B.Increase net working capital.C.Increase the current ratio.D.Decrease the current ratio.24.All of the following ratios include net income in their computation EXCEPT:A.asset turnover.B.Profit margin.C.Return on equity.D.Return on assets.25.Which one of the following would best explain a situation where the ratio of “net income to totalassets〞 is lower than the industry average? profit margin is higher than the industry average.B.Debt ratio is higher than the industry averageC.Asset turnover is higher than the industry averageD.Equity multiplier must be lower than the industry average26.A major use of common-size financial statements is:A.value a company.pare a company to the aggregate economy.pare two companies of different size.D.None of the above.mon-size financial statements express a company’s accounts relative to:A.the aggregate economyB.the company’s own assets and sales.C.The company’s past ratios.D.Noe of the above28.Internal liquidity or solvency ratios indicate the ability of the firm to:A.meet future short term financial obligations.B.Meet future long term financial obligations.C.Settle current debt with fixed assets.D.Settle future short term debt with fixed assets.29.Which of the following companies would have a complete capital structure?A. a company with common stock outstanding and non-convertible preferred stock outstandingB. a company with common stock outstanding and stock options outstanding.C. a company with common stock outstanding and convertible bonds outstandingD.both B and C.30.Potential common stock can be described as:mon stock in form.B.Not common stock in form but with voting powers of common stock.D.Not common stock in form but enabling holders to obtain common stock upon exercise or conversion.31.In calculating the weighted average number of shares outstanding for EPS, a subsequent event thatis treated as if it occurred at the beginning of the earliest period is the:A.purchase of treasury stock.B.Sale of convertible bondsC.Declaration and issuance of a stock splitD.Sale of common stock.32.The weighted average number of common shares outstanding during the period should be retroactivelyrestated for:A.stock dividendsB.stock splitsC.both A and BD.neither A nor B33.When comparing ending inventories using the FIFO and LIFO methods of valuation, from a balancesheet perspectiveA.inventories based on LIFO are preferable to those presented under FIFO as carrying values mostclosely reflect current cost.B.inventories based on FIFO are preferable to those presented under LIFO as carrying values donot reflect current costC.inventories based on LIFO are preferable to those presented under FIFO as carrying values donot reflect current costD.inventories based on FIFO are preferable to those presented under LIFO as carrying values mostclosely reflect current cost34.Which one of the following statements about straight-line depreciation is TRUE? Straight-linedepreciation:A.results in a decreasing return on equity over the asset’s life.B.Introduces a built-in increase in return on investment over the asset’s life.C.Recognizes the increasing rate of obsolescence of an asset with the passage of time.D.Results in higher total tax payments over the life of an asset than accelerated depreciation.35.A machine is purchased for $3, 000, and has an estimated useful life of five years. Its salvagevalue is estimated to be $550. Using double-declining balance, the depreciation charge for year three is:A.$360B.$432C.$500D.$72036.The effect of the recognition of loss due to impairment in the year after the recognition wouldbe to:A.increase the return on assetsB.decrease the return on equityC.have no effect on return on assets or return on equityD.decrease the return on assets37.When a convertible bond is converted into common stock, which of the following correctly reflectswhat happens in the financial statements?A.the entire proceeds are reclassified from equity to debt.B.No adjustment is made in the financial statementsC.The entire proceeds are reclassified from debt to equityD.No adjustment is made because it is disclosed on the footnotes38.A company has cash flows from operating activities of $281,500. other activities include thepruchase of equipment for $142,000, the sale of equipment for $58,000, the purchase of land for $93,000, the retirement of debt for $55,000, and the payment of dividends for $36,000. the free cash flow would be:A $91,500B $93,500C $104,500 D$177,00039. The following info. Is available for Ashley Company:Cash collections from customers $390,000Cash payments for salaries (52,500)Cash payments to suppliers (127,500)Cash payments for interest (18,000)Purchase of machinery (60,000)Payments of dividends (55,500)Sale of machinery 45,000Purchase of land (12,000)Purchase o treasury stock (48,000)Calculate the FCF for the equity holders:A. $91,500B. $93,500C. $104,500D. $177,000statement of cash flows, which of the following best describes whether interest received and interest paid, are classified as operating or investing cash flows?A. Operating OperatingB. Operating InvestingC. Investing OperatingD. Investing Investing41. Which of the following is reported as a noncash financing transaction on a firm’s statement of cash flows?A. Repayment of long-term debtB. Purchase of treasury stockC. Sale of perferred stockD. Conversion of bands payable into common stock42. A company is deemed to have a complex capital structure if it has:A. potentially dilutive securitiesB. both preferred and common stock outstanding.C. weighted average cost of capital greater than the rate of return on equity.D. common stock that is less than 20% of its total capital structure.43. Which of following is true:A. the diluted earnings per share number shows the actual effect of conversionsthat pay out dividends will generally have higher EPS than firms that retain earnings in the business.and financing policies have no effect on growth rates in EPS.of the above is true.44. A company has common stock and common stock options outstanding. Which of the following is true?A. it will report two earnings per share numbers, basic and dilutedB. it will report only one earnings per share numbers, diluted.C. it will report only one earnings per share numbers, basicD. it will report three earnings pershare numbers, simple, basic and diluted.45. An analyst gathered the following info. About a company whose fiscal year end is :Net income for the year was $ million.Preferred stock dividends of $2 million were paid for the year.Common stock dividends of $ million were paid for the year.20 million shares of common stock were outstanding on January 1,2001.The company issued 6 million new shares of common stock April 1, 2001.The capital structure does not include any potentially dilutive convertible securities, options, warrants, and other contingent securities. The company’s basic EPS is closed to:A. $B.$C.$D.$46. An analyst gathered the following info. :Net income $6,500,000.Preferred stock dividends of $500,000 paid.Common stock dividends of $600,000 paid.1,000,000 shares of common stock outstanding (no change during the year).$60 average market price of common stock for the year.100,000 warrants outstanding exercisable at $50.The company’s diluted EPS is closed to:A. $B.$C.$D.$47. Which of the following combinations of accounting practices will lead to the higher reportedearnings in an inflationary environment?Depreciation Method Inventory MethodA. straight-line FIFOB. double declining balance LIFOC. double declining balance FIFOD. straight-line LIFO48. When comparing ending inventories using the FIFO and LIFO methods of valuation, from a balancesheet perspective,A. inventories based on LIFO are preferable to those presented under FIFO as carrying values mostclosely reflect current cost.B. inventories based on FIFO are preferable to those presented under LIFO as carrying values donot reflect current cost.C. inventories based on LIFO are preferable to those presented under FIFO as carrying values donot reflect current cost.D. inventories based on FIFO are preferable to those presented under LIFO as carrying values mostclosely reflect current cost.49. 假设A、B两家公司的账面资产别离为750万元和1000万元,但A公司同时通过经营租赁的方式取得并投入经营利用的资产〔固定资产〕还有250万元。
- 1、下载文档前请自行甄别文档内容的完整性,平台不提供额外的编辑、内容补充、找答案等附加服务。
- 2、"仅部分预览"的文档,不可在线预览部分如存在完整性等问题,可反馈申请退款(可完整预览的文档不适用该条件!)。
- 3、如文档侵犯您的权益,请联系客服反馈,我们会尽快为您处理(人工客服工作时间:9:00-18:30)。
Chapter 3 - SolutionsOverview:Problem Length Problem #’s{S} 1, 3{M} 2, 7, 8, 12, 13{L} 4 - 6, 9 - 11, 14, 151.{S}a.Palomba Pizza StoresStatement of Cash Flowsb. Cash Flow from Operations (CFO) measures the cashgenerating ability of operations, in addition toprofitability. If used as a measure of performance, CFOis less subject to distortion than net income. Analystsuse the CFO as a check on the quality of reportedearnings, although it is not a substitute for netincome. Companies with high net income and low CFO maybe using overly aggressive income recognitiontechniques. The ability of a firm to generate cash fromoperations on a consistent basis is one indication ofthe financial health of the firm. Analysts search fortrends in CFO to indicate future cash conditions andpotential liquidity or solvency problems.Cash Flow from Investing Activities (CFI) reports how the firm is investing its excess cash. The analyst must consider the ability of the firm to continue to grow and CFI is a good indication of the attitude of management in this area. This component of total cash flow includes the capital expenditures made by management to maintain and expand productive capacity.Decreasing CFI may be a forecast of slower future growth.Cash Flow from Financing (CFF) indicates the sources of financing for the firm. For firms that require external sources of financing (either borrowing or equity financing) it communicates management's preferences regarding financial leverage. Debt financing indicates future cash requirements for principal and interest payments. Equity financing will cause future earnings per share dilution.For firms whose operating cash flow exceeds investment needs, CFF indicates whether that excess is used to repay debt, pay (or increase) cash dividends, or repurchase outstanding shares.c. Cash payments for interest should be classified as CFFfor purposes of analysis. This classification separates the effect of financial leverage decisions from operating results. It also facilitates the comparison of Palomba with other firms whose financial leverage differs.d. The change in cash has no analytic significance. Thechange in cash (and hence, the cash balance at the end of the year) is a product of management decisions regarding financing. For example, the firm can show a large cash balance by drawing on bank lines just prior to year end.e. andf.There are a number of definitions of free cash flows.In the text, free cash flow is defined as cash from operations less the amount of capital expenditures required to maintain the firm’s current productive capacity. This definition requires the exclusion of costs of growth and acquisitions. However, few firms provide separate disclosures of expenditures incurred to maintain productive capacity. Capital costs of acquisitions may be obtained from proxy statements and other disclosures of acquisitions (See Chapter 14).In the finance literature, free cash flows available to equity holders are often measured as cash from operations less capital expenditures. Interest paid isa deduction when computing cash from operations as itis paid to creditors. Palomba’s free cash flow available to equity holders is calculated as follows:Net cash flow from operating activities less net cash for investing activities:$110,000 - $6,000 = $104,000The investment activities disclosed in the problem do not indicate any acquisitions.Another definition of free cash flows, which focuses on free cash flow available to all providers of capital, would exclude payments for interest ($10,000 in this case) and debt. Thus, Palomba’s free cash flow available to all providers of capital would be $114,000.1 Sales - bad debt expense - increase in net receivablesc. The bad debt provision does not seem to be adequate.From 1997 - 2001 sales increased by approximately 40%, while net receivables more than doubled, indicating that collections have been lagging. The ratios calculated in part b also indicate the problem. While bad debt expense has remained fairly constant at 5% of sales over the 5 year period, net receivables as a percentage of sales have increased from 29% to 49%;cash collections relative to sales have declined. Other possible explanations for these data are that stated payment terms have lengthened or that Stengel has allowed customers to delay payment for competitive reasons.……………………………………………………………精品资料推荐…………………………………………………3.{S}Niagara CompanyStatement of Cash Flows 20011 Can also be used to calculate cash inputs, decreasing that outflow to $645 while increasing cash expensesto $100.4.{L}a.G Company1 Note that these two items cannot be calculated separately from theinformation available.b.M CompanyNote: This is not a true receipts and disbursements schedule as it shows certain amounts (e.g., debt) on a net basis rather than gross. Such schedules (and cash flow statements) prepared from published data can only show some amounts net, unless supplementary data are available.c. The cash flow statements are presented with the incomestatement for comparison purposes in answering Part d.Note: 2000 COGS and operating expense are combined as there is insufficient information to separate them.d. Both companies are credit risks. Although both areprofitable, their CFO is increasingly negative. If current trends continue they face possible insolvency.However, before rejecting both loans outright, it is important to know whether CFO and income differ because the companies are doing poorly or because they are growing too fast.Both companies increased sales over the 5 year period;Company M by 50%, Company G by more than 300%. Are these sales real (will cash collections materialize)?If they are "growing too fast," it may be advisable to make the loan but also to force the company to curtail its growth until CFO catches up. One way to verify whether the gap is the result of sales to poor credit risks is to check if the growth in receivables is "proportional" to the sales growth. Similar checks can be made for the growth in inventories and payables. In this case, the inventory of M company has doubled from 1996 to 2000 while COGS increased by only 56%. The inventory increase would be one area to investigate further.There is a significant difference in the investment pattern of the two companies. Company M has made purchases of PPE each year, while Company G has made little net investment in PPE over the period. Yet Company G has grown much faster. Does this reflect the nature of the business (Company G is much less capital intensive) or has Company G used off balance sheet financing techniques?The cash from financing patterns of the two companies also differ. Both tripled their total debt over the period and increased the ratio of total debt to equity.Given Company M's slower growth (in sales and equity), its debt burden has grown much more rapidly. Despite this, Company M has continued to pay dividends and repurchase stock. Company G has not paid dividends and has issued new equity. These two factors account for its larger increase in equity from 1996 to 2000.Based only on the financial data provided, G looks like the better credit risk. Its sales and income are growing rapidly, while M's income is stable to declining on modestly growing sales. Unless further investigation changes the insights discussed here, you should prefer to lend to Company G.5.{L}a. (i)Statement of Cash Flows - Indirect MethodCash from operations:Net income $1,080Add noncash expense: depreciation 600 Add/Subtract changes in working capital:Accounts receivable (150)Inventory (200)Accruals 80Accounts payable 120 (150)$1,530 Cash from investing:Capital expenditures 1,150Cash from financing:Short term borrowing 550 Long-term repayment (398) Dividends (432)$(280) Net change in cash $ 100The worksheet to create the cash flow statement is presented above. Each balance sheet change (other than cash) is accounted for and matched with its corresponding activity. As a last check, the net income and the add-backs of non-cash items are b alanced and “closed” to their respective accounts (PP&E and retained earnings) providing the amounts of capital expenditures and dividends.a. (ii) Statement of Cash Flows - Direct MethodCash from Operations:Cash collections $9,850Cash payments for merchandise (6,080)Cash paid for SG&A (920)Cash paid for interest (600)Cash paid for taxes (720)$1,530 Cash for Investing Activities:Capital expenditures (1,150) Cash for Financing Activities:Short-term borrowing 550Long-term debt repayment ( 398)Dividends ( 432)$( 280) Net Change in Cash $ 100The worksheet to create the cash flow statement is presented below. Each balance sheet change (other than cash) is accounted for and matched with its corresponding activity. Furthermore the operating account changes are matched to their corresponding income statement item. As a last check, the net income is balanced and “closed” to retained earnings providing the amount of dividends.Note that there is no difference between the indirect and direct methods in the cash flow statement and in the worksheet for cash for investing and financing activities,6.{L}a. Exhibit 3P-3 does not provide the (changes in the)individual components that make up the changes inworking capital. As such, to create the direct methodcash flow statement, we must obtain the informationdirectly from the balance sheet. This procedure doesnot necessarily yield the same cash flow componentsusing the direct method as those provided by thecompany in its indirect method calculations.Differences may arise when1.there are acquisitions/divestments2.there are foreign exchange adjustments3.the firm aggregates or classifies investingaccruals together with operating ones.In this case, the differences are minimal as indicated below. (The calculations required for the direct method cash flow statement are presented in Exhibit 3S-1 along with the assumptions used to generate the statement)* Assumed change in interest payable to conform to interest paid. ** From the indirect methodAs noted in Box 3-2, from 1996 to 2000, the company generated free cash flow (CFO less net capital expenditures) of $1.5 million, during the first six months the A. M. Castle added another $309 thousand. However, Box 3-2 also showed that over the five-year period, Castle paid nearly $50 million in dividends and borrowed nearly $130 million to finance its investments and acquisitions. This trend continued in the first six months of 2001 during which the firm borrowed an additional $4.664 million to help pay its dividends and meet capital expenditure needs.Cash generated from operations from 1996 through the end of the first 6 months of 2001 was $76 million but the company spent $154 million to replace productive capacity and for investments and acquisitions. When free cash flows is calculated on this basis (i.e. CFO –CFI) there is a shortfall of $78 million. This shortfall as well as dividend payments were financed by borrowing over the same period.The inability to meet its capital and dividend needs from operations clearly indicated that either the dividend would have to be reduced or the company would not be able to remain competitive and/or grow as needed.7.{M}a.•The Swedish GAAP cash flow statements (CFS) begin with pretax and pre-financial items whereas the U.S. GAAPCFS show adjustments to net income.•The net financial items aggregate interest costs and interest income from various sources (includingdividends and interest from associated companies andother interest income) .•Swedish GAAP CFS aggregate all changes in working capital; U.S. GAAP CFS provide detailed disclosure ofthe operating changes in components of working capital;non-operating changes are reported as components ofinvesting activities.•Swedish GAAP combines cash and cash equivalents, financial receivables (primarily receivables fromassociated companies) and financial liabilities(current and long-term debt) in a measure called netfinancial assets or liabilities. SFAS 95 shows thechange in cash and cash equivalents with changes infinancial receivables reported as components of CFO andCFI. Changes in current and long-term debt are reportedin cash from financing activities.b.The cash flow statement is shown on page 16.c. Disadvantages:(1)Aggregation of all changes in operating or workingcapital accounts combines cash consequences ofoperating and investing activities. As noted inthe chapter, investing activities tend to distortcash flow from operations.(2)The use of net financial items tends to obscuresoperating, investing, and financing activities.Although disclosure is available to facilitate itscalculation, no separate disclosure of actual cashoutflow for interest (financing) costs isprovided.(3)The inclusion of financial liabilities (borrowingand repayment) and financial receivables in liquidfunds distorts cash flows from both investing andfinancing activities. This approach also hampersthe analysis of free cash flows discussed in thechapter. It is also unclear what basis was used bythe company to allocate a portion of the financialreceivables to operating activities and theremainder to the net financial position category.[Part c is continued on page 17]……………………………………………………………精品资料推荐………………………………………………………………………………………………………………精品资料推荐…………………………………………………7. c. (continued from page 15)Advantages:(1)The separate display of pre-interest and pre-taxcash flows permits a comparison across companieswith different capital structures and tax regimes.(2)Detailed disclosure of investment cash flows(acquisition and other) may facilitate analysis offree cash flows.8.{M}a. Differences between U.S. and IAS GAAP (see text page98):•IAS GAAP is permissive regarding the classification of interest and dividends received,interest paid, and dividends paid: these cashflows may be reported either as components of CFOor CFI (interest and dividends received) and CFF(interest and dividends paid). Roche classifiesinterest and dividends received as CFI andinterest and dividends paid as CFF.•Bank overdrafts may be reported as components of cash and cash equivalents in IAS GAAP; the changein bank overdrafts would not be reported as partof the statement of cash flows. U.S. GAAP requirestheir classification as liabilities and therefore,as components of financing cash flows. Rochefootnote 24 indicates that overdrafts are reportedas short-term debt but is unclear as to howchanges are reported in the cash flow statement.•Companies using IAS GAAP and the direct method are not required to report the reconciliation from netincome to CFO.b.Cash flow statement on page 18.Note that conversion to SFAS 95 results in only a smalldifference in CFO as the classification differenceslargely balance. However both CFF and (especially) CFIare quite different (both level and trend). The majordifference is that the large 2000 investment inmarketable securities is shown as a CFI outflow underIAS 7 but an increase in cash and marketable securitiesunder SFAS 95 assuming that the marketable securitieswould be considered cash equivalents under US GAAP.Roche footnote 19 contains general information aboutits marketable securities, but not enough detail todetermine which investments would be considered cashequivalents.……………………………………………………………精品资料推荐…………………………………………………c. Advantage: IAS recommends separate disclosure of cashoutflows for maintenance expenditures and capital expenditures for growth; when available that can be a significant benefit.Disadvantages:(1)Available alternatives for the treatment ofinterest and dividends received, interest paid,and dividends paid (see answer to part a) maydistort CFO, CFI, and CFF and hamper comparisonswith companies using US GAAP or (for companiesusing IAS GAAP) choosing different alternatives.(2)For companies using the direct method, when thereconciliation from net income to CFO is notreported it is impossible to determined whetherchanges in operating assets and liabilities (e.g.inventory) are due to operating or other factors.9.{L}The cash flow statement shows a steady deterioration in CFO;albeit CFO remains positive. Income (before extraordinary items) on the other hand increases steadily at approximately 8%-10% per year.To explain the discrepancy between the pattern of income and CFO, we first compute the direct method cash flow statement and then compare the cash flow components with their income statement counterparts.The (abbreviated) cash flow statement under the direct method is presented below:The required calculations for the operating items are presented in Exhibit 3S-2 on page 21. The last item “other”is the plug amount used to arrive at the CFO presented in the indirect cash flow statement (Exhibit 3P-4).Exhibit 3S-2Worksheet for Operating Items for Direct Method SoCFThe comparison of the cash flow and income statement components is presented below:Credit and collections do not seem to be responsible for the deterioration in CFO. A comparison of cash collections with sales indicates that collections increased at a slightly faster pace than sales. The collections/sales ratio increased from 99.61% in 1992 to 99.84% in 1994.Inventory, however, is another matter. Payments for inventory increased by 37% whereas COGS increased by only 29%. This is indicative of inventory being bought and paid for but not being sold. The proportion of payments to COGS increased accordingly from 98.3% to 104.5% in two years. This 6% increase translates (based on COGS of close to $2,000,000) to an increased annual cash requirement of $120,000.Thus, the first cause of Radloc’s problems seems to be inventories. Its income may be overstated as inventory may have to be written down if it cannot be sold. Even if inventory is eventually sold and the purchases now being made now are able to satisfy future growth, the firm may still face liquidity problems as it requires cash to purchase (and carry) the new inventory.However, as CFO is still positive the firm may still be a good candidate for credit.Further insights as to the impact of growth can be seen if we compare free cash flow (CFO - CFI) with income and CFO.Although income rises, CFO and free cash flow fall. CFO exceeds income in 1992 and 1993 as the noncash depreciation addback increases CFO relative to income. By 1994, however, CFO, (although positive) falls below income. This indicates that the firm may have problems in covering the replacement of current productive capacity.Free cash flow is negative in 1993 and 1994 and “barely” positive in 1992. This indica tes that the firm’s growth (in addition to inventory) requires cash that Radloc cannot supply internally.Where did the cash come from?In 1993, it met its cash requirements by issuing stock; in 1994 the firm’s short term debt increased considerably a s it drew down its revolving credit lines.Thus, the loan should not be granted as the firm seems to be facing an increasing liquidity crisis..Note: Radloc is an anagram for Caldor, a chain of discount stores. The data in Exhibit 3P-4 were taken from C aldor’s published financial statements. Caldor filed for Chapter 11 bankruptcy soon after the 1994 statements were published.10.{L}a. This part of the question requires an understanding ofSFAS 95, which governs the preparation of the Statementof Cash Flows. SFAS 95 permits use of either the director indirect method. As an initial step under eithermethod, the effect of the Kraft acquisition must beremoved as follows:The transactional analysis worksheet and statement ofcash flows are shown on pages 25 and 26 respectively.b. The simplest calculation would be operating cash flowless capital expenditures: $5,205 - $980 = $4,225million. But many variations are possible.The more important part of the question is theconnection between free cash flow and future earningsand financial condition. Possible uses of free cashflow include:1) Repayment of debt resulting in lower interest costand higher earnings. This also reduces debt ratiosand improves interest coverage, possibly leadingto higher debt ratings.2) Repurchase of equity may raise earnings per shareand (if repurchased below stated book value orreal value per share) increase these.3) Acquisitions (such as Kraft) that may providefuture growth, better diversification, lower risk,etc.4) Expenditures to fund internal growth throughcapital spending, research and development, newproduct costs, etc.* The net issuance or repurchase of equity is computed by reconciling the stockholders' equity account:Reconciliation of Stockholders' Equity12/31/87 balance $ 6,8231988 net income 2,337Dividends declared (941)Total $ 8,21912/31/88 balance (7,679)Decrease in stockholders' equity (repurchase) $ 540Philip Morris Companies, Inc. Worksheet for Statement of Cash FlowsIndirect Methodc. If the acquired inventories and receivables are soldthe proceeds will be reported as cash flow fromoperations (CFO). As their acquisition was reported ascash used for investment, CFO will be inflated. Thiswill occur if Kraft reduces its required level ofinventories and receivables because of operatingchanges (such as changes in product lines or creditterms) or the use of financing techniques that removethese assets from the balance sheet.11.{L}a. The first step is to match the items from the indirectcash flow statement with their corresponding items onthe income statement as below.1* It is possible the pension credit may also be included in “cost of products sold.”1 As a result of this matching, depreciation expense and restructuring expense offset and are eliminated from the direct method cash flow statement.* In Note H, Westvaco provides (as required by SFAS 95) the amount of interest and income tax paid. Our calculations must be adjusted to reconcile with these amounts. We have applied the adjustment to cash expenses, although it is possible that it should be applied to cash paid for inputs** Other income of $29 from income statement less (from indirect cash flow statement) gains on asset sales $18, plus currency losses of $3.6 and “other” of $3.8. [29 – 18 + 3.6 + 3.8 = 18)b. There are limited insights available from a singleyear’s direct method cash flow statement. However, we can compare some cash flow relationships with their income statement analogues:COGS to sales 70.3Cash inputs to cash collections 69.5%Selling, research, and admin. expense to sales 8.3% Cash expenses to cash collections 11.8% The second set of ratios shows the more significant difference. Westvaco’s cash expenses as a % of cash collections are much higher than the income statement relationships. The explanation (see chapter 12) is that Westvaco had a large noncash pension credit, which reduced net expenses.c. The company increased CFO (from $391 million in 1997 to$583 million in 2000) and substantially reduced its capital expenditures (see note H) from $621 million in 1997 to $229 million in 1999, generating the free cash flow needed to make acquisitions. Additional data used in Figure 3-1 tells the same story:FCF2 = CFO – CFI (where CFI = capital expenditures plus cash flows for acquisitions and from divestitures)The company borrowed funds in 1997 but reduced that debt in 1998 and 1999; outflows for dividends are lower but not significantly so. Thus, Westvaco used higher CFO and borrowing, combined with lower capital expenditures, to finance its 2000 acquisitions.12.{M}a. Hertz Corp. ($ millions)b.As reported, cash flow from operations shows steady improvement over the period 1989 - 1991, changing from a negative to a positive amount. After adjustment, the trend is eliminated; cash flow from operations is lower in 1991 than in either 1989 or 1990. The improvement in reported cash flow from operations was the result of reducing Hertz's net investment in rental equipment.d.Reported cash flow for investing shows little change over the three-year period. After reclassification of equipment purchases and sales, cash flow for investing drops by more than half in 1991. After reclassification it reflects the sharp drop in net car and truck purchases in that year.e.Free cash flow can be defined as cash flow from operations less investment required to maintain productive capacity. Ifwe assume that Hertz's investments are solely to maintain existing capacity, then free cash flow equals cash flow from operations less cash flow for investing:Note that reclassification of purchases and sales of revenue equipment has no effect on free cash flow:Thus by defining free cash flow in a manner which subtracts out all expenditures required to maintain the operating capacity of the firm, whether capitalized or not and regardless of classification, the effects of accounting and reporting differences can be overcome.This solution requires, of course, the identification of the amounts of such items.f. When equipment is purchased, the full amount isreported as an operating cash outflow. For leased equipment, only the periodic lease payments are reported as operating cash outflows. Thus, for Hertz, leasing increases reported cash flow from operations. g. When equipment purchases are classified as investingcash flows, then leasing reduces operating cash flows relative to purchases. That is because the outflow connected with purchases (or any other capitalized expenditure) is never classified as an operating outflow. [See Chapter 11 for a detailed analysis of this issue.]13.{M}a.Assumptions:1.Subsidies and other revenues are shown as a componentof cash flows from operating activities because theyinclude revenues and cash (subsidies) presumablyreceived from the government. We have assumed (and itappears so from data provided) that this item was notincluded in income (part of funds from operations). assets from consolidation are defined (elsewhere inRepsol’s financial statements –not provided in theproblem) as non-cash items resulting from accountingdifferences within the consolidated group. These areshown as a component of cash from operating activitiesto offset any items included in income.Note that Repsol’s statement of sources and applications of funds does not show the change in cash.The net change in cash in the table above reflects all changes except the effect of currency changes. If we separate out the actual change in cash and equivalents(65 in 1998, 297 in 1999) we can produce a statementthat is similar to the US GAAP format:b. A sources and uses statement does not recognizedifferences among operating, investing, and financing activities. SFAS 95 requires grouping of similar transactions in these three categories. Separate disclosure of the cash consequences of operating activities facilitates (1) an evaluation of the earnings and cash generating ability of the firm, (2) the quality of revenue and expense recognition principles used to prepare the financial statements, and (3) the computation of free cash flows.Separate disclosure of investing activities permits an assessment of capital expenditures, growth, and investments in other entities. Information about financing activities shows how the company finances its capital needs and dividend payments. Although the sources and uses format provides these data (and in gross form as required by SFAS 95) for investing and financing activities, it does not provide the disclosure by category; In contrast, SFAS 95 facilitates the analysis of free cash flows and other analytical measures.c.Separate disclosure of the components of (1) the changein working capital accounts, (2) non-cash income and expense, (3) net assets from consolidation, (4) whether any restructuring charges are included and where they were reported, and (5) debt repaid or reclassified would be useful.。