曼昆微观经济学第六版书后练习答案-8
曼昆《经济学原理(微观经济学分册)》(第6版)笔记和课后习题(含考研真题)详解
第3章相互依存性与贸易的好处3.1 复习笔记跨考网独家整理最全经济学考研真题,经济学考研课后习题解析资料库,您可以在这里查阅历年经济学考研真题,经济学考研课后习题,经济学考研参考书等内容,更有跨考考研历年辅导的经济学学哥学姐的经济学考研经验,从前辈中获得的经验对初学者来说是宝贵的财富,这或许能帮你少走弯路,躲开一些陷阱。
以下内容为跨考网独家整理,如您还需更多考研资料,可选择经济学一对一在线咨询进行咨询。
1.专业化与贸易经济学是研究为满足社会需求而如何进行生产和分配的科学。
在全球经济下,人们可以选择自给自足,也可以选择专业化生产,相互之间进行贸易,并导致经济相互依存。
国家和个人可以通过专业化生产和贸易解决由于稀缺性引起的问题,并从中获得好处。
每个人都消费本国和世界各国许多其他人所生产的物品与劳务。
相互依存和贸易之所以合意,是因为它可以使每个人享用更多数量和品种的物品与劳务。
2.比较优势原理有两种方法比较两个人在生产一种物品时的能力。
如果生产者生产一种物品所需要的投入较少,则可以说该生产者在生产该物品上有绝对优势;如果一个生产者以低于另一个生产者的机会成本生产一种物品,则可以说该生产者在生产该物品上有比较优势。
专业化和贸易的好处不是基于绝对优势,而是基于比较优势。
(1)绝对优势绝对优势理论是英国经济学家、资产阶级经济学古典学派的主要奠基人之一、国际分工和国际贸易理论的创始者亚当·斯密(Adam Smith)提出的。
绝对优势理论认为,自由贸易会引起国际分工,国际分工的基础是有利的自然禀赋,或后天有利的生产条件,它们都可以使一国在生产上和对外贸易方面处于比其他国家绝对有利的地位。
如果各国都按照各自有利的生产条件进行分工和交换,将会使各国的资源、劳动力和资本得到最有效的利用,这会大大提高劳动生产率和增加物质财富。
绝对优势比较的是生产一种物品所需要的投入量,生产一种物品需要资源少(比如说劳动时间少)的生产者称为在生产那种物品时具有绝对优势。
微观经济学曼昆第六版课后答案
微观经济学曼昆第六版课后答案【篇一:曼昆《经济学原理(微观经济学分册)》(第6版)课后习题详解(第1章经济学十大原理)】class=txt>第1篇导言第1章经济学十大原理课后习题详解跨考网独家整理最全经济学考研真题,经济学考研课后习题解析资料库,您可以在这里查阅历年经济学考研真题,经济学考研课后习题,经济学考研参考书等内容,更有跨考考研历年辅导的经济学学哥学姐的经济学考研经验,从前辈中获得的经验对初学者来说是宝贵的财富,这或许能帮你少走弯路,躲开一些陷阱。
以下内容为跨考网独家整理,如您还需更多考研资料,可选择经济学一对一在线咨询进行咨询。
一、概念题1.稀缺性(scarcity)答:经济学研究的问题和经济物品都是以稀缺性为前提的。
稀缺性指在给定的时间内,相对于人的需求而言,经济资源的供给总是不足的,也就是资源的有用性与有限性。
人类消费各种物品的欲望是无限的,满足这种欲望的物品,有的可以不付出任何代价而随意取得,称之为自由物品,如阳光和空气;但绝大多数物品是不能自由取用的,因为世界上的资源(包括物质资源和人力资源)是有限的,这种有限的、为获取它必须付出某种代价的物品,称为“经济物品”。
正因为稀缺性的客观存在,地球上就存在着资源的有限性和人类的欲望与需求的无限性之间的矛盾。
经济学的一个重要研究任务就是:“研究人们如何进行抉择,以便使用稀缺的或有限的生产性资源(土地、劳动、资本品如机器、技术知识)来生产各种商品,并把它们分配给不同的社会成员进行消费。
”也就是从经济学角度来研究使用有限的资源来生产什么、如何生产和为谁生产的问题。
2.经济学(economics)答:经济学是研究如何将稀缺的资源有效地配置给相互竞争的用途,以使人类的欲望得到最大限度满足的科学。
时下经常见诸国内报刊文献的“现代西方经济学”一词,大多也都在这个意义上使用。
自从凯恩斯的名著《就业、利息和货币通论》于1936年发表之后,西方经济学界对经济学的研究便分为两个部分:微观经济学与宏观经济学。
曼昆微观经济学课后练习英文答案完整版

曼昆微观经济学课后练习英文答案集团标准化办公室:[VV986T-J682P28-JP266L8-68PNN]the link between buyers’ willingness to pay for a good and the demandcurve.how to define and measure consumer surplus.the link between sellers’ costs of producing a good and the supply curve.how to define and measure producer surplus.that the equilibrium of supply and demand maximizes total surplus in amarket.CONTEXT AND PURPOSE:Chapter 7 is the first chapter in a three-chapter sequence on welfare economics and market efficiency. Chapter 7 employs the supply and demand model to develop consumer surplus and producer surplus as a measure of welfare and market efficiency. These concepts are then utilized in Chapters 8 and 9 to determine the winners and losers from taxation and restrictions on international trade.The purpose of Chapter 7 is to develop welfare economics—the study of how the allocation of resources affects economic well-being. Chapters 4 through 6 employed supply and demand in a positive framework, which focused on the question, “What is the equilibrium price and quantity in a market” This chapter now addresses the normative question, “Is the equilibrium price and quantity in a market the best possible solution to the resource allocation problem, or is it simply the price and quantity that balance supply and demand” Students will discover that under most circumstances the equilibrium price and quantity is also the one that maximizes welfare.KEY POINTS:Consumer surplus equals buyers’ willingness to pay for a good minus the amount they actually pay for it, and it measures the benefit buyers get from participating in a market. Consumer surplus can be computed by finding the area below the demand curve and above the price.Producer surplus equals the amount sellers receive for their goods minus their costs of production, and it measures the benefit sellers get from participating in a market. Producer surplus can be computed by finding the area below the price and above the supply curve.An allocation of resources that maximizes the sum of consumer and producer surplus is said to be efficient. Policymakers are often concerned with the efficiency, as well as the equality, of economic outcomes.The equilibrium of supply and demand maximizes the sum of consumer andproducer surplus. That is, the invisible hand of the marketplace leadsbuyers and sellers to allocate resources efficiently.Markets do not allocate resources efficiently in the presence of market failures such as market power or externalities.CHAPTER OUTLINE:I. Definition of welfare economics: the study of how the allocation of resources affects economic well-being.A. Willingness to Pay1. Definition of willingness to pay: the maximum amount that a buyer will pay for a good.2. Example: You are auctioning a mint-condition recording of Elvis Presley’s first album. Four buyers show up. Their willingness to pay is as follows:If the bidding goes to slightly higher than $80, all buyersdrop out except for John. Because John is willing to paymore than he has to for the album, he derives some benefitfrom participating in the market.3. Definition of consumer surplus: the amount a buyer is willing to payfor a good minus the amount the buyer actually pays for it.4. Note that if you had more than one copy of the album, the price in the auction would end up being lower (a little over $70 in the case of two albums) and both John and Paul would gain consumer surplus.B. Using the Demand Curve to Measure Consumer Surplus1. We can use the information on willingness to pay to derive a demandmarginal buyer . Because the demand curve shows the buyers’ willingness to pay, we can use the demand curve to measure c onsumer surplus.C. How a Lower Price Raises Consumer Surplussurplus because they are paying less for the product than before (area A on the graph).b. Because the price is now lower, some new buyers will enter the market and receive consumer surplus on these additional units of output purchased (area B on the graph).D. What Does Consumer Surplus Measure?1. Remember that consumer surplus is the difference between the amount that buyers are willing to pay for a good and the price that they actually pay.2. Thus, it measures the benefit that consumers receive from the good as the buyers themselves perceive it.III. Producer SurplusA. Cost and the Willingness to Sell1. Definition of cost: the value of everything a seller must give up to produce a good .2. Example: You want to hire someone to paint your house. You accept bidsfor the work from four sellers. Each painter is willing to work if the priceyou will pay exceeds her opportunity cost. (Note that this opportunity costthus represents willingness to sell.) The costs are:sellers will drop out except for Grandma. Because Grandma receives more than she would require to paint the house, she derives some benefit from producing in the market.4. Definition of producer surplus: the amount a seller is paid for a good minus the seller’s cost of providing it.5. Note that if you had more than one house to paint, the price in the auction would end up being higher (a little under $800 in the case of two houses) and both Grandma and Georgia would gain producer surplus.ALTERNATIVE CLASSROOM EXAMPLE:Review the material on price ceilings from Chapter 6. Redraw themarket for two-bedroom apartments in your town. Draw in a priceceiling below the equilibrium price.Then go through:consumer surplus before the price ceiling is put into place. consumer surplus after the price ceiling is put into place. You will need to take some time to explain the relationship between the producers’ willingness to sell and the cost of producing the good. The relationship between cost and the supply curve is not as apparent as the relationship between the It is important to stress that consumer surplus is measured inmonetary terms. Consumer surplus gives us a way to place amonetary cost on inefficient market outcomes (due to governmentB. Using the Supply Curve to Measure Producer Surplus1. We can use the information on cost (willingness to sell) to derive a2.the cost of the marginal seller. Because the supply curve shows the sellers’ cost (willingness to sell), we can use the supply curve to measure producer surplus.C. How a Higher Price Raises Producer Surplussurplus because they are receiving more for the product than before (area C on the graph).b. Because the price is now higher, some new sellers will enter the market and receive producer surplus on these additional units of output sold (area D on the graph).D. Producer surplus is used to measure the economic well-being of producers,ALTERNATIVE CLASSROOM EXAMPLE:Review the material on price floors from Chapter 6. Redraw the marketfor an agricultural product such as corn. Draw in a price supportabove the equilibrium price.Then go through:producer surplus before the price support is put in place.producer surplus after the price support is put in place.Make sure that you discuss the cost of the price support tomuch like consumer surplus is used to measure the economic well-being of consumers.IV. Market EfficiencyA. The Benevolent Social Planner1. The economic well-being of everyone in society can be measured by total surplus, which is the sum of consumer surplus and producer surplus:Total Surplus = Consumer Surplus + Producer SurplusTotal Surplus = (Value to Buyers – Amount Paid byBuyers) +(Amount Received by Sellers – Cost to Sellers)Because the Amount Paid by Buyers = Amount Received bySellers:2. Definition of efficiency: the property of a resource allocation of maximizing the total surplus received by all members of society .3. Definition of equality: the property of distributing economicprosperity uniformly the members of society .a. Buyers who value the product more than the equilibrium price will purchase the product; those who do not, will not purchase the product. Inother words, the free market allocates the supply of a good to the buyers who value it most highly, as measured by their willingness to pay.b. Sellers whose costs are lower than the equilibrium price will produce the product; those whose costs are higher, will not produce the product. Inother words, the free market allocates the demand for goods to the sellers who can produce it at the lowest cost.value of the product to the marginal buyer is greater than the cost to the marginal seller so total surplus would rise if output increases.Pretty Woman, Chapter 6. Vivien (Julia Roberts) and Edward(Richard Gere) negotiate a price. Afterward, Vivien reveals shewould have accepted a lower price, while Edward admits he wouldhave paid more. If you have done a good job of introducingconsumer and producer surplus, you will see the light bulbs gob. At any quantity of output greater than the equilibrium quantity, the value of the product to the marginal buyer is less than the cost to the marginal seller so total surplus would rise if output decreases.3. Note that this is one of the reasons that economists believe Principle #6: Markets are usually a good way to organize economic activity.C. In the News: Ticket Scalping1. Ticket scalping is an example of how markets work to achieve anefficient outcome.2. This article from The Boston Globe describes economist Chip Case’sexperience with ticket scalping.D. Case Study: Should There Be a Market in Organs?1. As a matter of public policy, people are not allowed to sell their organs.a. In essence, this means that there is a price ceiling on organs of $0.b. This has led to a shortage of organs.2. The creation of a market for organs would lead to a more efficientallocation of resources, but critics worry about the equity of a market system for organs.V. Market Efficiency and Market FailureA. To conclude that markets are efficient, we made several assumptions about how markets worked.1. Perfectly competitive markets.2. No externalities.B. When these assumptions do not hold, the market equilibrium may not be efficient.C. When markets fail, public policy can potentially remedy the situation. SOLUTIONS TO TEXT PROBLEMS:Quick Quizzes1. Figure 1 shows the demand curve for turkey. The price of turkey is P 1and the consumer surplus that results from that price is denoted CS. Consumer surplus is the amount a buyer is willing to pay for a good minus the amount the buyer actually pays for it. It measures the benefit to buyers ofparticipating in a market.Figure 1 Figure 22. Figure 2 shows the supply curve for turkey. The price of turkey is P 1and the producer surplus that results from that price is denoted PS. Producer surplus is the amount sellers are paid for a good minus the sellers’ cost of providing it (measured by the supply curve). It measures the benefit to sellers of participating in a market.It would be a good idea to remind students that there are circumstances when the market process does not lead to the most efficient outcome. Examples include situations such as when a firm (or buyer) has market power over price or when there areFigure 33. Figure 3 shows the supply and demand for turkey. The price of turkey is P, consumer surplus is CS, and producer surplus is PS. Producing more turkeys 1than the equilibrium quantity would lower total surplus because the value to the marginal buyer would be lower than the cost to the marginal seller on those additional units.Questions for Review1. The price a buyer is willing to pay, consumer surplus, and the demand curve are all closely related. The height of the demand curve represents the willingness to pay of the buyers. Consumer surplus is the area below the demand curve and above the price, which equals the price that each buyer is willing to pay minus the price actually paid.2. Sellers' costs, producer surplus, and the supply curve are all closely related. The height of the supply curve represents the costs of the sellers. Producer surplus is the area below the price and above the supply curve, which equals the price received minus each seller's costs of producing the good.Figure 43. Figure 4 shows producer and consumer surplus in a supply-and-demand diagram.4. An allocation of resources is efficient if it maximizes total surplus, the sum of consumer surplus and producer surplus. But efficiency may not be the only goal of economic policymakers; they may also be concerned about equitythe fairness of the distribution of well-being.5. The invisible hand of the marketplace guides the self-interest of buyers and sellers into promoting general economic well-being. Despite decentralized decision making and self-interested decision makers, free markets often lead to an efficient outcome.6. Two types of market failure are market power and externalities. Market power may cause market outcomes to be inefficient because firms may cause price and quantity to differ from the levels they would be under perfect competition, which keeps total surplus from being maximized. Externalities are side effects that are not taken into account by buyers and sellers. As a result, the free market does not maximize total surplus.Problems and Applications1. a. Consumer surplus is equal to willingness to pay minus the price paid. Therefore, Melissa’s willingness to pay must be $200 ($120 + $80).b. Her consumer surplus at a price of $90 would be $200 $90 = $110.c. If the price of an iPod was $250, Melissa would not have purchased one because the price is greater than her willingness to pay. Therefore, she would receive no consumer surplus.2. If an early freeze in California sours the lemon crop, the supply curve for lemons shifts to the left, as shown in Figure 5. The result is a rise in the price of lemons and a decline in consumer surplus from A + B + C to just A. So consumer surplus declines by the amount B + C.Figure 5 Figure 6In the market for lemonade, the higher cost of lemons reduces the supply of lemonade, as shown in Figure 6. The result is a rise in the price of lemonade and a decline in consumer surplus from D + E + F to just D, a loss of E + F. Note that an event that affects consumer surplus in one market oftenhas effects on consumer surplus in other markets.3. A rise in the demand for French bread leads to an increase in producer surplus in the market for French bread, as shown in Figure 7. The shift of the demand curve leads to an increased price, which increases producer surplusfrom area A to area A + B + C.Figure 7The increased quantity of French bread being sold increases the demandfor flour, as shown in Figure 8. As a result, the price of flour rises, increasing producer surplus from area D to D + E + F. Note that an event that affects producer surplus in one market leads to effects on producer surplus in related markets.Figure 84. a.Figure 9b. When the price of a bottle of water is $4, Bert buys two bottles of water. His consumer surplus is shown as area A in the figure. He values hisfirst bottle of water at $7, but pays only $4 for it, so has consumer surplus of $3. He values his second bottle of water at $5, but pays only $4 for it, so has consumer surplus of $1. Thus Bert’s total consumer surplus is $3 + $1 = $4, which is the area of A in the figure.c. When the price of a bottle of water falls from $4 to $2, Bert buys three bottles of water, an increase of one. His consumer surplus consists of both areas A and B in the figure, an increase in the amount of area B. He gets consumer surplus of $5 from the first bottle ($7 value minus $2 price), $3from the second bottle ($5 value minus $2 price), and $1 from the third bottle ($3 value minus $2 price), for a total consumer surplus of $9. Thus consumer surplus rises by $5 (which is the size of area B) when the price of a bottle of water falls from $4 to $2.5. a.Figure 10b. When the price of a bottle of water is $4, Ernie sells two bottles of water. His producer surplus is shown as area A in the figure. He receives $4 for his first bottle of water, but it costs only $1 to produce, so Ernie has producer surplus of $3. He also receives $4 for his second bottle of water, which costs $3 to produce, so he has producer surplus of $1. Thus Ernie’s total producer surplus is $3 + $1 = $4, which is the area of A in the figure.c. When the price of a bottle of water rises from $4 to $6, Ernie sells three bottles of water, an increase of one. His producer surplus consists of both areas A and B in the figure, an increase by the amount of area B. He gets producer surplus of $5 from the first bottle ($6 price minus $1 cost), $3 from the second bottle ($6 price minus $3 cost), and $1 from the third bottle ($6 price minus $5 price), for a total producer surplus of $9. Thus producer surplus rises by $5 (which is the size of area B) when the price of a bottle of water rises from $4 to $6.6. a. From Ernie’s supply schedule and Bert’s demand schedule, thean equilibrium quantity of two.b. At a price of $4, consumer surplus is $4 and producer surplus is $4, as shown in Problems 3 and 4 above. Total surplus is $4 + $4 = $8.c. If Ernie produced one less bottle, his producer surplus would decline to $3, as shown in Problem 4 above. If Bert consumed one less bottle, hisconsumer surplus would decline to $3, as shown in Problem 3 above. So total surplus would decline to $3 + $3 = $6.d. If Ernie produced one additional bottle of water, his cost would be $5, but the price is only $4, so his producer surplus would decline by $1. If Bert consumed one additional bottle of water, his value would be $3, but the price is $4, so his consumer surplus would decline by $1. So total surplus declines by $1 + $1 = $2.7. a. The effect of falling production costs in the market for stereos results in a shift to the right in the supply curve, as shown in Figure 11. As a result, the equilibrium price of stereos declines and the equilibriumquantity increases.Figure 11b. The decline in the price of stereos increases consumer surplus from area A to A + B + C + D, an increase in the amount B + C + D. Prior to the shift in supply, producer surplus was areas B + E (the area above the supply curve and below the price). After the shift in supply, producer surplus is areas E + F + G. So producer surplus changes by the amount F + G – B, which may be positive or negative. The increase in quantity increases producer surplus, while the decline in the price reduces producer surplus. Because consumer surplus rises by B + C + D and producer surplus rises by F + G – B, total surplus rises by C + D + F + G.c. If the supply of stereos is very elastic, then the shift of the supply curve benefits consumers most. To take the most dramatic case, suppose the supply curve were horizontal, as shown in Figure 12. Then there is no producer surplus at all. Consumers capture all the benefits of falling production costs, with consumer surplus rising from area A to area A + B.Figure 128. Figure 13 shows supply and demand curves for haircuts. Supply equals demand at a quantity of three haircuts and a price between $4 and $5. Firms A, C, and D should cut the hair of Ellen, Jerry, and Phil. Oprah’s willingnessto pay is too low and firm B’s costs are too high, so they do not participate. The maximum total surplus is the area between the demand and supply curves, which totals $11 ($8 value minus $2 cost for the first haircut, plus $7 value minus $3 cost for the second, plus $5 value minus $4 cost for the third).Figure 139. a. The effect of falling production costs in the market for computers results in a shift to the right in the supply curve, as shown in Figure 14. As a result, the equilibrium price of computers declines and the equilibrium quantity increases. The decline in the price of computers increases consumer surplus from area A to A + B + C + D, an increase in the amount B + C + D.Figure 14 Figure 15Prior to the shift in supply, producer surplus was areas B + E(the area above the supply curve and below the price). After theshift in supply, producer surplus is areas E + F + G. So producersurplus changes by the amount F + G – B, which may be positive ornegative. The increase in quantity increases producer surplus,while the decline in the price reduces producer surplus. Becauseconsumer surplus rises by B + C + D and producer surplus rises byF +G – B, total surplus rises by C + D + F + G.b. Because typewriters are substitutes for computers, the decline in the price of computers means that people substitute computers for typewriters, shifting the demand for typewriters to the left, as shown in Figure 15. The result is a decline in both the equilibrium price and equilibrium quantity of typewriters. Consumer surplus in the typewriter market changes from area A + B to A + C, a net change of C – B. Producer surplus changes from area C + D + E to area E, a net loss of C + D. Typewriter producers are sad about technological advances in computers because their producer surplus declines.c. Because software and computers are complements, the decline in the price and increase in the quantity of computers means that the demand for software increases, shifting the demand for software to the right, as shown in Figure 16. The result is an increase in both the price and quantity of software. Consumer surplus in the software market changes from B + C to A + B, a net change of A – C. Producer surplus changes from E to C + D + E, an increase of C + D, so software producers should be happy about the technological progress in computers.Figure 16d. Yes, this analysis helps explain why Bill Gates is one the world’s richest people, because his company produces a lot of software that is a complement with computers and there has been tremendous technological advance in computers.10. a. With Provider A, the cost of an extra minute is $0. WithProvider B, the cost of an extra minute is $1.b. With Provider A, my friend will purchase 150 minutes [= 150 –(50)(0)]. With Provider B, my friend would purchase 100 minutes [=150 – (50)(1)].c. With Provider A, he would pay $120. The cost would be $100 with Provider B.Figure 17d. Figure 17 shows the friend’s demand. With Provider A, he buys 150minutes and his consumer surplus is equal to (1/2)(3)(150) – 120= 105. With Provider B, his consumer surplus is equal to(1/2)(2)(100) = 100.e. I would recommend Provider A because he receives greater consumer surplus.11. a. Figure 18 illustrates the demand for medical care. If each procedure has a price of $100, quantity demanded will be Q1 procedures.Figure 18b. If consumers pay only $20 per procedure, the quantity demanded will be Qprocedures. Because the cost to society is $100, the number of procedures 2performed is too large to maximize total surplus. The quantity that maximizes total surplus is Q1 procedures, which is less than Q2.c. The use of medical care is excessive in the sense that consumers get procedures whose value is less than the cost of producing them. As a result, the economy’s total surplus is reduced.d. To prevent this excessive use, the consumer must bear the marginal cost of the procedure. But this would require eliminating insurance. Another possibility would be that the insurance company, which pays most of the marginal cost of the procedure ($80, in this case) could decide whether the procedure should be performed. But the insurance company does not get the benefits of the procedure, so its decisions may not reflect the value to the consumer.。
曼昆《经济学原理(微观经济学分册)》(第6版)笔记和课后习题(含考研真题)详解【讲解】
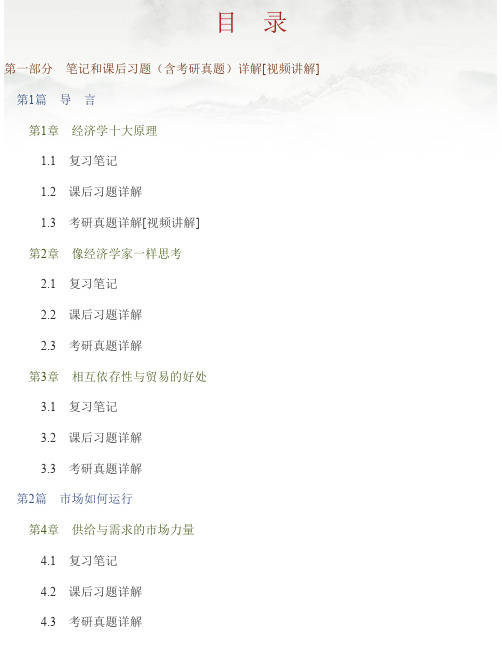
目 录第一部分 笔记和课后习题(含考研真题)详解[视频讲解]第1篇 导 言第1章 经济学十大原理1.1 复习笔记1.2 课后习题详解1.3 考研真题详解[视频讲解]第2章 像经济学家一样思考2.1 复习笔记2.2 课后习题详解2.3 考研真题详解第3章 相互依存性与贸易的好处3.1 复习笔记3.2 课后习题详解3.3 考研真题详解第2篇 市场如何运行第4章 供给与需求的市场力量4.1 复习笔记4.2 课后习题详解4.3 考研真题详解第5章 弹性及其应用5.1 复习笔记5.2 课后习题详解5.3 考研真题详解[视频讲解]第6章 供给、需求与政府政策6.1 复习笔记6.2 课后习题详解6.3 考研真题详解[视频讲解]第3篇 市场和福利第7章 消费者、生产者与市场效率7.1 复习笔记7.2 课后习题详解7.3 考研真题详解第8章 应用:赋税的代价8.1 复习笔记8.2 课后习题详解8.3 考研真题详解第9章 应用:国际贸易9.1 复习笔记9.2 课后习题详解9.3 考研真题详解第4篇 公共部门经济学第10章 外部性10.1 复习笔记10.2 课后习题详解10.3 考研真题详解[视频讲解]第11章 公共物品和公共资源11.1 复习笔记11.2 课后习题详解11.3 考研真题详解[视频讲解]第12章 税制的设计12.1 复习笔记12.2 课后习题详解12.3 考研真题详解第5篇 企业行为与产业组织第13章 生产成本13.1 复习笔记13.2 课后习题详解13.3 考研真题详解[视频讲解]第14章 竞争市场上的企业14.1 复习笔记14.2 课后习题详解14.3 考研真题详解[视频讲解]第15章 垄 断15.1 复习笔记15.2 课后习题详解15.3 考研真题详解[视频讲解]第16章 垄断竞争16.1 复习笔记16.2 课后习题详解16.3 考研真题详解[视频讲解]第17章 寡 头17.1 复习笔记17.2 课后习题详解17.3 考研真题详解[视频讲解]第6篇 劳动市场经济学第18章 生产要素市场18.1 复习笔记18.2 课后习题详解18.3 考研真题详解[视频讲解]第19章 收入与歧视19.1 复习笔记19.2 课后习题详解19.3 考研真题详解第20章 收入不平等与贫困20.1 复习笔记20.2 课后习题详解20.3 考研真题详解[视频讲解]第7篇 深入研究的论题第21章 消费者选择理论21.1 复习笔记21.2 课后习题详解21.3 考研真题详解[视频讲解]第22章 微观经济学前沿22.1 复习笔记22.2 课后习题详解22.3 考研真题详解[视频讲解]第二部分 模拟试题及详解曼昆《经济学原理(微观经济学分册)》(第6版)模拟试题及详解(一)曼昆《经济学原理(微观经济学分册)》(第6版)模拟试题及详解(二)第一部分 笔记和课后习题(含考研真题)详解[视频讲解]第1篇 导 言第1章 经济学十大原理1.1 复习笔记1.经济学经济学是研究如何将稀缺的资源有效地配置给相互竞争的用途,以使人类的欲望得到最大限度满足的科学。
曼昆《经济学原理(微观经济学分册)》(第6版)笔记和课后习题(含考研真题)详解
第6章供给、需求与政府政策6.1 复习笔记跨考网独家整理最全经济学考研真题,经济学考研课后习题解析资料库,您可以在这里查阅历年经济学考研真题,经济学考研课后习题,经济学考研参考书等内容,更有跨考考研历年辅导的经济学学哥学姐的经济学考研经验,从前辈中获得的经验对初学者来说是宝贵的财富,这或许能帮你少走弯路,躲开一些陷阱。
以下内容为跨考网独家整理,如您还需更多考研资料,可选择经济学一对一在线咨询进行咨询。
1.价格控制(1)价格上限和价格下限价格上限是某种物品与劳务价格法定的最高限,比如租金控制;价格下限是某种物品或劳务价格法定的最低限,比如最低工资。
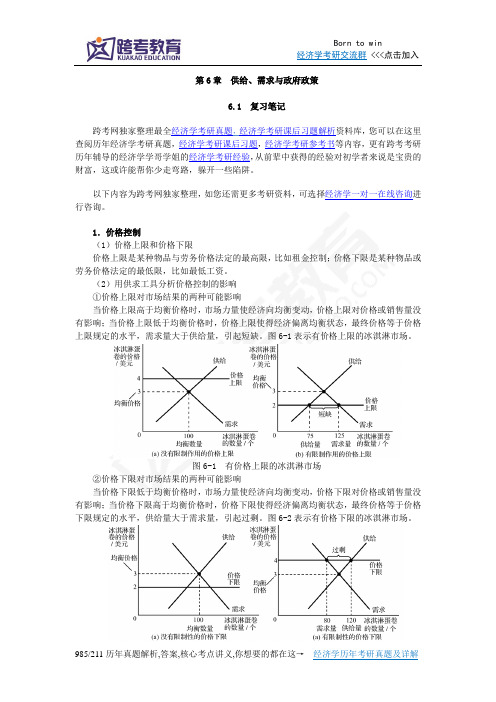
(2)用供求工具分析价格控制的影响①价格上限对市场结果的两种可能影响当价格上限高于均衡价格时,市场力量使经济向均衡变动,价格上限对价格或销售量没有影响;当价格上限低于均衡价格时,价格上限使得经济偏离均衡状态,最终价格等于价格上限规定的水平,需求量大于供给量,引起短缺。
图6-1表示有价格上限的冰淇淋市场。
图6-1 有价格上限的冰淇淋市场②价格下限对市场结果的两种可能影响当价格下限低于均衡价格时,市场力量使经济向均衡变动,价格下限对价格或销售量没有影响;当价格下限高于均衡价格时,价格下限使得经济偏离均衡状态,最终价格等于价格下限规定的水平,供给量大于需求量,引起过剩。
图6-2表示有价格下限的冰淇淋市场。
图6-2 有价格下限的冰淇淋市场2.税收的影响政府无论是对生产者征税还是对消费者征税都会达到相同的均衡结果,税收在生产者和消费者之间进行分配。
税收使得物品的均衡数量减少,买者为该物品支付的价格升高,而卖者从该物品得到的价格降低,政府获得了税收收入。
一般情况下,税收是由卖者和买者共同分担,但对二者的影响程度不同,需求弹性和供给弹性决定了税收负担在买者与卖者之间的分摊,税收负担将更多地落在缺乏弹性的市场一方身上。
因为弹性实际上衡量当条件变得不利时,买者或卖者离开市场的意愿。
曼昆《经济学原理(微观经济学分册)》第6版课后习题详解(1~2章)
曼昆《经济学原理(微观经济学分册)》第6版课后习题详解第一篇导言第1章经济学十大原理一、概念题1.稀缺性稀缺性是指在给定的时间内,相对于人的需求而言,经济资源的供给总是不足的,也就是资源的有限性与人类的欲望无限性之间的矛盾。
2.经济学经济学是研究如何将稀缺的资源有效地配置给相互竞争的用途,以使人类的欲望得到最大限度满足的科学。
其中微观经济学是以单个经济主体为研究对象,研究单个经济主体面对既定资源约束时如何进行选择的科学;宏观经济学则以整个国民经济为研究对象,主要着眼于经济总量的研究。
3.效率效率是指人们在实践活动中的产出与投入比值或者是效益与成本比值,比值大效率高,比值小效率低。
它与产出或收益大小成正比,与投入或成本成反比。
4.平等平等是指人与人的利益关系及利益关系的原则、制度、做法、行为等都合乎社会发展的需要,即经济成果在社会成员中公平分配的特性。
它是一个历史范畴,按其所产生的社会历史条件和社会性质的不同而不同,不存在永恒的公平;它也是一个客观范畴,尽管在不同的社会形态中内涵不同对其的理解不同,但都是社会存在的反映,具有客观性。
5.机会成本机会成本是指将一种资源用于某种用途,而未用于其他用途所放弃的最大预期收益。
其存在的前提条件是:①资源是稀缺的;②资源具有多种用途;③资源的投向不受限制。
6.理性人理性人是指系统而有目的地尽最大努力去实现其目标的人,是经济研究中所假设的、在一定条件下具有典型理性行为的经济活动主体。
7.边际变动边际变动是指对行动计划的微小增量调整。
8.激励激励是指引起一个人做出某种行为的某种东西。
9.市场经济市场经济是指由家庭和企业在市场上的相互交易决定资源配置的经济,而资源配置实际上就是决定社会生产什么、生产多少、如何生产以及为谁生产的过程。
10.产权产权是指个人拥有并控制稀缺资源的能力,也可以理解为人们对其所交易东西的所有权,即人们在交易活动中使自己或他人在经济利益上受益或受损的权力。
曼昆《经济学原理(微观经济学分册)》第6版课后习题详解(1~2章)
曼昆《经济学原理(微观经济学分册)》第 6 版课后习题详解第一篇导言第1章经济学十大原理一、看法题1.稀缺性稀缺性是指在给定的时间内,相对于人的需求而言,经济资源的供应老是不足的,也就是资源的有限性与人类的欲念无穷性之间的矛盾。
2.经济学经济学是研究如何将稀缺的资源有效地配置给互相竞争的用途,以令人类的欲念获取最大限度知足的科学。
此中微观经济学是以单个经济主体为研究对象,研究单个经济主风光对既定资源拘束时如何进行选择的科学;宏观经济学则以整个公民经济为研究对象,主要着眼于经济总量的研究。
3.效率效率是指人们在实践活动中的产出与投入比值或许是效益与成本比值,比值大效率高,比值小效率低。
它与产出或利润大小成正比,与投入或成本成反比。
4.同等同等是指人与人的利益关系及利益关系的原则、制度、做法、行为等都符合社会发展的需要,即经济成就在社会成员中公正分派的特征。
它是一个历史范围,按其所产生的社会历史条件和社会性质的不一样而不一样,不存在永久的公正;它也是一个客观范围,只管在不一样的社会形态中内涵不一样对其的理解不一样,但都是社会存在的反应,拥有客观性。
5.时机成本时机成本是指将一种资源用于某种用途,而未用于其余用途所放弃的最大预期利润。
其存在的前提条件是:①资源是稀缺的;②资源拥有多种用途;③资源的投向不受限制。
6.理性人理性人是指系统而有目的地尽最大努力去实现其目标的人,是经济研究中所假定的、在必定条件下拥有典型理性行为的经济活动主体。
7.边沿改动边沿改动是指对行动计划的细小增量调整。
8.激励激励是指惹起一个人做出某种行为的某种东西。
9.市场经济市场经济是指由家庭和公司在市场上的互相交易决定资源配置的经济,而资源配置本质上就是决定社会生产什么、生产多少、如何生产以及为谁生产的过程。
10.产权产权是指个人拥有并控制稀缺资源的能力,也能够理解为人们对其所交易东西的所有权,即人们在交易活动中使自己或别人在经济利益上得益或受损的权利。
曼昆《经济学原理(微观经济学分册)》(第6版)课后习题详解(第8章 应用:赋税的代价)

曼昆《经济学原理(微观经济学分册)》(第6版)第8章应用:赋税的代价课后习题详解跨考网独家整理最全经济学考研真题,经济学考研课后习题解析资料库,您可以在这里查阅历年经济学考研真题,经济学考研课后习题,经济学考研参考书等内容,更有跨考考研历年辅导的经济学学哥学姐的经济学考研经验,从前辈中获得的经验对初学者来说是宝贵的财富,这或许能帮你少走弯路,躲开一些陷阱。
以下内容为跨考网独家整理,如您还需更多考研资料,可选择经济学一对一在线咨询进行咨询。
一、概念题无谓损失(deadweight loss)(北京师范大学2006、2009研;深圳大学2008研)答:无谓损失指税收(或其他某种政策)扭曲了市场结果时所引起的总剩余的减少。
如图8-1所示,对一种物品征税减少了消费者剩余(用面积B C+代表)和生产者剩余(用面积D E+代表)。
由于生产者剩余和消费者剩余的减少量大于税收收入(面积B D+),所以,税收引起了无谓损失(面积C E+)。
图8-1 无谓损失二、复习题1.当对一种物品征税时,消费者剩余和生产者剩余会发生怎样的变动?与税收收入相比较,消费者剩余和生产者剩余如何变动?解释原因。
答:(1)当对一种物品征税时,消费者剩余和生产者剩余都会减少。
(2)与税收收入的比较具体如图8-1所示。
对一种物品征税减少了消费者剩余(用面积B C+代表)。
由于生产者和消费者剩余的减少大于税+代表)和生产者剩余(用面积D E收收入(面积B D+),所以,税收引起了无谓损失(面积C E+)。
(3)税收引起无谓损失的原因是收扭曲了消费者的支付意愿和生产者的生产成本,使资源配置无效率,进而使社会总剩余减少。
市场通常可以有效地配置稀缺资源。
这就是说,供求均衡使市场上买者和卖者的总剩余最大化。
但是,当税收提高了买者的价格而降低了卖者的价格时,它对买者的激励是比没有税收时少消费,而对卖者的激励是比没有税收时少生产。
当买者和卖者对这些激励做出反应时,市场规模缩小到其最优水平之下。
- 1、下载文档前请自行甄别文档内容的完整性,平台不提供额外的编辑、内容补充、找答案等附加服务。
- 2、"仅部分预览"的文档,不可在线预览部分如存在完整性等问题,可反馈申请退款(可完整预览的文档不适用该条件!)。
- 3、如文档侵犯您的权益,请联系客服反馈,我们会尽快为您处理(人工客服工作时间:9:00-18:30)。
Chapter 8
1. a. The statement, "If the government taxes land, wealthy landowners will pass the tax
on to their poorer renters," is incorrect. With a tax on land, landowners can not
pass the tax on. Since the supply curve of land is perfectly inelastic, landowners
bear the entire burden of the tax. Renters will not be affected at all.
b. The statement, "If the government taxes apartment buildings, wealthy landowners
will pass the tax on to their poorer renters," is partially correct. With a tax on
apartment buildings, landowners can pass the tax on more easily, though the
extent to which they do this depends on the elasticities of supply and demand. In
this case, the tax is a direct addition to the cost of rental units, so the supply curve
will shift up by the amount of the tax. The tax will be shared by renters and
landowners, depending on the elasticities of demand and supply.
2. a. The statement, "A tax that has no deadweight loss cannot raise any revenue for the
government," is incorrect. An example is the case of a tax when either supply or
demand is perfectly inelastic. The tax has neither an effect on quantity nor any
deadweight loss, but it does raise revenue.
b. The statement, "A tax that raises no revenue for the government cannot have any
deadweight loss," is incorrect. An example is the case of a 100 percent tax
imposed on sellers. With a 100 percent tax on their sales of the good, sellers won't
supply any of the good, so the tax will raise no revenue. Yet the tax has a large
deadweight loss, since it reduces the quantity sold to zero.
3. Since the demand for food is inelastic, a tax on food is a good way to raise revenue because
it does not lead to much of a deadweight loss; thus taxing food is less inefficient than taxing other things. But it is not a good way to raise revenue from an equity point of view, since poorer people spend a higher proportion of their income on food, so the tax would hit them harder than it would hit wealthier people.
6. a. Setting quantity supplied equal to quantity demanded gives 2P = 300 –P. Adding
P to both sides of the equation gives 3P = 300. Dividing both sides by 3 gives P =
100. Plugging P = 100 back into either equation for quantity demanded or
supplied gives Q = 200.
b. Now P is the price received by sellers and P+T is the price paid by buyers.
Equating quantity demanded to quantity supplied gives 2P = 300 - (P+T). Adding
P to both sides of the equation gives 3P = 300 –T. Dividing both sides by 3 gives
P = 100 - T/3. This is the price received by sellers. The buyers pay a price equal
to the price received by sellers plus the tax (P+T = 100 + 2T/3). The quantity sold
is now Q = 2P = 200 – 2T/3.
c. Since tax revenue is equal to T x Q and Q = 200 - 2T/3, tax revenue equals
200T - 2T2/3. Figure 9 shows a graph of this relationship. Tax revenue is zero at T = 0 and at T = 300.
Figure 9
d. As Figure 10 shows, the area of the triangle (laid on its side) that represents the
deadweight loss is 1/2 x base x height, where the base is the change in the price, which is the size of the tax (T) and the height is the amount of the decline in
quantity (2T/3). So the deadweight loss equals 1/2 x T x 2T/3 = T2/3. This rises exponentially from 0 (when T = 0) to 45,000 when T = 300, as shown in Figure 11.
Figure 10
Figure 11
e. A tax of $200 per unit is a bad idea, because it's in a region in which tax revenue is
declining. The government could reduce the tax to $150 per unit, get more tax
revenue ($15,000 when the tax is $150 versus $13,333 when the tax is $200), and
reduce the deadweight loss (7,500 when the tax is $150 compared to 13,333 when
the tax is $200).
注:图11中的45000是错误的,应该是30000。