文献翻译-基于MATLAB的数据曲线拟合分析
[matlab曲线拟合]MATLAB的曲线拟合
![[matlab曲线拟合]MATLAB的曲线拟合](https://img.taocdn.com/s3/m/ddca46a8c67da26925c52cc58bd63186bceb9275.png)
[matlab 曲线拟合]MATLAB的曲线拟合篇一: MA TLAB的曲线拟合MA TLAB软件提供了基本的曲线拟合函数的命令。
曲线拟合就是计算出两组数据之间的一种函数关系,由此可描绘其变化曲线及估计非采集数据对应的变量信息。
1.线性拟合函数:regress调用格式:b =regress[b,bint,r,rint,stats]= regress[b,bint,r,rint,stats] =regressx=[ones …];y=x*[10;1]+normrnd;[b,bint]=regress结果得回归方程为:y=9.9213+1.0143xx=1:20;y=x+3*sin;p=polyfitxi=linspace;z=polyval;% 多项式求值函数plotlegendfunction yy=modela=beta0;b=beta0;yy=a+*exp);拟合程序:x=[8.00 8.00 10.00 10.00 10.00 10.00 12.00 12.00 12.00 14.00 14.0014.00...16.00 16.00 16.00 18.00 18.00 20.00 20.00 20.00 20.00 22.00 22.0024.00...24.00 24.00 26.00 26.00 26.00 28.00 28.00 30.00 30.00 30.00 32.0032.00...34.00 36.00 36.00 38.00 38.00 40.00 42.00]‟;y=[0.49 0.49 0.48 0.47 0.48 0.47 0.46 0.46 0.45 0.43 0.45 0.43 0.430.44 0.43...0.43 0.46 0.42 0.42 0.43 0.41 0.41 0.40 0.42 0.40 0.40 0.41 0.400.41 0.41...0.40 0.40 0.40 0.38 0.41 0.40 0.40 0.41 0.38 0.40 0.40 0.390.39]‟;beta0=[0.30 0.02];betafit = nlinfit结果:betafit =0.3896 0.1011即:a=0.3896 ,b=0.1011 拟合函数为:x1 =[1150,1000,900,850,700,625,550,475,3350,3500,5900,5800,5700,4600,4625,4725,11650,11200,11200 ]‟;x2 =[175,100,25,0,75,100,150,200,50,600,500,225,100,1225,1600,2000,1200,1000,1550 ]‟;x = [x1,x2];y=[1.44E-02,1.80E-02,6.08E-02,5.59E-02,3.42E-02,7.74E-03,1.17E-03,6.16E-03,1.91E-04,1.,resplot3)% 值的选取没有定法,与实际问题的模型有关。
基于Matlab的曲线拟合
76 CNSTAE 2006 年 11 月
应使
用几何语言来说,拟合曲线和标志数据点之间的垂直距离 是在该点的误差,对各数据点垂直距离求平方,并把平方距离 全加起来,就是误差平方和,拟合曲线应是使误差平方和尽可 能小的曲线,即是最佳拟合。 在Matlab语言中,使用polyfit函数来求解最小二乘曲线拟合 问题,具体方法如下: ◆polyfit(x,y,n)命令用最小二乘法对说给数据进行n阶多项 式拟合,返回拟合多项式 P(x)。 ◆[p,s]=polyfit(x,y,n)命令不仅返回多项式的系数p,还返 回用函数 polyval获得的误差分析报告。 ◆[p,s,mu]=polyfit(x,y,n)命令返回拟合多项式的系数xhat=(x- mu(1)/mu(2)),其中 mu(1)= mean(x),mu(2)= std(x)。 例:使用polyfit函数求解最小二乘拟合曲线
由上图可以看出,线性回归与原来数据点相比,误差较大,精 度不是很好,为此可以增加n值,例如选择n= 2作为阶数,得到 2 阶多项式,继续输入如下命令,并按Enter 确认,如下图所示。
由上图可以看出:当n=2时,拟合曲线与原数据拟合程度不错, 那么是不是n值越大越好呢?由于多项式阶次的选择是任意的,两点 决定一直线或一阶多项式,三点决定一个平方或2阶多项式,依此类 推,n+1 个数据点唯一地确定n 阶多项式,本例中,有10 个数据点, 可以选择一个9 阶的多项式,使得拟合曲线经过每一个数据点。 >> c=polyfit(x,y,9) Warning: Polynomial is badly conditioned. Remove repeated data points or try centering and scaling as described in HELP POLYFIT. > In polyfit at 79 c = 1.0e+003 * -0.0000 0.0002 -0.0045 0.0538 -0.3924 1.8091 - 5.2247 9.0159 -8.3093 3.0530 可见,由于拟合阶数太高,Matlab自动给出警告信息,提醒用户 太高的阶数会产生不太好的结果,继续绘制曲线如下: >> x9=1:0.05:10; >>y9=c(1)*x9.^9+c(2)*x9.^8+c(3)*x9.^7+c(4)*x9.^6+c(5)*x9.^5+c(6) *x9.^4+c(7)*x9.^3+c(8)*x9.^2+c(9)*x9+c(10); >> plot(x,y,'*',x9,y9,'-r')
matlab 数据 曲线拟合
matlab 数据曲线拟合
在MATLAB中,曲线拟合是通过拟合函数来找到一条曲线,使其
最好地逼近给定的数据点。
曲线拟合在数据分析和模型建立中非常
常见,可以用于预测、趋势分析和模式识别等领域。
在MATLAB中,
有多种方法可以进行曲线拟合,包括多项式拟合、指数拟合、对数
拟合、幂函数拟合等。
首先,要进行曲线拟合,需要准备好要拟合的数据。
在MATLAB 中,可以使用plot函数将数据点绘制成散点图,然后再用拟合函数
拟合这些数据点。
拟合函数的选择取决于数据的特点和拟合的要求。
例如,如果数据的变化趋势与指数函数相似,可以选择使用fit函
数进行指数拟合;如果数据呈现多项式的变化规律,可以使用
polyfit函数进行多项式拟合。
另外,在MATLAB中,也可以使用cftool命令来进行曲线拟合。
cftool是MATLAB提供的一个交互式工具,可以通过图形界面直观
地进行曲线拟合操作。
用户可以导入数据,选择拟合类型,调整拟
合参数,实时观察拟合效果,并且可以导出拟合结果供后续分析使用。
除了以上提到的方法,MATLAB还提供了丰富的工具箱和函数,如curve fitting toolbox、lsqcurvefit等,用于更复杂和高级的曲线拟合需求。
这些工具可以帮助用户处理各种不同类型的数据,并进行更精确的曲线拟合。
总之,MATLAB提供了多种方法和工具用于数据的曲线拟合,用户可以根据自己的需求和数据的特点选择合适的方法进行曲线拟合分析。
希望这些信息能够帮助你更好地理解在MATLAB中进行曲线拟合的方法和技巧。
7.4 用Matlab求解曲线拟合问题
2 [ f ( x ) y ] i i i 1 11
最小
12
1)输入以下命令: x=0:0.1:1;
10 8 6 4
y=[-0.447 1.978 3.28 6.16 7.08 7.34 7.66 9.56 9.48 9.30 11.2];
问题归结为,求 a1,a2, …am 使 J(a1,a2, …am) 最小。
线性最小二乘拟合 f(x)=a1r1(x)+ …+amrm(x)中 函数{r1(x), …rm(x)}的选取 1. 通过机理分析建立数学模型来确定 f(x); 2. 将数据 (xi,yi) i=1, …n 作图,通过直观判断确定 f(x): f=a1+a2x + + + + + f=a1+a2x+a3x2 + + + + + f=a1+a2x+a3x2 + + + + +
f=a1+a2/x + + +
f=aebx +
+
-bx f=ae + +
+ +
+ + +
+
+ +
一、用Matlab进行多项式曲线拟合
1. Matlab中提供函数polyfit作多项式f(x)=a1xm+ …+amx+am+1 曲线拟合,具体的调用格式如下: a=polyfit(x,y,m)
拟合多项式次数 已知数据点向量(长度相同) 输出拟合多项式系数 a=[a1, …am , am+1] (数组)
在Matlab中进行数据拟合和曲线拟合的方法

在Matlab中进行数据拟合和曲线拟合的方法在科学研究或工程应用中,数据拟合和曲线拟合是常见的计算任务之一。
Matlab作为一种强大的数值计算软件,提供了丰富的工具和函数,方便我们进行数据拟合和曲线拟合的操作。
本文将介绍在Matlab中进行数据拟合和曲线拟合的几种方法。
一、线性回归线性回归是最简单的数据拟合方法之一,常用于建立变量之间的线性关系模型。
在Matlab中,可以使用polyfit函数进行线性回归拟合。
该函数可以根据输入数据点的横纵坐标,拟合出一条直线,并返回直线的斜率和截距。
例如,以下代码演示了如何使用polyfit函数进行线性回归拟合:```matlabx = [1, 2, 3, 4, 5];y = [2, 3, 4, 5, 6];coefficients = polyfit(x, y, 1);slope = coefficients(1);intercept = coefficients(2);```在上述代码中,数组x和y分别表示数据点的横纵坐标。
polyfit函数的第三个参数1表示拟合的直线为一阶多项式。
函数返回的coefficients是一个包含斜率和截距的数组,可以通过coefficients(1)和coefficients(2)获取。
二、多项式拟合在实际应用中,线性模型并不适用于所有情况。
有时,数据点之间的关系可能更复杂,需要使用更高阶的多项式模型来拟合。
Matlab中的polyfit函数同样支持多项式拟合。
我们可以通过调整多项式的阶数来拟合不同次数的曲线。
以下代码展示了如何使用polyfit函数进行二次多项式拟合:```matlabx = [1, 2, 3, 4, 5];y = [2, 6, 10, 16, 24];coefficients = polyfit(x, y, 2);a = coefficients(1);b = coefficients(2);c = coefficients(3);```在上述代码中,polyfit的第三个参数2表示拟合的多项式为二阶。
基于matlab曲线拟合的数据预测分析
基于matlab曲线拟合的数据预测分析作者:屈长杰来源:《商情》2016年第40期【摘要】试验所得的数据一般为离散的,且不能直接用一般的方程去描述它们,这样给数据的分析和预测带来了极大的麻烦,本文针对股票数据的变化,使用matlab的多项式拟合,求导,以及预测功能,对股票的实时变化及其变化快慢做出分析,并用得出的拟合方程对未来的股票行情做一个基本的预测。
【关键词】数据分析拟合 matlab21世纪的来临,宣告了信息化和数字化时代的到来,大量的数据在我们身边传输,其中包括关系国家发展的众多数据库,如人口增长,粮食增长,失业率等等,对这些数据的处理和运用,直至预测出未来数据的变化,以达到对相关方面的宏观调控,提升我国的综合实力,相当重要。
本文利用matlab将股票的实时数据进行分析,对未来的股票走势做出预测,得出相关数据,以达到提前掌握市场的目的。
一、数据采集本文使用通达信金融终端输出跃岭股份(002725)2014年1月29号至2014年4月23号股市收盘价表格,并输入起始文件夹,存为txt格式文件。
二、数据导入采集的数据存入gupiaoy.xls文件中,拟合的横坐标定义为单位的采样信号,数据输入gupiaox.xls文件中,将采集的数据,定义在MATLAB工作区间,为X和Y的矩阵。
三、matlab多项式线性拟合(一)多项式拟合调用格式为p=polyfit(x,y,n),其中x和y是输入的原始数据,而n代表阶次,当n=1时,拟合形式为线性回归,当n=2时,多项式为二阶多项式,原则上当n越大是,所取多项式越接近于原方程的形式,误差越小。
(二)系统设置原始数据以验证系统是否处于正常工作状态,并测试系统的准确率是否有所更改,原始数据系列x 为0、0.1、0.2、0.3、0.4、0.5、0.6、 0.7、0.8、0.9、1;其中y为0.46、1.99、3.27、6.16、7.08、7.34、 7.56、9.66、9.45、9.34、11.4。
matlab 根据曲线拟合方程
【引言】曲线拟合是数学分析中一种常用的方法,通过数学模型对一系列数据点进行拟合,从而得到一个函数或曲线,使其能够很好地描述这些数据。
在工程、经济、物理、生物等领域中,曲线拟合都有着广泛的应用。
MATLAB作为一种强大的数学工具软件,提供了丰富的曲线拟合函数和工具箱,能够帮助用户实现各种复杂的曲线拟合任务。
本文将介绍MATLAB中的曲线拟合方程,并对其进行深入分析和讲解。
【一、曲线拟合的原理】1.1 数据拟合的概念在实际应用中,我们常常需要根据一系列给定的数据点,找到一个函数或曲线,使其能够很好地拟合这些数据。
这个过程就称为数据拟合。
曲线拟合是一种常用的数据拟合方法,通过拟合出的函数或曲线,我们可以进行数据的预测、趋势的分析等。
1.2 曲线拟合的方法在进行曲线拟合时,常用的方法包括线性拟合、多项式拟合、非线性拟合等。
线性拟合是最基本的拟合方法,它试图找到一条直线对数据进行拟合;多项式拟合则是试图通过一个多项式函数对数据进行拟合;非线性拟合是指通过非线性函数对数据进行拟合,可以拟合各种形状的曲线。
【二、MATLAB中的曲线拟合函数】2.1 polyfit函数MATLAB提供了polyfit函数,可以实现多项式拟合。
其语法为:p = polyfit(x, y, n)其中,x为自变量,y为因变量,n为多项式的次数,p为拟合出的多项式系数。
2.2 fit函数MATLAB的Curve Fitting Toolbox中提供了fit函数,可以实现各种曲线拟合,包括线性拟合、多项式拟合、指数拟合、幂函数拟合等。
其语法为:f = fit(x, y, 'type')其中,x为自变量,y为因变量,'type'为拟合的类型,f为拟合出的函数。
2.3 cftool工具MATLAB的Curve Fitting Toolbox还提供了cftool工具,可以通过可视化界面实现曲线拟合,用户可以方便地进行参数设定、拟合结果的可视化展示等操作。
基于matlab曲线拟合的数据预测分析
基于matlab曲线拟合的数据预测分析
基于matlab曲线拟合的数据预测分析
作者:屈长杰
作者机构:云南大学
来源:商情
ISSN:1673-4041
年:2016
卷:000
期:040
页码:195
页数:1
正文语种:chi
关键词:数据分析;拟合;matlab
摘要:试验所得的数据一般为离散的,且不能直接用一般的方程去描述它们,这样给数据的分析和预测带来了极大的麻烦,本文针对股票数据的变化,使用matlab 的多项式拟合,求导,以及预测功能,对股票的实时变化及其变化快慢做出分析,并用得出的拟合方程对未来的股票行情做一个基本的预测.。
基于MATLAB的不同曲线拟合方式的比较研究 电子信息毕业论文

本科生毕业论文基于MATLAB的不同曲线拟合方式的比较研究院系:电子信息工程学系专业:测控技术与仪器班级:学号:指导教师:职称(或学位):助理实验师/硕士2016年5 月原创性声明本人郑重声明:所呈交的论文(设计),是本人在导师的指导下,独立进行研究工作所取得的成果。
除文中已经注明引用的内容外,本论文(设计)不含任何其他个人或集体已经发表或撰写过的作品成果。
对本论文(设计)的研究做出重要贡献的个人和集体,均已在文中以明确方式标明。
本人完全意识到本声明的法律结果由本人承担。
学生签名:年月日指导声明本人指导的同学的毕业论文(设计)题目大小、难度适当,且符合该同学所学专业的培养目标的要求。
本人在指导过程中,通过网上文献搜索及文献比对等方式,对其毕业论文(设计)内容进行了检查,未发现抄袭现象,特此声明。
指导教师签名:年月日目录1 引言 (2)2 软件介绍 (2)2.1MATLAB简介 (2)2.2MATLAB曲线拟合工具箱简介 (2)3 曲线拟合 (4)3.1 曲线拟合理论 (4)3.2最小二乘法拟合 (4)4 基于MATLAB的曲线拟合 (5)4.1曲线拟合数据来源 (5)4.2指数函数曲线拟合 (6)4.3最小二乘法多项式曲线拟合 (7)4.4内插式曲线拟合 (8)4.5平滑样条曲线拟合 (9)5 曲线拟合结果的比较 (11)6 结论 (12)致谢 (13)参考文献 (13)基于MATLAB的不同曲线拟合方式的比较研究郑洪滟(电子信息工程学系指导教师:肖郑颖)摘要:随着现代计算机技术的快速发展,计算机软件的应用范围越来越广泛。
基于MA TLAB 软件曲线拟合的方法也越来越广泛地应用到工程分析和科学研究中。
采用MATLAB曲线拟合工具箱对数据集进行拟合处理,可以快速地在简单易用的环境中实现许多基本的曲线拟合。
文章对曲线拟合进行理论分析和数学描述,引入可视化高性能的工具软件MA TLAB对曲线进行最小二乘法拟合、指数函数拟合、内插式曲线拟合和平滑样条式曲线拟合。
matlab 数据 曲线拟合

matlab 数据曲线拟合全文共四篇示例,供读者参考第一篇示例:Matlab是一款功能强大的数据分析和曲线拟合工具,广泛应用于科学研究、工程设计、金融分析等领域。
在实际工作中,我们经常需要对实验数据进行处理和分析,而曲线拟合是其中一个常见的操作。
本文将介绍在Matlab中如何进行数据曲线拟合,并通过实例详细说明其使用方法。
我们需要准备一组实验数据,这些数据通常是以表格的形式存储在Excel或文本文件中。
假设我们有一组随机产生的数据点,存储在一个文本文件中,每行包含一对(x, y)坐标。
我们可以通过Matlab的文件读取函数将这些数据导入到Matlab中,然后进行曲线拟合分析。
接下来,我们需要选择适合数据走势的拟合模型。
根据实际情况,可以选择线性函数、多项式函数、指数函数、对数函数等不同类型的拟合模型。
在Matlab中,使用`polyfit`函数可以进行多项式拟合,使用`expfit`函数可以进行指数拟合,使用`fit`函数可以进行其他自定义的拟合操作。
以多项式拟合为例,我们假设要对一组数据进行二次多项式拟合。
通过`load`函数读取数据文件,然后将数据分成两个数组`x`和`y`,分别表示x坐标和y坐标。
接下来,使用`polyfit`函数进行拟合操作,语法如下:```matlabp = polyfit(x, y, 2);````2`表示进行二次多项式拟合。
拟合结果会保存在向量`p`中,`p`的元素表示拟合多项式的系数。
完成拟合操作后,我们可以利用拟合结果绘制曲线图。
通过`polyval`函数,可以根据拟合结果生成拟合曲线的y坐标值,并与原始数据一起绘制在图上,以便进行对比和分析。
除了多项式拟合之外,Matlab还提供了许多其他灵活的拟合方法。
对于非线性数据,可以使用`fit`函数进行非线性拟合。
该函数允许用户根据实际数据特点选择不同的拟合模型,并进行参数估计和优化。
在实际应用中,曲线拟合是数据分析的重要环节之一。
matlab曲线拟合 - 非常好非常全面的介绍M拟合的参考资料
Mathworks Tech-Note 1508 曲线拟合向导1.介绍2. Mathworks 产品的曲线拟合特色a.曲线拟合工具箱(Curve Fitting Toolbox)b.Matlab 内建函数与其他的带有曲线拟合能力的附加产品(工具箱)c.线性曲线拟合d.非线性曲线拟合3.加权曲线拟合方法a.曲线拟合工具箱b.统计工具箱c.优化工具箱4.利用曲线拟合工具箱提高曲线拟合结果5.其他的相关资料第1节:简介MA TLAB即有内建的解决很多通常遇到的曲线拟合问题的能力,又具有附加这方面的产品。
本技术手册描述了几种拟合给定数据集的曲线的方法,另外,本手册还解释了加权曲线拟合、针对复数集的曲线拟合以及其他一些相关问题的拟合技巧。
在介绍各种曲线拟合方法中,采用了典型例子的结合介绍。
第2节:MathWorks产品的曲线拟合特色MATLAB有可以用于曲线拟合的内建函数。
MathWorks公式也提供了很多工具箱可以用于曲线拟合。
这些方法可以用来做线性或者非线性曲线拟合。
MATLAB也有一个开放的工具箱――曲线拟合工具箱(Curve Fitting Toolbox),她可以用于参数拟合,也可以用于非参数拟合。
本节将介绍曲线拟合工具箱与其他工具箱、以及各种MA TLAB可以用于曲线拟合的内建函数的详细特征。
a.曲线拟合工具箱曲线拟合工具箱是专门为数据集合进行曲线拟合而设计的。
这个工具箱集成了用MA TLAB建立的图形用户界面(GUIs)和M文件函数。
•利用工具箱的库方程(例如线性,二次,高阶多项式等)或者是用户自定义方程(局限于用户的想象力)可以进行参数拟合。
当你想找出回归系数以及他们背后的物理意义的时候就可以采用参数拟合。
•通过采用平滑样条或者其他各种插值方法,你就可以进行非参数拟合。
当回归系数不具有物理意义并且不在意他们的时候,就采用非参数拟合方法。
曲线拟合工具箱提供了如下功能:•数据回归,譬如截面(?sectioning)与平滑;•标准线性最小二乘拟合,非线性最小二乘拟合,加权最小二乘拟合,约束二乘(constrained least squares)拟合以及稳健(robust)拟合;•根据诸如R2以及误差平方和(SSE)确定的拟合性能的统计特征。
matlab如何实现曲线拟合?matlab做曲线拟合的教程

matlab如何实现曲线拟合?matlab做曲线拟合的教程Matlab是⼀个很强⼤的数据处理软件,是⼈们进⾏数据分析的得⼒助⼿。
⼀般我们做社会调研或科学研究时,会得到很多实验
数据。
当需要研究两个变量之间的关系时,经常要⽤到曲线拟合。
曲线拟合不仅能给出拟合后的关系式,还能⽤图形直观的展现出变量之间的关系。
其实⽤matlab做曲线拟合很便捷,下⾯将以两个变量(y=f(x))为例详细介绍:
1、运⾏Matlab软件。
在⼯作空间中存⼊变量的实验数据。
具体如下:可以直接⽤矩阵来存放数据,直接在命令窗⼝输⼊
x=[数据x1,数据x2,...,数据xn];
y=[数据y1,数据y2,...,数据yn];
当数据较多时,可以从excel,txt等⽂件中导⼊。
2、把数据存⼊⼯作空间后,在命令窗⼝中输⼊cftool,回车运⾏。
3、在这个拟合⼯具窗⼝的左边,选择变量,即分别选择x,y。
4、选择拟合的曲线类型,⼀般是线性拟合,⾼斯曲线,平滑曲线等,根据需要选择。
选择完后会⾃动完成拟合,并且给出拟合函数表达式。
5、点击菜单栏中的“file”,选择“print to figure"进⾏画图。
6、在图形窗⼝中,可以对图形显⽰模式进⾏修改,如添加标题,坐标名称等。
7、最后得到⽐较完整的图形曲线。
点击”file"中的“save"进⾏保存。
注意事项:x和y的数据个数应该⼀致。
基于matlab的高斯曲线拟合求解
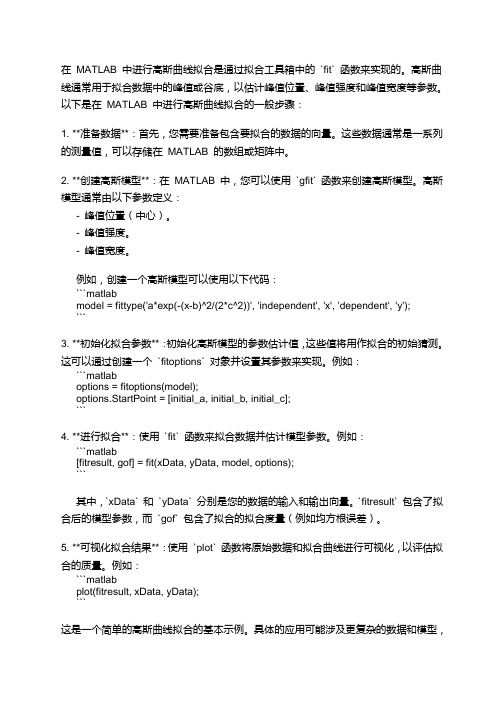
在MATLAB 中进行高斯曲线拟合是通过拟合工具箱中的`fit` 函数来实现的。
高斯曲线通常用于拟合数据中的峰值或谷底,以估计峰值位置、峰值强度和峰值宽度等参数。
以下是在MATLAB 中进行高斯曲线拟合的一般步骤:1. **准备数据**:首先,您需要准备包含要拟合的数据的向量。
这些数据通常是一系列的测量值,可以存储在MATLAB 的数组或矩阵中。
2. **创建高斯模型**:在MATLAB 中,您可以使用`gfit` 函数来创建高斯模型。
高斯模型通常由以下参数定义:- 峰值位置(中心)。
- 峰值强度。
- 峰值宽度。
例如,创建一个高斯模型可以使用以下代码:```matlabmodel = fittype('a*exp(-(x-b)^2/(2*c^2))', 'independent', 'x', 'dependent', 'y');```3. **初始化拟合参数**:初始化高斯模型的参数估计值,这些值将用作拟合的初始猜测。
这可以通过创建一个`fitoptions` 对象并设置其参数来实现。
例如:```matlaboptions = fitoptions(model);options.StartPoint = [initial_a, initial_b, initial_c];```4. **进行拟合**:使用`fit` 函数来拟合数据并估计模型参数。
例如:```matlab[fitresult, gof] = fit(xData, yData, model, options);```其中,`xData` 和`yData` 分别是您的数据的输入和输出向量。
`fitresult` 包含了拟合后的模型参数,而`gof` 包含了拟合的拟合度量(例如均方根误差)。
5. **可视化拟合结果**:使用`plot` 函数将原始数据和拟合曲线进行可视化,以评估拟合的质量。
Matlab数据拟合与曲线拟合方法

Matlab数据拟合与曲线拟合方法【引言】数据拟合与曲线拟合是在科学研究和工程应用中常见的问题之一。
随着大数据时代的到来,数据拟合与曲线拟合方法在各个领域的重要性日益凸显。
本文将介绍基于Matlab的数据拟合与曲线拟合方法,包括最小二乘法、多项式拟合、样条拟合、指数拟合等,以及在实际应用中的一些注意事项。
【数据拟合方法一:最小二乘法】最小二乘法是一种常见的数据拟合方法,它通过最小化残差平方和,寻找最优解。
在Matlab中,我们可以使用内置函数“polyfit”来实现最小二乘法拟合。
该函数可以使用一条直线或多项式进行拟合,并返回拟合参数。
对于非线性函数,可以通过线性化或迭代求解的方式进行。
【数据拟合方法二:多项式拟合】多项式拟合是一种常用的数据拟合方法,它用一个多项式函数来近似拟合数据。
在Matlab中,我们可以使用“polyfit”函数实现多项式拟合。
该函数可以拟合任意次数的多项式,并返回拟合系数。
然后,利用这些系数可以计算拟合曲线,并评估拟合的准确性。
【数据拟合方法三:样条拟合】样条拟合是一种平滑且灵活的数据拟合方法,它基于样条函数的概念,将数据划分为多个区间,并在每个区间内拟合一个多项式。
在Matlab中,我们可以使用“spline”函数来实现样条拟合。
该函数需要提供拟合的数据点和拟合阶数,并返回拟合曲线。
【数据拟合方法四:指数拟合】指数拟合是一种适用于指数增长或衰减趋势的数据拟合方法,它将数据拟合为一个指数函数。
在Matlab中,我们可以使用“fit”函数和指数模型来实现指数拟合。
该函数可以自动调整模型参数,使拟合曲线与数据最匹配。
通过评估拟合结果的可靠性指标,我们可以判断拟合是否准确。
【数据拟合实例:气象数据分析】为了更好地理解数据拟合方法的应用,我们以气象数据分析为例进行探讨。
假设我们有一组记录了气温变化的数据点,并希望找到一个拟合曲线以准确地预测未来的气温变化情况。
通过应用多项式拟合或样条拟合方法,我们可以得到一个平滑的曲线,并计算出拟合曲线与实际数据的拟合度。
基于Matlab的曲线拟合
基于Matlab的曲线拟合周丽(物理与电子工程系,10级电子信息工程,学号1008211023)摘要在现如今的社会,工程上根据特定条件,求出离散点,再根据此离散点做连续化处理。
在实际应用中,对推导过去和预测未来有着很广泛的应用。
在本文中,首先介绍曲线拟合的含义和目的。
其次,介绍实现曲线拟合的最常用方法——最小二乘法。
第三,根据最小二乘法的原理,介绍基于Matlab 怎样实现曲线拟合。
最后通过举例说明,从而更好的理解基于Matlab的曲线拟合在实际中的重要作用。
关键词:Matlab 曲线拟合最小二乘法ABSTRACTIn today's society, according to the specific criteria on the project, calculating the discrete point, again Doing the continuous processing based on the discrete points. In practice, the derivation of the past and predict the future has a wide range of applications.In this article, first describes the meaning and purpose of curve fitting. Second, describes the most common method of realization of curve fitting--least-squares method. Third, according to the principle of least squares, describes how come ture the curve fitting based on Matlab. Last by example, so as to better understand curve fitting based on Matlab in the important role of the actual.Key words: Matlab Curve fitting least-squares一 引言在生产实践和科学实验中,经常会遇到大量的不同类型的数据。
matlab表格曲线拟合

matlab表格曲线拟合在MATLAB中,要进行表格数据的曲线拟合,可以使用`fit`函数来实现。
首先,你需要将表格数据加载到MATLAB中,然后使用`fit`函数来拟合你需要的曲线模型。
以下是一个简单的步骤:步骤1,加载数据。
你可以使用`readtable`函数将你的表格数据加载到MATLAB中。
假设你的数据存储在一个名为`data.csv`的CSV文件中,你可以使用以下命令加载数据:matlab.data = readtable('data.csv');步骤2,进行曲线拟合。
接下来,你可以使用`fit`函数来拟合数据。
假设你想要拟合一个多项式模型,比如二次多项式,你可以使用以下命令:matlab.x = data.x; % 假设x列是自变量数据。
y = data.y; % 假设y列是因变量数据。
f = fit(x, y, 'poly2'); % 进行二次多项式拟合。
步骤3,可视化拟合结果。
最后,你可以使用`plot`函数来绘制原始数据和拟合曲线,以便可视化拟合结果:matlab.plot(f, x, y); % 绘制拟合曲线和原始数据。
xlabel('x'); % 添加x轴标签。
ylabel('y'); % 添加y轴标签。
legend('拟合曲线', '原始数据'); % 添加图例。
需要注意的是,以上只是一个简单的例子,你可以根据你的实际情况选择合适的拟合模型,并对拟合结果进行进一步的分析和处理。
希望这些信息能够帮助到你进行MATLAB中表格数据的曲线拟合。
- 1、下载文档前请自行甄别文档内容的完整性,平台不提供额外的编辑、内容补充、找答案等附加服务。
- 2、"仅部分预览"的文档,不可在线预览部分如存在完整性等问题,可反馈申请退款(可完整预览的文档不适用该条件!)。
- 3、如文档侵犯您的权益,请联系客服反馈,我们会尽快为您处理(人工客服工作时间:9:00-18:30)。
英文翻译系别专业班级学生姓名学号指导教师报告日期Data Curve Fitting Based on MATLABCurve fitting is the process of constructing a curve, or mathematical function, that has the best fit to a series of data points,possibly subject to constraints. Curve fitting can involve eitherinterpolation, where an exact fit to the data is required, or smoothing, in which a "smooth" function is constructed that approximately fits the data. A related topic is regression analysis, which focuses more on questions of statistical inference such as how much uncertainty is present in a curve that is fit to data observed with random errors. Fitted curves can be used as an aid for data visualization, to infer values of a function where no data are available, and to summarize the relationships among two or more variables.Extrapolation refers to the use of a fitted curve beyond the range of the observed data, and is subject to adegree of uncertaintysince it may reflect the method used to construct the curve as much as it reflects the observed data. Research and Application of a New Method of Curve Fitting.The technique of curve fitting is used proverbially for the image processing, reverse engineering, test data processing, etc. It is inequitable to process physical parameters by some usual methods of curve fitting. Those methods are performed only by minimizing the fitting error of one physical parameter, but do not take other parameters into account. The new method of curve fitting processes each physical parameter equally The simulation also proves that this new curve fitting method is right and effective.In the experiment of sound velocity, the voltammetry to measure the resistance experiment and the volt-ampere characteristic of diode experiment data processing as an example, introduced the experiment data processing based on MATLAB.With the traditional experimental data processing methods, experimental data is processed by using MATLAB can effectively avoid the error caused by manual processing, but also can reduce the computational workload, obtain accurate curve fitting, thereby increasing the accuracy of data processing and fast,rom graphic display results also can be more intuitive to judge the validity of the experiment.Mathematical expressionGiven set of discrete data(x k,y k) (k=1,2,…,m),(1)Where xk is the independent variable x (scalar or vector, i.e., a mono-or polyhydric variable) values; yk of (scalar) corresponding to the value of the dependent variable y. Curve fitting is to seek to solve the problem of (1) to adapt the laws of the analytical expression of the backgroundy=f(x,b),(2)Making best approximation in some sense or fit (1), (x, b) is called fitting model;? Parameters to be determined, when b) only appears when the linear, called a linear model? otherwise non-linear.Amount(k=1,2,…,m)In xk place called residual or remaining fit,The standard measure of goodness of fit is usually或Where ωk> 0 as weight coefficient or weight(Unless otherwise specified, generally taken to be the average weight,w k(k=1,2,…,m),At this time without mention weight).When the parameter b) make T (b)) or Q (b)) to achieve the most hours,Appropriate (2) are referred to (1) the weighted Chebyshev fitting meaning orweighted least squares sense,latter is more simple and most commonly used in the calculation.General linear model to determine the model parameters are parameters b) generalized polynomial coefficients,thatf(x,b)=b0g0(x)+b1g1(x)+…b n g n(x)(3)Wherein g0, g1, ..., gn called basis functions.Gj on various different choices may constitute a variety of typical and commonly used linear model.From the point of view of function approximation, equation (3) can be approximated reflect the nature of many of nonlinear models.In the least squares sense (3) fitting a linear model with a discrete set of points(1),parameter b can be obtained by solving equations=0(i=0,…,n)to determine,that solution on b0,b1,…,bn of linear algebraic equations(i=0,1,…,n),(4)Formula (i,j=0,1,…,n),Equations (4) commonly referred to as the normal equation or the normal equation, when m> n, generally have a unique solution.As for the case of non-linear model and the principle of least squares, the parameter b) can be determined (see numerical solution of nonlinear equations, optimization) nonlinear equations or calculations about the method optimization.Select the modelFor a given discrete data (1), the need to properly select the general model (2) of the function f (x, b) the type and specific form, which is the basis of fitting results.If known, (1) the actual background of the law, that is the dependent variable ydependence of the empirical formula of the independent variable x has an expression determined directly take appropriate empirical formula is fitting model.On the contrary, through the model (3) of the basis functions g0, g1, ..., gn (number and types) of different choices, each corresponding proposed merger by choosing the good effect.Function g0, g1, ..., gn adaptation plays a role the model for testing, it is also known test function.Another way is: the number and types into a sufficient number of test functions in the model (3), by means of statistical methods in mathematical correlation analysis and test of significance of the test function contains screened individually or sequentially with establish more appropriate model (see regression analysis).Certainly, the above method may fit residuals (as a new discrete data) is performed again to compensate for the lack of the first fitting.In conclusion, when the intrinsic link between the variables in the data is not clear, as the choice to adapt the model to fit generally requires repeated testing and analysis to identify.Procedure(一)Draw a scatter plot, select the appropriate type of curve.Generally based on the nature of the information can be combined with the expertise to determine the type of curve data, not reallytaht can be plotted on graph paper squares scatter plot, according to the distribution of scattered points, choose close, the appropriate curve type.Can be plotted on graph paper squares scatter plot, according to the distribution of scattered points, choose close, the appropriate curve type.(二)Be variable transformationY’=f(Y),X’=g(X)(12.37)The two variables transformed linear relationship.(三)Solving linear equations and variance analysis by the least squares method(四)Convert the linear equations on the original variables X, Y of the function expression基于MATLAB的数据曲线拟合分析曲线拟合是构建的过程曲线,或数学函数,具有最适合于一系列的数据点,可能受到约束。