甲板上浪和冲击载荷的数值模拟
钢结构局部强度计算【范本模板】

钢结构局部强度计算目录绪论 (4)1 强度的分类 (4)2 载荷的分类 (4)3 构件变形的分类 (5)4 许用应力与安全因数 (5)第一章杆件的强度和稳定性计算 (7)1。
1 型材剖面要素的计算 (7)1.1。
1型材带板 (7)1.1。
2 型材剖面模数与惯性矩的计算 (7)1。
2拉杆和短粗压杆的强度设计 (9)1。
2.1 危险点的位置 (9)1。
2。
2 强度设计 (9)1。
3 压杆的稳定性计算 (10)1.3.1细长杆的稳定性计算 (10)1.3.2中小柔度压杆的稳定性计算 (11)1。
3.3 压杆的稳定性计算 (12)1。
4 杆件抗弯强度计算 (13)1.4.1强度要求 (13)1。
4.2常见形式的型材受力分析 (13)第二章板的强度计算 (16)2。
1 板的分类 (16)2.2 刚性板的应力计算 (16)2。
2。
1均布载荷板内最大正应力的计算 (16)第三章区域详细设计 (19)3.1 外板设计 (19)3。
1.1 船底板 (19)3。
1。
2平板龙骨 (20)3。
1。
3舭列板 (20)3.1.4舷侧外板 (20)3.1。
5舷顶列板 (22)3。
2甲板设计 (22)3.2.1强力甲板 (22)3。
2.2甲板边板 (23)3.2。
3下层甲板 (23)3.2.4甲板外载荷 (24)3。
2.5甲板横梁的剖面模数W不小于下式计算所得值 (25)3.2.6甲板纵桁 (26)3。
2.7甲板纵骨 (26)3.3舱壁设计 (27)3.3.1水密舱壁 (27)3。
3。
2非水密舱壁设计 (30)3。
4舷侧骨架设计 (30)3。
4。
1 标准间距s b (30)3。
4.2 横骨架式舷侧骨架设计 (30)3。
4.3纵骨架式舷侧骨架设计 (31)附录一常用型材规格表 (35)表1 球扁钢 (35)表2 不等边角钢 (37)表3 不等边不等厚角钢 (40)表4 管形钢质支柱 (42)表5瑞典(INEXA)公司球扁钢 (46)表6 挪威(FUNDIA)公司球扁钢 (48)附录二肘板尺寸 (50)表7 肘板尺寸 (50)附录三参考文献 (51)绪论船体结构设计内容是:选择合适的结构材料和结构形式,决定结构的尺寸和连接方式;在保证结构具有足够强度和安全性的前提下,使其具有最佳的技术经济性和美观性。
常用ABS专业术语对照
1.DEFINITIONSSCANTLING LENGTH (L)首尾柱间长96%夏季载重线<L<97% FREEBOARD LENGHTH (L f)干舷长度0.85型深处水线与96%水线的大者BREADTH (B)型宽DEPTH 深度MOLDED DEPTH(D)型深SCANTLING DEPTH(D S)基线到强力甲板的距离DRAFT(d)型吃水MOLDED DISPLACEMENT (Δ)型排水量,夏季载重线处排水量BLOCK COEFFICIENT(C b)方型系数FRDDBOARD DECK干舷甲板,吃水可以达到的最高甲板BULKHEAD DECK 舱壁甲板,水密舱壁延伸并产生力的最高甲板STRENGTH DECK 强力甲板,顶部的有效甲板,每部分支架都有长度SUPERSTRUCTURE DECK 上层建筑甲板,外板延伸的干舷甲板以上的甲板,没有特别说明,是指干舷甲板上第一层甲板DEADWEIGHT(DWT)空船重量LIGHTSHIP WEIGHT空船重量2.MA TERIAL GRADE 材料等级HIGHER-STRENGTH STEEL 高强度钢FATIGUE LOADING 疲劳载荷CORROSION FATIGUE 腐蚀疲劳BILGE STRAKE 舭列板SIDE PLATING 边板SHEER STRAKE 舷顶列板STRINGER PLATE 边板EXPOSED TO WEATHER露天STRAKE 列板SINGLE BOTTOM 单底DOUBLE BOTTOM 双层底TOP WING TANK 顶边舱BILGE KEEL 舭龙骨HATCH COAMING 舱口围板RUDDER 舵RUDDER HORN 舵角SHAFT BRACKET轴承座RESTRICTED SERVICE 有限航区UNRESTRICTED SERVICE 无限航区GUNW ALE PLATE 船舷上缘板(垂直的)FRAME 肋位FRAME SPACE肋距STRESS CONCENTRA TION 压力集中LIGHTENING HOLE 减轻孔DRAINAGE HOLE 排水口SNIPED END 末端END TAPER 端部削斜LONGITUDINAL STRENGTH 纵向强度SIGN CONVENTION 符号规约BENDING MOMENT 弯矩SHEAR FORCE 剪应力FLOODED HOLD CONDITION 满舱持衡状态W A VE LOADS 摇动载荷W A VE BENDING MOMENT 摇动弯矩SAGGING MOMENT 正弯矩下垂力矩HOGGING MOMENT负弯矩POSITION SHEAR FORCE 正剪力NEGA TIVE SHEAR FORCE 负剪力SECTION MODULUS 剖面模数BENDING STRESS 弯应力ALGEBRAIC SUM 代数和INERTIA 惯性、惯量MOMENT OF INERTIA 惯性矩ABAFT 在船尾A THW ARTSHIP 横过船的SHEAR FLOW 剪切流BULK CARRIER 散货船ORE CARRIER 矿石船COMBINATION CARRIER 化学品船ALLOWABLE STRESSES 许用应力HATCH COAMING 舱口围板COMPL Y WITH 按照ENVELOPE CURVE 包含曲线BUCKLING STRENGTH 抗弯强度PASSENGER SHIP 客船LONGITUDINAL BULKHEAD 纵舱壁SHEAR STRESS 剪切力PRISMA TIC菱形的LOADING MANUAL 装载手册INTERNATIONAL CONVENTION ON LOAD LINES 国际载重线公约CATEGORY ONE 一种HOMOGENEOUS 均匀的UNEVENL Y DISTRIBUTE 不均衡分布RO-RO FERRIES 滚装摆渡LATERAL 侧面的、横向的SERVICE CONDITION 使用情况,操作条件ANNUAL SURVEYS 每年的检查WORKING ORDER 正常运转状态FULL LOAD CONDITIONS 满载状态DEPARTURE PORT CONDITIONS 离港状态ARRIV AL PORT CONDITIONS 到港状态CRITICAL LOADING CONDITIONS 临界装载状态IN-PORT CONDITIONS 港内状态INTERMEDIATE CONDITIONS 中间状态DURING THE VOY AGE 航行过程中ELASTIC BUCKLING OF PLATES 弹性屈服力T-SECTIONS T型材ANGLE 角钢BULB FLAT 球形面板FLAT BAR 扁钢PARALLEL TO 平行于PERPENDICULAR TO 垂直于CROSS SECTION 横截面WARPING CONSTANT 扭曲常数CRITICAL BUCKLING STRESSES 临界屈曲应力YIELD STRESS 屈服点、屈服应力MILD STEEL 低碳钢SHELL PLATING 外板SHELL PLATING AMIDSHIP 船中外板UPPERMOST CONTINUOUS DECK 最高连续甲板SUPERSTRUCTURE 上层建筑POOP 船尾楼FORECASTLE 前甲板BOTTOM PLATING 船底板EQUA TION 等式TRANSVERSEL Y-FRAMED BOTTOMS 横骨架式的船底LONGITUDINALL Y-FRAMED BOTTOMS 纵骨架式船底AFTER ALL 毕竟CORRECTION 修正BY LINEAR INTERPOLATION 线性内插法BY INTERPOLATION 通过插值FLAT PLATE KEEL 平板龙骨TRANSVERSE FRAMING 横骨架式结构LONGITUDINAL FRAMING 纵骨架式结构BE MULTIPLIED BY 被。
Wigley船的大幅运动与甲板上浪的时域模拟
Wigley船的大幅运动与甲板上浪的时域模拟何广华;张子豪;王正科;漆池【摘要】为了对迎浪航行船舶的大幅运动和甲板上浪进行预报分析,基于自由液面捕捉法的多相流软件FINE/Marine建立了数值模型,基于该模型对Wigley船甲板上浪的动态过程进行了系统的模拟.针对甲板上浪的重要影响因素(波长和波幅等)模拟了在不同波长下Wigley船的运动响应和不同波幅下Wigley船的甲板上浪过程.为了更加真实地模拟上浪过程,模型基于粘性流理论,采用固-液-气三相流耦合模型,并利用BRICS可压缩型离散格式精确捕捉自由液面,减小自由液面附近构成函数的数值扩散,比较理想地处理了波浪破碎和自由液面的复杂演化问题.基于该数值模型计算了Wigley船的辐射问题,其结果与试验数据相符较好.模拟和分析了Wigley 船各时段的运动响应特性和水动力性能特性,模拟结果表明相对波长1.2的海况更易发生上浪现象.该研究成果对甲板上浪问题的机理探索以及甲板上浪导致的冲击载荷研究具有重要的作用,对船体主尺度和结构的设计具有一定的参考价值.【期刊名称】《哈尔滨工程大学学报》【年(卷),期】2018(039)008【总页数】9页(P1269-1277)【关键词】甲板上浪;数值模拟;界面捕捉;辐射问题;冲击载荷;运动响应;Wigley 【作者】何广华;张子豪;王正科;漆池【作者单位】哈尔滨工业大学(威海) 船舶与海洋工程学院,山东威海264209;哈尔滨工业大学(威海) 船舶与海洋工程学院,山东威海264209;哈尔滨工业大学(威海)船舶与海洋工程学院,山东威海264209;哈尔滨工业大学(威海) 船舶与海洋工程学院,山东威海264209【正文语种】中文【中图分类】U661.32船舶在海上航行遭遇大幅海浪时易产生大幅运动,其可能导致结构因承受的载荷剧增而严重破坏,并对船舶的稳定性和安全性造成影响[1],尤其是大幅的垂向运动将导致甲板上浪现象的发生,而甲板上浪是一种对结构物极具破坏力的强非线性现象,朱仁传等[2]研究表明,该现象主要是海上巨浪和船体的垂向运动(垂荡和纵摇运动)组合作用的结果。
FPSO甲板上浪的数值模拟

Hu Changhong[ 16 ]建立了一个基于 C IP方法的非 线性自由面流动的模型 。流体和固壁之间的相互作 用通过多相流来描述 。通过求解交错网格上的一组 控制方程来模拟流动 。
动力的分析 [8 ] ,以估计甲板上浪问题 。然而 ,近来一 FLUENT中的动网格模块实现 ,自由面由 VOF 方法
些对 FPSO 实验的观察和描述表明 ,这种做法难以预 来捕捉 ,默认体积分数 F = 0. 5的地方为自由面 。由
报上浪的出现和上浪造成的载荷 。因为上浪是一个 于没有考虑船体运动的影响 ,模拟结果与真实海况中
法给出精确和详细的数值模拟 。
计算机的发展为上浪问题的直接数值模拟创造 了条件 。一些计算方法 ,特别是能够模拟自由面大变
图 1 计算区域几何简图
形 ,波浪破碎和翻卷的算法应运而生 。其中有 VOF 2 建立模型
方法 、SPH 方法 、C IP 方法 、标志点法 (MAC ) 、Level2
set方法等 。 Kleefsm an[ 15 ]给出了包含船体运动的甲板上浪的
强测量点 P4, P4距甲板的垂向距离为 0. 03 m 如图 4 力学黏性系数 , f1 = 0, f2 = 0, f3 = g, Fi 为 附 加 源 所示 。另外在船体中纵剖面所在平面的 x = 2 m 和 x 项 。 = 5 m 处设置水位测量 H4 和 H5。本文采用模型
VO F方法的基本原理是通过研究网格单元中流
A辑第 22卷第 2期 水 动 力 学 研 究 与 进 展 Ser. A , Vol. 22, No. 2 2007年 3月 JOURNAL OF HYDROD YNAM ICS M ar. , 2007
舰载机着陆起落架受冲击分析
舰载机着陆起落架受冲击分析摘要:本文针对航母舰载机不同于陆基战斗机的起降方式和着陆条件。
建立舰载机起落架的简化模型,并基于MATLAB软件模拟在一个周期内航空母舰纵摇角度,从而计算分析舰载机在航母上着陆时所受到的冲击载荷。
.关键字:起落架 冲击 Matlab 舰载机引言:在航空母舰上起降舰载机不同于陆基飞机, 由于航空母舰上的着陆区跑道距离只有200~300米,所以舰载机通常采用的是固定角无“平飘”方式降落,通俗意义上就是“硬着陆”,同时航母在受到航洋风浪的影响下,会产生甲板的各种运动。
这些运动都在不同程度上影响舰载机的着陆。
考虑到舰载机着舰尾钩未能勾住拦阻索的情况,所以飞机在下降过程中仍然要保持220~280km/h的固定角下滑速度。
这就对舰载机起落架的强度提出了更高的要求。
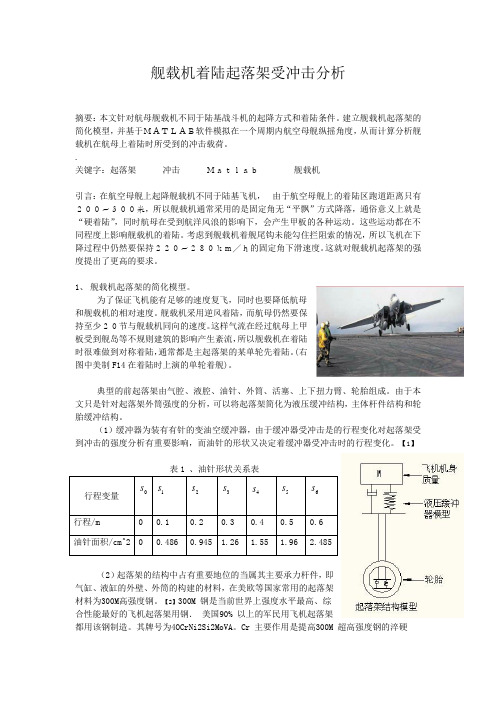
1、 舰载机起落架的简化模型。
为了保证飞机能有足够的速度复飞,同时也要降低航母和舰载机的相对速度。
舰载机采用逆风着陆,而航母仍然要保持至少20节与舰载机同向的速度。
这样气流在经过航母上甲板受到舰岛等不规则建筑的影响产生紊流,所以舰载机在着陆时很难做到对称着陆,通常都是主起落架的某单轮先着陆。
(右图中美制F14在着陆时上演的单轮着舰)。
典型的前起落架由气腔、液腔、油针、外筒、活塞、上下扭力臂、轮胎组成。
由于本文只是针对起落架外筒强度的分析,可以将起落架简化为液压缓冲结构,主体杆件结构和轮胎缓冲结构。
(1)缓冲器为装有有针的变油空缓冲器,由于缓冲器受冲击是的行程变化对起落架受到冲击的强度分析有重要影响,而油针的形状又决定着缓冲器受冲击时的行程变化。
【1】行程变量 0s 1s2s3s4s5s6s行程/m0.10.20.30.40.50.6油针面积/cm^2 0 0.486 0.945 1.26 1.55 1.96 2.485(2)起落架的结构中占有重要地位的当属其主要承力杆件,即气缸、液缸的外壁、外筒的构建的材料,在美欧等国家常用的起落架材料为300M 高强度钢。
某海域极端环境下15万吨级FPSO波浪荷载数值研究

第21卷第4期装备环境工程2024年4月EQUIPMENT ENVIRONMENTAL ENGINEERING·109·某海域极端环境下15万吨级FPSO波浪荷载数值研究刘中柏1,高宁波2*,唐鑫彤3,徐业峻1(1.中海油能源发展股份有限公司采油深圳分公司,广东 深圳 518052;2.武汉船舶职业技术学院,武汉 430050;3.中国船级社海工技术中心,天津 300457)摘要:目的评估在役15万吨级FPSO在某海域百年一遇极端波浪作用下典型横剖面的水动力特性,进而得到FPSO的极值荷载,作为FPSO返坞改造的关键控制参数。
方法基于国产自主三维频域线性势流软件COMPASS-WALCS,建立15万吨级FPSO湿表面网格模型,根据三维绕射-辐射理论,计算湿表面上的水动力荷载,将每个绕射单元上的水动压力直接映射到结构模型上进行计算。
采用谱分析方法对百年一遇海况进行分析,得到短期运动极值响应。
对响应幅值算子(RAO)和波能谱密度进行谱分析,得到极端波浪下的响应谱,进而得到浮体运动和波浪荷载短期预报各种统计值,利用统计方法求得短期响应的最大值。
结果计算了船中部Fr143横剖面的载荷极值,即垂向弯矩、垂向剪力、剖面型心加速度等,发现船舶迎浪时弯矩值最大,随着浪向角增大,弯矩值逐渐减小,剖面垂向剪力则随着浪向角增大逐渐增大。
结论 FPSO 在极端波浪作用下,其大迎浪角条件下荷载更加危险,需要给予格外关注。
关键词:浮式生产储卸油装置;势流理论;极端波浪;响应幅值算子;水平弯矩;加速度中图分类号:TG630 文献标志码:A 文章编号:1672-9242(2024)04-0109-07DOI:10.7643/ issn.1672-9242.2024.04.013Wave Loads of a 150 000-ton FPSO in Extreme Environment of a Sea AreaLIU Zhongbai1, GAO Ningbo2*, TANG Xintong3, XU Yejun1(1. CNOOC Energy Technology & Service-Oil Production Services Co., Guangdong Shenzhen 518052, China;2. Wuhan Institute of Shipbuilding Technology, Wuhan 430050, China;3. China Classification SocietyOcean Engineering Technology Center, Tianjin 300457, China)ABSTRACT: The work aims to evaluate the hydrodynamic characteristics of a typical cross section of a 150 000-ton FPSO un-der extreme wave conditions, occurring in a once-in-a-century wave climate in the South China Sea to obtain the extreme load imposed on the FPSO and use it as a critical control parameter for the FPSO’s dry-dock retrofit. Based on the domestically de-veloped 3D frequency-domain linear potential flow software COMPASS-WALCS, a wet surface grid model of the 150 000-ton FPSO was constructed. The three-dimensional diffraction-radiation theory was used to calculate the hydrodynamic loads on wet收稿日期:2024-03-05;修订日期:2024-04-01Received:2024-03-05;Revised:2024-04-01基金项目:中国博士后科学基金(2017M612541)Fund:China Postdoctoral Science Foundation (2017M612541)引文格式:刘中柏, 高宁波, 唐鑫彤, 等. 某海域极端环境下15w吨级FPSO波浪荷载数值研究[J]. 装备环境工程, 2024, 21(4): 109-115. LIU Zhongbai, GAO Ningbo, TANG Xintong, et al.Wave Loads of a 150,000-ton FPSO in Extreme Environment of a Sea Area[J]. Equipment Environmental Engineering, 2024, 21(4): 109-115.*通信作者(Corresponding author)·110·装备环境工程 2024年4月surface and the water pressure results on each diffraction unit were directly mapped onto the structural model for computation.Spectral analysis was employed to analyze the once-in-a-century wave climate resulting in short-term extreme motion responses.By analyzing the response amplitude operator (RAO) and wave energy spectral density, the response spectrum under extreme waves was obtained to predict various statistical values for the short-term vessel motion and wave loads. Statistical method was used to determine the maximum short-term response. The extreme load values of Fr143 cross section in the middle of the ship, namely vertical bending moment, vertical shear force and profile center acceleration, were calculated. It was found that the bending moment of the ship was the largest when facing the wave, and the bending moment gradually decreased with the in-crease of the wave angle, while the vertical shear force of the cross section gradually increased with the increase of the wave an-gle. It can be concluded that the FPSO experiences more hazardous loads when facing extreme waves at large wave angles which require special attention and consideration.KEY WORDS: FPSO; potential theory; extreme wave; RAO; horizontal bending moment; acceleration海上油气开采是海洋经济的重要组成部分,其依赖于各种海洋平台完成油气钻探和生产作业。
船舶甲板上浪的非线性横摇响应
第27卷 第3期 应 用 力 学 学 报 V ol.27 No.3 2010年9月 CHINESE JOURNAL OF APPLIED MECHANICS Sep.2010基金项目:国家自然科学基金 (50809048);高等学校博士点基金 (200800561093) 来稿日期:2009-11-29 修回日期:2010-09-15第一作者简介:刘利琴,女,1977年生,博士,天津大学建筑工程学院港口与海洋工程教育部重点实验室;研究方向——船舶与海洋结构动力学。
E-mail: l *******************.cn.文章编号:1000- 4939(2010) 03-0565-05船舶甲板上浪的非线性横摇响应刘利琴 唐友刚(天津大学 300072 天津)摘要:考虑甲板上浪引起的横倾力矩、非线性阻尼和非线性恢复力矩,建立了规则横浪中船舶横摇运动方程;基于伯努利方程,推导了船舶甲板上浪水质量的计算公式。
以66.01米长的拖网渔船为例,计算了不同波浪扰动力矩作用下的横摇响应,并构造了响应的分岔图和庞加莱截面。
结果表明:甲板上浪后船舶横摇运动包括混沌运动和周期二、周期三、周期四等多周期运动;随着波浪扰动力矩幅值的增大,横摇响应发生从周期运动到混沌运动或从混沌运动到周期运动的阵发性分岔、正向及反向倍周期分岔。
关键词: 甲板上浪;船舶横摇;混沌;多周期运动;分岔 中图分类号:U661.3 文献标识码:A1 引 言甲板上浪后船舶的运动非常复杂,涉及船舶的大幅非线性运动、船舶与波浪之间的非线性耦合运动以及海洋环境的随机因素。
国内外学者应用数值模拟的方法研究甲板上浪后船舶的运动,主要方法是将甲板划分成网格,用浅水波理论描述甲板上浪水的运动,计算每一个网格处的水压力,将该压力值代入船舶运动方程,数值求解船舶响应。
文献[1]最早在时域中数值模拟了甲板上浪船舶的横摇、横荡耦合运动。
文献[2]将浅水波理论与切片理论相结合,分析比较了甲板上浪和无上浪两种情况船舶的横摇运动,结果表明甲板上浪会导致具有小初稳性高的船舶倾覆。
考虑空气卷入效应的甲板上浪数值模拟
第47卷第1期2018年2月船海工程SHIP&OCEAN ENGINEERINGVol.47 No.1Feb.2018D O I:10.3963/j.iss n. 1671-7953.2018.01.002考虑空气卷入效应的甲板上浪数值模拟徐岑,唐文勇(上海交通大学a.海洋工程国家重点实验室;b.高新船舶与深海开发装备协同创新中心,上海200240)摘要:利用大型C F D商业软件S t a r C C M +,针对甲板上浪试验进行三维尺度下的数值模拟,考虑空气的 可压缩性,分析卷人空气泡对甲板上浪载荷的影响,结果表明,数值计算值和试验值符合较好,并且较二维尺 度下的数值模拟更加精确,卷人的空气泡会影响其附近的压力场,在空气泡的前进方向前后端分别形成低压 区和高压区。
可压缩空气的空气垫的效应会使上浪砰击载荷得到缓和,峰值压力减小,作用时间变长。
关键词:甲板上浪;S t a C C M O$数值模拟;卷人空气中图分类号:U661.4文献标志码:A甲板上浪属于强非线性问题,早期试验观察 了上浪的整个过程,并且记录了上浪过程中甲板 上水体的高度和上浪对上部结构的冲击载荷[12]。
近年有学者通过在Fluent软件平台上建立起具有 造波和消波功能的二维数值波浪水槽,实现了对 G l z试验的数值模拟,最终获得上浪过程的波 高、压力的模拟结果,但第一次上浪的水体高度时 历和压力时历结果偏差较大[3]。
同时,有学者通 过自主开发的naoe-FOAM-SJTU求解器进行二维 甲板上浪的数值模拟,最终结果和文献[3]中结 果相似[4]。
可见二维模拟不能完全反映G l z的试验,数值模拟结果与试验结果存在一定的偏差,模拟方法存在一定的局限性。
在入水砰击的相关研究中,有学者发现由于 物体快速进入水中,导致一部分空气未来得及逃 逸形成空气泡,可压缩空气泡对冲击载荷的缓冲 作用称为空气垫效应[5]。
通过数值方法研究空 气垫对砰击压力的影响,可以发现砰击压力的一 些特点,但相关研究中并未与不可压缩空气比较[6]。
冲击载荷作用下海洋平台的数值仿真研究
13 下落物体 的撞 击位置 .
收稿 日期 : 0 6 1— 6 2 0 —2 2
作者 简 介 : 国宝 (9 1) 男 , 士 生 。 周 18 一 , 硕
维普资讯
周 国宝 , 王 林
( 苏科技 大 学, 江 2 2 0 ) 江 镇 1 0 3
摘 要 : 用 非线 性 有 限 元技 术 , 讨 了 下 落 物 体 撞 击 海 洋 平 台的 数 值 仿 真 模 型 。研 究 了 采 探
不 同撞 击 速 度 与 位 置 对撞 击 力 、 击 损 伤 变形 及 能 量 吸 收 的影 响 。 数值 模 拟 采 管架平 台为建模 计 算依据 , 82导 采用 MS / ta C Dyrn软件 建立 了落物 撞击 的数 值仿
真 模型 , 对平 台结构 的撞 击损 伤和 能量吸 收进行 了分析 , 对结 构提 出了改进措施 。 并
l 落 物 撞 击 参 数 的选 取
撞击 造成 的后果是 由下 落物体 的质量 、 速度 、 击角度 、 撞 撞击 位置等决 定 的。
l所 示 。
图 中, A位 置表示撞 击 在 甲板 上 ; B位 置 表示 撞 击 在肋 骨 上 ;
C位 置表示撞 击在 梁与 肋 骨 的交 叉 处 ; D位 置 表示 撞 击 在 主粱 与
次梁 的交叉 处并且 下有 立柱 ; E位 置 表 示撞 击 在 主梁 与 主 梁 的交 叉处 。就垂 向碰撞 刚度 而言 , A 到 E越 来越 大 。 从
约为 2 2 0 . ×1 ~。T b etI e bt
对世界 上 10起 需 要修 理 的海洋 平 台损伤 原 因进行 了分 析 , 中 由于落物 0 其
规则波中船舶甲板上浪模型试验研究

n o n wa s a n a l y z e d b y u s i n g t h e me a s u r e d d a t a t h r o u g h p a r a me t e r v a ia r t i o n o f a s e ie r s o f f a c t o r s i n c l u d i n g i n c i d e n t
Ab s t r a c t : I n o r d e r t o s t u d y t h e c h a r a c t e is r t i c s a n d l a w o f g r e e n wa t e r i mp a c t p r e s s ur e o f s h i p,a wa t e r t a n k e x p e r i — me nt wa s c a r r i e d o ut f o r t h e I TY C i n t e r n a t i o n a l s t a n da r d c o n t a i ne r s h i p mo d e l S - 1 75 .I n t h e mo d e l t e s t .t h e s e l f - p r o ・ p u l s i o n s h i p mo d e l wa s u t i l i z e d. Th e wa v e e l e v a t i o n,s h i p mo t i o n s ,wa v e he i g ht o f re g e n wa t e r ,t he i mp a c t p r e s s u r e o n t h e de c k we r e s y nc h r o n o u s l y me a s u r e d d u in r g t h e mo d e l t e s t .Du in r g t h e e x pe ime r n t ,t h e re g e n wa t e r p h e no me —
一种用于SWATH湿甲板动响应分析的砰击载荷实用计算方法
一种用于SWATH湿甲板动响应分析的砰击载荷实用计算方法夏齐强;陈志坚【摘要】利用连接桥模型试验,通过对几种砰击载荷计算方法的比较,提出用抛物线型函数对砰击压力进行二元非线性回归,与试验值吻合较好,得到了一种用于SWATH湿甲板动响应分析的砰击载荷时历载荷形式.给出一条船的算例,分析了湿甲板砰击的特点,得到航速、有义波高、遭遇频率、湿甲板高度都是影响砰击发生及其量值的因素的结论,指出在分析湿甲板砰击强度时必须采用动响应分析法.【期刊名称】《武汉理工大学学报(交通科学与工程版)》【年(卷),期】2010(034)006【总页数】5页(P1172-1176)【关键词】SWATH湿甲板;砰击;动响应【作者】夏齐强;陈志坚【作者单位】海军工程大学船舶与海洋工程系,武汉,430033;海军工程大学船舶与海洋工程系,武汉,430033【正文语种】中文【中图分类】U661.4船舶在海上航行时,由于船波之间剧烈的相对运动,船体将频繁遭遇波浪砰击.历史上由于砰击直接或间接造成的海难[1]时有发生.因此,研究砰击载荷对于确定结构的设计载荷和保证结构的安全性具有十分重要的意义.湿甲板砰击是一个包含动边界、结构-空气-水三者耦合的典型平板砰击问题.Wagner[2]的冲量砰击理论给出了在砰击面上随时间和空间位置变化的砰击压力的计算公式,但对于平板冲击是不适用的,其原因在于对流场做了许多假设,忽略了物体与水面之间空气引起的气垫效应.Chuang[3]从模型试验研究出发,证实平底入水冲击时,会有空气捕捉形成气垫,从而影响到冲击压力的量值及其持续时间.本文利用SWATH 在规则波中迎浪航行时船波相对运动,考虑湿甲板运动与波浪的相位关系,计算了湿甲板砰击相对速度.1 湿甲板砰击相对速度计算及湿表面的预报1.1 湿甲板砰击相对速度计算SWATH湿甲板的砰击,是发生在湿甲板与海水波面之间.与平板和静水面砰击不同,湿甲板不是同时、全面进入触水状态,因而砰击压力不是分布在整个湿表面上,而是分布在与波浪接触的部位,与波浪接触的部位又随船的运动而变化.为了便于描述波浪和船舶运动,引入以下3个右手坐标系:空间固定坐标O-XYZ,坐标系的Z轴垂直向上,OXY平面与静水面重合,OX轴指向波浪的传播方向,OZ轴竖直向上,用来描述波浪运动.固连于船舶的坐标系oG-x b y b z b,其中ox b指向船艏,zG为船舶重心.随船匀速平动的坐标系o-xyz,原点o位于未受扰动时的船的重心上,oz轴竖直向上,xoy平面与静水面平行,ox轴的正向指向船的艏部.如图1所示.图1 描述船体纵摇运动坐标系设在固定坐标系O-XYZ中,记某瞬时的波面方程为ζ(x,y),波轴在静水面上.该波型方程可依据不同的波浪理论而选取相应的方程.对所选取的波浪在OXY面内进行旋转变换可得在随船匀速平动坐标系o-xyz中的波面方程ζ(x,y).考虑流场史密斯效应,设等效波面方程假设SWATH迎浪航行(湿甲板砰击主要发生在迎浪状态),这时船舶将发生升沉、纵摇及纵荡运动.忽略船体纵荡运动,则有船体运动方程为式中:ωe为遭遇频率为船的航行速度.于是在 x剖面处船与波浪的相对位移是砰击的发生,涉及船舶湿甲板与波浪在空间的相对位置.湿甲板相对于波面的位置为这时的垂向相对位移z r,应等于上式在平动坐标系o-xyz下对时间求导当式(4)中的值小于或等于零时,表示湿甲板触水.当式(6)中的值小于或等于零时,表示湿甲板与波面作接近运动,如式(5)值小于零,则发生砰击;当式(6)中的值大于零时,表示湿甲板与波面作分离运动,此时无论相对速度多大,也没有砰击.式(1)~(3)可根据耐波性试验数据建立.当升沉运动与纵摇运动耦合时,可按如下方法计算最大相对速度当即垂荡运动与波浪运动相位相差180°时,上式可化为此时若纵摇运动与前者合成运动相位相差180°时 ,则﹒z r 达到最大 ,即显然,当时 ,﹒z r max即为所求极大值中的最大值.1.2 砰击湿表面预报船体迎浪航行时升沉与纵摇运动往往伴随着发生.此时湿甲板最大砰击吃水式中:D z为湿甲板与水线之间的高度.利用上节中波型方程和砰击吃水,可求出砰击时波面与湿甲板接触长度,即湿表面长度.设入射波浪为余弦波形,则砰击湿表面尺度可写为b p=.平板冲击试验证明,如平板半宽为L pb,则压力达到最大值时间约为整个冲击压力脉冲持续时间为 T=.注意到b p即为上式中的2L pb,将其代入有T.式中:c air 为考虑气垫效应,在气垫中声速,.式中:ca为大气中声速;p a为大气压;p为砰击压力;γ为绝热比值.2 湿甲板砰击载荷计算方法砰击载荷是随时间变化的动态载荷,Chuang根据实验记录,得出砰击载荷的时间历程曲线近似具有如下形式.式中:T为砰击持续时间;p max为砰击压力峰值.砰击压力峰值与入水速度之间的关系,已有许多学者进行了大量试验研究和理论预报分析,总结出经验公式:pmax=kv2.一般的砰击是指船体艏部再入水引起的撞击压力[4],而船体再入水引起的撞击压力和船体坠落水面引起的撞击压力有很大的不同.SWATH湿甲板的砰击与后者较为接近.湿甲板与海水产生砰击,是典型的平板砰击现象,具有明显的气垫效应.SWATH 湿甲板总处于水线面以上,湿甲板和两侧支柱构成的“∏”形结构(见图2所示)与水面形成一个包围圈,该包围圈中的空气就是一个实实在在的气垫.当砰击发生时,在砰击压力的作用下气垫会受到压缩,这反映在系数k上,包含各种非线性因素对砰击压力影响.图2 湿甲板典型横剖面由于砰击问题的复杂性,至今尚未很好解决砰击时水动力估算问题.尽管不少学者通过试验分析和理论计算等方法做过大量的有意义的探索和研究,得到砰击载荷计算公式,但砰击压力峰值有较大差别.图3所示是几种砰击载荷计算方法[5-6]与文献[7]中试验值的比较.从图中可以看出,不管是试验值还是理论估算值,砰击压力峰值近似与速度的平方成正比;理论估算值较试验值大,偏于保守;而且随着速度的增大,误差也越来越大;Ochi 曾比较了不同试验条件下砰击压力峰值,发现船模静水落体试验砰击压力约为波浪中的2倍.可见,理论估算值比实际砰击压力要大得多.分析误差主要原因在于剖面系数k的不确定性,包括仿真过程对一些影响因素的简化及试验本身也具有一定的离散性,例如液面的稳定情况、入水瞬间结构与水的相对速度变化等等.图3 砰击载荷估算值与试验值的比较根据文献[7]中连接桥“∏”形结构模型系列试验结果,考虑到砰击压力峰值与速度关系曲线近似成二次抛物线型,故利用抛物线型函数对砰击压力峰值进行二元非线性回归.设回归基函数y=b0+b1 x+b2 x2,令 x1=x,x2=x2,则上式可变换为y=b0+b1 x 1+b2 x2,从而变换为线性回归,经计算可得:b0=0.502,b1=-0.154 4,b2=0.043 1.因此可得砰击压力峰值回归方程SWATH航速一般并不高,砰击时产生的船波相对速度大致在2 m/s到12 m/s之间,故利用上述砰击压力回归公式计算湿甲板砰击压力与比较接近实际情况.为了验证该砰击压力回归公式的可靠性,与文献[7]中模型试验进行了比较,如表1所列.同时利用概率预报方法[8]求出某型SWATH船在不同海况下反映概率特性的砰击压力统计极值,与该方法计算结果进行比较,见表2.表1 连接桥模型不同速度时试验值与计算值比较v/(m◦s-1) p e/MPa p c/MPap e-p c p e /%3.51 0.486 0.491 1.0 4.36 0.659 0.648 1.7 5.06 0.822 0.824 0.24 5.61 0.981 0.992 1.1 6.21 1.211 1.205 0.5从表1可见,通过抛物线型函数回归出来的砰击压力峰值计算公式与试验吻合较好,相对误差均小于5%,满足工程上允许接受误差.表2 两种方法计算结果比较海情统计预报法/MPa 本文方法/MPa 误差/%4级1.235 1.312 6.2 5级 2.121 2.232 5.2 6级 3.843 3.968 3.25从表2可看出,本文方法所得结果略大于概率预报法,这主要是由于本文载荷峰值考虑的是最极端工况,是一种理性估计法;而概率法反映的只是一种可能的极值压力,它可能并不覆盖整个极值区域.可见利用本文方法得到结果简单实用.于是将式(13)代入式(12),得到用于SWATH湿甲板动响应分析的砰击载荷3 计算实例为了研究湿甲板砰击现象特点,选择了某型SWATH进行了计算.该船曾在某海区进行了耐波性试验,试验结果见表3.表3 迎浪不规则波试验结果统计表谱心周期/s有义波高/m纵摇/(°)垂荡/m有义值根方值有义值根方值5.35 1.32 1.12 0.59 0.25 0.12 7.00 2.64 3.73 1.90 0.90 0.44 7.53 3.20 6.86 3.54 1.34 0.93 8.00 4.03 7.66 4.11 1.89 0.97表4所列为船迎浪航行时湿甲板不同砰击速度时的砰击载荷.计算结果表明,当海况较低时,由式(11)计算所得砰击最大吃水是负值,此时湿甲板将不会发生砰击.如有义波高为1.32 m,1.47 m时就不会发生砰击现象.这说明增大湿甲板距离水面的高度能够有效减少砰击的发生.从表中可以看出湿甲板前、后部区域受波浪砰击的概率比中部区域大.当有义波高小于2.71 m时,中部区域不会触水,但前部与后部会出现砰击现象.这种现象是由船体纵摇引起的.相同的海况下湿甲板前部和后部砰击载荷大于中部砰击载荷.当航速相同时,砰击压力并不总是随有义波高的增加而增大,还与遭遇频率有关.因此改变船的遭遇频率,即改变船的航线,也可以有效的避免严重的湿甲板砰击.表4 湿甲板砰击载荷计算结果部位航速V/(m◦s-1)遭遇频率ωe/(rad◦s-1)有义波高h1/3/m最大相对速度z max/(m◦s-1)砰击最大吃水TΔ/m砰击尺度b p/m砰击载荷p max/MPa湿甲板前、后部7.2 2.68 1.32 2.3 -1.575 2.68 1.47 6.2 -0.18 2.41 2.64 5.5 0.236 4.07 0.954 2.34 3.20 8.1 1.557 9.86 2.073 2.41 2.71 8.8 1.515 10.64 2.480 2.29 4.03 9.9 2.676 9.90 3.198湿甲板中部7.2 2.68 1.32 2.0 -1.79 2.41 2.64 4.3 -0.48 2.41 2.71 5.4 -0.265 2.34 3.20 5.1 0.24 4.36 0.836 2.29 4.03 7.3 1.205 7.58 1.672湿甲板砰击压力以时间历程表示.图4所示为湿甲板某工况下砰击载荷时间历程曲线.当有义波高为2.64 m时,砰击载荷峰值达到0.954,此时由式(13)计算可得砰击载荷作用时间为0.015 s.当船在该海况连续航行时,将会受到连续脉冲形式的砰击载荷.可见,虽然湿甲板砰击载荷作用时间较短,但峰值较大.尤其是在恶劣海况连续航行时,砰击将频繁发生,使局部结构易产生疲劳和破坏.在计算湿甲板砰击强度时应采用动态分析法.4 结论1)SWATH湿甲板砰击载荷是一个动态时历载荷,峰值相当大,易引起船体振动.在计算结构砰击强度时应采用动态分析计算方法.2)规则波迎浪航行时,SWATH湿甲板砰击速度的大小不仅与海况(有义波高)、航速有关,还与其遭遇频率有关.可以通过增大湿甲板的高度或改变船的航线有效减少砰击的发生.图4 砰击载荷时间历程曲线3)本文提出的SWATH湿甲板砰击载荷实用计算方法是一种理性估计法,适用于动响应分析,能够有效的预报出湿甲板砰击特点,方法简单可靠,具有较好的实用性.参考文献[1]Sames P C,Kapsenberg G K.Prediction of bow door loads in extreme wave conditions[C]//International Conference of Design and Operation for Abnormal Conditions II.Royal Institution of NavalArchitects,London,UK,2001.[2] 戴仰山,沈进威,宋竞正.船舶波浪载荷[M].北京:国防工业出版社,2007.[3]Chuang S L.Investigation of impact of rigid and elastic bodies with water[R].AD702727,1970.[4]倪僬,黄玉盈.平底物体撞水响应分析[J].华中科技大学学报,2001,29(4):99-101.[5]陈震,肖熙.平底结构砰击压力峰值分析[J].上海交通大学学报,2006,40(6):983-987.[6]Kamlesh S.Motions and slamming impact on catamaran[J].Journal of Ocean Engineering,2000(27):729-747.[7]曹正林.高速三体船砰击强度研究[D].武汉:武汉理工大学交通学院,2008.[8]张志民.船首底部砰击强度的可靠性分析[D].哈尔滨:哈尔滨工程大学船舶工程学院,2001.。
波浪对平板结构冲击作用数值模拟
波浪对平板结构冲击作用数值模拟金凤【摘要】为研究波浪冲击特性,应用FLUENT软件建立了规则波与平板结构相互作用的二维数学模型,模型中采用RANS方程和κ-ε湍流模型,以VOF方法处理自由表面.对3种典型工况下的冲击过程进行数值模拟,验证了模型的可靠性,并确定冲击压峰值的平均值作为波浪冲击特性指标.通过大量的数值计算,分别对波陡、平板离开水面距离和板宽等因素对波浪冲击作用的影响进行了分析讨论,并与试验结果进行比较.【期刊名称】《水运工程》【年(卷),期】2012(000)009【总页数】5页(P7-11)【关键词】fluent;规则波;透空式建筑物;波浪冲击【作者】金凤【作者单位】河海大学交通与海洋工程学院,江苏南京210098;江苏科技大学船舶与海洋工程学院,江苏镇江212003【正文语种】中文【中图分类】TU35在海岸和近海工程中,位于浪溅区的建筑物,如码头、人工岛、栈桥、海上平台等,其安全与波浪冲击作用关系很大。
由于波浪冲击面板过程的机理极其复杂,涉及到波浪的强非线性、瞬时效应、流体黏性、湍流、水气掺混等因素[1]。
现阶段的研究多采用半理论半经验的方法,即用基本假定建立数学模型,得出经验公式,再用模型试验确定经验系数,但已有成果对波浪冲击过程的认识还远远不够。
随着计算机和各种数值计算方法的发展,数值模拟逐渐成为研究波浪冲击问题的一种重要方法。
王永学[1]采用VOF法得到了非线性波浪对结构物底面的冲击压力分布特征,并讨论了结构物离开水面的距离等参数对波浪冲击压力的影响。
Baarholm 等[2-3]基于势流假定,采用非线性边界元方法研究了二阶Stokes波对固定水平板结构的冲击问题。
Iwanowski等[4]应用VOF方法建立二维模型FSWL-2D和三维模型FLOW-3D,将数值计算结果与Kaplan等人的结果进行了比较。
任冰等[5]应用改进的VOF方法建立了求解随机波浪冲击作用的数值模型,研究了随机波对开敞式结构物的冲击压力特性。
船舶航行性能的数值模拟与分析

船舶航行性能的数值模拟与分析船舶作为重要的水上交通工具,其航行性能的优劣直接关系到航行的安全、效率和经济性。
随着计算机技术的飞速发展,数值模拟已成为研究船舶航行性能的重要手段。
通过数值模拟,可以在船舶设计阶段就对其航行性能进行预测和优化,从而减少试验次数、缩短研发周期、降低成本。
数值模拟的基本原理是基于流体力学和船舶动力学的相关理论,将船舶和周围的水流视为一个连续的流体场,通过求解一系列的控制方程来获得船舶周围流场的压力、速度等参数,进而计算船舶的航行性能。
在船舶航行性能的研究中,常用的数值模拟方法包括有限元法、有限体积法和边界元法等。
船舶航行性能主要包括阻力性能、推进性能、操纵性能和耐波性能等方面。
阻力性能是船舶航行性能中的一个关键指标,它直接影响船舶的动力需求和燃油消耗。
通过数值模拟,可以对船舶在不同速度、吃水和姿态下的阻力进行计算,并分析船体形状、附体布置等因素对阻力的影响。
例如,优化船体的首部形状可以减少兴波阻力,而合理设计船底的粗糙度可以降低摩擦阻力。
推进性能是衡量船舶动力系统效率的重要指标。
数值模拟可以用于研究螺旋桨的水动力性能,包括推力、扭矩和效率等。
通过模拟螺旋桨在不同转速和进流条件下的工作情况,可以优化螺旋桨的叶片形状和布置,以提高推进效率。
同时,还可以考虑螺旋桨与船体之间的相互干扰,从而更准确地评估推进系统的性能。
操纵性能是船舶在航行中改变航向和速度的能力。
数值模拟可以模拟船舶在不同舵角和螺旋桨转速下的运动响应,计算船舶的回转半径、转向时间等操纵性指标。
对于多桨多舵的船舶,还可以研究不同桨舵组合对操纵性能的影响。
此外,还可以通过模拟船舶在风浪中的操纵情况,评估船舶在恶劣海况下的操纵安全性。
耐波性能是船舶在波浪中航行时的性能表现,包括船舶的运动响应、砰击和上浪等。
数值模拟可以模拟船舶在规则波和不规则波中的运动,分析船舶的纵摇、横摇和垂荡等运动特性。
通过优化船舶的型线和结构,可以减少船舶在波浪中的运动幅度,提高船舶的舒适性和安全性。
船舶在长峰不规则波中顶浪纵向运动的数值模拟

船舶在长峰不规则波中顶浪纵向运动的数值模拟船舶在海洋中遭遇不规则波浪时,会受到很大的冲击和力量。
波浪的面积和高度都会影响船体的运动,特别是顶浪现象会造成船体纵向运动的变化。
在长峰不规则波中顶浪的数值模拟可以帮助我们更好地理解船舶运动的特点和规律。
本文将介绍一种常用的数值模拟方法:计算流体力学(CFD)分析,在长峰不规则波中的应用。
计算流体力学(CFD)是一种数值分析方法,用于研究流体或气体的运动,可以在计算机上模拟物理问题。
在研究船舶在长峰不规则波中顶浪纵向运动的数值模拟中,CFD是一种主要的方法。
CFD分析可以帮助我们了解船舶在长峰不规则波中运动的特点和规律,以及顶浪对船体纵向运动的影响程度。
在进行这种数值模拟时,我们需要先建立一个数学模型,并在计算机上模拟长峰不规则波对船体的影响。
该模型需要考虑几何尺寸、流体(海水)的物理特性、波浪幅度、周期和方向等因素。
该模型还需要考虑船体的几何形状、质量分布、流体的黏性等因素。
在CFD分析的过程中,我们可以采用多重网格(Multigrid)技术来优化计算速度和准确度。
这种技术可以将计算区域划分成多个格子,从而加速计算速度,并提高模拟的精度。
模拟结果显示,在长峰不规则波中,船舶的纵向运动受到了顶浪的影响。
当船舶遭遇大波浪时,船体会上下颠簸,并产生很大的浪花和气泡。
当波浪面和船体表面产生接触时,会产生压力和冲击力,从而影响船体的纵向运动。
然而,这种数值模拟方法还有一些局限性。
例如,不同的数学模型可能会得到不同的结果,不同的数值方法可能会对结果产生影响。
此外,在进行数值模拟时,我们还需要考虑一些假设和约束条件,如海水的温度、盐度、湍流等因素,这些因素都可能会影响模拟结果的准确性。
因此,在进行这种数值模拟时,我们需要综合考虑多个因素,并和实际情况进行比较验证,以确保模拟结果的准确性和可靠性。
总之,长峰不规则波中顶浪纵向运动的数值模拟对于研究船舶的运动特点和规律具有重要的意义。
船舶在波浪中的运动-ch1_引论

9
§1.1
概述
——波浪中的运动
垂荡是海洋结构物重要的运动响应
常规船舶 张力腿平台 半潜式平台
固有垂荡周期 回复力 主要激励机制 重要阻尼
4-16 s 水线面面积 线性波浪力 波辐射
2-4 s 系链弹性
>20 s 水线面面积 涌(长波) 粘性效应
15
§1.1
概述
——结构物的水动力分类
Sea Loads wind wave current
inertia forces
水动力载荷: —线性与非线性波浪力 —流载荷与涡激力 —水动力干扰
质量力、粘性阻尼和绕射力的相对重要性
Theory of Ship Motions in Waves
16
§1.2 船舶运动预报解决方案概述
评估等模块,成为业界认可和广泛使用的商用专业软件,具有不同水深环境下 的固定浮体、系泊浮体和自由浮体水动力载荷及其动力响应分析的一般功能, 以及海洋工程生产系统集成设计、管理与效益和风险评估的基本功能。
主要模块及功能:
①Strength assessment of fixed structures.
MODULES: Geni E
②Strength assessment of floating structures.
MODULES:GeniE、DEEP C、 Hydro D
③Strength assessment of FPSO.
MODULES: Geni E、Hydro D、 DEEP C
④Structure integrity management & maintenance.
基于CFD的船舶顶浪遭遇畸形波数值模拟
基于CFD的船舶顶浪遭遇畸形波数值模拟石博文;刘正江;张本辉【摘要】The freak wave is a menace to navigation, and has caused quite a few accidents.The numerical simulation of ship encountering with freak waves by means of CFD is of practical value.The phase modulation with navigation speed is proposed to improve conventional simulation method.The DTMB5512 ship model is chosen as the object of the numerical simulation.The simulation result indicates that the negative effects produced by freak waves are rather significant.The maximum value of nonlinear sea-keeping responses (including pitch, heave, acceleration of heave, pressure and instantaneous added resistance) are 1.5 times severer than those in normal rough sea environment.%针对畸形波对船舶航行极具威胁,已引发多起海上事故的情况,对舰船遭遇畸形波进行数值模拟研究.采用考虑航速改进的相位调制方法,以DTMB5512船模为目标船,在顶浪航行状态下实现舰船定时、定点遭遇畸形波的数值模拟.研究证实畸形波对舰船的不利影响明显大于一般大风浪航行,在畸形波情况下获取的非线性运动响应(包括纵摇、垂荡、垂荡加速度、压强和瞬时增阻)最大值是一般大风浪情况下的1.5倍以上.【期刊名称】《中国航海》【年(卷),期】2016(039)003【总页数】5页(P59-62,113)【关键词】船舶;计算流体动力学(CFD);畸形波;顶浪;数值模拟【作者】石博文;刘正江;张本辉【作者单位】大连海事大学航海学院, 辽宁大连 116026;大连海事大学航海学院, 辽宁大连 116026;海军大连舰艇学院航海系, 辽宁大连 116018【正文语种】中文【中图分类】U661.3Abstract: The freak wave is a menace to navigation, and has caused quite a few accidents. The numerical simulation of ship encountering with freak waves by means of CFD is of practical value. The phase modulation with navigation speed is proposed to improve conventional simulation method. The DTMB5512 ship model is chosen as the object of the numerical simulation. The simulation result indicates that the negative effects produced by freak waves are rather significant. The maximum value of nonlinear sea-keeping responses (including pitch, heave, acceleration of heave, pressure and instantaneous added resistance) are 1.5 times severer than those in normal rough sea environment.Key words: ship; CFD; freak wave; head sea; numerical simulation畸形波是海洋中高且陡的大波,持续时间很短,但出现的偶然性和巨大的破坏性对船舶航行和海洋工程结构物等极具威胁,已引发多起海上事故。
- 1、下载文档前请自行甄别文档内容的完整性,平台不提供额外的编辑、内容补充、找答案等附加服务。
- 2、"仅部分预览"的文档,不可在线预览部分如存在完整性等问题,可反馈申请退款(可完整预览的文档不适用该条件!)。
- 3、如文档侵犯您的权益,请联系客服反馈,我们会尽快为您处理(人工客服工作时间:9:00-18:30)。
Numerical Simulations for Green Water Running on Deck and Impact Loads1Lin Zhaowei, Zhu Renchuan, Miao GuopingSchool of Naval Architecture, Ocean and Civil Engineering, Shanghai Jiao Tong University Shanghai, P.R.China (200030)E-mail:gpmiao@Abstract A technique of dynamic mesh is specially introduced in a 2-D numerical wave tank to simulate the green water incident on a fixed FPSO model in head waves and oscillating vessels in beam sea conditions, respectively. Numerical results agree well with the corresponding experimental ones. It indicates the present numerical scheme and method can be used to actually simulate the phenomenon of green water on deck, and to predict and analyze the impact forces on floating structures due to green water. It is of great significance to further guide the ship design and optimization, especially for ship bow and its strength design. The mechanism may also help seaman to impose operation restrictions to avoid severe green water incidents. Keywords: Green water, numerical wave tank, dynamic mesh.1 IntroductionGreen water is one of the strongly nonlinear ship-wave interaction problems, usually occurring in harsh sea environments when an incoming wave significantly exceeds the freeboard and water runs onto the deck. Damage of deck equipments and superstructures, and deck cargo shifting will probably be caused by the huge impact forces due to the severe green water incidents. Ship capsizing may even happen due to green water on deck for high speed vessels. For running ships, green water incidents may be avoided by taking some operation measures, such as reducing the advancing speed or altering the course. For the ocean structures, such as FPSO (Floating Production, Storage and Offloading Unit), moored in a specified sea area, however, no operation measure could be adopted to reduce the possible green water on deck, and risks resulted from green water will be even severer than other vessels. Recently, some cases of bow damage and superstructures destroy of FPSO caused by server green water incidents were reported (Mac Gregor, 1999). The green water problem is arousing more attentions for research. In the past, the research of green water problem was mainly relied on the experimental means. Some limited progresses were also achieved recently with the development of numerical techniques and methods. Traditionally, probability method, combined with hydrodynamic theory, was adopted to estimate and analyze the green water related problems. The method cannot predict the amount of water and the hydrodynamic load on decks when water runs onto deck but gives only the probability of deck wetness and the pressure distribution on the deck, based on the assumption that the pressure on the deck corresponds to the static water pressure of shipped water. Subsequently, some other theories and methods based on the potential theories were developed to tackle the problem to some extends. For example, the dam breaking theory and wave overtopping theory were used to simulate the deck flow (Buchner, 1995;Greco et al, 2000), the flooded water theory and shallow water wave theory were applied to simulate the water running on deck (Mizoguchi,1989; Huang,1995; Ogawa et al,1998). Mixed Euler-Lagrange method was also adopted for parametric research for green water incident (Buchner & Cozinijn,1997;Faltinsen et al,2002). The1Support by the Specialized Research Fund for the Doctoral Program of Higher Education (Grant No.20030248014)-1- strongly nonlinear phenomena, such as water jet, wave breaking, flipping and wrapping, cannot be accurately simulated in detail by the method. With the improving of the capability of high performance computer, various numerical models such as MAC,VOF,LEVEL-SET,SPH,CIP were developed and introduced to solve the problems involving free surface (Hirtand Nichols, 1981;Osher.et.al, 1988;Gingold, Monaghan, 1977;Yabe et al, 2001). Generally, those methods can provide velocity and pressure distribution of the fluid field, capture free surface deforming after a great deal of calculation. Nielsen and Mayer (2004) carried out some numerical investigation on the green water problem by using VOF method. Good results were obtained for the case of fixed FPSO in head waves, but they did not get satisfactory results for green water on a moving vessel in incident waves. It is still a difficult task to acutely simulate the green water on deck and the impact force on the deck structures. In the present paper, a 2-D numerical wave tank is used to simulate the phenomenon of wave-ship interaction and green water on deck, in which, continuity equation and Navier-Stokes equation are regarded as governing equations for modeling the fluid filed, the source technique is adopted to realize the incident wave generation and the absorption for reflected and transmitted waves, and the VOF method is used to capture the free surface deformation. Numerical simulations execute for green water incident of a fixed FPSO model in head waves and oscillating vessels in beam sea conditions, respectively. Ship oscillating motions are calculated by the potential theory. A technique of dynamic mesh is specially introduced in the numerical simulation to realize the green water occurring for an oscillating ship. Numerical results agree well with the corresponding experimental ones. It indicates the present numerical scheme and method can be used to actually simulate the phenomenon of green water on deck, and to predict and analyze the impact forces on floating structures due to green water. It is of great significance to further guide the ship design and optimization, especially for ship bow and its strength design. The mechanism may also help seaman to impose operation restrictions to avoid severe green water incidents.2. Governing equations and numerical wave tankNumerical simulations for green water phenomenon are executed in a 2-D numerical wave tank with the functions of incident wave making and the effective reflected and transmitted wave adsorption, which is similar to a 2-D physical wave tank. As shown in Fig.2 and Fig. 9, the numerical wave tank is divided into four zones: the wave making zone, the absorption zones for reflected waves and transmitted wave and the working zone, EF denotes the still water surface to divide the air region (upper side) and the water region (lower side). Supposing a right-handed Cartesian coordinate system o-xy is defined with the origin on the undisturbed free surface and oy axis pointing vertically upward, the continuity equation and Navier-Stokes equations can be written as∂ρ ∂ ( ρ u ) ∂ ( ρ v) + + =0 ∂t ∂x ∂y⎛ ∂ 2 u ∂ 2 u ⎞ ∂p ∂( ρ u) ∂( ρ u) ∂( ρ u) +u +v = µ⎜ 2 + 2 ⎟− + Sx ∂t ∂x ∂y ∂y ⎠ ∂x ⎝ ∂x⎛ ∂ v ∂ v ⎞ ∂p ∂( ρ v) ∂ ( ρ v) ∂ ( ρ v) +u +v = µ⎜ 2 + 2 ⎟− − ρ g + Sy ∂t ∂x ∂y ∂y ⎠ ∂y ⎝ ∂x2 2(1) (2) (3)where u and v denote the velocity components of the fluid particles in the x and y direction, ρ denotes the fluid density, µ the dynamic viscosity and g the gravitational acceleration. The additional momentum source terms Sx and Sy in the x and y direction are specially introduced to realize the incident wave generation and the absorption for reflected and transmitted waves (Milgram,1970; Gilbert,1978). -2- The VOF method is adopted to capture the free surface deformation, the equations can be written as:∂aq ∂t +2∂ (uaq ) ∂xq+∂ (vaq ) ∂y=0, q = 1, 2(4)(5) where aq is the volume fraction, denoting the ratio of volume of the q-th phase fluid occupying in a cell. Here q=0 and 1 denote the air phase and the water phase, respectively.∑aq =1=13. Green water of FPSO in head wavesA 2-D investigation of green water incidents on a space fixed FPSO vessel was performed by Greco (Greco, 2001) both experimentally and numerically. The experimental results are used for the further validation of the efficiency of the present method and computations. The FPSO model and wave tank dimensions are shown in Fig.1 and Fig.2, respectively. In the experiments of Greco (2001), the FPSO model is simplified as a rectangular structure with its length and height being 1.5m and 0.248m, respectively, and a small circle of radius of 0.08 m at the bow corner. As same as the physical wave tank for the experiments, the length of numerical wave tank in the present computation is also taken as 13.5m. The lengths of the wave-making zone, the reflected wave absorption zone, the working zone and the transmitted wave absorption zone are taken as 2m, 2m, 7.5m and 2m, respectively. The water depth for both the physical and numerical wave tank is 1.035m and FPSO model, with the draft of 0.198m and the freeboard of 0.05m, is set at the center of working zone.WL1 WL2 WL3 0.075m MWL 0.15m 0.2275m r=0.08m PR1 0.062mFPSOFig.1 FPSO model3.1 Mesh generationThe mesh for the numerical model is generated basically on the following considerations. To avoid dissipation for wave propagation, the number of grids in the horizontal direction should keep large enough. In the present computation, the grid size ∆x is kept about 1% of the incident wave length in the wave-making zone, the reflected wave absorption zone and the working zone. For the aim to have an effective wave adsorption, the size of the grid in the transmitted wave absorption zone increases gradually larger with a ratio of 1.2 from the rightmost boundary of the working zone. In the vertical direction,∆y is taken about 5% of the wave height near the free surface region in order to reconstruct the free surface accurately, and increases larger gradually outside the region. Additionally, more refined grids are used near the bow of the FPSO to describe accurately the nonlinear phenomena due to the wave and body interaction.-3-A Stillwaterlevel E Wave making zone Reflected wave absorption zone FPSO F L=1.5m Working zone H=1.035m D 2m m 2 7.5m 2m D=0.19 8 Transmitted wave absorption zone CBFig.2 The numerical wave tank and its function zones3.2 Wave making and absorptionWave making and absorption are realized by using the technique of Wang and Liu (2005) in the present numerical simulation. Suppose the flow velocity and pressure in the fluid field after the wave making and absorption being:(6) in which the subscripts C and I denote the values for the calculated physical variables and the incoming waves, λ=λ(x) is a smooth weighting function varying with the space position. The momentum source terms Sx and Sy may be deduced by substituting Eq. (6) to Eqs. (2) and (3), neglecting the viscosity terms and taking a linear difference discretization for the transient terms. The detailed deduction and expressions can be found in Wang and Liu (Wang and Liu, 2005) , In the present numerical scheme, the smooth weighting function is a sine function varying from 0 to 1, i.e.⎧u M = λuC + (1 − λ )u I ⎪ ⎨vM = λvC + (1 − λ )vI ⎪ p = λp + (1 − λ ) p C I ⎩ Mλ ( x) = sin(x − x1 π ) x 2 − x1 2 ,(7)in which x1 , x2 are the horizontal coordinates of the ends of the wave making or absorption zone. Suppose the horizontal coordinates being positive to the right direction in Fig.2, the velocities, pressure and the smooth weighting functions for different zones may be expressed as follows, i.e. In the wave making zone:λ u M = λu I , v M = λv I , p M = λp I ,and λ xmin = 0, xmax = 1In the reflected wave adsorption zone, the velocities can be expressed as Eq.(6) with(8)λ x =0min,λx=1max(9)And in the transmitted wave adsorption zone: (10) It is easy to understand from the above discussions that the required waves in the fluid field can be generated with the corresponding flow velocities. In the case of the generation of the incident waveu M = λuC , v M = λvC , p M = λpC ,and λ xmin = 1 λ xmax = 0ζ = ζ a cos(kx − ωt ) , its velocity components can be written as⎧u = ζ aω cos(kx − ωt ) ⎨ ⎩v = ζ aω sin(kx − ωt )(11)3.3 Solution of the problem-4- As shown in Fig. 2, the rigid wall condition is imposed on the FPSO body surface and the left side AB, the right side CD and the bottom BD of the tank. On the upper side AC, the atmospheric pressure is used as a pressure boundary condition. At the initial stage, the tank is calm (i.e. u=0 and v=0) with an initial hydrostatic pressure distribution. Laminar flow assumption is adopted in the numerical simulation of the whole fluid domain. The first order implicit difference scheme is used for the discretization of the transient terms and the upper wind difference scheme for the discretization of the convection and diffusion terms in the momentum equations. SIMPLE scheme is adopted to solve the pressure and velocity iteratively. The present computational programs are interpreted and executes on the software platform of FLUENT by the way of User Define Function (UDF).3.4 Numerical simulation and analysisIn the present computations, the wave length λ and wave height H are taken as 2m and 0.16m, respectively, and the advancing time step is 0.001 times of the wave period.0.150.1Elevation height (m)0.050-0.05-0.1 12 14 16 18 20Time(s)Fig. 3 Time history of the wave profile at the location of 3m before the FPSO bowFig.3 shows the time history of the wave profile at the location of 3m before FPSO bow in the time interval from 12s to 20s. Although in that time interval the waves reflected by the bow already reach the wave making zone, a quite stable incident wave train can still generated from the wave making zone. It indicates that the present numerical scheme is effective for long time simulation due to the application of the reflected wave absorption technique. In the numerical simulation of green water occurrence, both the wave heights on deck and impact pressure on the deck structures are obtained. Figs.4-6 show the time histories of the wave height at the three probes WL1, WL2 and WL3, located respectively at the front end of the bow, 0.075m and 0.15 m from the bow end. The time histories of wave height at the three probes are also compared with the experimentally measured results shown as dotted curves in the figures. Well agreement between the numerical results and the experimental ones can be observed in the figures. At the early stage of green water occurrence when the first incident wave peak reaches the ship bow, the wave height in front of the bow is drove up due to the wave reflection. Thus wave height, when the next wave peak coming, becomes even higher in front of the bow, causing much severer green water on deck. As observed in Figs. 4-6, the wave height at the second time of green water is much larger than that at the first time. The results shown in Figs. 4-6 are obtained for the case of a space fixed FPSO without superstructures on the bow deck. In order to get insight into the mechanism of the impact of the green water flow acting on the ship bow structures, the case of a space fixed FPSO with a vertical structure mounted on the bow deck were also conducted. The structure is mounted on the fore part of the deck, 0.2275 m from the bow (refer to Fig. 1), and-5-0.15 is high enough to protect the wave overtopping from the top. The impact pressure at the location of 12 mm high from the deck on the structure, corresponding to the location of pressure gauge on the structure in the experiments, was calculated. The time histories of the impact pressure in one wave period from both the calculation and the experiment are depicted in Fig.7 with solid and dotted curves, respectively. Two significant peaks are observed in the figure. The first peak is the result of the initial impact, and the second appears when the water front begins to run down from the wall, after having reached its maximum height. Both the results are in good agreement. Since the flow on deck and the pressure on structures are very sensitive to and strongly affected by the initial fluid flow, as indicated by Greco (2001), no exactly the same results can be obtained from the repeating of experiments and computations.-------Experiments Computations0.15Elevation height (m)0.10.050 6.5 7 7.5 Time(s) 8 8.5 9Fig.4 Time history of waves at probe WL1 located at the front end of the bow0.15------ Experiments ComputationsElevation height (m)0.10.050 6.5 7 7.5 8 8.5 9Time(s) Fig.5 Time history of waves at probe WL2 located at 0.075 from the bow end0.15Elevation height (m)------Experiments Computations0.10.050 6.5 7 7.5 8 8.5 9Time(s) Fig.6 Time history of wave at probe WL3 located at 0.15 from the bow end-6-1.2-------Experiments ComputationsPressure (k Pa)0.80.40.0 -0.50.00.51.0Time(s) Fig.7 Time history of impact pressure at probe PR1 on the mounted structure4. Green water on ships oscillating in beam wavesOscillating motions of floating bodies under the excitation of the incident waves will certainly give influence on the green water on deck and vice versa. Hence, it is necessary to count for the influence of floating body motions in the numerical simulations of green water. Numerical simulations for the case of an oscillating sectional ship model with shipping water running into its cabin were carried and the results were compared with the corresponding experimental results (Zhu and Saito, 2003).B c l f D TFig. 8 Middle sectional model of Ship 499G/T without hatchcoverFig.8 shows the middle sectional model of Ship 499G/T without hatchcover, the beam and depth of the model are 0.436m and 0.25m respectively. The hatch coaming height c is 0.032m, and the distance l between the sides of cabin and ship is 0.033m. The draught of the model is 0.19m. The physical experiments of water shipping into cabin were carried out in the 2-D tank of Hiroshima University with the water depth of 0.7m.4.1 Numerical model of ship motion and dynamic mesh techniqueTo match the experimental conditions as much as possibly, the dimensions of each functional zones and the mesh size are slightly different from those mentioned in the former section. The definition of the boundary conditions and the method to generate the meshes in the zones for wave making, reflected wave and transmitted wave adsorption are primarily the same as we have done for the numerical simulation for green water on the FPSO. A technique of moving mesh is specially introduced in the numerical simulation to realize the green water occurring for an oscillating ship. -7-Ship section Wave making zone Reflected wave absorption zoneWorking zone (Stationary grid zone)(dynamic grid zone2)1.6m1.6m11.6m2.0 m3.2 mFig.9 Tank model and zones for simulation of oscillating ship with green water occurringBesides the considerations for the mesh generation in the former section, a reasonable dynamic mesh model is setup in the working zone to simulate the ship oscillation motions. As shown in Fig. 9, a rectangular dynamic mesh domain is defined and the others are kept as static mesh domains. In the dynamic mesh domain, a circular sub-region around the body is defined as a rigid mesh region, in which the meshes are fixed to the body, moving with the body in the oscillating modes of both translation and rotation. And in the remaining sub-region of the dynamic mesh domain, the meshes move only in translational modes. The boundaries between those two sub-regions are superposed. Refined meshes are used around the moving body and in the vicinity of the region boundary to avoid numerical errors to the most extent. The advantage of such a mesh scheme is that the computational precision and efficiency are been greatly improved since different modes of motion of the body can be effectively simulated by utilizing relative motion of the meshes, and meanwhile the complex deformations of meshes around the body are avoided.4.2 Numerical simulation for green water occurrence on an oscillating shipTable 1 Motion response of the ship sectional model (wave period T=1s)Mode Sway Roll HeaveMotion ya/ζ za/ζAmplitude 0.47 0.42 0.90Phase difference -79° 101° -90°φa/kζIn the numerical simulation for green water occurrence on an oscillating ship, the ship motions, including both the motion amplitudes and phase differences, are obtained in advance by the potential flow theory and the results are validated by experiments. Those results are used to generate the body motions in the numerical fluid field. Table 1 shows the motion responses of the sectional model of a hatch coverless ship excited by a regular wave train with period of 1 second. To save the computational time, the wave information is monitored at the position before the model to obtain the exact wave phase when the activated based on the phase difference between wave and the model motions. As shown in Fig. 10, similar phenomenon can be observed from the snap shots of green water on the oscillating model in waves for both numerical simulation and experiments.-8-H=0.7m(dynamic grid zone1)Transmitted wave absorption zone(a) Visualization of computed free surface(b) Visualization of experimental free surfaceFig. 10 Snap shots of green water on a ship oscillating in waves both in numerical simulation and experiments◆Experiments600——ComputationsVolume (ml)450 300 150 0 0.0450.050.0550.060.065Wave steepness Fig.11 Comparison of shipped water volume for a ship oscillating in waves with the same period (T=1s) and various wave heightsThe shipped water volume can be obtained by integrating the water phase in the cabin. A comparison of shipped water volume for both numerical computation and experiment is made for the ship oscillating in waves with the same period (T=1s) and various wave heights. From the results shown in Fig.11, by the present computational method, not only the process of the green water shipping onto deck can be effectively simulated but also a quite alike shipped water amount with the experiments can be obtained.5. ConclusionsBy specially introducing the technique of dynamic mesh, numerical simulations have been carried out successfully for the phenomenon of green water occurrence on a fixed FPSO model in head waves and an oscillating vessel in beam seas. Numerical results agree well with the corresponding experimental ones. It indicates the present numerical scheme and method can be used to actually simulate the phenomenon of green water on deck, and to predict and analyze the impact forces on floating structures due to green water. It is of great significance to further guide the ship design and optimization, especially for ship bow and its strength design. The mechanism may also help seaman to impose operation restrictions to avoid severe green water incidents. -9- Present research mainly focuses on a 2-D dimensional problem of green water occurrence on oscillating vessel. The method can be extended to 3-D problems. And it also contributes for the further researches on strongly nonlinear problems of interaction of large amplitude wave and bodies.AcknowledgementThe present research is jointly supported by the Excellent Young Teachers Program of MOE , the Specialized Research Fund for the Doctoral Program of Higher Education (Grant No.20030248014) and the National Natural Science Foundation of China (NSFC) (Grant No. 50379026 and 50579034) All helps are greatly acknowledged by the authors.ReferenceBuchner B. (1995), “The impact of green water on FPSO design”, OTC’95, pp 76-98, Houston. Buchner B and Cozijin J L. (1997), “An investigation into the numerical simulation of green water”, Proc BOSS’97, Oxford,Vol 2 ,pp 113-125 Faltinsen O M, Greco M, Landrini M. (2002), “Green water loading on FPSO”, J of Offshore Mech and Artic Eng, Vol 124, pp 94-103 Fluent 6.0 UDF Manual, Fluent Inc. (2001-11-29) Gilbert G. (1978), “Absorbing Wave Generators”, Hydraulic Research Station Notes. Hydraulic Research Station, Wallingford, Oxford, UK, pp 3-4 Greco M, Faltinsen O M and Landrini M. (2000), “Basic studies of water on deck”, 23rd Symp on Naval Hydrodyn, France. Greco M, Faltinsen O M and Landrini M. (2001), “Green water loading on a deck structure”, Proc 16th Int workshop on Water Waves and Floating Bodies, Hirt, C.W., Nichols, B.D. (1981), “Volume of fluid (VOF) method for the dynamics of free boundaries”, put. Phys,Vol 39, pp 201–225. Huang Z L. (1995), “Nonlinear shallow water flow on deck and its effect on ship motion”, PhD thesis, Technical Univ of Nova Scotia, Halifax. Mac Gregor J R, Black, F, Wright D, (1999), “Design and construction of FPSO vessel for the Schiehallion field”, Trans RINA,.London, pp 270 - 304. Milgram J H. (1970), “Active Water-wave Absorbers”, J. Fluid Mechanics, Vol 43, No 4, pp 845-859 Monaghan J J. (1992), “Smoothed particle hydrodynamics”, Annu Rev Astron Astrophys., Vol 30, pp 543-574 Nielsen KB, Stefan M. (2004), “Numerical prediction of green water incidents”, Ocean Engineering, Vol 31, No (3 - 4), pp 363 - 399. Ochi M K. (1964), “Extreme behavior of a ship in rough seas-slamming and shipping of green water”, Annual meeting of SNAME, New York, pp 143-202 Ogawa, Y., Taguchi, H., Ishida, S. (1998), “A prediction method for the shipping water heights and its load on deck”, In: Practical Design of Ships and Mobile Units (PRADS), pp 535–543. Osher S and Sethian J A. (1988), “Fronts propagating with curvature-dependent speed: Algorithms based on Hamilton-Jacobi formulation”, J Comp Phys, Vol 79, No 1, pp 12-20 Wang B L,Liu H. (2005),“Higher Order Boussinesq-Type Equations for Water Waves on Uneven Bottom”, Applied Mathematics and Mechanics,Vol 26, No 6, pp 714—722. Yabe T, Xiao F and Utsumi T. (2001), “The constrained interpolation profile method for multiphase analysis”, J Comp Phys, Vol 69,pp 556-593 Zhu R.C. and Saito K.(2003), “Study on the Shipping Water into an Open-Top Container”, Journal of Shanghai Jiaotong University, Vol 37, No 8, pp 1164 - 1171.-10-。