中国前列腺癌的发病情况
前列腺癌的治疗

前列腺癌的治疗1 前列腺癌的流行病学和自然病史发病美国第1位,死亡率仅次于肺癌。
欧美占第2位常见男性恶性肿瘤。
随寿命延长发病率升高,亚洲和北非发病率最低,前列腺腺癌通常生长缓慢,恶性转化率高但平均倍增时间和转移比较慢,非典型腺瘤样增生AAH可能是移行带癌前期病变,前列腺上皮内瘤PIN是外周带的癌前期病变,潜伏癌与临床进行性癌有巨大区别。
1.1发病情况前列腺癌患者主要是老年男性,新诊断患者中位年龄为72岁,高峰年龄为75~79岁。
在美国,大于70%的前列腺癌患者年龄都超过65岁,50岁以下男性很少见,但是大于50岁,发病率和死亡率就会呈指数增长。
年龄小于39岁的个体,患前列腺癌的可能性为0.005%,40~59岁年龄段增至2.2%(1/45),60~79岁年龄段增至13.7%(1/7)。
1.2危险因素尚未明确,但是其中一些已经被确认。
最重要的因素之一是遗传。
如果一个直系亲属(兄弟或父亲)患有前列腺癌,其本人患前列腺癌的危险性会增加1倍。
两个或两个以上直系亲属患前列腺癌,相对危险性会增至5~11倍。
流行病学研究发现有前列腺癌阳性家族史的患者比那些无家族史患者的确诊年龄大约早6~7年。
前列腺癌患病人群中一部分亚人群(大约9%)为”真实遗传性前列腺癌”,指的是3个或3个以上亲属患病或至少2个为早期发病(55岁以前)。
1.3绝对危险因素年龄、种族、遗传因素。
1.4相对危险因素①食物脂肪:性激素、性活动、输精管结扎术;②镉:身体质量指数(BMI):职业和经济收入;③肝硬变和病毒感染,维生素A、D、E;④性激素:前列腺是雄激素依赖性器宫,受到血清睾酮的控制。
睾酮是维持正常前列腺上皮生长的基本物质,而且前列腺癌早期也是雄激素依赖的。
虽然性激素在正常和前列腺癌中的重要生理作用很清楚,但是,其与前列腺危险性的相关性仍不清楚;⑤性活动:前列腺癌患者的性活动高于对照组,青春期开始比较早,初次性交经历较晚。
离婚和丧偶者的前列腺癌死亡率高于有配偶者。
前列腺癌的症状

百度文库【前列腺癌的症状】综合概述前列腺癌是世界上许多国家,尤其欧美地区男性常见的恶性肿瘤。
如在美国,前列腺癌居男性恶性肿瘤发病率首位和病死率的第2位(仅次于肺癌,1996)。
目前,北欧前列腺癌的发病率已经超过了美国,成为威胁男性健康的第1位肿瘤。
据美国癌症协会估计,2004年美国约有230 110例新发前列腺癌患者,其中29 900人死于前列腺癌。
国际癌症研究署(IARC)的资料显示,2002年中国前列腺癌的发病率是1.6/10万,病死率是1.0/10万,仍然是前列腺癌的低危国家。
当然全国各地前列腺癌发病率的差异非常显著,1993—1997年江苏启动的标化发病率为1.09/10万,而台湾味11.89/10万。
近30年来,上海地区男性前列腺癌的发病率明显升高,从1973—1975年的1.6/10万升高到1997—1999年的5.3/10万,增加了3.3倍;2000年的发病率达到了7.7/10万,2009年发病率达到20/10万,位于男性泌尿生殖系肿瘤的第1位。
北京地区的情况类似,从1985—1995年,城区的前列腺癌发病率增加了2.3倍,同期台湾地区和新加坡华人的发病率分别增加了4.8倍和8.5倍,已跨入前列腺癌发病的中危地区。
前列腺癌的病因尚不十分清楚,但大量临床资料提示与性激素有关。
估计是循环中雌激素与雄激素的比例失调,特别是雄激素的变化。
解剖学,局部侵犯,淋巴及血行转移(一)解剖前列腺位于膀胱和盆底之间,尿道穿越其中。
前列腺底部邻接膀胱颈,尖部向下,底部和尖部之间为前列腺体部,体部的后面平坦,中央有一纵桁浅沟,为前列腺中央沟。
成年前列腺重约20g,约3.5cm * 2.5cm * 2.5cm大小,精囊位于前列腺后上方。
前列腺前壁紧贴趾骨,后壁依托于直肠壶腹部,侧壁和下壁与肛提肌相邻。
前列腺由腺体和纤维肌肉组成。
前列腺分为4个区:纤维肌肉基质区、外周区、中央区和移行区。
前列腺癌常发生于外周区,而前列腺良性增生常发生于移行区。
前列腺癌疾病介绍

前列腺癌研究综述前列腺癌(prostate cancer, PCa)是一种老年男性泌尿生殖系统常见的恶性肿瘤。
国内外报道的前列腺癌发病率有很大差别,发达国家高于发展中国家。
在欧美国家,前列腺癌居男性恶性肿瘤的第二位【1】,病死率仅次于肺癌。
我国前列腺癌的发病率和死亡率虽远远低于西方国家,但近年来随着人们生活水平的提高,人口结构的老龄化、饮食结构的改变,加上男性荷尔蒙使用不当,其发病率呈上升趋势,已高居泌尿系肿瘤的第三位,并且发病年龄也日趋年轻化,临床上已经将其作为老年男性常见恶性肿瘤之一。
病因与发病机制前列腺癌发生的确切病因与发病机制仍不清楚,且其生物学行为极其复杂,故推断其病因可能是在遗传背景易感性的内在基础上,在生物、化学和物理等外在环境因素的持续影响,促进了前列腺癌的其发生和发展。
随着生物化学、遗传学、流行病学、分子生物学等学科的发展,越来越多的因素被发现与前列腺癌的发生密切相关,故强调某一单独因素是片面的。
1.流行病学研究年龄、家族遗传和种族是该病确定性的危险因素;脂肪饮食、激素、维生素、微量元裹及输精管切除术是可能或潜在的危险因子。
2.细胞动力学正常前列腺上皮处于低水平细胞增殖和凋亡的平衡.不存在净增长。
细胞更新周期约500天左右,保持相对稳定状态【2】,而前列腺癌的生长依赖于这一平衡向细胞增殖倾斜。
3.染色体的变异染色体的变异在前列腺癌较为普遍,表现有杂台性缺失(LOH)、等位基因丢失(ALLELIC) 、基因扩增和染色体重排等。
4.DNA的甲基化DNA甲基化是实体癌瘤的早期表现,前列腺癌也不例外。
前列腺癌细胞中谷氨酰胺-S-转移酶基因【3】、雄激素受体启动因子基因【4】等的甲基化增加了细胞的肿瘤易感性。
5.肿瘤基因与肿瘤抑制基因前列腺癌的发生和恶性进展是DNA特定的基因群改变而引发DNA损伤蓄积所致。
DNA点突变、局部基因扩增、细胞RNA或蛋白过表达、染色体易位及基因重排等,均可激活癌基因或覆盖、灭活抑癌基因而引发癌变。
12第十二章 前列腺癌

第十二章前列腺癌前列腺癌(carcinoma of prostate)是男性泌尿生殖系中最常见的肿瘤,也是人类特有的疾病,其他哺乳动物自发倾向极为罕见。
前列腺癌的发病率有明显的地区和种族差异,在我国及印度、日本、菲律宾等亚洲国家发病率较低,非洲和以色列居中,欧美国家最高,前列腺癌在欧美是男性癌症死亡的主要原因之一。
我国北京市1984—1987年男性发病率为2.4l /10万,死亡率为19/10万,近20年我国发病率有上升的趋势。
本病多发于60岁以上,有一部分属无症状的“潜伏癌”,尸检时始能发现;病理资料证实,80岁以上的男性前列腺病理切片50%—60%有镜下癌;.在前列腺增生的手术中,前列腺癌的切片检出率为5%—20%。
因此前列腺癌的实际发病率高于文献报道的数值。
根据前列腺癌的临床表现,该病属中医“淋证”、“癃闭”、“尿血”的范畴。
【病因病理】(一)西医病因病理1.病因到目前为止,引起前列腺癌的病因尚不明确。
流行病学调查提出种族、遗传、感染、环境、饮食及职业等因素,但与前列腺癌的确切关系还不清楚。
大量临床资料提示与性激素有关,估计是循环中雌激素与雄激素比例失调,尤其是雄激素的变化。
研究发现在性活力较高的人群中,前列腺癌发病率较高,而在辜丸切除后的病人中很少有此病发生。
其他如前列腺淋球菌、病毒及衣原体感染后发病率有所增高;接触化学物质,如环境污染、暴露于放射线、过多地接触镉等;饮食因素如高脂肪饮食、过量饮用咖啡和酒类等与发病有一定的关系。
从这些不同的研究结果看,前列腺癌的发病可能受多种因素的影响,强调某一单独因素的意义是很困难的。
2.病理前列腺癌常发生于前列腺后叶,侧叶次之,而绝大多数是发生在腺体外周腺管上的腺癌。
在正常的或有增生病变的前列腺,腺体由后尿道向外呈放射状,有典型的曲管状腺泡,各腺管皆为一层纯胶原结缔组织所包裹。
前列腺癌发生时,上述排列形状完全消失,无腺泡曲管结构,胶原结缔组织也不复存在;95%以上为腺细胞癌,其余为移行细胞癌、鳞癌和肉瘤等。
【关爱男性健康疾病常识】前列腺癌2
前列腺癌排尿困难、频尿、夜尿、残尿感、血尿等,严重时会移转淋巴结、骨头,但只要早期发现,早期治疗,存活率高出其它癌症很多。
男性荷尔蒙分泌不足,会影响性器官发育及性功能,最好向医疗院所求诊,适量男性荷尔蒙治疗后即可获得改善,如果自行服用或注射过量男性荷尔蒙,尤其是年长民众,将成为前列腺癌症的高危险群。
一旦罹患前列腺癌,如果再摄取男性荷尔蒙,病情将加剧。
前列腺病患采手术切除、放射线治疗,晚期患者则使用荷尔蒙治疗或睾丸切除术治疗。
前列腺临诊断方法:①直肠指检:发现坚硬结节,正确率达80%;②经直肠穿刺或经会阴切开前列腺活检更为准确;③血清酸性磷酸酶测定:可明显升高。
④B超,同位素扫描:前列腺均有改变。
⑤X线:尿道造影后尿道膀肮颈移位;脊椎、骨盆、股骨、胸骨摄片,见有转移性骨质破坏病灶。
前列腺癌的早期诊断由于前列腺癌多发生于后叶,早期并无症状,即使有不适,也不足以引起病人的重视,因此给早期诊断带来了困难。
一旦临床上出现了明显症状,往往已属病变的晚期,预后不良。
可见,早期发现前列腺癌显得十分重要。
特别是对前列腺炎、前列腺肥大的病人,反复发作不愈,应十分注意病情变化,以防癌变。
前列腺癌的病人在早期常会出现尿频及夜尿增多、排尿困难、尿流变细、尿程延长、排尿痛以及尿潴留等症状,与前列腺增生相同,因此很难据此诊断前列腺癌,主要依靠直肠指检诊断。
直肠指检在前列腺癌的早期诊断中极为重要,其准确率可达50%—70%。
很多学者主张在前列腺癌高发地区,对中年以上男性定期进行直肠指检,将使很多病人得到早期诊断及根治的机会。
必要时医生可采取经会阴、直肠穿刺,取活体组织检查,其诊断的前列腺癌正确率可达70%—80%。
还可经直肠按摩前列腺,收取前列腺液检查,其阳性率可达90%以上。
绝大多数病例可由此得到确诊。
值得提醒的是,尽管前列腺癌发生率不高,但它的症状酷似前列腺增生若经治疗后,病情越发恶化,就要想到前列腺癌的可能,应作上述检查,争取早期发现尽早期诊断。
前列腺癌应该如何防治

近年来,前列腺癌发病率逐年上升,死亡率更是居高不下,正逐步成为影响我国中老年男性健康的重要疾病。
因此,有必要加强前列腺癌预防及治疗的知识普及,引起人们的重视。
截至2020年,据世界癌症报告资料显示,前列腺癌在我国男性恶性肿瘤中的发病率居第6位,死亡率居第9位,发病率约15.6/10万人,死亡人数超过5万。
国内初诊前列腺癌患者中,临床局限性前列腺癌占1/3,大部分前列腺癌患者初诊时已属中晚期。
因此高危人群的筛查、早期诊断及治疗具有十分重要的意义,而“早筛查、早诊断、早治疗”则是提高前列腺癌患者总生存率最有效的手段之一。
简要介绍前列腺癌前列腺癌是一种常见的发生于男性前列腺的泌尿生殖系统恶性肿瘤,主要由年龄增长和遗传因素引起,但饮食习惯也与之有关联。
不良的饮食习惯会导致肥胖,如果再不愿意运动,就会影响身体代谢,从而诱发前列腺癌。
临床上治疗前列腺癌的方式有药物治疗、手术治疗、放射治疗等。
早期前列腺癌患者通过积极应对治疗一般可以取得良好的效果,甚至治愈,晚期前列腺癌患者常应用雄激素治疗,可以改善患者生活质量,从而延长生存期。
前列腺癌早期大多没有明显症状,很多患者不易及时发现病情,随着疾病的发展,患者会出现尿频、尿急、尿流缓慢、排尿困难等现象,此时多数已达前列腺癌中期。
因此,当发现身体存在上述症状之一时应引起重视,及时前往医院诊疗,防止病情继续恶化,前列腺癌晚期患者会出现骨痛、下肢水肿、排尿困难、体重下降等症状。
前列腺癌的预防措施1.通过食物预防前列腺癌根据世界癌症研究基金会及美国癌症研究所研究得出,高钙、加工、腌制、烟熏、含防腐剂食品和红肉等食物食用多了会增高前列腺癌患病风险。
血液中硒浓度高的男性患前列腺癌的概率低4至5倍,因此硒具有预防前列腺癌的作用。
此外,维生素E 、维生素C 和茄红素也有预防前列腺癌的作用,生活中可多食用含有上述成分的食物。
比如,橘子含有红前列腺癌应该如何防治姻郭锥锋(复旦大学附属闵行医院)医诊通肿瘤74桔素、川皮苷、维生素C,番茄和胡萝卜含有大量β胡萝卜素,可以帮助人体吸收番茄里的番茄红素,鸡肉含硒,一块鸡胸肉就可以提供人体一天所需的硒,全麦玉米饼含有硒和大量纤维,麦芽菌含有大量的维生素E和锌,西瓜含有大量的番茄红素,鸡蛋和青花鱼含有大量的无机硒,蒜、嫩茎花椰菜和陀螺蘑菇含有的有机硒比无机硒更易吸收。
中国前列腺癌的发病趋势
618
中国临床肿瘤学教育专辑 (2007)
倍。这些资料也显示前列腺癌死亡率的降低主要归功于肿瘤分期构成的改变和根治性治疗进步,晚期病 变并没有显著的治疗进步。
美国前列腺癌发病趋势的分析使得我们有必须要探讨 PSA 筛查在前列腺癌诊治中的作用。首先,PSA 筛查能够检出人群中的潜伏期前列腺癌,1988~1992 年前列腺癌发病率的迅速升高就归于潜伏期前列腺 癌的检出增多;其次,PSA 筛查使得前列腺癌诊断年龄“年轻化”,在 PSA 时代<65 岁男性前列腺癌发病 率不断上升,而≥65 岁的发病率则在近年出现下降,提示越来越多的潜伏期前列腺癌被早期诊断;再次, PSA 筛查改变的美国前列腺癌的分期构成和预后,局限性病变成为主流,5 年生存率接近 100%,2006 年 前列腺癌的发病人数是肺部肿瘤的 2.5 倍,然而死亡人数仅有其 1/3。
前列腺癌是威胁男性健康的常见肿瘤之一,2002 年全球新发病例 679000 例,位列男性肿瘤的第 2 位[1]。流行病学资料显示前列腺癌发病有着显著的地区差异,2006 年美国预期新发病例 234460 例,占所 有男性肿瘤的 1/3[2],2002 年中国的标化发病率为 1.6/10 万,仅有美国的 1/10(124.8/10 万)[3]。虽然与发达 国家相比,中国仍是前列腺癌的低发国家,但近年来发病率却稳步升高,上海地区 2000 年的标化发病率 为 7.7/10 万,较 30 年前(1.6/10 万)增加了 4 倍。是什么因素造成国内前列腺癌发病的增多,高发国家的 流行病学资料能否为我们的工作提供借鉴和启示,本文回顾国内外的前列腺癌发病趋势和特点,为改进 前列腺癌的预防和治疗提供基础。
一、 美国前列腺癌的发病趋势和特点
前列腺癌发病率有着巨大的地区、种族差异,除此以外,疾病诊断的准确性、肿瘤登记是否完整和 医疗覆盖情况也影响最终报道的发病率。美国国立癌症中心的 SEER(Surveillance Epidemiology and End Results)数据库有完整的人群资料和长期的随访,通过对 1975~2003 年肿瘤数据的分析有助于了解前列腺 癌的发病趋势和特点[4]。
中国前列腺癌流行病学研究进展

中国前列腺癌流行病学研究进展一、本文概述前列腺癌是一种在男性中较为常见的恶性肿瘤,其发病率和死亡率在全球范围内均呈上升趋势。
近年来,随着中国社会经济的发展和生活方式的改变,前列腺癌的发病率也呈现出逐年上升的趋势,已成为威胁男性健康的主要疾病之一。
因此,对中国前列腺癌流行病学的研究具有重要的现实意义。
本文旨在综述近年来中国前列腺癌流行病学研究的进展,包括前列腺癌的发病率、流行趋势、影响因素、筛查与早期诊断等方面的研究,以期为进一步深入探讨前列腺癌的病因、预防和治疗提供科学依据。
通过回顾和分析近年来的相关文献,本文发现,中国前列腺癌流行病学研究在多个方面取得了显著进展。
在发病率和流行趋势方面,通过大规模的流行病学调查,揭示了前列腺癌在中国的发病特点和流行趋势,为制定相应的防治策略提供了重要依据。
在影响因素方面,深入探讨了年龄、遗传、生活方式、环境因素等对前列腺癌发病风险的影响,为预防和控制前列腺癌的发生提供了理论依据。
在筛查与早期诊断方面,通过不断探索和实践,提高了前列腺癌的早期诊断率,为前列腺癌的早期治疗创造了有利条件。
然而,尽管中国前列腺癌流行病学研究取得了一定的成果,但仍存在许多挑战和问题。
前列腺癌的发病机制仍不完全清楚,需要进一步深入研究。
前列腺癌的筛查和早期诊断方法仍有待改进和完善,以提高早期发现率和治疗成功率。
前列腺癌的预防和控制策略也需要不断更新和优化,以适应社会发展和人群需求的变化。
中国前列腺癌流行病学研究在多个方面取得了显著进展,但仍面临许多挑战和问题。
未来,需要进一步加强前列腺癌的基础研究和临床研究,提高前列腺癌的诊疗水平和预防控制能力,为保障男性健康做出更大的贡献。
二、前列腺癌流行病学研究方法前列腺癌的流行病学研究主要依赖于多种方法的综合应用,包括描述性流行病学、分析性流行病学以及实验流行病学等。
这些方法在前列腺癌的研究中各有侧重,共同推动了对前列腺癌病因、发病机制和预防策略的理解。
中国前列腺癌发病现状和流行趋势分析
【 A b s t r a c t 】 O b j e c t i v e T o i n v e s t i g a t e t h e s t a t u s a n d t r e n d s o f p r o s t a t e c a n c e r i n c i d e n c e i n C h i n a . Me t h o d s T h e r e g i s t e r e d
p r o s t a t e c a n c e r d a t a b e t we e n 1 9 9 8 a n d 2 0 0 8 f r o m t h e Na t i o n a l C a n c e r R e g i s t r a t i o n C e n t e r wa s c o l l e c t e d,i n c l u d i n g t h e i n c i d e n c e o f p r o s t a t e c a n c e r ,t h e c u mu l a t i v e p r o b a b i l i t y o f d e v e l o p i n g p r o s t a t e c a n c e r o f ma l e s a g e d 0 - 7 4,c o mp o s i t i o n a n d a g e — s p e c i i f c i n c i d e n c e . T h e s t a t u s a n d t r e n d s o f t h e i n c i d e n c e b e t we e n u r b a n a n d r u r a l me n w a s c o mp re a d a n d a n a l y z e d .Re s u l t s I n 2 0 0 8,t h e i n c i d e n c e o f p r o s t a t e c a n c e r o f Ch i n e s e me n w a s l 1 . 0 0 / 1 0 0 0 0 0.a c c o u n t i n g f o r 3 . 3 3 % o f t h e i n c i d e n c e o f me n ’ s ma l i g n a n t t u mo  ̄. T h e wo r l d ’ S p o p u l a t i o n a g e - s t a n d a r d i z e d i n c i d e n c e r a t e wa s 6 . 7 3 / 1 0 0 0 0 0 .T h e c u mu l a t i v e r i s k o f ma le s a g e d 0 - 7 4 wa s 0 . 7 0 % .T h e i n c i d e n c e o f u r b a n ma l e s wa s a b o u t 3 . 7 t i me s o f t h a t i n r u r a l a r e a s .T h e r e s u l t s o f a g e — s p e c i i f c i n c i d e n c e s h o w e d t h a t t h e i n c i d e n c e o f C h i n e s e ma l e s o v e r t h e a g e o f 7 0 r a n k e d t h e i f r s t p l a c e i n t h e ma l e s g e n i t o u i r n a r y t u mo r .T h e a v e r a g e a n n u l a ro g th w r a t e d u i r n g 1 9 9 8 — 2 0 0 8 w a s 1 2 . 0 7 % .T h e g r o w t h i n c i d e n c e r a t e o f u r b a n me n w i t h p r o s t a t e c a n c e r w a s 8 . 5 3 /1 0 0 0 0 0,h i g h e r t h a n 2 . 5 3 /1 0 0 0 0 0 i n r u r l a re a a s . B u t t h e a v e r a g e a n n u a l g r o th w r a t e o f u r b a n ma l e s w a s 1 1 . 2 5 % .1 o w e r t h a n 1 3 . 2 8 % o f ur r a l ma l e s .T h e p r o p o r t i o n o f h i g h a g e g r o u p w a s i n c r e a s e d s i g n i i f c a n t l y i n t h e a g e c o mp o s i t i o n o f t h e i n c i d e n c e o v e r t i me .Co n c l u s i o n I n r e c e n t y e a r s ,t h e i n c i d e n c e o f p r o s t a t e c a n c e r h a v e s h o w e d a n o b v i o u s g r o w t h t r e n d i n C h i n a .P r o s t a t e c a n c e r i s b e c o mi n g u in r a r y t r a c t ma li g n a n t t u mo r t h a t i mp a c t s C h i n e s e me n ’ S h e lt a h s e i r o u s l y .
前列腺

1分:癌肿极为罕见。其边界很清楚,膨胀型生长,几乎不 侵犯基质,癌腺泡很简单,多为圆形,中度大小,紧密排列 在一起,其胞浆和良性上皮细胞胞浆极为相近。 2分:癌肿很少见,多发生在前列腺移行区,癌肿边界不很 清楚,癌腺泡被基质分开,呈简单圆形,大小可不同,形状 可不规则,疏松排列在一起。 3分:癌肿最常见,多发生在前列腺外周区,最重要的特征 是侵润性生长,癌腺泡大小不一,形状各异,核仁大而红, 胞浆多呈碱性染色。 4分:癌肿分化差,浸润性生长,癌腺泡不规则融合在一起, 形成微小乳头状或筛状,核仁大而红,胞浆可为碱性或灰色 反应。 5分:癌肿分化极差,边界可为规则圆形或不规则状,伴有 浸润性生长,生长形式为片状单一细胞型或者是粉刺状癌型, 伴有坏死,癌细胞核大,核仁大而红,胞浆染色可有变化。
照射野
①
全盆腔照射野 前后野上界在L5~S1之间, 下界位于坐骨结节下缘,两侧界在真骨盆缘 外1~2cm。侧野前界在耻骨联合前缘后 0.5~1cm或在耻骨前、中1/3之间,后界上方 在S2/S3之间,下方在直肠中部。靶区包括 了前列腺、精囊、闭孔、部分髂内、髂外淋 巴结。
②前列腺野 采用上述前后野侧野的四野盒式照射 技术,仅照射前列腺。确定前列腺野上界、后界的 方法:先在膀胱和直肠内插入Foley氏16号管并注 入造影剂。经外尿道口插入Foley氏管至膀胱内,往 气囊内注入90%泛影葡胺5ml,轻轻牵拉Foley氏管 使气囊固定在膀胱三角区位置,然后膀胱内再灌注 30%泛影葡胺30ml(确定照射野上缘)。直肠内插 入另一根Foley氏管,往气囊内注入空气使其固定在 直肠内括约肌位置,经导管灌入30%泛影葡胺至直 肠内。前列腺野上界位于Foley管气囊上2 cm,后 界位于直肠前壁后约1 cm,侧野前界在耻骨联合前 缘后0.5~1cm或在耻骨前、中1/3之间,侧界位于 前列腺外侧2cm
前列腺癌:流行病学、病因学、发病机制和危险因素2024(附表)

前列腺癌:流行病学、病因学、发病机制和危险因素2024(附表)前列腺癌是发达国家男性常见癌症,发病率远高于亚洲,尤其中国农村。
差异归因于种族、遗传、饮食、阳光暴露及致癌物。
前列腺分泌物质支持精子,并产生激素如二氢睾酮和雌激素,其浓度变化影响病理过程。
1 流行病学前列腺癌(PCa)常见于65岁以上男性,鲜少在50岁以下男性中诊断。
PCa是欧美澳及撒哈拉以南非洲男性最常见的癌症,也是114个国家发病率最高、56个国家癌症死亡主因。
2007-2017年,全球PCa发病率增长42%。
不同种族中,非洲裔美国人发病率最高,亚洲人最低。
巴西每10万男性中62例新发病例。
在较发达地区及非裔美国人中发病率更高。
中国农村及朝鲜蒙古发病率最低,日本最高。
2022年,27个欧盟国家男性新发癌症中PCa占23.2%。
图 1.12022 年欧盟各种癌症的发病率。
资料来源:ECIS—欧洲癌症信息系统[8]2020年数据显示,北欧发病率居欧洲之首(195例),东欧最低(115例)。
斯堪的纳维亚国家发病率最高(瑞典、挪威各220例),随后是西欧(法国215例,英国185例,德国160例),波兰和意大利均为125例。
巴尔干地区中,黑山和塞尔维亚发病率最低。
克罗地亚130例,斯洛文尼亚每年每10万人中有180例新发病例。
据塞尔维亚卫生保护研究所,2019年贝尔格莱德PCa平均非标准化发病率为70,北巴纳特区最高达96.8。
2. 病因学前列腺癌主要是前列腺泡腺癌,由恶性上皮细胞构成。
因其腺泡多位于前列腺外周区(PZ),故腺癌多发生于PZ。
前列腺癌初期生长缓慢,约3年倍增(Stamey)。
初期不易导致尿道梗阻和排尿障碍,但随生长,可扩散至前列腺外及盆腔淋巴腺、骨骼。
其病因复杂且未完全明了。
接下来,我们将简述前列腺生理学基础,以助理解前列腺癌形成过程。
3 前列腺生理学在所有哺乳动物中,前列腺是精子运输和营养的关键媒介,其功能受类固醇激素和自主神经系统调节。
警惕会“伪装”的前列腺癌

2022.0134祝您健康邹 青 江苏省肿瘤医院泌尿外科主任医师,任中国抗癌协会泌尿男性生殖系统专业委员会常委、江苏省医师协会泌尿外科专业委员会常委、中国抗癌协会泌尿男生殖肿瘤专业委员会微创学组副组长、江苏省抗协会泌尿男性生殖肿瘤专业委员会副主任委员等。
擅长男性生殖系统肿瘤的诊治。
门诊时间:周一下午专家介绍◎ 胥林花 江苏省肿瘤医院有这样一种癌症,专门“欺负”老年男性,而且由于症状不典型,有七成患者确诊时已到晚期,这个疾病就是前列腺癌。
和很多癌症一样,前列腺癌的早期发现至关重要,但它偏偏是一个善于“伪装”的癌症,如何才能识破前列腺癌的伪装呢?对于前列腺癌我们还存在哪些误解呢?● 前列腺癌:老年男性的健康杀手在欧美国家,特别在美国,前列腺癌的男性发病率居于第一位,死亡率居于第二位。
20世纪,抗癌乐园我国前列腺癌的发病率远低于西方国家,但随着人口老龄化、生活方式改变和诊疗水平的提高,前列腺癌的发病率呈快速上升的趋势,目前我国部分沿海城市的发病率已接近西方国家的水平。
据中国抗癌协会调查数据显示,2020年我国前列腺癌发病率为15.6/10万,每年前列腺癌的新发患者有七八万人,且城市发病率高于农村。
全国肿瘤登记中心数据显示,44岁前患前列腺癌的可能性仅为0.01%,而45~59岁则会增至0.34%,60~74岁为2.42%,大于75岁的为3.24%。
前列腺癌的中位年龄为72岁,高峰年警惕会“伪装”的前列腺癌2022.0135祝您健康● 及早筛查,“揪出”元凶前列腺癌的早筛相当重要,50岁以上的健康男性,应该每年做一次前列腺特异抗原(PSA)检查,而有家族病史的年轻人也应该定期接受相关的筛查,以防万一。
有些患者还会出现明显消瘦、贫血、全身疼痛的症状,甚至要靠止痛药的维持才能进行全面检查,但此时病情已经发展到晚期了。
PSA 是前列腺腺管上皮细胞产生的一种蛋白,是一种特别敏感的肿瘤标志物。
正常情况下它随精液排出,不直接进入血液,但出现前列腺炎症、增生、尿路感染、创伤等情况时,PSA 都可能会升高。
前列腺癌

当PSA在4-10ng/ml时:
fPSA/tPSA比值:>0.16为正常值
fPSA/tP SA<0.1,发生前列腺癌的可能性56% fPSA/tPSA>0.25,发生前列腺癌的可能性8%
PSAA/PV (Prostate volume) (前列腺体积经直肠超声测定计算所得)
根据症状、预后因子、及所给予的治疗,个性化随访。 推荐每3月进行一次随访。病情稳定者不推荐行常规影像
学检查。
新辅助内分泌治疗
依据:
理论上局限性前列腺癌可被根治术治愈 临床诊断中42 %~50 %患者术前肿瘤分期被低估,20 %患者术中才发现淋巴结转移 25 %患者术后病理检查存在切缘阳性。切缘阳性者术 后5 年复发率高达65 % , 阴性者仅为8 % 内分泌治疗可减少肿瘤体积、降低临床分期、进而延长 生存率、同时将根治术的适应症扩大至T3期 主要用于有高复发危险的前列腺癌,即Gleason评分 ≥7,精囊受侵,有全身扩散高风险的肿瘤 一般认为最佳适应症为T2 期肿瘤,相对适应证包括T1 、 T3 期肿瘤
PSAV(PSA速度)正常值<0.75 ng/ml
PSAV = [(PSA2-PSA1) + (PSA3- PSA2)]/2 (两年内至少检测三次PSA)
PSA(临床)筛查:
n 血清PSA受年龄和前列腺大小等因素的影响,
n PSA检查
有数据显示我国人口血清PSA平均值范围 均低于西方国家人口,甚至也低于亚洲其他 国家人群 nPCA3 nprostate health index
辅助内分泌治疗
依据: 根治术后pT2期肿瘤可有26 %患者复发。 根治术后淋巴结阳性率可为20 %~40 %,其5 年无瘤生存率 不足30 %,而辅助治疗可提高pN+ 患者长期生存率。 Gleason ≥7、PSA ≥10 ng/ ml、切缘阳性、精囊受累常预 示已有微小转移灶。微转移者5年生存率也不足30 %。 根治术后pT3期肿瘤复发率高, 5年PSA复发率达75 % ,如 Gleason ≥7 ,PSA ≥10 ng/ ml ,PSA复发时间为1 年。 适应症: 显微镜下可见神经束膜浸润或阳性切缘的肿瘤 高危前列腺癌:即临床分期≥ T2c期,或PSA≥20ng/ml, 或Gleason评分8~10分 或同时存在以下2项的肿瘤:PSA10 ~ 20ng/ml,≥T2b期, Gleason评分为7分(中危)
我国恶性肿瘤发病现状及趋势

我国恶性肿瘤发病现状及趋势本文旨在介绍我国恶性肿瘤的发病现状,分析未来可能的发展趋势,为预防和控制恶性肿瘤提供参考。
据国家癌症中心最新发布的数据显示,我国每年新发恶性肿瘤病例数已超过350万,死亡人数超过200万。
恶性肿瘤已成为威胁我国居民健康的主要疾病之一。
目前,我国恶性肿瘤的发病呈现出地域性、年龄段和性别差异。
从地域上看,东部地区恶性肿瘤发病率较高,西部地区较低;从年龄段上看,40岁以上人群发病率明显上升,尤其是50-70岁人群最为集中;从性别上看,男性发病率高于女性。
城乡差异也较为明显,城市居民发病率高于农村居民。
根据既往的研究成果,我国恶性肿瘤的发病趋势可能呈现以下特点:总体发病率有升有降。
随着人们生活水平的提高和环境的变化,一些消化道恶性肿瘤如胃癌、肝癌等发病率可能有所下降,但同时,乳腺癌、结直肠癌等恶性肿瘤发病率可能逐年上升。
发病年龄年轻化。
近年来,我国恶性肿瘤发病年龄有年轻化趋势,30岁以下人群的发病率逐年上升。
性别差异可能逐渐缩小。
随着女性生活方式的改变和环境污染等因素的影响,女性恶性肿瘤发病率逐年上升,男女发病率的差距可能逐渐缩小。
城乡差异可能逐渐缩小。
随着农村城市化进程的加快和农村居民健康意识的提高,农村恶性肿瘤发病率逐年上升,城乡差异可能逐渐缩小。
我国恶性肿瘤的发病现状不容乐观,未来趋势仍需密切。
建议居民加强自我保健意识,改善生活方式,定期进行体检,同时加强恶性肿瘤的防治研究,提高诊疗水平,以期降低恶性肿瘤的发病率和死亡率。
随着社会的发展和人们生活方式的改变,恶性肿瘤的发病和死亡已成为一个全球性的问题。
中国作为世界上人口最多的国家,其恶性肿瘤的发病和死亡情况也备受。
本文将分析2024年中国恶性肿瘤发病和死亡情况,并探讨其可能的原因和未来发展趋势。
近年来,中国恶性肿瘤的发病和死亡情况呈现逐渐上升的趋势。
根据国家癌症中心的数据,2015年中国恶性肿瘤新发病例数为9万例,死亡人数为2万例。
前列腺癌是怎么引起的
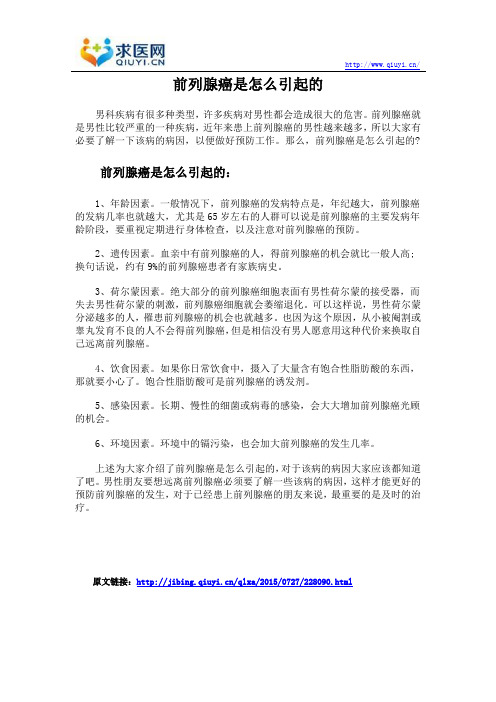
/前列腺癌是怎么引起的男科疾病有很多种类型,许多疾病对男性都会造成很大的危害。
前列腺癌就是男性比较严重的一种疾病,近年来患上前列腺癌的男性越来越多,所以大家有必要了解一下该病的病因,以便做好预防工作。
那么,前列腺癌是怎么引起的?前列腺癌是怎么引起的:1、年龄因素。
一般情况下,前列腺癌的发病特点是,年纪越大,前列腺癌的发病几率也就越大,尤其是65岁左右的人群可以说是前列腺癌的主要发病年龄阶段,要重视定期进行身体检查,以及注意对前列腺癌的预防。
2、遗传因素。
血亲中有前列腺癌的人,得前列腺癌的机会就比一般人高;换句话说,约有9%的前列腺癌患者有家族病史。
3、荷尔蒙因素。
绝大部分的前列腺癌细胞表面有男性荷尔蒙的接受器,而失去男性荷尔蒙的刺激,前列腺癌细胞就会萎缩退化。
可以这样说,男性荷尔蒙分泌越多的人,罹患前列腺癌的机会也就越多。
也因为这个原因,从小被阉割或睾丸发育不良的人不会得前列腺癌,但是相信没有男人愿意用这种代价来换取自己远离前列腺癌。
4、饮食因素。
如果你日常饮食中,摄入了大量含有饱合性脂肪酸的东西,那就要小心了。
饱合性脂肪酸可是前列腺癌的诱发剂。
5、感染因素。
长期、慢性的细菌或病毒的感染,会大大增加前列腺癌光顾的机会。
6、环境因素。
环境中的镉污染,也会加大前列腺癌的发生几率。
上述为大家介绍了前列腺癌是怎么引起的,对于该病的病因大家应该都知道了吧。
男性朋友要想远离前列腺癌必须要了解一些该病的病因,这样才能更好的预防前列腺癌的发生,对于已经患上前列腺癌的朋友来说,最重要的是及时的治疗。
原文链接:/qlxa/2015/0727/228090.html。
如何尽早发现前列腺癌杨旭东

如何尽早发现前列腺癌? 杨旭东发布时间:2023-07-05T07:25:59.015Z 来源:《中国结合医学》2023年6期作者:杨旭东[导读] 前列腺癌,是指发生于前列腺的癌症,在全世界范围内均有一定发病率,比如,欧美国家属于高发地区。
重庆市江津区第二人民医院重庆市 402289前列腺癌,是指发生于前列腺的癌症,在全世界范围内均有一定发病率,比如,欧美国家属于高发地区。
我国发病率远虽然低于欧美国家,但其发病率上升速度很快。
那么如何尽早发现前列腺癌呢?首先,我们需要了解影响前列腺癌发病的因素都包括什么,其次需熟悉前列腺癌的主要临床表现,再次,我们需要认识临床上常用的前列腺癌患者筛查方法或工具。
一.前列腺癌的发病因素都包括哪些?前列腺癌发病率目前增长较快,影响因素主要来自几个方面。
1.性活动。
很多研究发现,初次性生活年龄早、初次遗精年龄早、手淫频繁,均能从一定程度上增加前列腺癌的发病风险。
年轻时性生活过于旺盛,频次较多,一旦进入老年时期后,其性生活频次突然减少,或者,性生活停止时间过早或时间段过久,均可能提高前列腺癌发生风险。
2.年龄因素据一项2012年的统计数据显示,2012年全世界范围内,前列腺癌新发病例数量达到110万例左右,其发病率在男性恶性肿瘤中居于第2位,新发病例中70%来自于发达国家。
我国2014年的统计数据显示,国内前列腺癌新发病例为6.9万,其发病率在男性恶性肿瘤中居于第6位,同期死亡前列腺癌患者数量为3.0万。
在前列腺癌患者中80%年龄都在65岁以上,这表明,老年男性是前列腺癌的高发人群,需特别注意。
3.饮食因素饮食因素主要是指高脂肪饮食因素,特别是来自于红肉类食物的脂肪,而来源是鱼类、奶制品的话,则其影响较小。
不仅如此,若不喜蔬菜、南瓜以及胡萝卜等,进食量较低,或者偏好加了咖喱、姜以及胡椒等调料的食物,或者,进食口味偏咸的人,相对更加容易患病。
4.生活方式昼夜睡眠节律异常,睡眠时间不足等因素很容易引起受损DNA修复水平降低,加上很多人喜欢吸烟饮酒,这些都能够增加前列腺癌的患病风险。
- 1、下载文档前请自行甄别文档内容的完整性,平台不提供额外的编辑、内容补充、找答案等附加服务。
- 2、"仅部分预览"的文档,不可在线预览部分如存在完整性等问题,可反馈申请退款(可完整预览的文档不适用该条件!)。
- 3、如文档侵犯您的权益,请联系客服反馈,我们会尽快为您处理(人工客服工作时间:9:00-18:30)。
பைடு நூலகம்市 嘉
兴市 武汉市 广州
市 重
庆市
张思维, 中国部分市县2003年恶性肿瘤发病年度报告.中国肿瘤, 2007, 16(7).
PC Incidence in Different Countries and Areas
1993-1997
2000-2010
Reasons of PC Incidence Increased
<4ng/ml Positive DRE
18.1%
4-10ng/ml f/tPSA>0.16
11.6%
4-10ng/ml f/tPSA<0.16
Incidence(1/10万)
6.00 5.00 4.00 3.00 2.00 1.00 0.00
Prostate Cancer Incidence in China
Incidence adjusted
Years
中国前列腺癌的发病趋势
(per 100,000)
5
4.5
4
3.5
3
2.5
1.96
57.7%
PC Incidence in Different Cities and Areas
2008
14.0
Shanghai 21/100,000
12.0
北京市 天津市 Beijing 14/100,000
10.0
上海市 武汉市
8.0
哈尔滨市
磁县
6.0
启东市
嘉善县
4.0
扶绥县
长乐市
2.0
林州市
0.0 1988-1992 1993-1997 1998-2002 Years
Typical Chinese Diet
Low animal meat, Particular red meat Low fat, particular meat origin High soy products High vegetables High carbohydrate High fiber Tea as the most common drink
The average life span increases to >70 yrs for male >74 yrs for female. The diagnostic technology improved PSA, Biopsy technique improved Westernized food.
上海2005年肿瘤统计资料
肺、支气管 胃 肝 结肠 前列腺 直肠 膀胱 胰腺 食道 肾
男性
21%
11,195
14%
10%
8%
5%
5%
4%
4%
4%
3%
女性 9,554
20% 11% 9% 9% 5% 5% 4% 3% 3% 3%
乳腺 肺、支气管 结肠 胃 直肠 肝 卵巢 中枢神经系统 子宫体 胰腺
上海市疾病预防控制中心
More and more meat and fat consumption in China
Changes of Food Consumption in China
(1952 v 1997)
14 12 10 8 6 4 2 0
GRAIN COOKING RED AQUATIC POULTRY EGGS OIL MEAT FOOD
发病率 (1/10万)
全国肿瘤登记地区男性前10位恶性肿瘤发病率
80
62.73
60
42.58 39.81
40
28.99 26.31
20
9.7 8.19 7.35 7.15 6.26
0
肺癌
胃癌
肝癌
结直肠肛
食管癌 门癌
膀胱癌
前列腺癌 胰腺癌
淋巴瘤
肾癌
2008中国肿瘤登记年报(Chinese Cancer Registry Annual Report) - 中国肿瘤登记地区2005年发病死亡. 军事医学科学出版社,2009-9-1
10
9.59
上海前列腺癌标化发病率趋势
2003年全国各大城市的 前列腺癌发病率
一线城市发病率较高
发病率 标化率 16.5
10.2
5.6 5.6 6.1
4.5
3.3
3 2.8
11.1
7.8
8.3
8.8
6.5
4.4 2.7
5.3
3.9 3.63.3
2.31.5
北京 市
天 津市
大连 市
哈尔滨 市
上 海市
Prostate Cancer in China
Ming Li Beijing Cancer Hospital, Peking University
PC incidence in different area of China in three time periods
Incidence(1/10万)
上海市疾病预防控制中心
Year
1983 1984 1985 1986 1987 1988 1989 1990 1991 1992 1993 1994 1995 1996 1997 1998 1999 2000 2001 2002 2003 2004 2005
1.7 1
ASR per 100,000
2
1.5
1
0.5
0
1988-1992
3.09
41.1%
1993-1997
4.36 1998-2002
中国前列腺癌发病率逐年上升
LM, etc Chin J Urol; 2009, 20(6): 368-370
中国前列腺癌的发病率数据 (全国肿瘤登记,2005年)
• 全国肿瘤登记地区2005年前列腺癌发病率为8.19/10万,中 国标化率为3.90/10万。居男性所有恶性肿瘤第七位。
PC and Diet
Strong correlation between fat consumption and morbidity and mortality of PC. American, 30%-40% of calories from fat. Meats are main sources of dietary fat. Chinese, only 11.5% of calories from fat 5.3% of dietary fat from meats.
1952 1997
PC Diagnosis in China
PSA value and risk of CaP
Data from EAU
PSA ng/mL 0-1
1-2.5 2.5-4 4-10 > 10
PPV for cancer 2.8-5% 10.5-14% 22-30% 41% 69%
Data from China