国际债券发行人
第7章-1讲-国际债券投资
第二节 国际债券的价格、收益和风险 债券的定价原理 收益率曲线与利率的期限结构 债券的基本价值评估
如果预期的未来短期债券利率与现期短期债券利率相等,那么长期债 券利率就与短期债券利率相等,收益率曲线是一条水平线;
如果预期的未来短期债券利率上升,那么长期债券的利率必然高于现 期短期债券的利率,收益率曲线是向上倾斜的曲线;
如果预期的短期债券利率下降,则债券的期限越长,利率越低,收益 率曲线就向下倾斜。
参考答案
欧洲债券是指以某一种或某几种货币为面额,由国际辛迪加承销,同时 在面额货币以外的若干个国家发行的债券。如美国在法国证券市场发行的 英镑债券就叫欧洲债券。按习惯,如果面值为美元的欧洲债券一般被称为 欧洲美元债券。
该俄罗斯发行的欧洲美元债券为五年期,面额为100美元,年利率为 12.75%,每年支付两次利息,又名义收益率=债券年利息/债券面额×100%, 由此可知,名义收益率为12.75%
发展前景、竞争能力、资源供应的可靠性等。 ➢ 公司的财务状况。包括分析评价公司的债务状况、偿债能力、
盈利能力、周转能力和财务弹性,及其持续的稳定性和发展变 化趋势。 ➢ 公司债券的约定条件。包括分析评价公司发行债券有无担保及 其他限制条件、债券期限、还本付息方式等。 信用评级与债券发行利率密切相关。
BBB,BBB一,BB+
Ba,Ba1,Ba2,Ba3 B,B1,B2,B3
Caa,Caa1,Caa2,Caa3 Ca,Ca1,Ca2,Ca3 C
证劵考试 试题 第三章 债券

第三章债券第一节债券的特征与类型一、单选题1、债券作为证明()关系的凭证,一般是以有一定格式的票面形式来表现的。
A、产权B、委托代理C、债券债务D、所有权2、债券票面利率是债券年利息于债券票面价值之比率,又称为()。
A、到期收益率B、实际收益率C、持有到期收益率D、名义利率3、一般来说,期限较长的债券票面利率定的较高,是由于()。
A、流动性强,风险相对较小B、流动性强,风险相对较大C、流动性差,风险相对较小D、流动性差,风险相对较大4、在债券合约中未规定利息支付的债券是()。
A、浮动利率债券B、附息债券C、零息债券D、息票累积债券5、如果市场是有效的,则债券的平均收益率和股票的平均收益率()。
A、大体保持相对稳定的关系B、保持相反的关系C、两者没有任何关系D、大体保持相等的关系6、债券是实际运用的()的证书A、流动资本B、固定资本C、虚拟资本D、真实资本7、关于债券的基本性质,下列描述错误的是()。
A、债券本身有一定的面值,通常他是债券投资人投入资金的量化表现B、债券与其代表的权利联系在一起,拥有债券也就拥有了债券所代表的权利,转让债券也就将债券代表的权利一并转移C、债券的流动并不意味着它所代表的实际资本也同样流动,债券独立于实际资本之外D、债券代表债券投资者的权利,这种权利是直接支配财产权8、关于债券的票面价值,下列描述正确的是()。
A、在债券的票面价值中,只需要规定债券的票面金额B、票面金额定得较小,发行成本也比较小C、票面金额定得较大,有利于小额投资者购买D、债券票面金额的确定要根据债券的发行对象、市场资金供给情况及债券发行费用等因素综合考虑9、债券从发行之日起之偿清本息之日止的时间指()。
A、债券交易期限B、债券发行期限C、利息偿还期限D、债券到期期限10、下列关于债券票面要素的描述正确的是()。
A、为了弥补自己临时性资金周转之短缺,债务人可以发行中长期债券B、当未来市场利率趋于下降时,应选择发行期限较长的债券C、票面金额定得较小,有利于小额投资者购买,持有者分布面广D、流通市场发达,债券容易变现,长期债券不能被投资者接受11、下列各项不属于影响债券利率的因素的是()。
S规则下中国发行人国际债券发行指南
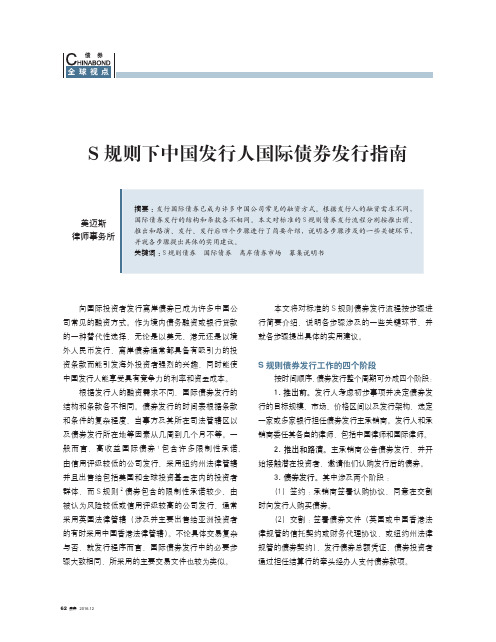
全球视点S 规则下中国发行人国际债券发行指南美迈斯律师事务所向国际投资者发行离岸债券已成为许多中国公司常见的融资方式。
作为境内债务融资或银行贷款的一种替代性选择,无论是以美元、港元还是以境外人民币发行,离岸债券通常都具备有吸引力的投资条款而能引发海外投资者强烈的兴趣,同时能使中国发行人能享受具有竞争力的利率和资金成本。
根据发行人的融资需求不同,国际债券发行的结构和条款各不相同。
债券发行的时间表根据条款和条件的复杂程度、当事方及其所在司法管辖区以及债券发行所在地等因素从几周到几个月不等。
一般而言,高收益国际债券1包含许多限制性承诺、由信用评级较低的公司发行、采用纽约州法律管辖并且出售给包括美国和全球投资基金在内的投资者群体,而S 规则2债券包含的限制性承诺较少、由被认为风险较低或信用评级较高的公司发行、通常采用英国法律管辖(涉及并主要出售给亚洲投资者的有时采用中国香港法律管辖)。
不论具体交易复杂与否,就发行程序而言,国际债券发行中的必要步骤大致相同,所采用的主要交易文件也较为类似。
本文将对标准的S 规则债券发行流程按步骤进行简要介绍,说明各步骤涉及的一些关键环节,并就各步骤提出具体的实用建议。
S 规则债券发行工作的四个阶段按时间顺序,债券发行整个周期可分成四个阶段:1.推出前。
发行人考虑初步事项并决定债券发行的目标规模、市场、价格区间以及发行架构,选定一家或多家银行担任债券发行主承销商。
发行人和承销商委任其各自的律师,包括中国律师和国际律师。
2.推出和路演。
主承销商公告债券发行,并开始接触潜在投资者,邀请他们认购发行后的债券。
3.债券发行。
其中涉及两个阶段:(1)签约:承销商签署认购协议,同意在交割时向发行人购买债券。
(2)交割:签署债券文件(英国或中国香港法律规管的信托契约或财务代理协议,或纽约州法律规管的债券契约),发行债券总额凭证,债券投资者通过担任结算行的牵头经办人支付债券款项。
4.发行后。
发行国际债券的步骤
发行国际债券的步骤发行国际债券的步骤一、美元债券发行美元债券的主要步骤如下:1、发行人首先向美国的资信评定公司提供资料,以便调查和拟定发行人的债券资信级别。
同时,发行人还要办妥向美国政府“证券和交易所委员会”呈报注册文件的草稿。
2、债券发行人完成向美国证券和交易所委员会呈报注册文件工作。
同时,资信评定公司也完成调有工作,提出债券资信级别的初步意见。
如果债券发行人对此无异议,则正式资信级别的等级意见书成立,如果债券发行人不接受,则考虑不定级发行。
3、美国政府证券和交易所委员会收到债券发行人呈报的注册文件后,要进行审查,审查完毕后发出一封关于文件的评定书。
债券发行人应就评定书里提出的问题做出答复。
4、债券发行人根据证券和交易所委员会在评定书中提出的意见,完成注册文件的修改工作。
5、债券发行人应选择一名管理包销人,管理包销人则组织包销集团,负责包销及有关工作。
管理包销人提出发行债券的初步方案,广泛征求意见,以期债券发行人和债券投资者双方都能满意。
6、正式在债券市场上发行债券。
二、日元债券发行日元债券的主要步骤有:1、取得临时信用评级,在缴款前签订承购合同后,取得试评级。
2、选定证券公司。
3、指定法律顾问。
4、制定各种发行文件。
召集发行者、受托银行及证券公司研究各种合同的准备文本,起草文件。
主要有:有价证券呈报书、发行说明书、外汇法规定的呈报书、债券条款、担保条款、承购合同书、承购团合同书、募集委托合同书、本利支付事务代办合同书、登记事务代办合同书、有价证券报告书等。
5、债券发行人取得国内有关部门的批准。
6、向日本大藏省提出有价证券申报书,征得日本政府的批准。
7、组织承购团。
8、发行条件谈判。
召开发行者、委托银行及证券公司三方会议,协商发行条件,签订承购合同。
9、有价证券申报书生效后,开始募集,招募时间一般为7~10天。
10、债券资金文款。
认购人向发行单位支付债券发行款项。
11、提交外汇报告书。
12、债券在东京证券交易所上市。
2021年金融市场基础知识单选题与答案解析38
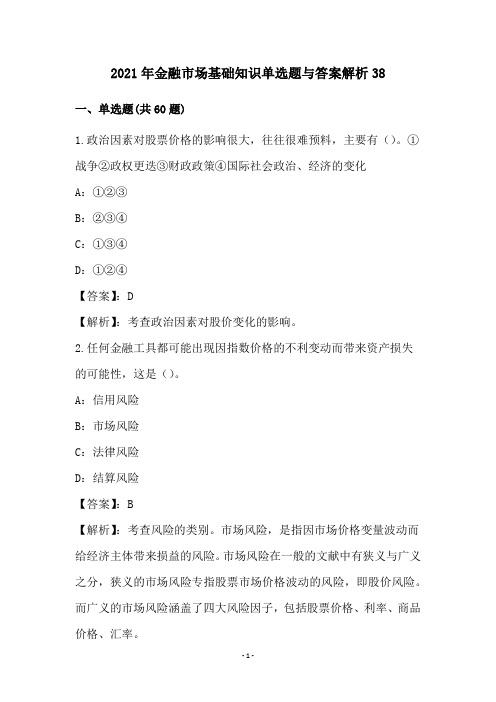
2021年金融市场基础知识单选题与答案解析38一、单选题(共60题)1.政治因素对股票价格的影响很大,往往很难预料,主要有()。
①战争②政权更迭③财政政策④国际社会政治、经济的变化A:①②③B:②③④C:①③④D:①②④【答案】:D【解析】:考查政治因素对股价变化的影响。
2.任何金融工具都可能出现因指数价格的不利变动而带来资产损失的可能性,这是()。
A:信用风险B:市场风险C:法律风险D:结算风险【答案】:B【解析】:考查风险的类别。
市场风险,是指因市场价格变量波动而给经济主体带来损益的风险。
市场风险在一般的文献中有狭义与广义之分,狭义的市场风险专指股票市场价格波动的风险,即股价风险。
而广义的市场风险涵盖了四大风险因子,包括股票价格、利率、商品价格、汇率。
3.国际债券的发行人主要是()。
I、工商企业;II、银行或其他金融机构;III、国际组织;IV、各国政府A:I、IIB:I、II、III、IVC:I、II、IVD:III、IV【答案】:B【解析】:国际债券的发行人主要是各国政府、政府所属机构、银行或其他金融机构、工商企业及一些国际组织等。
4.下列关于设立私募基金子公司的说法正确的是()。
①每家证券公司设立的私募基金子公司原则上不超过1家。
②私募基金子公司及其下设基金管理机构将自有资金投资于本机构设立的私募基金的,对单只基金的投资金额不得超过该只基金总额的20%③私募基金子公司及其下设特殊目的机构可对外提供担保和贷款④私募基金子公司及其下设特殊目的机构不得成为对所投资企业的债务承担连带责任的出资人A:①②③B:①②④C:①③④D:②③④【答案】:B【解析】:私募基金子公司及其下设特殊目的机构不得对外提供担保和贷款,不得成为对所投资企业的债务承担连带责任的出资人,故③错误。
5.任何金融工具都可能出现因指数价格的不利变动而带来资产损失的可能性,这是()。
A:信用风险B:市场风险C:法律风险D:结算风险【答案】:B【解析】:考查风险的类别。
国际债券市场融

全额包销 (Bought Deal);
(2)欧洲债券发行程序的变化:
第四节 国际债券发行中 应注意的问题
单击此处添加副标题
一、信用评级
发行国际债券进行融资时,一般都要由专门的评级机构对发行人进行信用评级,以供投资者参考。信用评级机构都是独立的私人或民间机构,不受政府控制,同证券交易所亦无关系,它们对投资者也只负有道义上的义务,而无法律上的责任。目前国际上比较具有权威性的资信评级机构有美国的标准普尔公司和穆迪投资服务公司、英国的艾克斯特尔统计服务公司。 一家金融机构为斡旋人;
起草发行说明书、认购合同等文件;
初步确定发行条件,开始向投资者进行征募;
对投资者的征募结束,确定发行额;
最后确定发行条件,发行者与认购者签订认购合同;
发布公告;
认购者交纳债券款项。
(1)私募程序:
证券交易委员会对有价证券申请书进行审查,发行人修改申请书;
3.偿还期限(Maturity)
债券的发行价格有三种不同的确定方法:平价发行(At Par)、折价发行(Under Par)、高于票面价格发行债券发行价格的调整,目的在于平衡票面利率与认购收益率间的差距。
4.发行价格(Issue Price)
国际债券的偿还方式主要分为:期满偿还、期中偿还和延期偿还。
04
四、国际债券市场的发展趋势
01
按利率的确定方式划分
02
按可转换性划分
第二节 国际债券的种类
一、按利率的确定方式划分
1.固定利率债券
是具有固定利率、固定利息息票和固定到期日的债券,是国际债券的传统类型。
固定利率债券主要有以下几种形式: 普通债券、零息债券、深贴现债券、伸展债券、分批支付债券、中期债券、二元货币债券、本息分离债券、货币选择权债券。
证券从业资格考试基础知识
1.国家股、法人股等是按〔〕来划分。
A.股票上市地点 B.股票投资主体的不同性质 C.股票上市主要监管部门 D.股票是否公开发行【正确答案】: B【参考解析】:国外一般将股票划分为普通股和优先股。
在我国,由于投资主体的不同性质,把股票划分为国家股、法人股、社会公众股和外资股等。
2.以下说法正确的选项是〔〕。
A.上海市场B股和深圳市场B股对境内外结算参与人均实行“净额交收〞制度B.上海市场B股和深圳市场B股均实行“净额交收〞和“逐项交收〞相结合的制度C.上海市场B股对境内外结算参与人均实行“净额交收〞制度,而深圳市场B股实行“净额交收〞和“逐项交收〞相结合的制度D.上海市场B股实行“净额交收〞和“逐项交收〞相结合的制度,而深圳市场B股对境内外结算参与人均实行“净额交收〞制度【正确答案】: D【参考解析】:上海市场B股实行“净额交收〞和“逐项交收〞相结合的制度,而深圳市场B股对境内外结算参与人均实行“净额交收〞制度,两者的不同要重点记忆。
3.我国上海证券交易所的A股例行日交割是指交割日为〔〕A.当日 B.次日 C.第三日 D.第四日【正确答案】:B4.以样本股的发行量或成交量作为权数计算的股价平均数是〔〕。
A.简单算术股价平均数 B.加权股价平均数 C.修正股价平均数 D.综合股价平均数【正确答案】:B5.我国规定,可转换公司债的转换价格应以公布募集说明书前〔〕个交易日公司股票的平均收盘价格为根底,并上浮一定幅度。
A.10 B.5 C.30 D.60 【正确答案】: C6.根据中国结算深圳分公司规定,通过中国结算深圳分公司派发的现金股利,〔〕由中国结算深圳分公司划至证券公司清算头寸,再由证券公司划入东资金账户。
A.R-1日 B.R日 C.R+1日 D.R+2日【正确答案】: C7.证券公司在办理经纪业务时是作为〔〕。
A.委托人 B.信托人 C.中介人 D.投资人【正确答案】: C 【参考解析】:证券公司办理经纪业务时接受客户委托代理买卖有价证券,所以是中介人。
外国债券的主要类型

外国债券的主要类型
外国债券是指外国借款人在一国国内市场发行的,以该国货币为面值的债券。
根据不同的标准,外国债券可以分为以下几种主要类型:
1. 扬基债券:扬基债券是以美元为计价货币并在美国市场上发行的外国债券。
扬基债券的发行人主要是美国以外的政府、金融机构、公司及国际组织。
2. 武士债券:武士债券是在日本债券市场上发行的外国债券,是日本以外的政府、金融机构、工商企业和国际组织在日本国内市场发行的以日元为计值货币的债券。
3. 熊猫债券:熊猫债券是指国际多边金融机构在华发行的人民币债券。
根据国际惯例,国外金融机构在一国发行债券时,一般以该国最具特征的吉祥物命名。
4. 欧洲债券:欧洲债券是借款人在其本国之外的资本市场上发行的以第三国货币为面值的国际债券。
欧洲债券的发行人、发行地以及面值货币分别属于三个不同的国家。
以上是外国债券的主要类型,每种类型都有其特点和适用范围,投资者可以根据自己的投资目标和风险承受能力选择适合自己的外国债券。
第七章国际债券

第七章国际债券在当今全球化的经济格局中,国际债券作为一种重要的金融工具,扮演着不可或缺的角色。
它不仅为各国政府和企业提供了融资渠道,也为投资者提供了多样化的投资选择。
国际债券,简单来说,就是在国际金融市场上发行和交易的债券。
其发行者可以是主权国家、地方政府、金融机构或者企业。
这些债券通常以外国货币计价,并且在多个国家的金融市场上流通。
国际债券的种类繁多。
按照发行货币的种类,可以分为外国债券和欧洲债券。
外国债券是指发行人在外国资本市场上发行的,以发行地所在国货币为面值的债券。
比如,中国企业在美国发行的以美元计价的债券就属于外国债券。
而欧洲债券则是指发行人在外国资本市场上发行的,以第三国货币为面值的债券。
例如,一家美国企业在日本发行的以欧元计价的债券。
从债券的偿还期限来看,国际债券又可以分为短期债券、中期债券和长期债券。
短期债券的偿还期限一般在一年以内,中期债券在一到十年之间,长期债券则超过十年。
不同期限的债券,其风险和收益特征也有所不同。
国际债券的发行和交易有着严格的流程和规范。
首先,发行人需要选择合适的承销商,承销商将负责债券的发行和销售工作。
在确定发行方案后,发行人需要准备详细的发行文件,包括招股说明书、财务报告等,向投资者充分披露相关信息。
接下来,债券将在指定的金融市场上进行发行和交易。
在交易过程中,投资者可以通过证券交易所或者场外市场进行买卖。
对于发行人来说,发行国际债券有着诸多好处。
一方面,它可以拓宽融资渠道,获得更多的资金支持。
特别是对于一些发展中国家的政府和企业来说,国际债券市场为其提供了重要的资金来源。
另一方面,发行国际债券还可以提升发行人的国际知名度和信誉度,有助于其在国际市场上的业务拓展。
然而,发行国际债券也并非毫无风险。
汇率波动是发行人面临的一个重要风险。
由于债券通常以外国货币计价,如果发行货币相对本国货币贬值,发行人在偿还债务时将面临更大的成本压力。
此外,国际债券市场的利率波动也会影响债券的发行成本和投资收益。
《证券投资实务》项目二习题(附答案)

《证券投资实务》项目二习题(附答案)一、单项选择题1.1602 年,世界上成立了第一家股票交易所,它是在()。
A.纽约B.伦敦C.巴黎D.阿姆斯特丹2.股票的理论价值是()。
A.票面价值B.账面价值C.清算价值D.内在价值3.国家股是指有权代表国家的投资部门或机构以国有资产向公司投资形成的股份,()资产应该折算成国家股。
A.国有企业以其法人资产向公司投资形成的股份B.国有事业单位以其法人资产向公司投资形成股份C.国有企业改制成股份公司形成的股份D.社会公众投资形成的股份4.在上海证交所上市的股票中,B 股是以人民币标明面值,以()进行买卖的。
A.人民币B.美元C.港元D.日元5.股票实际上代表了股东对股份公司的()。
A.产权B.债权C.物权D.所有权6.贴现债券通常在票面上(),是一种折价发行的债券。
A.不规定利率B.规定利率C.标明折价D.不标明折价7.债券按计息方式有多种分法,其中按一定期限将所生利息加入本金再计算利息,这种债券叫()。
A.单利债券B.复利债券C.贴现债券D.累进利率债券8.债券利率在偿还期内不是固定不变,而是随着时间的推移,后期利率将比前期高,这种债券叫()。
A.单利债券B.复利债券C.贴现债券D.累进利率债券9.浮动利率债券是指利率可以变动的债券,这种债券的利率在确定时一般与()挂钩。
A.市场利率B.银行贷款利率C.同业拆借利率D.定期存款利率10.债券根据券面形式,其中()是具有标准格式的债券。
A.实物债券B.凭证式债券C.记账式债券D.电子债券11.偿还期在 1 年以上 10 年以下的国债被称为()。
A.短期国债B.中期国债C.长期国债D.无期国债12.可以提前兑现的债券是()。
A.实物债券B.凭证式债券C.记账式债券D.以上都不能13.从广义的角度来看,公债的举债主体是国家,从狭义的含义来看,公债的举债主体是()。
A.依然是国家B.政府C.法院D.只能是地方政府14.以某种商品实物为本位而发行的国债是()。
国际债券

主讲:龚致宇 组员:苏小明、张博浩、拉巴旦增
定义
特点
分类 我国现状
• 国际债券是指一国借款人在国际证券市场上以外国货币为面
值,向外国投资者发行的债券
• 发行人:各国政府、政府所属机构、银行或其他金融机构、
工商企业及一些国际组织等
• 投资者:各类金融机构、各种基金会、工商财团以及自然人
定义
定义
特点
分类 我国现状
• 欧洲债券
• •
概念:欧洲债券是指借款人在本国境外市场发行的、不以发行市场所 在国货币为面值的国际债券 特点:债券发行者、债券发行地点和债券面值货币可以分别属于不 同的国家
•
•
欧洲债券被称为“无国籍债券”,因为它不以发行市场所在国货币为面值, 一般使用美元、欧元、英镑、日元等可自由兑换货币或者复合货币单位如 特别提款权等
法郎为主,发行国际债券所筹集的资金是一种可通用的自由外汇资金
定义
特点
分类 我国现状
• 外国债券
•
• •
概念:外国债券是指某一国借款人在本国以外的某一国家发行以该国 货币为面值的债券
特点:债券发行人属于一个国家,债券的面值货币和发行市场则属 于另一个国家 非美国发行人在美国市场发行以美元计价的债券被称为“扬基债券”;非 日本发行人在日本市场发行以日元计价的债券被称为“武士债券”;在我 国市场上发行外国债券被称为“熊猫债券”
定义
特点
分类 我国现状
• 外国债券和欧洲债券的区别
• • •
发行方式:外国债券一般由发行地所在国的证券公司、金融机构承销; 欧洲债券则由一家或几家大银行牵头,组织多家国际性银行在一个或多 个国家同时承销 发行法律:外国债券的发行受发行地所在国相关法律的管制和约束, 且需经官方主管机构批准;欧洲债券不受货币发行国相关法律的约束, 且不需要官方主管机构的批准 发行纳税:外国债券按发行地所在国税法进行纳税;欧洲债券的预扣税一 般被豁免,投资者的利息收入免缴所得税
国际债券的发行人主要是什么
一、国际债券的发行人主要是什么1、债券发行人国际债券的发行人是指发行国际债券并承担债券上债务的外国政府机构、金融机构和企业组织。
按照多数国际债券市场的要求,国际债券的发行人应当具备较高的信用等级,这通常是指国际主要债券信用评级机构评估的BBB以上的等级。
2、牵头经理人牵头经理人又称“国际协调人”、“主千事经理人”,它是指在国际债券发行中负责组织债券发行准备工作,组织承销团工作。
牵头经理人在兼任主承销人的情况下,是承销协议和分销协议的当事人,也是债券招募说明书的签署人。
牵头经理人具有承销团代表人的地位,它通常由有良好声誉的国际性投资银行、证券公司或金融机构担任,并且可以由两家以上的机构组成(称为“联席牵头经理人”);在发行规模较大的项目中,牵头经理人还可以在其下组织由若干家金融机构组成的经理人集团(称“联席经理人”)共同工作。
3、承销团国际债券承销团由负有主承销责任和分销责任的金融中介机构组成,通常为投资银行、证券公司、商业银行(多数国家允许商业银行从事证券承销业务)和其他金融机构。
承销团成员可分为主承销人、副主承销人和分销人三个层次,其承销关系由分销协议(又称”承销团协议”)确定。
主承销人可以由两家以上的金融机构组成,通常兼任牵头经理人或联席经理人;副主承销人也可由两家以上的金融机构组成;分销人通常根据承销规模与承销要求由许多家金融机构组成。
承销团成员根据债券承销协议和分销协议通常负有承销或包销债券的责任,并有权收取承销费用;其中主承销人或联席经理人以上的承销人通常负有主要的承销责任,一般占总发行额的40%以上,分销人的承销份额较少,一般仅取得0.5%一2%的分销比例。
4、中介机构在国际债券发行中,通常需要有债券评级机构对拟发债券进行债信评级。
对于初次进入国际债券市场的发行人来说这乃是必要条件,牵头经理人在决定组织承销其债券之前往往要求对该债券先行评级;而对于已进入该国际债券市场的发行人来说,获得高等级债信评级显然可提高其债券发行条件。
《证券市场基础知识》 模拟试题(二)
模拟试卷(二一、单项选择题(本大题共60小题,每小题0.5分,共30分以下各小题所给出的4个选项中,只有一项最符合题目要求,请选出正确的选项,不选、错选均不得分。
1. 1918年夏天成立的(,是中国人自己创办的第一家证券交易所。
A.上海证券物品交易所B.青岛物品交易所C.北平证券交易所D.天津市企业交易所2. 在国际证券市场的发展历程中,证券市场的恢复阶段是(。
A.20世纪初B.1929—1933年C.20世纪20年代—第二次世界大战结束D.第二次世界大战后—20世纪60年代3. 从20世纪70年代开始,证券市场出现了高度繁荣的局面,其重要标志是(的提高。
A.证券市场价值B.证券化率(证券市值/GDPC.股票市值占GDP的比率D.证券市场指数4. 1982年,(成为第一家在中国设立代表处的海外证券公司。
A.日本野村证券B.美国格林证券公司C.英国益华证券公司D.法兰克福证券公司5. 根据我国政府对WT0的承诺,外国证券机构直接从事B股交易的申请可由(受理。
A.国务院B.中国证监会C.国家外汇管理局D.证券交易所6. 2003年5月27日,(成为首家获批的合格境外机构投资者(QFII。
A.瑞士银行B.东京银行C.花旗银行D.美洲银行7. 证券是指各类记载并代表一定权利的(。
A.商品凭证B.资本凭证C.法律凭证D.货币凭证8. 按证券的募集方式分类,有价证券可分为(。
A.上市证券与非上市证券B.国内证券和国际证券C.公募证券和私募证券D.固定收益证券和变动收益证券9. 以下关于股票的说法不正确的是(。
A.股票是一种无期限的法律凭证B.股票独立于真实资本之外,在股票市场上进行着独立的价值运动C.股票属于物权证券D.股票是证权证券10. 通常将那些经营业绩较好,具有稳定较高现金股利支付的公司股票称为(。
A.红筹股B.蓝筹股C.大盘股D.成长股11. 引起股价变动的直接原因是(。
A.公司的经营情况B.宏观经济发展水平和状况C.证券市场运行状况D.供求关系的变化12. 我国《中华人民共和国公司法》规定,采取募集方式设立股份有限公司的,发起人认购的股份不得少于公司股份总数的(。
国际债市里的熊猫、美国佬和武士
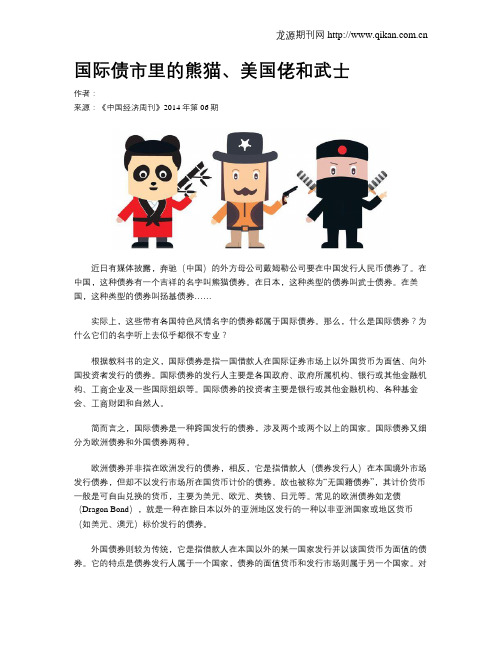
国际债市里的熊猫、美国佬和武士作者:来源:《中国经济周刊》2014年第06期近日有媒体披露,奔驰(中国)的外方母公司戴姆勒公司要在中国发行人民币债券了。
在中国,这种债券有一个吉祥的名字叫熊猫债券。
在日本,这种类型的债券叫武士债券。
在美国,这种类型的债券叫扬基债券……实际上,这些带有各国特色风情名字的债券都属于国际债券。
那么,什么是国际债券?为什么它们的名字听上去似乎都很不专业?根据教科书的定义,国际债券是指一国借款人在国际证券市场上以外国货币为面值、向外国投资者发行的债券。
国际债券的发行人主要是各国政府、政府所属机构、银行或其他金融机构、工商企业及一些国际组织等。
国际债券的投资者主要是银行或其他金融机构、各种基金会、工商财团和自然人。
简而言之,国际债券是一种跨国发行的债券,涉及两个或两个以上的国家。
国际债券又细分为欧洲债券和外国债券两种。
欧洲债券并非指在欧洲发行的债券,相反,它是指借款人(债券发行人)在本国境外市场发行债券,但却不以发行市场所在国货币计价的债券。
故也被称为“无国籍债券”,其计价货币一般是可自由兑换的货币,主要为美元、欧元、英镑、日元等。
常见的欧洲债券如龙债(Dragon Bond),就是一种在除日本以外的亚洲地区发行的一种以非亚洲国家或地区货币(如美元、澳元)标价发行的债券。
外国债券则较为传统,它是指借款人在本国以外的某一国家发行并以该国货币为面值的债券。
它的特点是债券发行人属于一个国家,债券的面值货币和发行市场则属于另一个国家。
对于债券发行人而言,要让外国债券更易得到当地投资者的踊跃认购,好听的名字显得必不可少。
于是外国债券通常都以发行市场所在国的吉祥物来命名。
比如在美国发行的外国债券取名为扬基债券(Yankee Bond),Yankee一词就指“美国佬”,由于在美国发行和交易的外国债券都是同“美国佬”打交道,故名扬基债券。
美国著名棒球队纽约扬基队也叫此名字。
“武士”是日本古时的一种很受尊敬的职业,后来一些带有日本特性的事物同“武士”一词连用,因此日本的外国债券也得名“武士债券”。
证券市场基础知识练习题67
一、单项选择题1. 社会保障基金的资金来源不包括______。
A.国有股减持划入的资金和股权资产B.中央财政拨入资金C.经国务院批准以其他方式筹集的资金及其投资收益D.企业等用人单位或公民个人缴纳的社会保险费答案:D[解答] D选项是社会保险基金的资金来源,而不是社保基金的资金来源。
故选D。
2. 关于证券投资基金的产生与发展,下列认识正确的是______。
A.证券投资基金是通过私募形式发售基金份额募集资金B.证券投资基金由基金份额持有人管理和运用资金,并获取利益C.证券投资基金是在18世纪末、19世纪初产业革命的推动下出现的D.由于风险较大,证券投资基金刚开始没有获得政府的支持答案:C[解答] 证券投资基金是通过公开发售基金份额募集资金,故A项不正确;证券投资基金由基金管理人管理和运用资金,故B项不正确;证券投资基金刚开始时就获得了政府的支持,故D项不正确。
故选C。
3. 在其他条件不变的情况下,期权期间越长,则______。
A.期权价格越低B.期权价格越高C.期权价格越波动D.期权价格越稳定答案:B[解答] 在其他条件不变的情况下,期权期间越长,期权价格越高。
这主要是因为权利期间越长,期权的时间价值越大。
随着权利期间缩短,时间价值也逐渐减少。
在期权的到期日,权利期间为零,时间价值也为零。
故选B。
4. 不以公司任何资产作担保而发行的债券是______。
A.信用公司债B.保证公司债C.不动产抵押公司债D.信托公司债答案:A[解答] 信用公司债是一种不以公司任何资产作担保而发行的债券。
故选A。
5. 某看跌期权合约规定,期权持有者可以按照协定价格20元出售某股票100股,现在该股票的市场价格为21元,而该看跌期权的内在价值为______。
A.-10B.100C.10D.0答案:D[解答] 当市场价格大于协定价格时,看跌期权的内在价值为0。
故选D。
6. 可以在期权到期日之前的一系列规定日期执行的期权是______。
2014证券从业《证券市场基础知识》模考题(二)

2014证券从业《证券市场基础知识》模考题(二)41.《证券公司风险控制指标管理办法》建立了以( )为核心的风险控制指标体系和风险监管制度。
A.总资产B.净资产C.净资本D.净收益答案:C解析:《证券公司风险控制指标管理办法》建立了以净资本为核心的风险控制指标体系和风险监管制度。
42.2005年10月27日第十届全国人民代表大会常务委员会第十八次会议修订的新《证券法》于( )起生效。
A.2006年1月1日B.2006年5月1日C.2006年7月1日D.2006年10月1日答案:A解析:2005年10月27日第十届全国人民代表大会常务委员会第十八次会议修订的新《证券法》于2006年1月1日起生效。
43.关于股份有限公司申请股票在主板市场上市应当符合的条件,阐述错误的是( )。
A.股票经国务院证券监督管理机构核准已向社会公开发行B.公开发行的股份达公司股份总数的25%以上,公司股本总额超过人民币4亿元的,公开发行股份的比例为l0%以上C.公司股本总额不少于人民币5000万元D.公司在最近5年无重大违法行为,财务会计报告无虚假记载答案:D解析:本题考查股份有限公司申请股票在主板市场上市应当符合的条件。
选项D的正确表述是:公司在最近3年无重大违法行为,财务会计报告无虚假记载。
44.根据《证券发行与承销管理办法》,首次公开发行股票如果在初步询价阶段参与报价的询价对象不足20家,发行( )亿股以上的、参与报价的询价对象不足50家,发行人不得定价并应中止发行。
A.3B.4C.5D.6答案:B解析:根据《证券发行与承销管理办法》,首次公开发行股票如果在初步询价阶段参与报价的询价对象不足20家,发行4亿股以上的、参与报价的询价对象不足50家,发行人不得定价并应中止发行。
45.下列不属于国际证监会组织公布的证券监管目标的是( )。
A.降低非系统性风险B.降低系统性风险C.保护投资者D.保证证券市场的公平、效率和透明答案:A解析:本题考查国际证监会组织公布的证券监管目标——保护投资者;保证证券市场的公平、效率和透明;降低系统性风险。
名词解释10300
1.经济全球化:指世界经济活动超越国界,通过对外贸易、资本流动、技术转移,提供服务,相互依存,相互联系而形成的全球范围的有机经济整体。
含义:第一,它作为一个经济过程表现为经济活动正在通过生产、贸易、金融和资本的跨网络,以空前的广度,强度和流动速度向全球扩张,使世界上一个地区的时间、行动和决定可以影响到距离遥远的国家、群体乃至个人,整个世界经济空前地联系在一起。
第二,它虽然主要是一个经济过程,但不可能不在社会文化的层面产生强烈的渗透和深刻的影响。
一方面,世界各名族文化相互借鉴,吸收和交融;另一方面,世界各种文明之间、名族性与世界性之间,传统性与现代性之间发生碰撞和冲突,深刻影响着人们的文化心理和价值选择。
第三,各主权国家要求平等参与国际政治和经济事务,改变既有的游戏规则,建立国际政治和经济新秩序的呼声日益高涨。
2.许可经营:是许可方企业向受许方提供技术,包括版权、专利技术、技术诀窍或商标以换取使用费的一种经营方式。
3.网络式组织:是一种只有很精干的中心机构,以契约关系的建立和维持为基础,依靠外部机构进行制造、销售或其他重要业务经营活动的组织结构形式。
被联结在这一结构中的各经营单位之间并没有正式的资本所有关系和行政隶属关系,只是通过相对松散的契约(正式的协议契约书)纽带,透过一种互惠互利、相互协作、相互信任和支持的机制来进行密切的合作。
第三章1.直接标价法:又称应付标价法,是以一定单位的外国货币为标准,计算应付多少单位的本国货币的标价法。
(以外币为标准,用本币表示)。
1美元=6.83人民币2.间接标价法:又称应收标价法,是以一定单位的本国货币为标准,折算为一定数额的外国货币来表示其汇率。
(以本币为标准,用外币表示本币币值)。
1英镑=1.60美元3.即期汇率:指目前的汇率,用于外汇的现货买卖。
它是外汇买卖双方成交当天或两天以内进行交割时使用的汇率,也叫现汇汇率。
4.远期汇率:是在未来一定时期进行交割,而事先由买卖双方签订合同,达成协议的汇率,到了交割日期,由协议双方按预定的汇率,金额进行交割。