图画图表作文常用语言及通用句式【已总结】
高考英语图表图画式作文
图表/图画式作文【特点】:将图表形式的信息转换成文字信息。
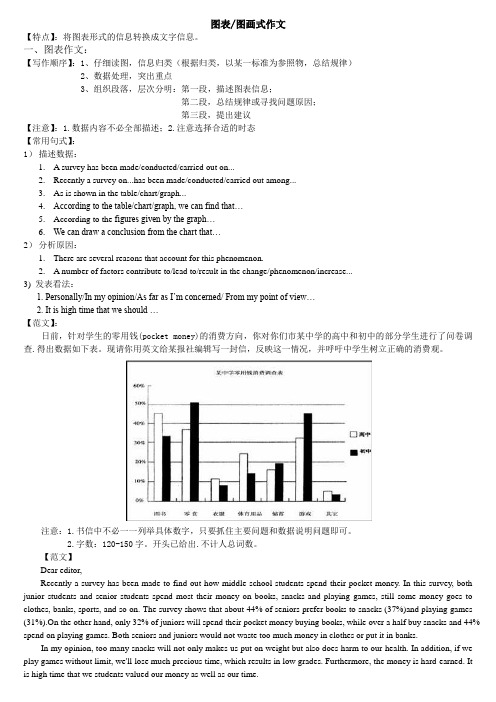
一、图表作文:【写作顺序】:1、仔细读图,信息归类(根据归类,以某一标准为参照物,总结规律)2、数据处理,突出重点3、组织段落,层次分明:第一段,描述图表信息;第二段,总结规律或寻找问题原因;第三段,提出建议【注意】:1.数据内容不必全部描述;2.注意选择合适的时态【常用句式】:1)描述数据:1. A survey has been made/conducted/carried out on...2.Recently a survey on...has been made/conducted/carried out among...3.As is shown in the table/chart/graph...4.According to the table/chart/graph, we can find that…5.According to the figures given by the graph…6.We can draw a conclusion from the chart that…2)分析原因:1.There are several reasons that account for this phenomenon.2. A number of factors contribute to/lead to/result in the change/phenomenon/increase...3) 发表看法:1. Personally/In my opinion/As far as I’m concerned/From my point of view…2. It is high time that we should …【范文】:日前,针对学生的零用钱(pocket money)的消费方向,你对你们市某中学的高中和初中的部分学生进行了问卷调查.得出数据如下表。
图表类小作文必备句型
图表类小作文必备句型
段落一,数据展示与对比。
看这儿,图表上明明白白地写着呢!去年第四季度销售额嗖嗖地涨了15%,这都是因为咱们推出了新产品,还调整了营销策略。
而那竞争对手,市场份额就像泄了气的皮球,咱们的市场地位就更加明显了。
段落二,趋势分析与预测。
瞅瞅过去五年的销售数据,咱们的产品在市场上稳扎稳打,就像爬山一样一步步往上走。
照这个势头下去,未来几年咱们市场份额肯定还能涨,盈利也能跟着水涨船高。
段落三,数据解读与结论。
图表上那些数字可是个好兆头!客户对咱们产品的满意度越来越高,这都得归功于产品质量和售后服务的提升。
这么一来,客户们更信任咱们了,公司的长期发展也更有保障了。
段落四,数据背后的故事。
这些数据可不是天上掉下来的,背后都是咱们团队的辛勤付出。
从市场调研到产品研发,再到市场推广,每个环节都少不了团队成
员的智慧和努力。
这些成绩,都是大家用汗水和智慧换来的。
段落五,数据的启发与启示。
看着这些数据,我心里就有数了。
想要在竞争激烈的市场中站
稳脚跟,就得不断创新,满足客户需求。
这些数据不仅仅是数字,
更是咱们未来发展的指南针。
图画,图表和话题写作万能模板

图画,图表和话题写作万能模板万能模板⼀:图画或图表作⽂模板⼤作⽂From the drawing/chart, we can learn that (描述图表内容). It can easily be seen that (容易的就可以看出)quite a lot of people think it is important for them (做某事很重要,当然这个important还可以换成1:必要的necessary、2:critical关键的、3:meaningful有意义的)to understand this situation. We can deduce that people’s opinions on this issue vary from person to person(我们可以推断出来⼈们对此观点是因⼈⽽异的).Some people take it for granted that (认为…理所当然的)it’s not their duty to show their concern to it and there’s one in million chan ces for them to have such an experience(⼤部分认为⾃⼰亲⾝遇到这个问题的机遇⽐较⼩并且也没必义务去关注此问题). For example, they firmly believe that they should not know how to confront and deal with it. (他们坚定地认为⾃⼰没必要知道该如何⾯对和解决这个问题)But they often neglect that fact that once everyone just has such an attitude towards this, something practical need to be changed will make it progress slowly(但是他们通常忽视这个事实,⼀旦⼤家都采取⽆为态度的话,事情本⾝就会慢慢发展到需要做出相应改变的状态). On the contrary(相反地), there are also another group of people who hold a different point of view. (相反,还有另外⼀群⼈有不同的观点)They think that they should take their shoulder on this matter and tell people what to do and how to do step by step. (他们认为他们应当对这件事情肩负起责任,并且告诉他⼈做什么,⼀步⼀步⼜该怎么做)At the same time, their duty should be strengthened to make it into the unconscious aware. (同时,⼈们应该慢慢培养起对这件事的责任感,并且成为⼀种共识)As far as I am concerned(我认为In my opinion,或改成总之:In a word / to sum up/All in all), my attitude for this matter is positive(根据图表是⽀持还是反对还可以换成消极:negative), with reasons as follows. (我对这件事情持有积极态度)As the problem has a far effect/influence on(造成影响)both society and our life, we should pay more attention to it.学⽣范⽂1:学⽣范⽂学⽣范⽂(图表写作)这篇范⽂中的话题是responsibility,责任感。
英语看图作文万能句子通用句型
英语看图作文万能句子通用句型在英语考试中,写作是占了很大的比重的,那么看图写作类型的该如何应对呢?今天店铺在这里为大家分享一些英语看图作文万能句子,希望对大家的英语写作能有所帮助!英语看图作文万能句子篇一第一段:总体描述图表,指明时间段,指出突出变化或不同常用句型或短语:As is clearly shown in the char/ table/graph, ___________According to the figures given in the table/chart/graph, ____________It can be seen from the table/chart/graph, _____________________.The figures in the table/chart reflect that ________________.especially, ________________(指出突出变化)第二段:(分析原因)There are several factors leading to this change / difference ……..There are several reasons for _____________.(引出原因)To begin with, _______(原因一)In addition, ______________(原因二0For example, _________(举例说明)Last but not the least, __________(原因三)To sum up——————————————(简要总结)第三段:自己的观点As for me, ____________On the one hand, ________on the other, ____In brief,_____________________.英语看图作文万能句子篇二表示逐句增长The number of …. has grown steadily from … to…..in 2009.has risen from ….shows a tendency to increaseclimbedwent sharply upsoaredtends to go up b/ increaseThere was a rapid / sharp / dramatic / gradual / slow increase / rise in the number of …. who….. The number of …. is on the rise / increase.The increase of …. has reached to ….表示数据降低The number of … dropped steadily from … to …in 2008.declined suddenlyfelltends to go downtendency to fallshows a tendency to decreaseThere was a sharp fall …. in the number of … in 2008.gradual decreasesudden reductionslow declinedrop英语看图作文万能句子篇三1:It is well-known to us that……(我们都知道……)==As far as my knowledge is concerned, …( 就我所知…)2:Recently the problem of…… has been brought into focus. ==Nowadays there is a growing concern over ……(最近……问题引起了关注)3:Nowadays(overpopulation)has become a problem we have to face.(现今,人口过剩已成为我们不得不面对的问题) 4:Internet has been playing an increasingly important role in our day-to-day life. It has brought a lot of benefits but has created some serious problems as well.(互联网已在我们的生活扮演着越来越重要的角色,它给我们带来了许多好处但也产生了一些严重的问题)5:With the rapid development of science and technology,more and more people believe that……(随着科技的迅速发展,越来越多的人认为……)6:It is a common belief that……==It is commonly believed that……(人们一般认为……)7:A lot of people seem to think that……(很多人似乎认为……) 8:It is universally acknowledged that + 句子(全世界都知道...)。
英语饼图作文万能模板
图表类作文常用的句型第一段:描述图表;第二段:分析原因/解释现象;第三段:总结。
一、第一段①句常用句型(大致描述)提供信息:The table provides information about…该表提供了有关……的信息。
展示趋势:The table clearly shows / demonstrates / depicts that …该表清楚地表明/证明/描述…由表可知:We can see from the above chart that…从上面的图表我们可以看出…It can be seen (from the chart) that…从图表中可以看出…As is shown from the above chart,…如上图所示,…It is manifest from the graph that…从图中可以看出…According to the table, …根据表格,…[图表]替换词:table(表格); chart(图表); pie chart(饼图); curve chart(曲线图); bar chart (柱状图); line chart(折线图).[表明/描述]替换词:show(表明); demonstrate(证明); depict(描述); portray(描绘); manifest(表明).[清晰地/明显地]替换词:clearly(清楚地); apparently(显然地); manifestly(明白地); obviously (明显地); explicitly(明确地).二、第一段②③句常用句型(细致描述)动态模板:The bar chart above demonstrates a change of _____ from the year to _____ respectively. According to the data given, we can easily notice that the number of _____ has a steady and slight increase from _____ in _____ to _____ in _____. Meanwhile, we find that thenumber _____ ascends sharply from _____ in _____ to _____ in _____.上述柱状图分别展示了_____年到_____年间_____的变化情况。
图表作文必备写作句子
图表作文首段:1. As illustrated by the figure/percentage in the table/ chart, XXX has been on the rise/decrease, dramatically rising/ decreasing from A% in 19XX to B% in xxxx. Judging from the sharp decline/ rise in the chart, we may conclude that …….2. From the above chart, we can see distinctly that A has witnessed an huge rise/decline as distinct from / in contrast to the drastic rise/decrease in B from 19XX to 20XX. In 19XX, the percentage/number of XX was…, However, by 20XX, the percentage/number of XX has wend down/soared up to X%.表示在过去十年间的表达:1.in a passage of a decade.2.over the past decade.3.in a matter of a decade.中间段:分析原因分析原因句型:1. Why are there such great changes during the past X years? In my opinion, three possible reasons contribute to it.2. Several factors can be identified to account for this problem/ phenomenon.图表作文结尾段:如果这篇文章讲的是一个令人担忧的问题,那么结尾段很可能是谈解决办法。
图表作文描述重点句型
图表作文描述重点句型一、图表作文写作常识1、图形种类及概述法:图表作文有表格(table)柱形图(bar chart)饼状图(pie chart)折线图(diagram /line chart)综述:数字图表称table,后三种称chart2、表达框架第一段描述图表①From/According to the table/ chart, we can see/conclude …图表上方黑标题……Taking a closer look at the figures,①the table shows the changes in the number of……over the period from……to……该表格描述了在……年之……年间……数量的变化。
②we will find a very steady (marked/sharp/rapid/dramatic) rise/increase/ drop (decrease/ decline/ fall/ reduction) in 1998/from 1998 to 2002/ compared with that of last year).③this table shows the changing proportion of a & b from……to……该表格描述了……年到……年间a与b的比例关系④the graph,presented in a pie chart,shows that …playsa very important role in….该图以圆形图形式描述了…在…领域的重要作用⑤A…which accounts for...%,ranks the first; then next is B with...%;followed by C; constituting...%;finally it comes D.E.F at ...% ...% and ...% respectively⑥…decreased year by year while…increased steadily.……逐年减少,而……逐步上升。
图表作文写作常用句型

★以下是英语资源频道为大家整理的《图表作文写作常用句型》,供大家参考。
对于大多数中国考生而言,图表作文这种题型相对比较陌生,写起来感到特别棘手,因为有时要看懂图表都需要花很长的时间,更何况在30分钟内要用英语准确、清晰、简明扼要地描述出来,并且还要分析图表。
结合图表写作的特点、难点和考生的弱点,这里,我们提供了大量实用、好用、易学的常用句型和结构,供考生参考。
希望对考生在短时间内迅速提高图表作文写作能力有很大的帮助。
● ● 表示“说明”的常用句式在说明图表的时候,要使用下列表示“说明”的常用句式,它们可以帮助读者弄清楚所引信息的出处,有效地将你要说的话带出来。
1.As we can see from the chart/graph / table/diagram,…从图表中可以看出…… 2.The chart/graph / table/diagram shows/d isplays that,…如图所示…… 3.As can be shown in/According to the chart/graph / table/diagram,…如图所示…… 4.The figures/statistics in the chart reflect/show/reveal that… 图表中的数据表明…… 5.The chart/graph/table/diagram illustrates/describes…图表描述了…… 6.It is clear/apparent from the chart/graph / table/diagram that… 从图表我们可以清楚地看到…… ● 表示“数据”的常用句式 1.…had the largest percentage/proportion of… ……在……方面具有很大的百分比。
2.…account (s) for /take (s) up 10%.……占有10%。
图表作文背诵句型

图表作文一、常用句式与结构1、对图表的描述1)介绍图表showndescribed graph, …As is illustrated in the chart, …indicated table, …revealedtable, …As can be clearly seen from the chart, …graph, …According toAs can be seen from the table…It can be seen fromIt is self-evidentIt goes without saying that …There is no denying the fact2) 数据变化的表达方法suddenlyincrease rapidlyjump dramaticallyThe number / amount of …rise sharply/ steadily from….to….decrease graduallydropped slowlyfall slightlysuddenrapiddramatic increaseThere is a significant jump in the number ofsharp rise amount from… to…steady decreasegradual dropslow fallslight3) 统计数据的表达方法Twice as many asThree times muchOne fifthA quarter ofA thirdA half4) 开头和结尾的常用句型(1)The two graphs describe the same thing seen in two different ways.(2)The first diagram simply records…(3) The second graph throws a new light on…(4) The key findings taken from the surveys are follows:…(5) This table provides several important points of comparison between A andB.(6) It is obvious in the graphic/ table that the rate/number/amount of Y has undergone dramatic changes.(7) It has gone up/ grown/fallen/dropped considerably in recent years (as X varies). At the point of X1, Y reaches its peak value of …(8) What is the reason for this change? Mainly there are…reasons behind the situation reflected in the graphic/ table. First of all,…. More importantly,…Most important of all,…(9) From the above discussions, we have enough reason to predict what will happen in the near future.(10)The trend describe in the graphic/table will continue for quite a long time if necessary measure are not taken.2、对于线性图表的描述1)对于各种趋势的描述2)对于上升到某个位置的描述:(1) A 组中的动词+ to+具体数据(2) A 组中的动词+ to+the peak of +具体数据(3) A 组中的动词+ reaching the peak of +具体数据(4) A 组中的动词+ reaching+具体数据(5) to peak at +具体数据(6) to climb to +具体数据3)对于上升的程度的描述:(1) A 组中的动词+ by+具体数据(2) A 组中的动词+副词4)对于下降到某个位置的描述:(1) C组中的动词+ to+具体数据(2) C 组中的动词+ to the bottom of +具体数据(3) C 组中的动词+ reaching the bottom of +具体数据(4) C 组中的动词+ reaching+具体数据5)对于下降程度的描述:(1) C组中的动词+ by+具体数据(2) C组中的动词+副词6)对于上升和下降趋势的组合描述:(嵌入了时间和程度之后)3、对于柱状图形的描述(可见线性图形)4、对于饼状图形的描述二、常用词与短语图表类型:table, chart, diagram, graph, column chart, pie graph描述:show, describe, illustrate, can be seen from, clear, apparent, reveal, represent内容:figure, statistic, number, percentage, proportion(成比例)上升:increase, rise, ascend(上升) , surge, go up, climb, mount(增长), level up下降:decrease, fall, drop, descend, decline, reduce, lessen(减少), level down平稳:stable, steady, remain/maintain/keep/ be the same as/ similar to波动:fluctuate, fluctuation, rise and fall up and down占:occupy, take up, account for, gain而:while, however, whereas, on the other hand, actually/ in fact相比:by contract, on the contrary, likewise, compared with最高点:the highest, the top, the summit(定点), the peak, the most最低点:bottom, less, least, rock bottom平均:mean(平均数), average趋势:tendency, trend, inclination(倾斜)预见:prediction达到顶峰:mount to占比例:gain the percentage of有一个稳定的过程:a stable period can be seen。
英语图表作文常用句型和结构
英语图表作文常用句型和结构1) 常用的开篇句型(概述图表内容、描述总趋势)The table/chart/graph/diagram shows the changes in the number of...over the period from...to...该表格描述了在...年之...年间...数量的变化。
According to the table, we can see/conclude that …根据该表/图/数字,我们可知……The chart/table/graph…reveals (/reflects/shows) that …该表/图表明……The figures provided in the chart show (that)... 数据(字)表明...The graph provides some interesting data regarding/about/on/of...该图为我们提供了有关...有趣数据。
As can be seen from the diagram, great changes have taken place in...从图中可以看出,...发生了巨大变化。
As is shown (illustrated/indicated) in the pie chart ( that)….…如图所示...From the chart, we know that... 从这张表中,我们可知..It can be seen /concluded from the line /bar/chart /table that ….There is a great difference (a sharp contrast) between …The data/statistics/figures lead us to the conclusion that...这些数据资料令我们得出结论...All these data clearly prove the fact that... 所有这些数据明显证明这一事实,即...The graphs show a threefold increase in the number of...该图表表明...的数目增长了三倍。
图表作文模板和句型.doc
图表作文图形(figure)>表格(table)>曲线图(graph)、柱状图(pie chart)和饼状图(pie chart)前半部分说明图标所表达的信息,后半部分进行议论,最常见的模式是:第一段:描述现状。
简要地描述图表,概括图表所表现的社会问题。
第二段:分析原因。
剖析图表所反映的深层次问题。
用图表来论证第一段提出的主题,或者分析各个数据产生的原因。
第三段:结论和启示。
从图表中所体现的现象获得结论或者启示,或者对图标所表现的趋势加以预测。
图表作文模式:①As is shown/depicted/described in the picture/chart,概括图表内容。
②For one thing,支持这一内容的一个方面。
③For another,支持这一内容的另外一个方面。
④It is obvious that图表所反映的内容。
⑤Many remarkable factors contribute to 主题。
⑥First of all,理由一。
⑦In addition,理由二。
©Thirdly,理由三。
⑨ Considering all these, I believe that 我的看法或偏好。
⑩ First of all,个人看法的依据一。
(ll)Furthermore,个人看法的依据二。
(12)Therefore,个人的结论或文章的结论。
Example:It is obvious in the graph/table that the rate/number/amount of Y has undergone dramatic changes. It has gone up/grown/follen/dropped considerably in recent years (as X varies). At the point of (接近)X1, Y reaches its peak value of ...(多少).What is the reason for this change? Mainly there are ...(多少)reasons behind the situation reflected in the graphic/table. First of all, ...(第一个原因).More importantly, ...(第二个原因).Most important of all, ...(第三个原因).From the above discussions, we have enough reason to predict what will happenin the near future. The trend described in the graph/table will continue for quite a long time (if necessary measures are not taken括号里的使用于那些不太好的变化趋势). 描写图表和数据的句型:1.篇首As we can see from the chart/ As is shown in the table/ According to the table,the price of oil increased dramatically.2.数据变化常用句型数据的增K:There was a rapid/sharp /dramatic/gradual/slow increase/rise in the number of students.The number of students is on the rise/on the increase.数据的降低The number of ... dropped steadily from / declined suddenly / fell/ tends to go down/ shows a tendency to decrease.…There is a sharp fall/ gradual decrease/ sudden reduction / slow decline / drop ..in the number of ..in 2006.数据的持平There was little change/hardly any change in the number of between ...and .../表示比较级、倍数、比例关系表示比较Compared A with BI prefer to read rather than watch TV.表示数量It has increased (decreased) from... to...The output of July in this factory increased by 15 % compared with that ofbe in direct ratio to/with J 我正比 be in inverse ratio to/with 成;反 比 have the largest percentage /proportion of 占最大比例the number of.. makes up /takes up / accounts for fifty percent of the total. 占总量的50%Compared with...,... has a higher / lower percentage 与。
图表作文表达用语
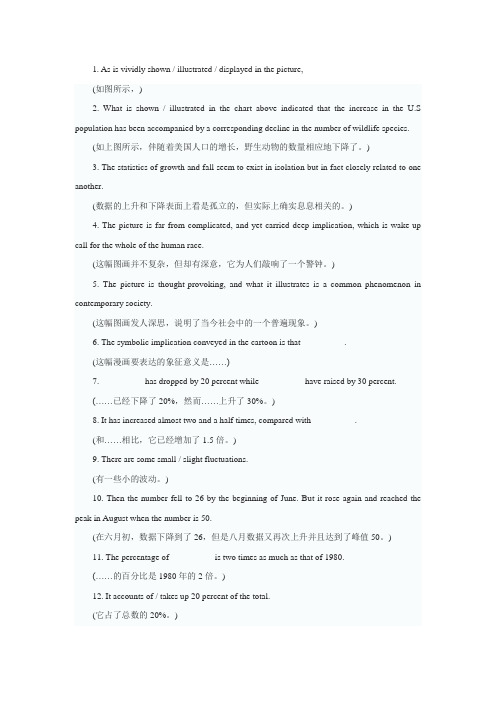
1. As is vividly shown / illustrated / displayed in the picture,(如图所示,)2. What is shown / illustrated in the chart above indicated that the increase in the U.S population has been accompanied by a corresponding decline in the number of wildlife species.(如上图所示,伴随着美国人口的增长,野生动物的数量相应地下降了。
)3. The statistics of growth and fall seem to exist in isolation but in fact closely related to one another.(数据的上升和下降表面上看是孤立的,但实际上确实息息相关的。
)4. The picture is far from complicated, and yet carried deep implication, which is wake-up call for the whole of the human race.(这幅图画并不复杂,但却有深意,它为人们敲响了一个警钟。
)5. The picture is thought-provoking, and what it illustrates is a common phenomenon in contemporary society.(这幅图画发人深思,说明了当今社会中的一个普遍现象。
)6. The symbolic implication conveyed in the cartoon is that__________.(这幅漫画要表达的象征意义是……)7.__________ has dropped by 20 percent while __________have raised by 30 percent.(……已经下降了20%,然而……上升了30%。
图表、画作文常用句型及高分词汇
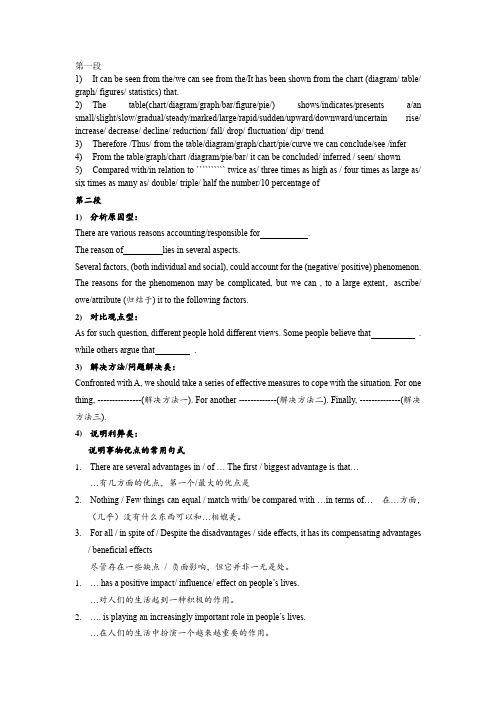
第一段1)It can be seen from the/we can see from the/It has been shown from the chart (diagram/ table/ graph/ figures/ statistics) that.2)The table(chart/diagram/graph/bar/figure/pie/) shows/indicates/presents a/an small/slight/slow/gradual/steady/marked/large/rapid/sudden/upward/downward/uncertain rise/ increase/ decrease/ decline/ reduction/ fall/ drop/ fluctuation/ dip/ trend3)Therefore /Thus/ from the table/diagram/graph/chart/pie/curve we can conclude/see /infer4)From the table/graph/chart /diagram/pie/bar/ it can be concluded/ inferred / seen/ shown5)Compared with/in relation to `````````` twice as/ three times as high as / four times as large as/ six times as many as/ double/ triple/ half the number/10 percentage of第二段1)分析原因型:There are various reasons accounting/responsible for .The reason of lies in several aspects.Several factors, (both individual and social), could account for the (negative/ positive) phenomenon.The reasons for the phenomenon may be complicated, but we can , to a large extent,ascribe/owe/attribute (归结于) it to the following factors.2)对比观点型:As for such question, different people hold different views. Some people believe that .while others argue that .3)解决方法/问题解决类:Confronted with A, we should take a series of effective measures to cope with the situation. For onething, ---------------(解决方法一). For another -------------(解决方法二). Finally, --------------(解决方法三).4)说明利弊类:说明事物优点的常用句式1.There are several advantages in / of … The first / biggest advantage is that……有几方面的优点,第一个/最大的优点是2. Nothing / Few things can equal / match with/ be compared with …in terms of… 在…方面,(几乎)没有什么东西可以和…相媲美。
图表作文常用的表达法
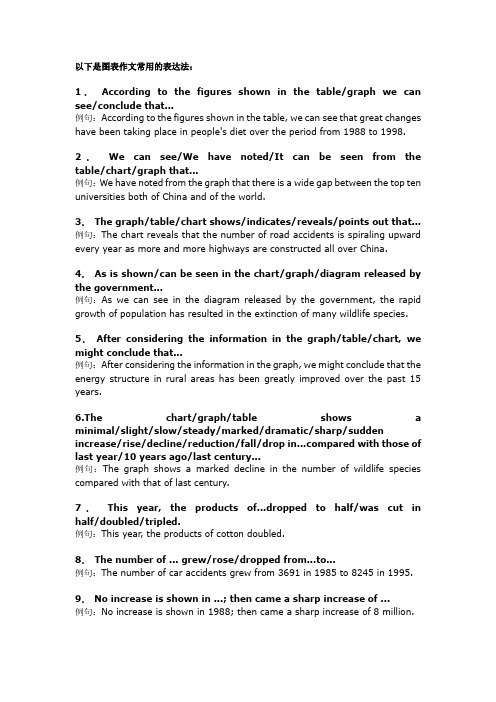
以下是图表作文常用的表达法:1.According to the figures shown in the table/graph we can see/conclude that...例句:According to the figures shown in the table, we can see that great changes have been taking place in people's diet over the period from 1988 to 1998.2.We can see/We have noted/It can be seen from the table/chart/graph that...例句:We have noted from the graph that there is a wide gap between the top ten universities both of China and of the world.3.The graph/table/chart shows/indicates/reveals/points out that...例句:The chart reveals that the number of road accidents is spiraling upward every year as more and more highways are constructed all over China.4.As is shown/can be seen in the chart/graph/diagram released by the government...例句:As we can see in the diagram released by the government, the rapid growth of population has resulted in the extinction of many wildlife species.5.After considering the information in the graph/table/chart, we might conclude that...例句:After considering the information in the graph, we might conclude that the energy structure in rural areas has been greatly improved over the past 15 years.6.The chart/graph/table shows a minimal/slight/slow/steady/marked/dramatic/sharp/sudden increase/rise/decline/reduction/fall/drop pared with those of last year/10 years ago/last century...例句:The graph shows a marked decline in the number of wildlife species compared with that of last century.7.This year, the products of...dropped to half/was cut in half/doubled/tripled.例句:This year, the products of cotton doubled.8.The number of ... grew/rose/dropped from...to...例句:The number of car accidents grew from 3691 in 1985 to 8245 in 1995.9.No increase is shown in ...; then came a sharp increase of ...例句:No increase is shown in 1988; then came a sharp increase of 8 million.10.Sth. is twice/three/half as large/high/much as sth. else.例句:The production of cotton is twice as much as that of wheat.11.The table/chart/graph represents the development and changes in ...例句:The table represents the development and changes in agriculture structure in the past 30 years.12.By comparison with..., it dropped/ fell/ decreased from...to.../ by...例句:By comparison with 1990, it dropped by 15 percent.13.There appeared an even more stable/consistent/steady tendency to rise/drop.14.The curve has leveled off/stayed the same/remained unchanged for 2 years and the trend will be continuing .一、在运动范畴中存在着如下的8种运动趋向:1.保持平稳:我们可以使用的套用结构有:stay stable/remain steady.举例:表示人口数量保持平稳的时候可以写:the number of population stayed stable./the number of population remained steady.2.上升/增加:我们可以使用的套用结构有:rise/climb/increase/ascend /mount/aggrandize(增加) 举例:人口上升:the number of population increased/ascended/mounted等等。
2020年中考英语作文万能模板:图表类作文
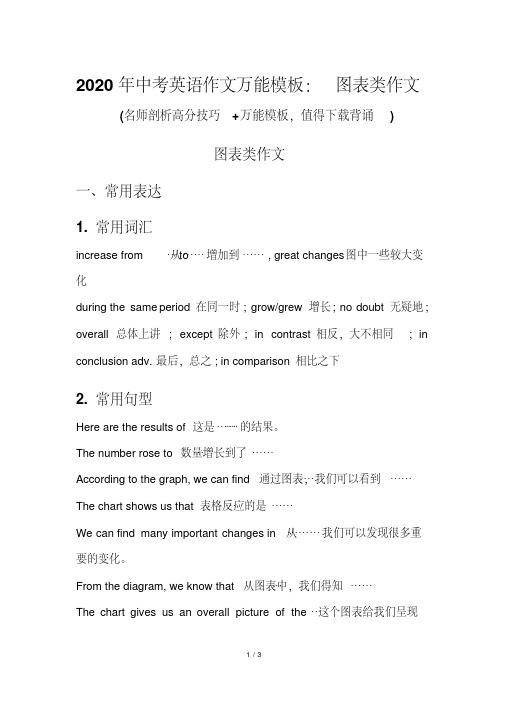
2020年中考英语作文万能模板:图表类作文(名师剖析高分技巧+万能模板,值得下载背诵)图表类作文一、常用表达1. 常用词汇从……增加到……, great changes 图中一些较大变increase from …to化during the same period 在同一时; grow/grew 增长; no doubt 无疑地; overall 总体上讲; except 除外; in contrast 相反,大不相同; in conclusion adv. 最后,总之; in comparison 相比之下2. 常用句型这是……的结果。
Here are the results of…The number rose to…数量增长到了……通过图表,我们可以看到……According to the graph, we can find…表格反应的是……The chart shows us that…从……我们可以发现很多重We can find many important changes in…要的变化。
From the diagram, we know that…从图表中,我们得知……The chart gives us an overall picture of the…这个图表给我们呈现了……The figures also tell us that …这些数字也告诉了我们……Judging from these figures, we can draw the conclusion…通过这些数字,我们可以得出这样的结论……The reason for this, as far as I am concerned is …据我所知,原因是……二、万能模板三、满分作文最近,学校就空中俱乐部的英语学习内容设置做了意向调查(结果见下面图表)。
请你帮俱乐部用英语写一篇报告,并谈谈你自己的想法或建议。
图表类作文常用词汇及句式

图表类作文常用词汇及句式(图表/数据):table、graph、chart、figure动词:show、tell、describe、represent表示上升的动词:increase、rise、climb、go up表示上升的名词:rise、increase表示下降的动词:fall、decline、decrease、drop、go down、reduce表示下降的名词:fall、decline、decrease、drop表示平稳的词:remain steady、remain unchanged、not change表示上升趋势:There is (was) an upward trend in (toward)表示下降趋势:There is (was) a downward trend in (toward)表示达到顶峰:reaches (reached) its peak、reaches its highest point表示达到最低点:reaches (reached) its lowest point图表类作文常用句式The table shows (indicates) that a great number of people spent their holidays traveling abroad.As we can see from the graph , the rate dropped slightly from 38% in 1993 to 31% in 2003.…From the table we can find out that only 35% of the people have taken in physical activities.…According to Chart I, the number was ten times as many as in 1995.Compared with the boys, the girls show more interested in chatting.The number of the boys playing games is much larger than that of the girls.The number of...is equal to that of...It doubled the number of last year.It is clear from the chart that as incomes increase people can afford to live more comfortably and eat well.图标类作文常用套语As can be seen from the chart,only 10% of the time is taken up with sports activities.…As is shown in the chart,the production last month rose so significantly…As is described in the chart, the total number of visitors to the United States had nearly doubled to 2.7 million person by 1974.图标类作文常用结束语After giving a careful consideration to the problem, I think I will be able to select the one who best fits the position.Therefore, we need to educate our children, warning them of the dangers of playing with matches.In conclusion, the upward trends suggest that more and more computer users will have access to Internet in the future.In summary, smoking increased three different times and declined twice, with the last downward trend still continuing.图表作文模板As is shown/indicated/illustrated by the figure/percentage in the table(graph/picture/pie/chart), _作文题目的议题_has been on rise (goesup/increases/drops/decreases),significantly/dramatically/ steadily rising/decreasing from_% in _年_ to _%_ in _年_.From the sharp/marked decline/ rise in the chart, it goes without saying that __现象总结___.There are at least two good reasons accounting for __. On the one hand, ____.On the other hand,___ is due to the fact that __.In addition, __ is responsiblefor ___.(Maybe there are some other reasons to show ______.But it is generally believed that the above mentioned reasons are commonly convincing.As far as I am concerned,I hold the point of view that _______. 再加上对策、口号。
- 1、下载文档前请自行甄别文档内容的完整性,平台不提供额外的编辑、内容补充、找答案等附加服务。
- 2、"仅部分预览"的文档,不可在线预览部分如存在完整性等问题,可反馈申请退款(可完整预览的文档不适用该条件!)。
- 3、如文档侵犯您的权益,请联系客服反馈,我们会尽快为您处理(人工客服工作时间:9:00-18:30)。
图画图表作文常用语言及通用句式1、图的种类及相关表达漫画cartoon(亦可做连环漫画,讽刺漫画),caricature漫画家cartoonist迪斯尼动画片 a Walt Disney Cartoon图片picture照片、相片photograph图形graph,chart,diagram,illustration饼图,圆形图pie chart,pie graph条形图,柱状图bar chart,column chart,histogram直线图,曲线图line chart,curve diagram表格图table程序图processing diagram,procedures diagram流程图,过程图flow chart,sequence diagram树型图tree diagram线条line直线the straight line虚线the dotted line肖像绘画portrait painting轮廓,外形outline2、图表数据的种类及相关表达数字figure 数量,数字number 数据,信息data统计数据statistic 比例proportion 百分比percentage3、图表作文通用句式a)The table shows the change in the number of …over the period from …to…该表格描述了从…年至…年间…数量的变化。
b)The bar chart illustrates that ..该柱状图展示了……c)The pie graph depicts that…该圆形图揭示了……d)The tree diagram reveal how..该树形图向我们揭示了该如何……e)The data ( statistics , figures) lead us to the conclusion that …这些数据资料令我们的出结论…f)This is a graph which illustrates …这个图表向我们展示了…g)This table shows the changing proportion of a & b from… to …该表格描述了从…年到…年间a与b的比例关系。
h)The graph, presented in a pie chart, shows the general trend in …该图以圆形图形式描述了……总的趋势。
i)This is a column chart showing …这个柱形图描述了……j)As can be seen from the graph ,the two curves show the fluctuation of …如图所示,两条曲线描述了……的波动情况。
k)Over the period from … to … the … remained level在……到……期间,…基本不变l)The number of …remained steady, stable from(year, month) to (year, month).……(年,月)至……(年,月……的数量基本不变。
m)The number sharply went up to…数字急剧上升至……n)4、数据变化及相关表达1、不变保持不变remain level 数据固定不变fix in time 稳定remain stable,stabilize,level off2、变化在一系列的时间段重点中转变changes over time增加increase,raise,rise,go up,surge,climb,mount……减少decrease,grown down,drop,fall,descend,decline,reduce,lessen……波动fluctuate,undulate,wave,rise and fall,up and down……3、表程度迅速的,飞快的,险峻的rapid,rapidly戏剧性的,生动的dramatic,dramatically 有意义的,重大的,重要的significant,significantly 锐利的,明显的,急剧的sharp,sharply急剧(升降)的steep,steeply稳固的,坚定不移的steady,steadily渐进的、逐渐的gradual,gradually缓慢的、不活跃的slow,slowly轻微的、略微的slight,slightly稳定的stable,stably一些较大变化significant changes明显趋势noticeable trend在同一时期during the same period 分布、时区distribute不相等地unequally4、表比较占44%比例account for 44 percent,made up 44 percent位居第一rank the first仅次于be second to位居第二位in second spot与……相比compare with,by contrast,on the contrary,likewise A与B成比例A be in proportion to B5、其他平均mean,average趋势tendency,trend,inclination由……组成consist of,be made up of,be composed of5、图画作文通用句式a)The intended meaning of the photo above is pressing and far-reaching.上面图画要表达的意义迫切而深远。
b)As is truly demonstrated in the photo above.正如上图所真实展现地那样……c)As is vividly betrayed in the drawing above.正如上图生动表现地那样……d)The cartoon vividly illustrates.这幅卡通画生动地描述了……e)As is vividly depicted in the picture.正如图片所生动描述地……f)The purpose of the drawing is to show us that ……这副图画是为了想我们展示……g)This picture demonstrates one of the basic theories of philosophy:这幅图片展现了哲学的一个基本理论:h)Such an image draws attention to the fact that ……这样一种形象吸引我们注意到这样的现实……i)The scene drawn in the above picture is this:上图所画的情形是:j)It is obvious that the drawer wishes all of us……很明显,图画作者希望我们所有人都……k)It is obvious that the drawer of this picture wants to draw our attention towards……很明显,图画作者希望我们所有人都注意……l)As can be seen from the drawings……正如从图画中所看到的那样……m)Looking at the picture , we can’t help thinking of the more and more serious phenomenon of ……看着这幅图片,我们不禁想到越来越严重的……现象。
n)The pictures serve to remind us of……这幅图画使我们想起……o)It is obvious that the drawer wants all of us to……很明显,画的作者想让我们都……p)In this picture,在这幅图片中q)These two pictures remind us of ……这两幅图片提醒了我们……r)From the picture above, we can see that ……从上面的图片,我们可以看出……s)In this picture, we are surprised to see ……在图片中,我们惊讶地看到……t)As is described in the picture,正如图中所描述的那样……u)What can we say at seeing such pictures?看到这样的图片我们能说些什么呢?v)What an ironic cartoon it is!这是一幅多么具有讽刺意味的卡通画呀!w)It’s quite obvious that drawer wishes to draw our attention to this most unfavorable social phenomenon.很明显,画的作者希望我们注意到这一幅不受欢迎的社会现象。
x) A heart-breaking scene is witnessed by the photographer of this picture.这张图片的摄影师见证了这一令人心碎的场面。
y)Two pictures above describe a story which we would never wish to encounter. In the first one ,……. In the second picture …….上面的两张图片描述了一个故事,其中的场景是我们最不愿碰到的。
第一幅……第二幅……。
z)This is not uncommon picture in our life.这幅图片所描述的情形在我们的生活中很常见。
aa)This picture inevitable invites a series of questions:这幅图片不可避免地提出了一系列的问题。
bb)What the picture above intends to convey is a typical example.上面图画想传达的是一个典型的例证。
cc)Under the picture, there was a thought-provoking sentence.图画下面有一句发人深省的话。
dd)The picture describes a prevailing phenomenon.这幅图片描述了一个当今流行的现象。