图表图画型作文
高考英语图表图画式作文
图表/图画式作文【特点】:将图表形式的信息转换成文字信息。
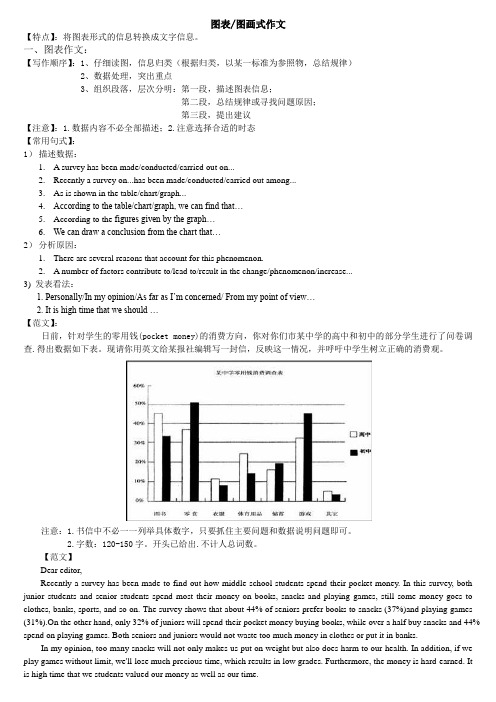
一、图表作文:【写作顺序】:1、仔细读图,信息归类(根据归类,以某一标准为参照物,总结规律)2、数据处理,突出重点3、组织段落,层次分明:第一段,描述图表信息;第二段,总结规律或寻找问题原因;第三段,提出建议【注意】:1.数据内容不必全部描述;2.注意选择合适的时态【常用句式】:1)描述数据:1. A survey has been made/conducted/carried out on...2.Recently a survey on...has been made/conducted/carried out among...3.As is shown in the table/chart/graph...4.According to the table/chart/graph, we can find that…5.According to the figures given by the graph…6.We can draw a conclusion from the chart that…2)分析原因:1.There are several reasons that account for this phenomenon.2. A number of factors contribute to/lead to/result in the change/phenomenon/increase...3) 发表看法:1. Personally/In my opinion/As far as I’m concerned/From my point of view…2. It is high time that we should …【范文】:日前,针对学生的零用钱(pocket money)的消费方向,你对你们市某中学的高中和初中的部分学生进行了问卷调查.得出数据如下表。
2020年大学英语四级作文万能模板:图表图画型范文(七)

2020年大学英语四级作文万能模板:图表图画型范文(七)四级作文题目:Film Is Giving Way to TVIt can be seen from the graph that the rate of car accidents in Walton City experienced rises and falls in 1990. From January to March last year it increased by 45%. From March to June it dropped by about half the previous rate.From June to August there was a steep rise of 50%. After that, however, there was a steady decrease.There are several reasons for this improvement, but the following are the most critical ones. First, new traffic regulations have made drivers more careful. Second, more people are using bicycles for transportation. Finally, in the later part of the year good weather made the roads safer to drive on.I am confident that there will be even fewer caraccidents in Walton in the future. First, major roads have been repaired and the number of public buses has been increased in the past few months. Moreover, a traffic safety campaign has made all the local people more aware of the dangers of unsafe driving.。
2014年12月大学英语四级作文范文:图表图画型
2014年12月四级作文范文:图表图画型(共四篇)一2014年12月英语四六级作文图表图画型范文(一):Traveling Abroad四级作文题目:Traveling AbroadIt can be seen from the chart that there have been sharp increases in the number of people traveling abroad in City X in the past decade. As the chart shows, the year 1995 witnessed only about 10,000 people from this city touring abroad. In 2000, the number soared to nearly 40,000. Last year, more than 120,000 people in the city chose to spend their vacations outside China.A number of factors account for the change in the chart, but the following are the most critical ones. First, thanks to the policy of reform and opening-up, the nation's economy has been developing at a considerably high speed in the past decades. Therefore, the people have more extra money for traveling. Secondly, other relevant state policies and the boom of touring industry provide citizens with more opportunities to go out and see the world. Last but not least, people have attached greater importance to the quality of life, thus they spend more money and time traveling and sight-seeing.In a word, this chart is a perfect indicator of China's fast expanding economy and people's rising standard of life. The trend of traveling abroad will further stimulate the development of our economy and broaden people's horizons.2014年12月英语四六级作文图表图画型范文(二):Reading Preferences四级作文题目:Reading PreferencesIt can be seen from the table that popular fiction is most popular with American students, accounting for 65.9% of book circulation in the library. General nonfiction comes next, taking up 18.2%, while books concerning science, technology and education take up only 10.8%. The least preferred category is that of art, literature and poetry, with a circulation rate of merely 5.1%.A number of factors could account for the reading preferences, but the following are the most critical ones. Firstly, popular fiction is fascinating to the young students. Secondly, books about science and technology are usually too complex and difficult to read. They often contain many special terms which most students can't understand. Finally, in today's market economy, much more emphasis is laid on practical and vocational books rather than arts or poetry.When it comes to me, poetry and art are my favorites. Such kind of books can nourish my mind, broaden my horizons and render me a fresh feeling. Reading a piece of good poetry tends to relieve my burden and lessen my tension, making me more creative and dynamic. It gets me into an imaginary world, fresh and beautiful. I just love it!2014年12月英语四六级作文图表图画型范文(三):Changes in the Ownership of Houses in China四级作文题目:Changes in the Ownership of Houses in ChinaIt can be seen from the chart that there have been dramatic changesin the ownership of houses in China in the past 50 years. While the percentage of state-owned houses has dropped from 70% in 1950's to 20% in 1990's, that of private houses has soared from 30% to 80% during the same period of time.A number of factors could account for the change in the chart, butthe following are the most critical ones. First, thanks to the policy of reform and opening-up, the nation's economy has been developing at a considerably high speed in the past decades. Therefore, people have more extra money to improve their housing. Secondly, other relevant state policies and the boom of real estate industry provide citizens with more opportunities to choose their own dwelling places. Last but not least, people have attached greater importance to their quality of life. Thusmore of them have purchased houses in their own favor.In a word, this chart is a perfect index of China's fast expanding economy and people's rising standard of living. Although a series of problems have arisen in the process, it is reasonable for us to believe that they can be solved in the near future with effective measures taken byboth the government and the public.2014年12月英语四六级作文图表图画型范文(四):Student Use of Computer四级作文题目:Student Use of ComputerStudents tend to use computers more and more frequently nowadays. Reading this chart, we can find that the average number of hours a student spends on the computer per week has increased sharply. In 1990, it was less than 2 hours; and in 1995, it increased to almost 4 hours, and in 2000, the number soared to 20 hours.Obviously computers are becoming increasingly popular. There are several reasons for this change. First, computers facilitate us in more aspects of life. Also, the fast development of the Internet enlarges our demands for using computers. We can easily contact with friends in remote places through the Internet. Besides, the prices of computers are getting lower and lower, which enables more students to purchase them.However, there still exist some problems, such as poor quality,out-of-date designs and so on. And how to balance the time between using computers and studying is also a serious problem. Anyhow, we will benefit a lot from computers as long as we use them properly.。
2020年大学英语四级作文题目模板:图表图画型范文(五)

2020年大学英语四级作文题目模板:图表图画型范文(五)四级作文题目: Health Gains in Developing CountriesIt can be seen from the charts that there have been dramatic changes in life expectancy and infant mortality in developing countries in the past decades. As the chart shows, people's life expectancy soared from 40 years old to 60 years old from 1960 to 1990. Meanwhile, infant mortality declined from 200 to 150 deaths per thousand births.The changes in the charts may be attributed to a numberof factors, but the following are the most critical ones. First, developing countries' economy has been developing at a considerably high speed in the past decades. Therefore,people have more extra money to improve their health. Secondly, the advances in medical sciences and boom ofmedical industry provide citizens with more opportunities to cure their diseases. Last but not least, people have attached greater importance to their quality of life, thus they have spent more money and time to build up their bodies.In a word, these charts are perfect indexes of developing nations' fast expanding economy and people's rising standardof life. Although a series of problems have arisen in the process, it is reasonable for us to believe that they can be solved in the near future with effective measures taken byboth the government and the public.(或If this trend continues, developing countries willsoon approach the developed countries in terms of health care.People will live longer and healthier lives. The result of this will be happier and more productive populations.)。
图表图画题型作文-英语写作指导
主题句+原因1+原因2+原因3 如,Several factors contribute to (原因1) . And (原因2) . Furthermore, (原因3) . All these result in ____.
第三段、说明影响或者提出解决办法 主题句+建议+前景预测
The main reason why so many traffic accidents have happened is that the roads are too crowded and people ignore traffic rules. In order to reduce the traffic accidents, first, the government should take some proper measures, such as developing public traffics. Second, people should obey traffic rules, especially the drivers. Only when people have decided to take action will traffic problems be solved.
《创新ቤተ መጻሕፍቲ ባይዱ计》 P227
根据图示,为报社写一篇关于我国交通事故的 报告,并对这种情况提出改进措施。
•
The number of the traffic accidents has been growing in recent years. As can be seen from the graph, in 2004 there occurred 570,000 traffic accidents, in which 109,000 people got killed. By October 2005, the number of the accidents reached 566,000 and 95,600 people lost their lives. While the number of the cars makes up only 2% of the total of the world, the rate of the deaths is 22%, making China a country with the highest death rate of traffic accidents in the world.
2020年四级作文万能模板:图表图画型范文(五)

2020年四级作文万能模板:图表图画型范文(五)四级作文题目: Health Gains in Developing CountriesIt can be seen from the charts that there have been dramatic changes in life expectancy and infant mortality in developing countries in the past decades. As the chart shows, people's life expectancy soared from 40 years old to 60 years old from 1960 to 1990. Meanwhile, infant mortality declined from 200 to 150 deaths per thousand births.The changes in the charts may be attributed to a numberof factors, but the following are the most critical ones. First, developing countries' economy has been developing at a considerably high speed in the past decades. Therefore,people have more extra money to improve their health. Secondly, the advances in medical sciences and boom ofmedical industry provide citizens with more opportunities to cure their diseases. Last but not least, people have attached greater importance to their quality of life, thus they have spent more money and time to build up their bodies.In a word, these charts are perfect indexes of developing nations' fast expanding economy and people's rising standardof life. Although a series of problems have arisen in the process, it is reasonable for us to believe that they can be solved in the near future with effective measures taken byboth the government and the public.(或If this trend continues, developing countries willsoon approach the developed countries in terms of health care. People will live longer and healthier lives. The result ofthis will be happier and more productive populations.)。
15画图图表类作文2023年中考英语书面表达(写作步骤满分范文词句积累)
备战2023年中考英语书面表达(写作步骤+满分范文+词句积累)图画+图表作文第七章图画作文图画作文是根据一幅或多幅图画以及汉语提示展开合理想象,写出几句话或一篇短文.看图作文多以记叙文或说明文为主,一般要求考生根据所给的图示介绍一个地方或一件物品,或者叙述过去或将来发生的故事.图画类作文的书面表达具有生动、直观、具体的特点.与其他类型作文的不同之处在于,它除了考查学生将图画内容转化为文字信息的能力以外,还考查学生的观察能力、分析能力和想象能力.写法点拨1.认真读图,把握要点.一般说来,所给的几幅图通常是一个小故事或小事件,这个小故事或小事件就是这组图画所要表达的主要内容.除此之外,还要考虑各图之间的关系,以及图画表达的人物、事件、地点、时间等.2.初步构思,拟定提纲.把握了文章的要点后,应在内心构思一个基本的框架,并考虑使用哪种体裁来进行写作,并确定人称、时态等细节.3.连词成句,连句成文.根据内容要点用恰当的词汇表达各图的意思,然后扩展成句子,再将这些句子串联成文.串连时,要注意使用过渡词或过渡句,使上下文更为紧凑、自然.参考模板The cartoon/picture is sending a message about__________ (图画内容)It reveals. __________ (稍作评价)Apparently,(将个人观点和图片内容相结合,得出观点)For one thing, __________.(原因一)For another thing, .(原因二)For example, __________ Last but not least, __________.(原因三)Therefore, it is necessary for us to__________.(建议或措施)Only in this way can we__________.(展望结果)In conclusion, __________.(再次表明观点或态度)We should__________.(进一步说明个人的观点)必备词汇cartoon卡通;漫画vivid生动的remind提醒indicate表明reflect反映illustrate阐明;举例说明depict描述describe描述imply意味着serious严重的cause导致;引起avoid避免Be supposed to应该;被期望Make sb. In deep thought让人深思必备句型1描述图画内容(1) As we can see in the picture,...正如我们可以从图片中看到的那样·.....(2) As is shown in the picture,... 如图所示··...(3) We can see/find that...in the picture.我们可以从图中发现··...·(4) What we can learn from the picture is that...我们可以从图中知道·.....(5) It can be seen/found/noticed in the picture that...由图画可以看到/发现/注意到···...(6) As can be seen from the picture, it is clear that...如图片所示,很明显·...·2论述图画反映的现象以及对这一现象的看法(1) After seeing the picture, I was greatly shocked by the phenomenon. In today's society,...看到这幅图以后,我对这种现象非常震惊.在今天的社会里,(2) What the picture reflects makes me think a lot.图片所反映的东西让我思考了很多.(3) Apparently, the cartoon reflects a major social problem.很明显,这幅漫画反映了一个主要的社会问题.(4) The picture reminds me of something in my daily life.这张图片让我想起了我生活中的一些事情.(5)All of these cause some serious problems.所有这些造成了一些严重的问题.(6) So I hope something must be done to avoid...所以我希望我们必须做一些事情,以避免···.··3 对事件、观点的总结(1) We can e to the conclusion that...我们可以得出这样一个结论···...(2) As far as I am concerned, what we have to do is... 就我看来,我们必须做的是·....·(3) Consequently, it is high time...所以,是时候··...(4) In my opinion, we should...就我看来,我们应该...(5) Only in this way can we... 只有这样我们才能··..·(6) Spare more time to...and you will...花多点时间···,你将会··.··(7)Therefore, we should realize the importance of...因此我们应该意识到······的重要性.(8) Such behavior left me in deep thought.这样的行为使我陷入了沉思.(9) In a word, if every one of us can do our part, we can make a difference to the world.总之,如果我们每个人都能从自身做起的话,我们就可以对世界产生影响.范例1题目:初中生活即将结束,6月6日下午,你班的班长方华组织了一次毕业聚会,内容是话友谊,忆过去,签名留言,拍照纪念,请根据图片的先后顺序描述此次聚会的过程.注意:1.文中不能出现真实姓名和学校的名称.2.至少用两句话描写每幅图画的内容,可以适当发挥.3.首句已给出,不计入总词数.词数80以上.4.参考词汇:签名sign one's name,班长monitor,心形的heartshapedAs the junior life is to end, our class decided to have a party to celebrate it._____________________________ ____________________________________________________________________________________________ ____________________________________________________________________________________________ ____________________________________________________________________________________________ ____________________________________________________________________________________________ 范文As the junior life is to end, our class decided to have a party to celebrate it. The party was organized by Fang Hua who is the monitor of our class and it consisted of three parts. ①Firstly, each person shared one story happened in the past three years. Some of the stories even made us cry. Then our photos were pasted on a heartshaped board. ②The shape of heart, of course, stood for our lifelong friendship. After that, we signed our names and left some messages on Tshirts. At the end of the party, we took a photo together.Every one of us left with a happy smile on our faces and we would remember the day forever.③译文因为初中生活即将结束,我们班决定办一场毕业聚会来庆祝.聚会由我们班的班长方华组织,本次聚会共分为三部分.首先,每个人都分享一件发生在过去三年中的事.有些故事甚至催人泪下.接着,我们把我们的照片粘贴到一块心形的木板上.当然,心形代表着我们终生不渝的友谊.然后我们在T恤衫上签下我们的名字,并写下一些留言.聚会结束之际,我们一起拍了张合照.我们每个人都面带微笑地离开了,我们将会永远记住这一天.满分点评本文结构清晰严谨,行文流畅自然.采用“总一分一总”结构,符合英语行文的习惯;过渡词的使用也为文章增色不少.其中:①使用who引导的定语从句用来说明方华的身份.②此句采用被动语态句式,使句子富于变化而非平铺直叙.③采用with复合结构作伴随状语,使人眼前一亮.范例2题目:文明社会,从我做起.请就下图的不文明行为和所产生的后果用英语写一篇短文,向校刊English Garden 投稿,倡导做文明人.注意:(1)短文必须包括所给图片的信息,合理想象并补全第3幅图片的内容.(2)必须谈谈你对此事的看法.(3)文中不得出现与你身份相关的信息.(4)词数:80100.短文首句仅供选择使用,不计入总词数.参考词汇:果皮skin,踩在·····上摔倒slip on(slipped, slipped),救护车ambulanceLast Sunday afternoon, I went to the park with my cousin._________________________________________ ____________________________________________________________________________________________ ____________________________________________________________________________________________ ____________________________________________________________________________________________ ____________________________________________________________________________________________ ____________________________________________________________________________________________ 范文Last Sunday afternoon, I went to the park with my cousin. A man who was eating a banana walked in front of us. "①What annoyed us was that he threw the banana skin on the ground instead of putting it into the dustbin.②Suddenly an old woman slipped on the banana skin and got hurt. We called 120 immediately, and then the ambulance came and took the woman to the hospital.It's terrible to drop litter around. ③ As a member of the society, we should keep a good habit and think about others no matter what we are doing, instead of bringing troubles to others.译文上个星期天下午,我和表哥一起去公园.走在我们前面的那个人在吃香蕉.令我们恼怒的是他竟然将香蕉皮扔到地上,而不是扔到垃圾桶里.突然,一个老奶奶踩到香蕉皮滑倒了,并且受了伤.我们立即拨打了120,之后救护车来了,把老奶奶送去医院.到处乱扔垃圾的行为非常糟糕.作为社会中的一员,我们应该养成良好的习惯,不管我们在做什么,都要为他人着想,而不是给他人带来麻烦.满分点评本文成功运用了一般过去时、一般现在时,并使用了过渡词,使短文过渡自然,逻辑清晰.其中:①who引导定语从句,修饰先行词a man.②此句使用了what引导主语从句和that引导表语从句,使人眼前一亮.③采用it作形式主语,不定式to drop litter around 是真正的主语.范例3题目:假如你是刘洪.周末就要到了,你已经安排好了周六一天的活动,请你结合图片内容,发挥合理想象,写一篇不少于80词的文章.____________________________________________________________________________________________ ____________________________________________________________________________________________ ____________________________________________________________________________________________ ____________________________________________________________________________________________ ____________________________________________________________________________________________ ____________________________________________________________________________________________ 范文The weekend es. After a week's hard work, I really want to have a good relaxation.①On Saturday, I am going to run in the park after breakfast. After that, I will do my homework at home because I have got a lot of homework to do.② Then after lunch, I will go out to fly a kite. ③It will be wonderful. Then in the evening, l will go swimming. Finally at night, I am sure to have a good sleep.That is all about my Saturday.译文周末就要来了,在一周的努力学习之后,我真的想要好好放松一下.星期六,吃完早餐后我要去公园跑步.之后,我将在家里做作业,因为我有很多作业要做.午饭后,我将去外面放风筝.这是很美好的.傍晚的时候,我会去游泳.最后,晚上我一定可以睡个好觉.这就是我星期六的全部安排了.满分点评文章围绕图片内容有条理、有层次地展开,语句通顺、准确,衔接连贯.①这一句暗示了作者打算在周末好好放松,为下文的活动做铺垫.②本句是because引导的原因状语从句,使用恰当.③作者适度运用“then,after”等词语连接上下文.第八章图表作文图表作文通常要求同学们根据题目所提供的图表、数据等进行分析、研究,通过一定的文字说明,弄清信息之间的关系,提炼要点,然后组织语言进行写作,有时候还要加入作者自己的观点.这是考试中较为常见的题型之一,也是难度较大的一种写作题型.这类作文形式多样,可综合提供题目、数据、图像、提纲等,但同学们在写作时一般是从五个方面入手,即描述图表、说明寓意、分析原因、联系实际、提出建议等,考试会从这五个方面中选出两到三个方面.主要考查学生把图表信息转换成文字的能力,数据分析和材料归纳的能力以及写作能力,想象能力等.写法点拨1.认真读取信息,弄清信息间的关系.一般情况下,题目会提供多个信息或者多组数据等,我们要认真分析每一个信息和每一组数据,找准信息间的逻辑关系,把握信息的要点,点明主题.有时候,我们可以借助题目的文字说明来帮助我们理清信息.2.初步构思,拟定提纲.把握了信息间的关系和要点之后,我们要在脑海中形成一个基本的框架,确定文章的体裁,是说明文还是议论文,或者是记叙文等.3.连词成句,连句成文.根据内容要点使用恰当的单词表达文章信息,同时要突出信息之间的关系,然后拓展成句子.通过适当的过渡词或过渡句,把这些句子串联成文,使文章连贯、自然.参考模板According to the chart, we clearly learn that.__________ (图表要点)The number of those who__________ (信息一) has increased, and furthermore,. __________ (信息二)Thereare two factors responsible for the changes. In the first place, __________.(原因一)Moreover, __________.(原因二)From the analysis, we can safely draw the conclusion that__________ (发表个人观点或看法或总结)必备词汇1 泛指图表table表格图diagram/chart图表graph曲线图;图表Bar chart条形图Line chart曲线图Flow chart流程图Data chart数据图illustration插图2表示数据变化的词rapidly迅速地dramatically戏剧性地sharply急剧地slowly/gradually缓慢地increase增加Go down减少fluctuate波动drop下降Go up上升Remain the same不变3 其他会用到的词describe描述illustrate阐明reveal揭露apparent/clear显然的represent代表figure数字statistics数据data数据;资料必备句型1 导入图表内容(1)The chart shows that...图表显示··....(2) It can be seen from the chart that...从图表中可以看出··....(3) It is obvious from the table that...图表中很明显发现··...·(4) We can see from the data that...从数据中我们可以看到···...(5) We can learn from the diagram that...我们可以从图中知道......(6) The chart illustrates that...图表阐述了····.·2表达数据变化的句子(1) The number of... has increased sharply from...to...·...··的数量已经从······急剧增长到···..·(2) The number of... remains the same in recent years.·····的数量近年来保持不变.(3) There is a sharp rise in the number of...·...··的数量增长很快.(4) There is a sudden decrease in the number of... from... to...······的数量急速下降,从······降到······(5) In contrast, there is a dramatic increase in the number of...相反,·····的数量的增长速度很快.3 对事件、观点的总结(1) It can be concluded that...可以总结出······(2) We can reach a conclusion that...我们可以得出结论······(3) In conclusion, it can be said that...总之,我们可以说······(4) To conclude, more attention should be paid to...总之,要更关注·····.范例1题目:现在的中学生每月都有一定数量的零花钱.某校对九年级(1)班的30名学生进行了零花钱用途的调查.结果如图.任选两项调查结果,谈谈你是怎么用零花钱的,并说明理由.注意:1.文中不能出现真实姓名和学校的名称.2.语句通顺,词数80以上.范文As the chart shows, most students spend their pocket money on snacks and just a few save their money.①However, things are quite different when. es to me.②Usually, I spend most of my money buying books because l like reading very much. I seldom spend my money on snacks because I think they are bad for my health. In addition, I will save some of my money in case of accidents.③It is true that we should make good use of our pocket money and spend it on something useful.译文正如表格所示,大多数学生会把钱花在零食上,只有少数同学会存钱.然而,当谈到我时,事情就不一样了.通常,我会把大多数的零花钱花在买书上,因为我非常喜欢看书.我很少会把钱花在零食上,因为我觉得这对健康不好.另外,我会把我的一部分钱存起来,以防意外.我们的确要充分利用零花钱,并把它花在有用的地方上.满分点评本文的逻辑清晰,段落层次分明.作者使用适当逻辑词使文章更加连贯、紧凑.①用however表示转折,承上启下,突出“我”是怎么使用的零花钱.②把状语usually置于句首,起到了强调的作用.③使用it作形式主语,从句作真正的主语.范例2注意:1.文章必须包括表格里的所有内容,且要补充自己的看法.2.词数80左右,开头已给出,不计入总词数.参考词汇:cheat 作弊school rules 校规please 取悦In recent years, more and more attention is paid to students' cheating in the exam._______________________ ____________________________________________________________________________________________ ____________________________________________________________________________________________ ____________________________________________________________________________________________ ____________________________________________________________________________________________ ____________________________________________________________________________________________ 范文In recent years, more and more attention is paid to students' cheating in the exam.The reasons why students cheat in the exam are various. ①Firstly, many students think that they have too many exams which are too hard. Moreover, some students are too lazy to work hard at their lessons. ②Furthermore, they sometimes cheat in order to please their teachers and parents.In my opinion, it is wrong to cheat, ③ which is against the school rules. As a student, we should be honest and study hard. What's more, we should improve our study methods so as to get good grades. ④译文近年来,学生在考试中作弊的问题越来越受到关注.学生考试作弊的理由是各种各样的.首先,很多学生认为考试太多,而且这些考试也很难.其次,有些学生太懒而不努力学习.还有,学生有时候是为了取悦父母和老师而作弊.在我看来,作弊是错误的,这也是违反校规的.作为学生,我们要诚实,努力学习.还有,我们要改善我们的学习方法来提高成绩.满分点评本文要点齐全,表达很顺畅,作者也融入了自己的看法,大量使用过渡词,使文章紧凑,自然.①用why引导定语从句,修饰先行词the reasons.②这个句子使用了too...to...句型,表示“太······而不能··..·”.③用it作形式主语,不定式to do作真正的主语.④使用短语so as to作目的状语,表明改善学习方法的目的.范例3题目:最近你们学校做了一个调查,有关现在中学生都爱读哪一类型的外国书籍.现要求你写一篇文章,汇报调查结果,并提出自己的建议.注意:1.要包含所有表格的信息,并提出自己的建议.2.语句通顺,词数不少于80词.参考词汇:foreign books 外国书籍范文To find out what kind of foreign books the middle school students like, our school did a survey.①As the survey's result shows, more than half of the students like to read newspapers.② 26% of the students say that they like to read foreign stories most, while 7% of the students express that they like to read books about learning methods. ③In addition, the percentage of students who like to read science books is 14%.In a word, I agree that students should learn more knowledge about the foreign countries.译文为了了解中学生都爱阅读哪一类的外国书籍,我们学校做了一项调查.调查结果显示,超过一半的学生喜欢阅读报纸.26%的学生说他们最喜欢阅读外国故事,然而只有7%的学生表示说喜欢阅读关于学习方法的书籍.另外,喜欢阅读科普书的学生比例是14%.总的来说,我同意学生应该多学习有关外国的知识.满分点评本文围绕调查的主题有条理地展开调查的结果,运用多种句式表达类似的信息.全文连接顺畅、自然.①用不定式to do作目的状语,解释了调查的目的.②使用“more than half of the students”而不是直接使用数据53%,表达灵活.③while表示前后形成对比,使上下文关系更连贯、紧凑.。
图表作文(三篇)(转的)

[10.建议措施段]In order to protect the wildlife, I have some suggestions. First, the governments should make laws to prevent them from being caught and killed. Second, the governments should educate people to love nature and protect it. Third, as for ourselves, we should take practical actions to protect our living environment.
英语四级作文:图表图画型
英语四级作文:图表图画型英语四级作文模板:图表图画型范文在英语四级作文中遇到图表图画类型的作文题时应该怎么写?下面就来和小编一起看看英语四级作文模板:图表图画型范文吧。
范文一:Student Use of ComputerStudents tend to use computers more and more frequently nowadays. Reading this chart, we can find that the average number of hours a student spends on the computer per week has increased sharply. In 1990, it was less than 2 hours; and in 1995, it increased to almost 4 hours, and in 2000, the number soared to 20 hours.Obviously computers are becoming increasingly popular. There are several reasons for this change. First, computers facilitate us in more aspects of life. Also, the fast development of the Internet enlarges our demands for using computers. We can easily contact with friends in remote places through the Internet. Besides, the prices of computers are getting lower and lower, which enables more students to purchase them.However, there still exist some problems, such as poor quality, out-of-date designs and so on. And how to balance the time between using computers and studying is also a serious problem. Anyhow, we will benefit a lot from computers as long as we use them properly.范文二:Film Is Giving Way to TVIt can be seen from the graph that the rate of car accidents in Walton City experienced rises and falls in 1990. From January to March last year it increased by 45%. From March to June itdropped by about half the previous rate. From June to August there was a steep rise of 50%. After that, however, there was a steady decrease.There are several reasons for this improvement, but the following are the most critical ones. First, new traffic regulations have made drivers more careful. Second, more people are using bicycles for transportation. Finally, in the later part of the year good weather made the roads safer to drive on.I am confident that there will be even fewer car accidents in Walton in the future. First, major roads have been repaired and the number of public buses has been increased in the past few months. Moreover, a traffic safety campaign has made all the local people more aware of the dangers of unsafe driving.。
2020年大学英语四级作文万能模板:图表图画型范文(四)
2020年大学英语四级作文万能模板:图表图画型范文(四)四级作文题目:Student Use of ComputerStudents tend to use computers more and more frequently nowadays. Reading this chart, we can find that the average number of hours a student spends on the computer per week has increased sharply. In 1990, it was less than 2 hours; and in 1995, it increased to almost 4 hours, and in 2000, the number soared to 20 hours.Obviously computers are becoming increasingly popular. There are several reasons for this change. First, computers facilitate us in more aspects of life. Also, the fast development of the Internet enlarges our demands for using computers. We can easily contact with friends in remote places through the Internet. Besides, the prices of computers are getting lower and lower, which enables more students to purchase them.However, there still exist some problems, such as poor quality, out-of-date designs and so on. And how to balance the time between using computers and studying is also a serious problem. Anyhow, we will benefit a lot from computers as long as we use them properly.。
英语作文图表分析范文(汇总30篇)
英语作文图表分析范文(汇总30篇)(经典版)编制人:__________________审核人:__________________审批人:__________________编制单位:__________________编制时间:____年____月____日序言下载提示:该文档是本店铺精心编制而成的,希望大家下载后,能够帮助大家解决实际问题。
文档下载后可定制修改,请根据实际需要进行调整和使用,谢谢!并且,本店铺为大家提供各种类型的经典范文,如工作总结、工作计划、合同协议、条据文书、策划方案、句子大全、作文大全、诗词歌赋、教案资料、其他范文等等,想了解不同范文格式和写法,敬请关注!Download tips: This document is carefully compiled by this editor. I hope that after you download it, it can help you solve practical problems. The document can be customized and modified after downloading, please adjust and use it according to actual needs, thank you!Moreover, our store provides various types of classic sample essays for everyone, such as work summaries, work plans, contract agreements, doctrinal documents, planning plans, complete sentences, complete compositions, poems, songs, teaching materials, and other sample essays. If you want to learn about different sample formats and writing methods, please stay tuned!英语作文图表分析范文(汇总30篇)英语作文图表分析范文第1篇图表类写作模版(1)模版1According to the chart / graph / diagram / table, we clearly learn that _________.As early as _________,___________.Then,_________.Last,__________.In contrast, by _________,__________.There are many reasons accounting for _________.Firstly, _________.Secondly,__________.Finally,_________.As a result,_________.As far as I am concerned,_________.For one thing,__________.For another,________.In brief, I hold that__________.(2)模版2What is shown in the chart / graph / diagram / table above indicates that in recent years, more and more people payattention to _________.The number of those who _________has increased ________,and furthermore,____________.There are two factors responsible for the changes.In the first place,_________.Moreover,__________.Yet, it is noticeable that __________.From the analysis, we can safely draw the conclusion that__________.It is possible that in the future,the tendency will__________.(3)模版3As is shown in the chart / graph / diagram / table above,__________has charged drastically in the past _________.While ___________,now the percentage of__________is __________.Meanwhile,the number of _________has soared up to ________.There are mainly two possible reasons contributing to the rapid changes.The first is that _________.Secondly,__________.In my point of view, the changes have a great influence on _________.At the same time,_______.To sum up ,_________.英语作文图表分析范文第2篇1、图形种类及概述法:泛指一份数据图表: a data graph/chart/diagram/illustration/table饼图:pie chart直方图或柱形图:bar chart / histogram趋势曲线图:line chart / curve diagram表格图:table流程图或过程图:flow chart / sequence diagram程序图:processing/procedures diagram2、常用的描述用法The table/chart diagram/graph shows (that)According to the table/chart diagram/graphAs (is)shown in the table/chart diagram/graphAs can be seen from the table/chart/diagram/graph/figures,figures/statistics shows (that)……It can be seen from the figures/statisticsWe can see from the figures/statisticsIt is clear from the figures/statisticsIt is apparent from the figures/statisticstable/chart/diagram/graph figures (that)……table/chart/diagram/graph shows/describes/illustrates how……3、图表中的数据(Data)具体表达法数据(Data)在某一个时间段固定不变:fiXed in time在一系列的时间段中转变:changes over time持续变化的data在不同情况下:增加:increase / raise / rise / go up ……减少:decrease / grow down / drop / fall ……波动:fluctuate / rebound / undulate / wave ……稳定:remain stable / stabilize / level off ……最常用的两种表达法:动词+副词形式(Verb+Adverb form)形容词+名词形式(Adjective+Noun form)英语作文图表分析范文第3篇雅思考试学术类图表作文分析考试学术类图表作文要求考生观察一幅图表并用自己的语言呈现出图表中的信息。
四级作文之图表图画作文篇(整理)

四级作文之图表图画作文篇(整理)Composition \ 图表作文General StructureFrom the graph ( table, chart ), we can clearly see the increase ( decrease ) of _______. It added up to ( decreased ) ___________ in19____, while it increased ( decreased ,were ,was ) to _____in 19____. Therefore, it can be predicated that ________ is ( are ) to be on the rise ( on the decrease) in the future.There are chiefly _______ reasons for the increase ( decline ). In the first place, owing to ______, _______have realized the importance of_______. Secondly, with the development of ( with the growth of, with the increase of , with the improvement of ), ________ have adopted more active and effective methods.In spite of what’s mentioned above, there are some problems. The graph indicates that _______ was ( were ) fluctuated ( 波动) . Hence, the situation is still serious and how to improve ________ is still a challenging task.Models1. Changes in People Diet●Outline:●state the changes in people’s diet in the past five years●give possible reasons for the changes●draw your own conclusio nThe GraphYear/food 1992 1993 1994 1995 1996 Grain 49% 47% 46.5% 45% 45%Milk 10% 11% 11% 12% 13%Meat 17% 20% 22.5% 23% 23.5% 24% 22% 20% 20% 21%FruitVegetableTotal 100% 100% 100% 100% 100%From the graph, we can clearly see that great changes have been taking place in people’s diet over the period from 1992 to 1996. The consumption of grain is decreasing year by year, while that of some high energy food, such as milk and meat, is increasing steadily.There are two major reasons. In the first place, with the improvement in the living standard, people can afford to buy much more expensive food with better nutrition. Secondly, people now pay more attention tothe quality of it, because they know it is of great benefit to their health to diet in a scientific way. Therefore, they try their best to improve the structure of their food.From the above, we c an see that people’s living level has been rising markedly in the past five years. And it can be concluded that there will be a more prosperous future waiting for us.2. Production of Radios and TV Sets in Factory A根据左图,写一篇120字的短文。
图表图画类作文

In conclusion, people prefer to go traveling rather than stay at home during holidays for various reasons. Moreover, it seems that this trend will last in the foreseeable future.
写图表作文,并不是单纯地用语言文字 把图表里的所有数字信息一一摊摆,逐 条列出,而是利用这些数据,经常还得 筛选,将该图表所要说明的主要问题阐 述清楚。就这个意义上说,图表作文属 于说明文。如果图表信息是用来论证某 一观点,则图表作文属于议论文。因此, 图表作文在结构处理和写法上与说明文 或议论文是相同的。它通常必须:
பைடு நூலகம்
Several reasons can account for this phenomenon. Compared with a film, TV is much cheaper and more convenient --you don't have to leave your house at all. Apart from that, you have many choices while watching TV, but a film concentrates on a certain topic.
We are happy to see that things are becoming better and better nowadays. We can imagine that people will live longer and the infant mortality will again fall.
【作文】英语图表图画类作文课后作业及范文
【关键字】作文图表图画类作文课后作业及范文一、For this part, you are allowed thirty minutes to write a composition on the topic People below Poverty Line.1、下图所示为1978年,1985年1997年中国贫困线以下人口的变化情况,请先描述其变化。
2、请说明发生这些变化的原因(可从改革开放、高科技在生产中的应用等)3、你认为解决目前中国贫困人口还有什么困难或者问题。
As the bar chart shows, there is a tremendous decline in the number of people below poverty line in during the years of 1978 to 1997. As early as 1978, the number of people below poverty line in is nearly 250 million. Then great changes have taken place due to the policy of reform and opening. Eight years later, the number had been strikingly reduced to less than 150 million. From then now, the society has also undergone a major transformation. Arriving in the year 1997, the number incredibly dropped to about 25 million.There are several factors contributing to the sharp decrease of the below-poverty population. First and foremost, the reform and opening following 1978 enabled the peasants to become much better off. In addition, with the development of Chinese economy, that policy also improved city dwellers' living standards prodigiously. Furthermore, the high-tech introduced made it possible for the country's economy as a whole to take off. All these result in the stupendous fall of the Chinese population below the poverty line.However, a further reduction in the number of poverty-stricken people is faced with some serious problems. Nowadays, quite few employees have been laid off. What’s more, university graduates also realize that it difficult to find a job to earn a living. Not only is the effect of unemployment discouraging, but it is also challenging. As a result, it is high time that government officers made some regulations to solve the problem.二. Study the following tale carefully and write an essay of at least 150 wordsYou essay should meet the requirements below1.Changes in people’s daily expenses in the past five years2.Give possible reasons for the changes3.Draw my own conclusions.In the past five years, there have been great changes in people’s daily expenses I XX city. According to the figures given in the table, the amount of money spent on food decreased gradually, accounting for 35 percent in 1998. However, there was a rapid increase in clothing expenses, which made up 17% in 1998. In addition the table shows an upward tendency in recreation expenses. The same was the case with other expenses.What case these remarkable changes? In my opinion, it can be attributed to the following reasons:(也可以It is to the credit of the following reasons:)。
图表和图画类作文

Step2 Analysis(联系实际分析)
( facts / reasons/results…)
Sentence structures
1.What are the reasons for this phenomenon? 2.It seems very ridiculous that…However, this kind of story is performed everywhere. 3.The picture shows that…It is the exact reflection of… 4.The picture indicates that we…/Nowadays, it is a common phenomenon that… 5.This is a ironic (讽刺的) cartoon which describes vividly a kind of common phenomenon among……
例题2������ 根据下面所给两幅图������ 完成100词左右的一 篇短文������ 首句已给出������ 。参考词汇������ expenses: n. 支出������ 费用
▲18%Food & Drink ▲25%Housing ▲Other
Percentage of Average Family Expenses in 1997
发现问题
Step1. Description step2. Analysis
分析问题
Step3. Solutions 解决问题
Organization
Step 1 Description (人称/时态)
To what degree should we describe the cartoon?
图表类作文
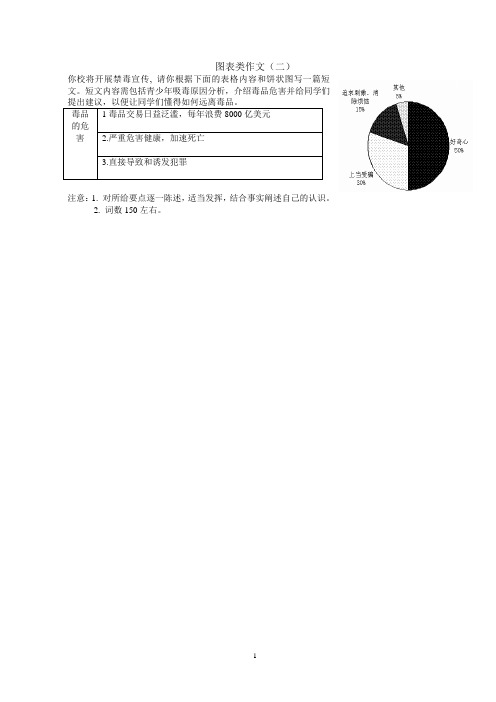
图表类作文(二)你校将开展禁毒宣传, 请你根据下面的表格内容和饼状图写一篇短文。
短文内容需包括青少年吸毒原因分析,介绍毒品危害并给同学们毒品的危害1毒品交易日益泛滥,每年浪费8000亿美元2.严重危害健康,加速死亡3.直接导致和诱发犯罪注意:1. 对所给要点逐一陈述,适当发挥,结合事实阐述自己的认识。
2. 词数150左右。
_____________________________________________________________________________________ _____________________________________________________________________________________ _____________________________________________________________________________________ _____________________________________________________________________________________ _____________________________________________________________________________________ _____________________________________________________________________________________ _____________________________________________________________________________________ _____________________________________________________________________________________ _____________________________________________________________________________________ _____________________________________________________________________________________ _____________________________________________________________________________________ _____________________________________________________________________________________ _____________________________________________________________________________________ _____________________________________________________________________________________ _____________________________________________________________________________________ _____________________________________________________________________________________The trade of drugs is widespread, which costs up to $800 billion every year. As we all know, drugs do great harm to our health, even causing people to die at an early age. Meanwhile, it directly contributes to the happening of crimes. But to our sadness, more and more young people begin taking drugs.As can be seen in the pie chart, 30% of the teenagers taking drugs are cheated into doing it, and 50% are driven by curiosity. Another 15% just seek excitements .The rest try it for some other reasons.In order to protect us students from drugs, what should we do? I think, we should be careful to make friends and stay away from those who always behave badly. Also, it’s very important for us to lead a healthy lifestyle and hold positive attitudes towards life. Do remember that trying drugs out of curiosity is very dangerous.。
高考写作素材:图表、图示、图画式作文
第十天:图表、图示、图画式作文图表作文可细分为表格、曲线图、柱形图和圆形图。
其写作指导中只是对短文提出二至三项要求,而这些要求则类似提纲,因此这类作文往往可以按照所给要求自然分段。
图表作文给出不同形式的图表或图画,且图表又多配有数据或说明。
写此类作文时,首先要以题目中的要求(requirements)为指导,审慎解读图表,准确把握图表传递的信息,将其扩展成文。
Never do things by halves.做事不可半途而废。
【友情提示】前面我们已经提过图表作文可细分为表格、曲线图、柱形图和圆形图。
弄懂这四种图在写作方面的各自特点,我们才可以写好这种类型的作文:1) 表格形式要求考生对表格中所给出的大量数字进行比较分析,从中找出其变化规律。
2) 曲线图形式要求考生认真观察坐标系所显示的数据信息,并且密切注意交汇在坐标横轴和纵轴上的数字及单位。
3) 柱形图形式要求考生通过宽度相等的柱形的高度或长度差别来判断事物的动态发展趋势,因此考生应密切关注坐标线上的刻度单位及图表旁边的提示说明与文字。
4) 圆形图形式旨在要求考生准确理解并阐述一个被分割成大小不等切片的圆形图所传达的信息。
考生应清楚掌握部分与整体,部分与部分之间的相互关系,这种关系通常是以百分比的数字形式给出的。
【活动教室】1.用一般现在时描述图示内容在现今的信息时代,数据是非常重要的,以图表或图例的方式显示复杂的数据可以使人们对所提供的信息一目了然。
下面的练习为图示描述,请注意:描写要做到清晰准确。
Diagram 1:某城市家庭月消费情况示意图A 城家庭月消费情况图该图所显示的信息没有特定的时间限制,它表示的是该市市民的平均消费情况,因此我们在描述数据时要使用一般现在时。
请在下面的文章中填入一般现在时动词,使文章意思完整,同时请注意连接词(粗体字)的用法。
The Diagram 1) the average monthly expenditure per family in City A. Food 2) the biggest expense, costing 30% of monthly income, while consumable household goods (such as soap, toilet paper, etc.) 3) 6%. 9% of the household budget 4) spent on entertainment, and 5% each on cigarettes and alcohol. Housing 5)12% per month whereas fuel, light and power 6) another 6%. Transport expenses 7) 10%, 9% 8) on clothing and the other 8% 9) towards various other goods. No cross, no crown.未经苦难,得不到荣冠。
writing5-图画式图表式作文
图画式作文图画作文讲究画面简单,主题深刻,若缺乏丰富的想象力便只能就图说图,写出只有小学水平的作文来。
「构思要诀」图画作文的基本审题过程一定包含以小见大,把握象征寓意的过程。
图画式写作是较难的题型之一,面对此类题型,考生应首先确定主题,然后再动笔。
第一步,看仔细。
考生应对图画进行全面而细致的研究,尤其注意图画中人或物(人与物)的体貌表情特征和背景,确定人物之间,人物与背景之间的主要关系,以便正确掌握图画所传达的信息。
如果图画以系列形式(即两幅以上)出现,还应该对图画之间的相应联系有所理解,从而在整体上把握图画所传达的信息。
第二步,拟提纲。
根据图画内容的不同,采用不同的段落发展方式。
如果画面内容是以描述为主,即按空间方位或时间先后顺序排列,可采用开头——扩展——结尾的写作方式。
如果画面内容是以解释说明为主,写作时则先给出主题句,再围绕主题句完成各段落的写作,这是采用主题句——扩展句——总结句的写作方式。
第三步,突出主题。
展开段落要根据画面内容进行,同时也要围绕每一段的主题句进行。
第四步,小修改。
考生应重点检查图画内容是否准确地被表达出来,题目所给提示是否完整地反映在文章之中。
如果存在与画面不相符的内容,或未能完全涵盖题目所给提示,应做出相应修订。
写作题目1Directions: Study the pictures carefully and write an essay about 200 words based on the following:1. describe the set of drawings and interpret its meaning2. point out its implications in our life2003年的考题写作题目为“温室中的花朵经不起风雨”,题目本身就显得话里有话,意犹未尽。
观察两幅图画不能只看到温室和花朵,还要以小见大,与主题和现实意义挂钩联想,于是出现了以下的定位。
- 1、下载文档前请自行甄别文档内容的完整性,平台不提供额外的编辑、内容补充、找答案等附加服务。
- 2、"仅部分预览"的文档,不可在线预览部分如存在完整性等问题,可反馈申请退款(可完整预览的文档不适用该条件!)。
- 3、如文档侵犯您的权益,请联系客服反馈,我们会尽快为您处理(人工客服工作时间:9:00-18:30)。
• From January to March last year it increased by (增长了) 45%.(如果你数学很烂,你不会算或没 时间算,那你就写成increase from 22% to 32%或者 随便编个数据,你说改卷的人会不会去算?他没病!) From March to June it dropped by about half the previous rate. From January to March last year it increased by 45%. From March to June it dropped by about half the previous rate. From June to August there was a steep rise of 50%. After that, however, there was a steady decrease.
• 如曲线图所示,从1980年到1982年,拥 有个人电脑的美国家庭的百分比,从大 约0.2%缓慢上升到正好5%。然后这一 百分比又急剧上升,达到1983年的大约 10%。此后,该百分比持续上升,直到 达到了1988年的最高值21.0%。
• As the curve indicates, the percentage of American families who owned personal computers increased gradually from approximately 0.2% in 1980 to exactly 5% in 1982. Then, there was a substantial increase in this proportion, reaching some 10% in 1983. Finally, the period between 1983 to 1988 witnessed a steady growth, to the peak of 21.0% in the latter year. It can be observed easily that computer has become an indispensable part for American society.
B 版本
• As is seen from the table / graph / chart, _____________ (图表所描述的事物A) ascend significantly from __________ (数字1) in __________ (年份1) to ____________ (数字 2) in __________ (年份2) while over the same period, _______________ (图表所描述的 事物B) shrank slightly from _________ (数字3) to ___________ (数字4). It can be observed easily that _____________________________________ (分析图表所反映的问题).
• 具体挑出最高值,最低值,增长变化的 趋势就可以了
模仿练习
• 请大家把教材翻到77页,1996年的题 • It can be seen from the graph that the developing countries have made remarkable/considerable progress in people’s health. From 1960 to 1990 life expectancy increased by 50%. At the same time/meanwhile, there was a dramatic decline in infant mortality(字数嫌少加上下 面的话from 200 deaths per 100 birth in 1960 to 100 in 1990)
• 1. 我们注意到在这个图表中,总的趋势 在下降,但是在过程中有的在下降有的 在上升。
2. possible reason(s)
法规更健全和严格 行人和司机更遵守交通规则 路况更好了 车的质量更好了
3. 解决方案
• 是不是觉得刚刚已经讲过了啊 • 范文参考P25---19 Car accidents declining in Walton City
• 第二段: 给出原因 • 第三段:解决方案, 或趋势预测
• 和现象型没有任何区别
更加经典的图表作文
• 课本的74页2003年6月的题 • 请大家翻到教材23页,来看看这个范文 的第二段,很多好句子都可以背下来, 以后写图表作文,改改就行
课堂练习
• P72页2006年6月的作文 • Traveling Abroad
• 从1980年到1982年,拥有个人电脑的美国家 庭的百分比,从大约0.2%缓慢上升到正好5%。 • The period between 1980 and 1982 witnessed a gradual increase in the percentage of American families who owned personal computers from approximately 0.2% to exactly 5%.
练习
• 在这20年的时间里,电影院入场人数持 续下降。 • These 20 years witnessed a steady descent in the number of cinema admissions.
图表开头写法
• A. 本____图表明了 在某个时间段(比 如某年到某年之间) 某个研究对象 (如 何变化)的情况/数字/百分比。.
幅度大、剧烈的词
• • • • Sharply/dramatically/abruptly/ steeply/significantly/substantially/ noticeably/remarkably/greatly/ quickly/unexpectedly
幅度小、缓慢的词
• Stably/steadily/marginally • slowly/gradually/slightly
练习
• 在凌晨三点到早晨九点之间,总用电量急剧下 降,从40000千瓦下降到30000千瓦 (kilowatt)。 • From 3 A.M. to 9 A.M., there is a dramatic drop in the total electricity consumption, from 40000 kilowatts to 30000 kilowatts.
保持不变
• • • • • • keep remain stay stabilize level off 波动:fluctuate
Sentence Patterns to describe a graph
• A. There be句型: “There is “变化名 词”+in the number of +被描述对象 • 在1975到2005这30年的时间里,骑自 行车的人的数量缓慢下降了。 • During the 3 decades from 1975 to 2005, there was a gradual decline in the number of bicyclists.
第二段
• A number of factors account for the change in the chart, but the following are the most critical ones. First, thanks to the policy of reform and opening-up,[j1] the nation’s economy has been developing at a considerably high speed in the past decades. Therefore, the people have more extra money for traveling. Secondly, other relevant state policies, such as national holidays set by the government ,which render people much free time, and the boom of touring industry provide citizens with more opportunities to go out and see the world. Last but not least, people have attached greater importance to the quality of life, thus they spend more money and time traveling and sight-seeing. • [j1]也可以变成It is to the credit of the policy of reform and opending-up
第一段
• It can be seen from the chart that there have been sharp increases in the number of people traveling abroad in City X in the past decade. As the chart shows, the year 1995 witnessed only about 10,000 people from this city touring abroad. In 2000, the number soared to nearly 40,000. Last year, more than 120,000 people in the city chose to spend their vacations outside China.