扣带回的形态结构 - 副本
回旋曲式PPT

组曲性的回旋曲
• 出现于浪漫派和民族乐派以及现代音乐 • 插部较多,一般多于两个 • 主部与插部一般是并置,无连接部 • 插部一般体裁不同,画面不同,情节不同
等
主部主题再现问题
• 由于多次再现,一般减缩再现 • 可以省略某一次或某两次再现!但不得少
于三次出现 • 再现时可以不出现在主调,甚至在完全不
调性),中间阶段(调性中介,展开阶 段),再现准备阶段(再现的属准备,准 备回归) • 连接部的结构可扩大或减缩
复合结构的尾声
• 必须具备 • 相对独立 • 综合前面所有材料 • 先插部再主部的二部结构 • 先主部再插部再主部的三部结构
a小调回旋曲
• 主部:a小调,再现单三部 • 第一插部:F大调,再现单三部 • 连接部:F->a,回归a的D • 第一次再现:a小调,装饰变奏,只再现第一乐段,
连接部的意义 • 主部从插部结尾的副调开始,则从某种意
义上具有调连接部的意义
朱丽叶姑娘
回旋曲式与再现三部曲式的结合
• 三部五部曲式,双三部曲式 • 复三部曲式的缩减带来的回旋性 • 单三部曲式,复三部曲式加入回旋原则 • 回旋曲式因插部再现造成的多部对称性 • ABARA式回旋曲
ABARA式回旋曲
相关的调
插部再现问题
• 插部可以连续两个一起并置 • 插部也可以再现,但不要形成对称曲式 • 插部再现可以用移调(既再现,又有调对
比) • 插部再现可以不从对比调开始,即可以从
主调开始(要求插部具有明显的对比性) • 插部甚至可以不转调(要求插部具有明显
的对比性)
连接部的问题
• 一般没有连接部 • 插部从主调开始,则从某种意义上具有调
• R代表展开 • 展开部代替第二插部 • 两种观点
头部冠状位断层解剖

7、嗅球 8、大脑镰 9、额内侧回
10、眶回 11、额上回 12、额中回
13、额下回 14、中鼻甲
15、下鼻甲 16、鼻泪管
17、前筛窦 18、额鳞
19、额骨眶部 20、筛骨筛板
21、大脑纵裂 22、上颌窦
23、牙槽突 24、颊 25、下唇
26、上矢状窦 27、鼻中隔
28、颞肌
29、额窦
眼上静脉
视神经 下直肌 筛窦 鼻中隔
球后脂肪
晶状体
外直肌 下直肌
上直肌及上睑提肌
眼球
内直肌 筛 窦
上斜肌
泪腺 下直肌 上颌窦
经眶前部冠状层面(CT)
额窦 眼球
鼻中隔 下鼻甲
筛窦 鼻泪管 中鼻甲 上颌窦
左侧泪腺混合瘤
2. 经胼胝体前冠状层面
扣带沟
额上 回
眶回 嗅沟
扣带回
1、上直肌 2、下直肌 3、内直肌
4、泪腺 5、眶脂体 6、鸡冠
36、颈内动脉
37、海绵窦
38、鼻后孔
39、蝶骨翼突
40、软腭
41、翼外肌
42、颞肌
1 2 3
4
8
10
9
5 67
1-胼胝体 2-尾状核 3-苍白球 4-三脑室 5-外侧裂池 6-颞叶 7-蝶窦 8-大脑镰 9-额叶 10-上矢状窦通过视交叉Biblioteka 状断面尾状核头胼胝体
额叶
透明隔 豆状核·壳
视交叉 垂体
应注意脑回的出现顺序及胼胝体、侧脑室、 基底核、内囊、脑干、海马、小脑、大脑镰、 小脑幕、硬脑膜窦的形态特点。
经额叶前部冠状位断层
(1)上直肌 (2)下直肌
(3)内直肌 (4)泪腺
(5)眶脂体 (6)鸡冠 (7)嗅球
大脑皮质结构与功能分区4讲课文档

多形层 锥体层 分子层
CA1 CA3
齿状回
现在二十三页,总共三十一页。
★边缘系统组成:
边缘叶பைடு நூலகம்与之相关皮质下结构(如杏仁核、隔核、下丘脑、 丘脑前核、缰核、中脑被盖等) ★边缘系统功能: 个体与种族保存,记忆与高级精神活动,如情绪反应和性活 动。
现在二十四页,总共三十一页。
★联络区: 额叶-- 躯体运动、语言、高级思维等,与智力和 精神活动有密切关系。 顶叶-- 躯体感觉、语言等
速示实验表明,对文字性材料大多数人以 左半球为优势,而对非语言文字的图形材 料以右侧半球为优势。双耳分听试验显示 ,言语性刺激的听觉能力以左侧半球(右 耳)为优势的人居多,右侧半球(左耳) 对音乐性刺激的分辨能力为优势者居多。
现在二十八页,总共三十一页。
小儿在2-3岁之前,如果发生左侧大脑半球 损害时,其语言功能的紊乱和右侧大脑半 球损害时的情况没有明显的差别,说明这 时候尚未建立左侧优势,双侧大脑半球均 与语言活动功能有关;7-12岁时,左侧优 势逐步建立,但在左侧大脑半球损害后, 有可能在右侧大脑皮层再建立起语言活动 的中枢;在发育成年后,左侧优势已经形 成,如果发生左侧大脑半球损害就很难在 右侧大脑皮层再建立起语言活动的中枢。
▲视觉性语言中枢(39区,阅读中枢):角回,如损
伤表现“失读症”(看不懂)。 ★优势半球:
左半球---语言、意识、数学分析,抽象思维等; 右半球---非语言信息、音乐、图形、时空概念,形象
思维, 情感性 信息处理。
现在二十七页,总共三十一页。
一些人沉着稳重,善于思考,言语逻辑性 强,但缺乏生动性,可能与其左半球功能 优势有关;另一些人情感丰富,言语形象 生动,富有感染力,可能与其右半球功能 优势有关。
人解考试重点
微绒毛:是细胞游离面的胞膜和胞质向外伸出的细小指状突起,其直径约为0.1微米,长度和数量因细胞种类或细胞生理状态的不同而有很大差异。
质膜内褶:由上皮细胞基底面的胞膜向胞质内折入所形成。
突触:是指神经元之间与非神经元之间的一种信息的特化连接结构。
神经纤维:是由神经元的长突起和包在其外表的神经胶质细胞所组成的纤维状结构。
运动终板:运动终板是运动神经元的轴突终末与骨骼肌纤维共同形成的效应器,分布于骨骼肌内,支配肌纤维的收缩。
小循环:全身返回心的含二氧化碳较多的静脉血自右心室泵出,经肺动脉及其分支流到肺泡毛细血管进行气体交换,使静脉血变成动脉血,再经肺静脉流回左心房,血液沿上述路径的循环称小循环。
大循环:含氧和营养物质较多的动脉血自左心室蹦出,经主动脉及其分支流到全身毛细血管(肺泡毛细血管除外)进行物质和气体交换,使动脉血变成静脉血,静脉血再汇入各级静脉,经上下腔静脉及冠状窦流回右心房,血液沿上述路径的循环称大循环。
组织学研究方法:一般光学显微镜技术(切片法和非切片法)、几种特殊光学显微镜技术(荧光显微镜技术、倒置相差显微镜技术、暗视野显微镜、激光共聚焦扫描显微镜)、组织化学和细胞化学技术、免疫细胞化学技术、放射自显影技术、电镜技术(透射电镜术、冷冻蚀刻复型技术、扫描电子显微镜技术)、组织和细胞培养技术。
细胞连接的方式结构特点和功能?细胞连接:细胞相邻面的胞膜和胞质特化呈点状、斑状或带状的接触区,使细胞紧密排列或相互沟通。
1紧密连接又称闭锁小带。
结构特点:在上皮细胞靠近游离面处,相邻细胞侧面细胞膜外层,呈嵴状部分融合,围绕细胞顶部四周,呈桶箍状。
功能:阻止大分子物质从细胞间隙进入深部组织。
分布:上皮细胞,心肌润盘2中间连接又称粘着小带结构特点:在紧密连接深面,相邻细胞间有一狭小间隙,其中充满均质状物质,该处两侧胞膜的胞质面有少量致密物质并有很多平行微丝附着此处。
功能:加强细胞间的粘着、保持细胞的形状和传递细胞间的收缩力。
边缘系统的解剖与临床

17
边缘系统与内分泌功能调节
杏仁复合体、海马、隔区等结构参与对内分泌 功能的调节一般认为是通过下丘脑---垂体而发 挥作用的。对内分泌的调节在某些方面也是情 绪反应的一部分。
18
边缘系统与躯体运动
边缘系统对躯体运动的调节除了通过网状结构 外,还通过纹状体参与骨骼肌的调节作用。边 缘系统对躯体运动的调节与食、行、防御等本 能行为及情绪反应有较密切的关系。
24
边缘系统与情绪反应
一般认为颞叶、扣带回是情绪反应的中枢。边 缘系统通过调节躯体与内脏活动参与情绪反应。 边缘系统能单独或与大脑其他部位协同发出抑 制性影响,使动物不出现强烈的情绪反应。而 杏仁体-下丘脑-隔区-额前叶的脑回路似乎与情 绪活动的关系最密切。
25
边缘系统与学习和记忆
目前以至于记忆功能有密切关系的脑结构中主 要由大脑皮质联合区、海马及邻近结构、背侧 丘脑等脑区。
19
边缘系统与躯体运动
刺激扣带回与海马能产生躯体运动,这种运动 经常带有情绪色彩,如假怒、扑打、攻击等。 刺激杏仁体与隔区,会产生竖耳、憋气、咀嚼、 咆哮和发抖等,并伴有觉醒及某些自主性功能 和内分泌的变化。 刺激额叶眶部可引起肢体、颈项、躯干的紧张 性运动。切除双侧额叶眶部可引起活动过度, 动作和行走可增至正常的8~16倍。
13
边缘系统与内脏功能调节
边缘系统对内脏的调节作用一般是通过下丘脑 和网状结构实现的。扣带回与额叶眶部被认为 是植物神经系统高级中枢的主要所在地。海马、 隔区、杏仁复合体、内嗅区、钩、颞极、岛叶 等参与内脏调节。
14
边缘系统与内脏功能调节
边缘系统对内脏功能调节的特点是:边缘系统 的许多部位可影响同一脏器的活动,而刺激边 缘系统某一部位,又可引起多种脏器的变化。
动物生理学理论课教学模式的探讨与实践
四、 加强题 库建 设 。 实行教 考分 离
动物生理学 的内容不仅 多, 而且抽象 , 不容易掌握 , 因此 需要通过做习题 的方式加强记忆和理解 , 这就需要题库建设。 题库内容涵盖面要广 , 题型要多样 , 不仅要有填空 、 选择 、 断 判 等客观题型 , 而且要有名词解释、 问答题 、 简答题 、 论述题等 主 观题型。检查学生学习效果不仅要看期末 考试成绩 , 而且要
动物生理学与后期专业课程关系非常密切 。 为提高学生 学习兴趣 , 我们在讲授动物生理学 时, 注意 同畜禽和人 的临床 病例相联系。如在讲授神 经系统 的基底神经节功 能时, 引人 帕金森氏病 、 舞蹈症; 在讲授 内分泌系统的功能时引人糖尿病 、 侏儒症、 甲亢等病症 ; 在讲授心脏生理时 , 引入心衰、 心室肥大、 风湿性心脏病的病症 。 通过将临床典型病 例引入生理学理论
1 l一 7
如 ‘ 二信使论” 而且要将 其与现代分子生物学激素作用机 第 ,
讲授 , 只能让学生在课后通过 自学 的方式理解掌握 。因此在
制结合起来讲解 , 这样可以培养学生对专业课的兴趣 , 为将来 专业课 的学习打下 良好基础. 。另外 , 生理学的发展离不开生 理学家 的艰辛劳动与创造性 的工作 , 因而在教学过程中应穿 插介绍一些他们的工作 和事迹 。例如 , 现代神经生物学奠基 人 Gog认 为神经元之间是连续关 系, li 因而提 出了网状学说 ,
这样就会影 响学生对所学知识 的感知和理解 。因此 , 在多媒 体教室上课 时 , 教师应站着讲课 , 适当控制讲授节奏 , 同时配 合 以适当的表情 、 光交流和肢体语言、 目 板书、 问等方式方 提 法和学生保 持互 动。这样可以活跃课堂教学气氛 , 调动学生 学 习的情绪 , 提高学生的学习兴趣和教学效果。因此 , 作为教 师要处理好多媒体教学与传统教学的关 系, 充分 吸收两者的 优点 , 避免各 自的不足 , 最大限度地 提高教学效果 。
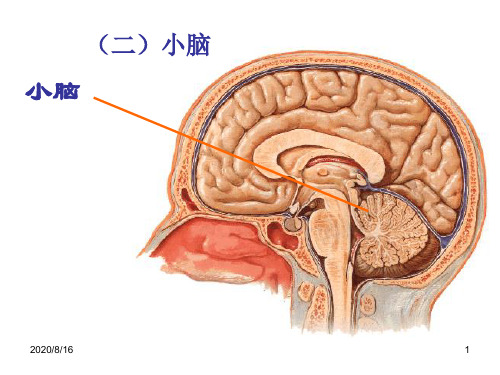
小脑和大脑的结构
固 2、机体 动物健康;大脑皮层清醒;无其它刺激干扰
2020/8/16
50
2020/8/16
大脑皮质 的6层结构
(1) 银染法示神经 元的形态
(2) 尼氏染色示6层 结构
(3) 髓鞘染色示神 经纤维的分布
51
边缘叶:隔区(胼胝体下回、终板旁回)、扣带回、
海马旁回、钩、海马、齿状回等。 边缘系统:由边缘叶与其附近的皮质及皮质下
结构组成。
边缘系统是内脏 活动的高级中 枢,其功能与 个体保存、 种族繁衍、 情绪反应等有关。
2020/8/16
52
边缘系统
1)概念: 边缘叶是指扣带回、海马旁回、钩和海马结构
等共同形成的穹窿形脑回。由边缘叶与其附近的 皮质及皮质下结构组成边缘系统。
2)机能 嗅觉和内脏活动有密切关系, 参与情绪性活动。 海马还与近期记忆等高级神经活动有关。
(蛛网膜下腔)
2020/8/16
32
2. 基底核
(1)尾状核 (2)豆状核 (3)杏仁核 (4)屏状核
壳 苍白球
纹状体:指尾状核和豆状核
新纹状体:指尾状核和壳
旧纹状体:指苍白球
2020/8/16
33
3.大脑的髓质
白质 (由神经纤维组成,分为三类)
(1)连合纤维:连接左右半球的纤维 (2)联络纤维:联络本半球各部之间的纤维 (3)投射纤维:连接大脑皮质与皮质下结构的纤维
外层
硬脑膜
内层
蛛网膜 软脑膜
硬脊膜 蛛网膜 软脊膜
2020/8/16
10
1)硬膜(dura mater) 硬脑膜分内、外两层,外层衬 于颅骨内面,有些地方内、外层之间有静脉窦。
中枢神经系统—脊髓

2、脑干
脑干在结构上比脊髓复杂,
它联系着视、听、平衡等专门的感受器,
是内脏活动的反射中枢和联系大脑高级中枢与各级
反射中枢的重要径路;
是大脑、小脑、脊髓以及骨骼肌运动中枢之间的桥
梁。
(1)脑干的外形: ①延髓 呈前宽后窄、背腹侧稍扁的四边形,位于小脑腹侧,尾侧在平
枕骨大孔与脊髓相连;吻侧与脑桥以延髓脑桥沟 (腹面 )和髓纹(背
d 、固有束:主要由背侧柱内的中间神经元的轴突组成,上行或下 行一段距离又返回灰质,以联系脊髓的不同节段。
4.脊髓的功能
(1)传导功能: 由上、下行纤维束来实现。 除头面部以外,身体的深、 浅部感觉以及大部分内脏感 觉都通过脊髓传导到脑。脑 对躯干和四肢骨骼肌运动以 及大部分内脏活动的管理也 要通过脊髓来完成。
能力单元十
10-1
脊髓
脑干
小脑
神经系统
中枢神经系统
延髓 脑桥 中脑
脑
间脑
大脑
神经系统的构造
一、中枢神经系统
(一) 脊髓 低级的反射中枢,又 是传导神经冲动的 传导径路。 联系外周与脑的桥梁
1.脊髓的位臵
位于椎管内 , 自枕骨大 孔后缘向后伸延至 荐部
2.脊髓的外形: 背腹略扁的圆柱体,全长粗细不等,颈膨大、腰 膨大。脊髓圆锥,终丝,腹侧正中裂、背侧正 中沟、背、腹外侧沟。马尾。 脊神经根:背侧根,脊神经节腹侧根。 背侧根和腹侧根在椎间孔附近合并成脊神经,经 椎间孔 出椎管。 每对脊神经根所连的一段脊髓为一个脊髓节段。
团排列在内侧,靠近中线处;脑神经感觉核团排列在外侧。
延髓开放部的腹外侧:下橄榄核,其传出纤维主要投 射至小脑,称橄榄小脑束,是组成小脑后脚的主要纤维。
②脑桥的内部结构∶
生物心理学复习
生物心理学复习1.中缝核RN。
蓝斑核LC。
脑干网状结构BRF。
视前区POA。
内侧视前区MPOA。
外侧视前区VLPO。
下丘脑外侧区LH。
下丘脑腹内侧区VMH。
室旁核PVN。
视上核SON。
视交叉上核SCN。
孤束核NTS。
下丘脑背内侧核DMH。
下丘脑腹外侧视前区VLOP。
乳头体结节核TMN。
2.背外侧被盖核LDT。
脑桥脚被盖核PPT。
3.穹窿下器SFO。
终板血管器VOLT。
4.视网膜下丘脑束RHT。
第一章绪论1.生物心理学(Biological Psychology)是研究行为及经验与大脑机能及机体其他生理活动相互关系(身—心关系)的实验科学。
研究心理或行为的生物学基础,从遗传、进化、生理机能尤其是神经系统生理机制等方面对行为和心理进行多层次、多角度的探究和阐述。
属于自然科学范畴。
2.生物心理学涉及:(1)神经生理学:神经系统结构和生理机能(2)神经解剖学:神经系统的形态结构(3)神经心理学:脑损伤与病人行为缺陷、心理障碍的关系(4)神经化学:神经系统中化学物质的组成和作用,神经活动的化学基础(5)发育神经生物学:个体发育过程中神经系统的发展变化(6)神经内分泌学:神经系统、内分泌腺分泌释放的激素之间的相互作用和生物效应(7)神经行为学:神经系统和动物行为的相互关系(8)比较心理学:不同种类动物行为特征和其发展规律(9)心理生理学:心理活动变化引起的生理反应(10)心理药理学:药物通过改变神经系统活动而对行为的影响(11)人工智能与神经网络:通过数学运算和电子线路模拟神经系统的机能活动并产生机器仿生行为(12)神经病学:神经系统机能障碍及其导致的行为缺陷(13)病理心理学:心理障碍及精神疾患的发生、发展、争端、治疗和预防。
3.生物心理学以人或其他动物为对象,研究行为的神经机制以及生物学基础、神经系统的进化和发展及其与行为的关系、感知觉、运动、动机、节律、情绪和学习记忆。
4.16世纪中叶诞生人体解剖学,是神解的肇端。
人体解剖生理学11第五章 第3节 间脑、小脑和端脑的形态结构
四、脑、脊髓被膜
(由外向内):
硬膜:
硬脑膜:大脑镰、
小脑幕
硬脊膜:
蛛网膜:蛛网膜颗粒 软膜: 脉络丛
五、脑的血液供应
1.动脉来源: (1)椎动脉 (2)颈内动脉 2.动脉分布特点: (1)在脑的腹面形成大脑动脉环(WILLIS 环) (2)大脑的动脉分为皮质支和中央支,分别分布于皮质 和髓质。 3.脑的静脉: 脑的静脉不与动脉伴行,可分为浅深两种。浅静脉位于 脑的表面,收集皮质和皮质下白质的静脉血,深部静脉 收集大脑深部的静脉血。深浅静脉均注入附近的硬脑膜 静脉窦。由静脉窦汇入颈内静脉出颅。
蛛网膜下腔
蛛网膜颗粒 上矢状窦 中央管
脉络丛:软脑膜及其 血管被室管膜包绕, 突入脑室形成脉络丛, 具有分泌脑脊液的功 能。 蛛网膜颗粒:蛛网膜 突入上矢状窦形成的 结构,可将脑脊液汇 入上矢状窦。
脑屏障
1.血-脑屏障: 由脑的毛细血管内皮细胞、 基膜和神经胶质细胞构成。 2.血-脑脊液屏障:脉络丛 内的毛细血管内皮细胞、 基膜和脉络丛上皮(室管 膜上皮)。 3.脑脊液-脑屏障:由室管 膜上皮、神经胶质细胞构 成。
大脑前动脉
前交通支 大脑中动脉 颈内动脉
后交通支
大脑后 动脉
椎动脉
大脑中动脉
大脑前动脉
大脑后动脉
小结脑的血液供应
1.动脉来源: (1)椎动脉 (2)颈内动脉 2.动脉分布特点: (1)在脑的腹面形成大脑动脉环(WILLIS 环) (2)大脑的动脉分为皮质支和中央支,分别分布于皮质 和髓质。 3.脑的静脉: 脑的静脉不与动脉伴行,可分为浅深两种。浅静脉位于 脑的表面,收集皮质和皮质下白质的静脉血,深部静脉 收集大脑深部的静脉血。深浅静脉均注入附近的硬脑膜 静脉窦。由静脉窦汇入颈内静脉出颅。
201509解剖学-神经系统-小脑、间脑、端脑(临床专业)
分叶:额叶、顶叶 枕叶、颞叶、岛叶
额叶 中央沟
大脑纵裂
顶叶 顶枕沟
中央沟 顶枕沟
额叶
岛叶
枕叶 顶叶
外侧沟
颞叶
枕叶
颞叶
(二)大脑半球的重要沟回
1. 半球上外侧面
(1)额叶: 中央前沟 额上沟 额下沟 中央前回 额上回 额中回 额下回
额上沟 额中回 额下沟
上纵束
豆状核
下纵束
钩束
(2)连合纤维
①胼胝体:嘴、膝、干、压部 ②前连合 — 连接两侧颞叶 ③穹窿 、穹窿连合
连接左、右半球的神经纤维
穹隆柱 前连合 胼胝体膝
穹隆体
胼胝体嘴 连合前穹隆
连合后穹隆 齿状回
胼胝体干
穹隆连合 胼胝体压部
乳头丘脑束 乳头被盖束
乳头体
穹隆脚
束状回 海马伞 海马
(3)投射纤维
①视上核:→ 视上垂体束 ②室旁核:→ 室旁垂体束
垂体后叶 (神经垂体)
视上垂体束
视上核
室旁核
室旁垂体束
功能:分泌加压素、催产素等
加压素:促进肾小管对水 和钠的重吸收,尿量减少。
催产素:促进平滑肌收缩, 血压升高,对子宫平滑肌 作用较为敏感。
漏斗核 结节垂体束
神经垂体
垂体前叶
2)与腺垂体的联系
漏斗核: → 结节垂体束 → 正中隆起的毛细血管
特点: ①上下颠倒,但头部是正的 ②左右交叉,一些肌则受两侧运动区的支配 ③身体各部分投影区的大小取决于功能
的重要性和复杂程度。
发出纤维组成锥体束,施行对骨骼肌运动管理。
运动人
(2)第Ⅰ躯体感觉区
神经电生理脑电图技术《专业实践能力》
专业实践能力知识点:脑电图的常见种类常规脑电图:由于癫痫样放电随机性很大,常规脑电图一般记录时间为20-40分钟左右,常常难以捕捉到癫痫样放电,所以目前使用率呈逐年下降趋势。
动态脑电图监测:动态脑电图监测(ambulatoryEEGmonitoring),AEEG或称便携式脑电图监测,通常可连续记录24小时左右,因此又称24小时脑电图监测。
由于没有录像设备,所以主要适用于发作频率相对稀少、短程脑电图记录不易捕捉到发作者;或癫痫发作已经控制,准备减停抗癫痫药物前或完全减停药物后复查脑电图(监测时间长且不需要剥夺睡眠)。
视频脑电图监测:视频脑电图监测(Video-EEG,VEEG)又称录像脑电图监测,是在脑电图设备基础上增加了同步视频设备,从而同步拍摄病人的临床情况。
监测时间可以根据设备条件和病情需要灵活掌握,从数小时至数天不等,但鉴于监测时间延长导致费用增多、有限的资源使病人预约等候时间长等情况,如EEG监测目的是用于癫痫诊断和药物治疗而不涉及外科手术,一般监测数小时且记录到一个较为完整的清醒-睡眠-觉醒过程的EEG多能满足临床诊治的需要。
目前各个医院根据实际情况设定的EEG监测时间长短均相对固定,时间段内绝大多数病人能记录到一个完整的清醒-睡眠-觉醒周期(监测前常需剥夺睡眠,仍不能入睡者必要时给予水合氯醛诱导睡眠),其阳性率与24小时动态脑电图相似,且同期录像监测提供了临床信息,是目前诊断癫痫最可靠的检查方法。
知识点:脑电图的适应症癫痫:是癫痫诊断和分型的重要检查手段,并能帮助观察治疗效果和判断预后,在癫痫诊治方面目前尚无任何检查手段可以替代脑电图。
脑外伤:普通检查难以确定的轻微脑损伤脑电图可能发现异常,如脑震荡时CT可表现为正常,而脑电图可有异常。
中枢神经系统感染,如各种脑膜炎、脑炎、脑寄生虫病等。
头痛、头晕、晕厥、睡眠障碍、精神和情绪障碍等。
意识障碍,一氧化碳中毒、酒精中毒、缺氧、药物中毒时都可以出现脑电图异常。
前扣带回的反映机制
Frontoparietal networks involved in categorization and item working memoryKurt Braunlich a ,Javier Gomez-Lavin b ,Carol A.Seger a ,⁎a Colorado State University,Cognitive Psychology and Molecular,Cellular and Integrative Neurosciences,Fort Collins,CO,USA bCUNY,Department of Philosophy,New York,NY,USAa b s t r a c ta r t i c l e i n f o Article history:Accepted 26November 2014Available online 4December 2014Keywords:Working memory Categorization Connectivity PCA fMRICategorization and memory for speci fic items are fundamental processes that allow us to apply knowledge to novel stimuli.This study directly compares categorization and memory using delay match to category (DMC)and delay match to sample (DMS)tasks.In DMC participants view and categorize a stimulus,maintain the cate-gory across a delay,and at the probe phase view another stimulus and indicate whether it is in the same category or not.In DMS,a standard item working memory task,participants encode and maintain a speci fic individual item,and at probe decide if the stimulus is an exact match or not.Constrained Principal Components Analysis was used to identify and compare activity within neural networks associated with these tasks,and we relate these networks to those that have been identi fied with resting state-fMRI.We found that two frontoparietal net-works of particular interest.The first network included regions associated with the dorsal attention network and frontoparietal salience network;this network showed patterns of activity consistent with a role in rapid orienting to and processing of complex stimuli.The second uniquely involved regions of the frontoparietal central-executive network;this network responded more slowly following each stimulus and showed a pattern of activ-ity consistent with a general role in role in decision-making across tasks.Additional components were identi fied that were associated with visual,somatomotor and default mode networks.©2014Elsevier Inc.All rights reserved.IntroductionCategorization and speci fic-item memory are fundamental processes which allow us to apply knowledge to novel situations.Cate-gorization requires abstraction from inherent stimulus features to gen-eralizable latent features,and plays an important role in the flexible transfer of knowledge and skills across stimuli and tasks (for review,see Seger and Miller,2010).In contrast,memory for speci fic items maintains these inherent stimulus features in order to enable us to make fine distinctions between items.Despite these fundamental dif-ferences,both categorization and speci fic item memory tasks recruit common cognitive control systems to support task performance (Seger and Peterson,2013),raising the question of how the same neural systems can serve different ends.This study directly compares categori-zation and speci fic item memory using delayed-match-to-category (DMC)and delayed-match-to-sample (DMS)tasks in which partici-pants encode a stimulus,maintain information across a delay,see a sec-ond stimulus and then decide if it matches the first.The tasks share similar structure,and therefore place similar demands on perceptual (stimulus encoding),motor (response execution)and some executivefunctions (working memory and decision-making).The tasks differ in what is encoded at the first stimulus and in the basis of the match –mis-match decision occurring at probe:speci fic item identity in the DMS task and category in the DMC task.Our design,therefore,allows us to isolate differences between processes associated with categorization and those associated with item-speci fic memory,and also to identify shared processes.Below we first discuss proposed shared cognitive con-trol functions across categorization and speci fic-item tasks and how they may rely on intrinsically connected frontoparietal neural networks.We then discuss aspects of cognitive processing speci fic to categoriza-tion and to item working memory.Finally we describe our task and our predictions.Shared cognitive control processes and intrinsic neural systemsMuch recent research has focused on how frontoparietal networks can be flexibly recruited to support cognitive control in diverse task en-vironments (Cole et al.,2013;Dumontheil et al.,2011;Duncan,2010).Multiple networks supporting cognitive control have been identi fied,and although there is currently little consensus concerning network no-menclature,we will focus on two networks that show coactivation across a variety of cognitive tasks and correlated patterns of intrinsic ac-tivity during resting-state fMRI (Dosenbach et al.,2007;Seeley et al.,NeuroImage 107(2015)146–162⁎Corresponding author at:Department of Psychology,1876Campus Delivery,Colorado State University,Fort Collins,CO 80523,USA.Fax:+19704911032.E-mail address:Carol.Seger@ (C.A.Seger)./10.1016/j.neuroimage.2014.11.0511053-8119/©2014Elsevier Inc.All rightsreserved.Contents lists available at ScienceDirectNeuroImagej ou r n a l h o m e p a ge :w ww.e l s e v i e r.c o m /l oc a te /yn i mg2007).Thefirst,the salience network(abbreviated here as SA),which has important nodes in the anterior insula/frontoinsular cortex and dorsal anterior cingulate(ACC)/medial frontal gyrus,is thought to play an important role in bottom-up detection of salient external events,the coordination of functional networks to meet task demands, and in moderating autonomic arousal(Medford and Critchley,2010; Menon,2011;Menon and Uddin,2010;Sridharan et al.,2008).The sec-ond,the central executive network(FP-CEN),which has important nodes in the dorsolateral prefrontal cortex and posterior parietal cor-tex/intraparietal sulcus,is thought to operate on the salient stimuli marked by the SA network(Seeley et al.,2007),and to play an impor-tant role in the manipulation and maintenance of these representations in working memory and rule-based processes(Miller and Cohen,2001).Intrinsic connectivity has also identified other networks,such as the somatomotor network(SM;primary motor and somatosensory cortex), dorsal attentional network(DA;premotor and superior parietal cortex), default mode network(DMN;medial frontal and posterior cingulate re-gions,inferior parietal and medial temporal lobe),and visual network (VS;occipital and inferior temporal cortex)(Buckner et al.,2011;Choi et al.,2012;Yeo et al.,2011).A focus of recent research has been to identify how these networks interact,and one particularly important finding is that the FP-CEN and SA,which show greater activity during cognitively-demanding tasks(Chen et al.,2013;Dang et al.,2012; Vanhaudenhuyse and Demertzi,2011)are anticorrelated with the DMN.The SA is thought to play an important role in mediating this anticorrelated relationship,and in switching from the DMN to the FP-CEN in response to salient external events(Bonnelle et al., 2012;Goulden et al.,2014;Menon,2011;Palaniyappan et al.,2013; Sridharan et al.,2008).How these primarily cortical intrinsic connectivity networks interact with subcortical and cerebellar regions is an active area of research. Buckner and colleagues,for instance,examined functional connectivity between the cortical intrinsic connectivity networks and the basal gan-glia and the cerebellum(Buckner et al.,2011;Choi et al.,2012).Both basal ganglia and cerebellum had separate regions that correlated with each cortical network,consistent with known projections from cortex to these structures.Particularly relevant for our study are the in-terconnections with the FP-CEN,which are primarily correlated with the dorsal head and body of the caudate nucleus(Choi et al.,2012), and the lateral cerebellar hemisphere(Buckner et al.,2011).CategorizationCognitive neuroscience studies have associated categorization with a large distributed neural network including the basal ganglia(Seger, 2008),lateral frontal(Muhammad et al.,2006),lateral parietal cortex (Daniel et al.,2011;Freedman and Assad,2009;Rishel et al.,2013), precuneus(Wenzlaff et al.,2011),premotor and supplementary motor areas(Ashby et al.,2007;Little et al.,2006;Waldschmidt and Ashby, 2011).Although still an active area of research,clues are emerging as to the individual contributions made by each region.The basal ganglia have been associated with multiple processes:posterior regions are involved in mapping visual stimuli to category,and category to motor response,whereas anterior regions and the ventral striatum are associ-ated with feedback and reward processing(Seger,2008).Frontal re-gions have been associated with maintenance and implementation of categorization rules(Antzoulatos and Miller,2011;Buschman et al., 2012;Freedman et al.,2001;Meyers et al.,2008;Muhammad et al., 2006;Wallis and Miller,2003).The parietal cortex combines category with motor response,and may be responsible for integration of relevant information for category membership(Freedman and Assad,2009; Shadlen and Newsome,2001;Swaminathan and Freedman,2012). The precuneus and SMA,along with regions of the basal ganglia they interact with,may be associated with setting a response criterion (Forstmann et al.,2008;Wenzlaff et al.,2011).In addition,infero-temporal cortex performs relevant visual processing necessary for categorization,though it is still unclear the degree to which this region changes with learning and contributes to the representation of novel categories.Previous categorization studies in humans have typically required participants to view,categorize and respond to single stimuli in rapid succession.However,like the DMC task,real life situations often have a delay between the categorization of a stimulus and a subsequent be-havioral response,or require that multiple categorical representations be integrated in order to determine the correct response.The DMC task is advantageous in that it allows us to examine category mainte-nance and integration across stimuli,and also allows the dissociation of categorization processes from those related to motor preparation. The DMC task was originally developed for research with non-human primates,whichfind category sensitivity independent of motor re-sponse for neurons in inferotemporal,parietal,frontal,and basal ganglia regions(Freedman and Miller,2008).Electrophysiological recordings suggest coordination between the frontoparietal network and regions within the inferior temporal lobe during this task,such that inferior temporal regions tend to be more sensitive to the visual features of individual exemplars,while prefrontal regions are more sensitive to fea-tures relevant for successful task performance(e.g.,categorical-status of thefirst stimulus,and match–mismatch status of the second;Freedman et al.,2003;Meyers et al.,2008).Working memoryThe DMS task has been used extensively to investigate specific-item working memory in human and non-human primates.A large body of researchfinds that frontoparietal regions are recruited during the per-formance of DMS tasks(Sala et al.,2003).However,there are some dif-ferences based on task demands;for example,working memory for objects rather than spatial location is particularly reliant on ventrolater-al PFC regions in the middle and inferior frontal gyri(Sala et al.,2003). There is also evidence that working memory for objects involves interactions between these frontoparietal networks and higher order visual cortical regions involved in representing the objects(Gazzaley et al.,2004),and evidence that memory for specific items can lead to interactions with the hippocampus(Rissman et al.,2008).Neural net-works recruited during DMS performance vary depending on task de-mands.Increased working memory demands have been associated with increased connectivity between regions in the inferotemporal cortex and the hippocampus,and decreased connectivity between inferotemporal regions and the inferior frontal gyrus(Rissman et al., 2008).Similarly,during the delay epoch,inferotemporal regions associ-ated with task-relevant processes show increased connectivity with the frontoparietal network while regions associated with task-irrelevant processes show increased connectivity with the default mode network (Chadick and Gazzaley,2011).Present studyIn the present study,we directly compared patterns of activity dur-ing DMC and DMS tasks utilizing the same perceptually-similar stimuli (young Caucasian female faces)and the same timing and responses such that the tasks differed only in the requirement to either categorize the face or remember the specific face.As in several previous DMS studies,we chose to use facial stimuli,as the processing of these stimuli is known to occur with localized regions of the fusiform cortex(cf., Gazzaley et al.,2004;Rissman et al.,2008).Two versions of the DMC task were used,which we termed“Category”and“Label.”In both,par-ticipants viewed a face at encoding,categorized it,and maintained the category membership across a delay.At probe,the conditions differed: in the Category version participants viewed a second face,whereas in the Label version they viewed the category label(“A”or“B”).In both of these conditions,participants decided whether the categories matched.The Label condition allowed us to discriminate between147K.Braunlich et al./NeuroImage107(2015)146–162activity due to comparing category labels and match–mismatch deci-sion making,versus activity due to viewing and categorizing the face. Thus,we predicted that regions involved in stimulus categorization should have high activity at encoding for both Label and Category,but only for Category at probe.However,regions associated with category match–mismatch decision making should show activity more broadly in both tasks.We predicted some common and some differing patterns of activity based on the shared and individual characteristics of categorization and item working memory.First,because of the paired task design that equated basic visual and motor demands,we predicted similar recruit-ment of the visual and motor systems.Second,as both tasks require weighing evidence towards the binary response options,we predicted that the tasks would commonly elicit activity in regions associated with general decision-making processes(Freedman and Assad,2011; Seger and Peterson,2013).We predicted that the primary differences between tasks would be found in regions associated with the FP-CEN. Categorization involves several different strategies that require cogni-tive control,including evaluating information with respect to categori-zation criteria and mapping the stimulus to category membership (Seger and Peterson,2013).In contrast,working memory requires different control processes for encoding and maintenance,potentially via interactions with inferotemporal cortex and the hippocampus (Rissman et al.,2008).MethodsParticipantsSeventeen participants were recruited from the Colorado State Uni-versity Community.All participants were healthy,right-handed adults (11females,6males)with an average age of27(range:20–37).Partici-pants were screened for history of psychiatric or neurological disorders, for current use of psychoactive medications,and exclusionary criteria for fMRI(e.g.,claustrophobia,metallic implants).StimuliTwenty-five similar young adult female Caucasian faces were selected for the stimulus set.To discourage use of verbalizable memory strategies, all images were cropped so that the whole face,but no other defining characteristics,was shown.The faces were then warped and resized to subtend a visual angle of roughly3.9degrees horizontally and6.9degrees vertically.For each participant,eight stimuli were randomly assigned to category“A”and eight were randomly assigned to category“B.”This type of categorization task is sometimes referred to as arbitrary,or un-structured because the stimuli are randomly assigned to category and do not include any intentional within-category similarities.Unstructured tasks rely on procedural knowledge to a similar degree as structured im-plicit categorization tasks(Crossley et al.,2012),and recruit similar corti-cal and striatal systems(Seger et al.,2010,2011).The remaining stimuli were used in the Item condition.ProcedurePrior to scanning,participants performed two tasks on a laptop com-puter;theyfirst learned to categorize faces and then trained on a task that was similar to what they would later perform in the scanner.In the category-learning task,participants learned to categorize each of the16faces into category“A”or category“B”via trial and error.On each trial,a face was presented in the center of the computer screen, and the category labels were presented at the bottom left and rightofFig.1.During each trial,participantsfirst saw a cue(Item condition:“Match the Specific Face”;Category and Label conditions:“Match the Category”)for1.5s,they then saw thefirst stim-ulus(1.5s).After a brief delay(9s)they saw a second stimulus(3s).In the Category and Item conditions,the second stimulus was a face.In the Label condition,the second stimulus was the category label(“A”or“B”).After three seconds,a match mismatch cue was presented,and participants had to indicate whether the second stimulus matched thefirst.Trials were sep-arated by a jittered ITI(1.5–9s).148K.Braunlich et al./NeuroImage107(2015)146–162the screen.To encourage participants to learn category labels rather than specific motor responses,the locations of the labels were randomly determined on each trial(i.e.,“A”appeared at the bottom left of the screen on some trials,but at the bottom right on others).Participants responded by pressing the“d”key on the laptop keyboard if the chosen category label was on the bottom left side of the screen,and the“k”key if it was on the bottom right.Each image remained on the screen until the participant made a response.Following each response,auditory and visual feedback was presented for0.75seconds.Following correct responses,the word“Correct”was presented in the center of the com-puter screen with a pleasant tone.Following incorrect responses,the word“Wrong”was presented with an unpleasant tone.Every100trials, participants were given a self-paced break.Participants trained until they reached an85%correct performance criterion on thefinal block of100trials.To gain familiarity with the task that would later be used in the scanner,after reaching the85%performance criterion,participants performed a second training task similar to that they would perform in the scanner(Fig.1illustrates the task performed in the scanner). At the beginning of each trial,a cue was presented for1.5seconds, which instructed participants to either“Match the Specific Face,”or “Match the Category.”After this cue was presented,a face stimulus was presented for1.5seconds in the center of the computer screen. After a nine-second delay(during which time participants saw only a blank screen),a second face stimulus(or,in the Label condition, the category label“A”or“B”)was presented for three seconds.Two response cues,“Match”and“Mismatch”were then added to the dis-play(at the bottom left and bottom right of the screen,respectively). On trials in which participants were cued to remember the specific face,participants had to indicate whether the second face was the same as thefirst.On trials in which participants were instructed to remember the category,they had to indicate whether the second stimulus(face or category label)belonged to the same category as thefirst.No feedback was delivered.Trials were separated by a1.5 second inter-trial interval(ITI)during training.All participants per-formed30trials of the second training task.The assignment of con-dition to trial was random(selected with replacement),such that there were10trials per condition.As in thefirst training task,partic-ipants made their responses via the indexfingers of their right and left hands using the“d”and“k”keys.In the scanner,the task was similar to the second pretraining task described above.Stimuli were,however,presented via a back-projection mirror positioned above the participant,and responses were made withfingers of the right and left hands via separate button boxes.The ITI was jittered according to a positively-skewed geometric distribution ranging from1.5to9seconds.Participants performed two 15-minute runs.In order to increase power for analyses of the Item trials in contrast with Categorical Encoding trials,we presented fewer Catego-ry(14)and Label(14)trials than Item trials(17)during each run.Both correct and incorrect trials were included in the analyses to maximize statistical power.Image acquisitionImages were obtained with a3.0Tesla MRI scanner(Siemens)at the Intermountain Neuroimaging Consortium(Boulder,CO).The scanner was equipped with a12-channel head coil.Structural images were col-lected using a3D T1-weighted rapid gradient-echo(MPRAGE)sequence (256×256matrix;FOV,256;1921–mm sagittal slices).Functional im-ages were reconstructed from28axial oblique slices obtained using a T2*-weighted2D-EPI sequence(TR,1500ms;TE,25ms;FA,75;FOV, 220-mm,96×96matrix;4.5-mm thick slices;no inter-slice gap). Each run consisted of597volumes.Thefirst three volumes,which were collected before the magneticfield reached a steady state,were discarded.PreprocessingImage preprocessing was performed using SPM8(http://www.fil. /spm/software/spm8).Preprocessing involved correction of slice time acquisition differences(images were adjusted to the14th slice),motion correction of each volume to thefirst volume of the first run using3rd degree B spline interpolation,coregistration of the functional to the structural data,normalization to the MNI template, smoothing(with a6mm Gaussian kernel),and temporalfiltering (with a128s high-passfilter).One participant had excessive head-movement(defined as greater than3mm translational or2.5°rotation-al movement).This participant's data were excluded from subsequent analyses.FMRI analysesUnivariate general linear modelTrial epochs(i.e.,encoding,delay,and probe)were modeled as inde-pendent regressors in a univariate whole-brain analysis.All trials were included in this analysis.The encoding regressor was coded as a1.5s boxcar coinciding with the presentation of thefirst stimulus(1.5–3s after cue onset).The delay period was modeled as a2second boxcar placed halfway through the delay period(6–8s after cue onset).The probe period was modeled as a3second boxcar coinciding with the pre-sentation of the second stimulus(12–15s after cue onset).As in previ-ous research,the onsets of these regressors were placed at least4 seconds apart to minimize the influence of preceding trial epochs (Barde and Thompson-Schill,2002;Druzgal and D'Esposito,2003; Gazzaley et al.,2004,2007;Pessoa et al.,2002;Postle et al.,2000; Rissman et al.,2004,2008;Zarahn et al.,1997).We convolved each box-car with the canonical SPM HRF.For each contrast,we generated maps at an uncorrected threshold of p b0.001and corrected for multiple com-parisons using the topological false-discovery rate(Chumbley and Friston,2009).Constrained Principal Component Analyses(CPCA)To investigate task-related differences across functional net-works,we used Constrained Principal Component Analyses(CPCA) using afinite-impulse response(FIR)model,as implemented in the fMRI-CPCA toolbox(/projects/fmricpca).CPCA com-bines multivariate regression and principal component analysis to identify multiple functional networks involved in a given task,and has been used successfully with similar experimental paradigms (Metzak et al.,2011,2012;Woodward et al.,2013).This approach is mathematically similar to Partial Least Squares analysis (McIntosh et al.,1996),and is attractive,as it allows estimation of changes in the BOLD response across peristimulus time within each functional network,and also allows statistical inference concerning the importance of each column of the design matrix for each component.CPCA involves preparation of two matrices:Z and G.Z contains the BOLD time course of each voxel,with one column per voxel and one row per scan.The design matrix,G contains a FIR model of the BOLD re-sponse related to the event onsets.The BOLD time-series in Z is regressed onto the design matrix,G,yielding a matrix,C,of regression weights.GC thus contains the variance in Z,that is accounted for by the design matrix,ponents are then extracted from the variance in GC via singular value decomposition,yielding U,a matrix of left singu-lar vectors,D a diagonal matrix of singular values,and V,a matrix of right singular vectors.The columns of VD,which reflect component loadings,can be overlaid on a structural image to visualize the function-al networks.To maximize the variance of the squared loadings,we or-thogonally rotated VD prior to display.The top5%of these rotated loadings for each component are illustrated in Figs.3B,4B,5B,6B and7A.Several previous studies(e.g.,Metzak et al.,2011,2012)have used a similar threshold.For each combination of peristimulus time-point,condition and participant,CPCA estimates a set of predictor149K.Braunlich et al./NeuroImage107(2015)146–162Fig.2.Whole brain univariate analyses:activity differing between conditions within individual trial epochs (Encoding and Probe).Top figure:Encoding epoch.Red:Categorical Encoding (Category and Label trials)greater than Item;blue:Item greater than Categorization Encoding.Bottom figures:Probe epoch.Top:Green:Label greater than Item;blue:Item greater than Label.Middle:Green:Label greater than Category;Red:Category greater than Label.Bottom:Red:Category greater than Item.Blue:Item greater than Category.Regions of activity are overlaid on the average normalized anatomical image across subjects.For each contrast,we generated maps at an uncorrected threshold of p b 0.001and corrected for multiple compar-isons using the topological false-discovery rate (q b .05;Chumbley and Friston,2009).ponent 1.Note the recruitment of regions involved in the salience network (inferior frontal/anterior insula and anterior cingulate)along with visual processing regions (fusiform gyrus and occipital lobe).A)The top 5%of component loadings overlaid on the MNI template provided by MRIcron (3d renderings,top)and the average structural image (slices,bottom).B)Predictor weight timecourse across peristimulus time.Error bars represent the standard error of the mean.Vertical lines indicate onsets of visual stimuli.150K.Braunlich et al./NeuroImage 107(2015)146–162weights(P),which are the values that relate the design matrix,G,to the networks associated with each component,such that U=G×P.All tri-als were included in this analysis.We conducted a repeated measures ANOVA using SPSS,which allowed us to investigate the consecutive scans where the slope of the predictor weight time course differed between conditions.This allows investigation of differences between conditions or contiguous time points,without considering the complex hemodynamic shape(cf., Metzak et al.,2012).For these analyses,and in Figs.3B,4B,5B,6B and7A,we adjusted the time-series so that thefirst observation was zero for all conditions(cf.,Metzak et al.,2011,2012;Woodward et al., 2013).We tested assumptions of sphericity,and controlled for viola-tions using Greenhouse–Geisser adjusted degrees of freedom.Readers more familiar with the interpretation of statistical maps derived from univariate analyses should take care when interpreting the multivariate results shown in Figs.3,4,5,6and7.Whereas sta-tistical maps derived from univariate analyses provide information about activity occurring within specific regions,each CPCA compo-nent reflects a pattern of task-related variance derived from all voxels in the brain.The maps derived from CPCA analyses,therefore, provide information about regions that cooperate to subserve a par-ticular function.Whereas most univariate analyses assume a HDR shape by using a standard GLM with a canonical HRF,CPCA uses a FIR model which uncovers network-specific HDR shapes of task-related variance in a data-driven manner.This is valuable,as it can help segregate and characterize task-related processes that might not have been predicted by the experimenter.In the present paper,we use univariate analyses to characterize ac-tivity occurring within specific regions of the brain,and we use CPCA to investigate how distributed regions coordinate to subserve different processes.In the tables provided,we label cluster peaks according to a 7-network parcellation identified in previous research(Buckner et al., 2011;Choi et al.,2012;Yeo et al.,2011),but refer to some regions that these papers term the ventral attentional network as the salience network(SA),in line with current usage(Buckner et al.,2013).ResultsBehavioralAll trials for which participants made a behavioral response were in-cluded in all analyses.Accuracy was highest for the Item conditions (M=94.87%correct,SD=5.83),lower for the Label condition(M= 81.11%,SD=12.36)and lowest for the Category condition(M= 75.46%,SD=16.71),F(2,45)=10.25,p b.001,η2=0.31.The accuracy difference between the Label and Category conditions is likely related to the different number of categorization decisions required for each con-dition:the Category trials required participants to categorize stimuli at encoding and probe,and an error on either decision could lead to an in-correct response,whereas the Label trials required participants to cate-gorize stimuli only at encoding.Performance in the Label condition was close to that of the85%accuracy criterion from the learning phase.We did not collect reaction time data because it was unlikely to be of inter-est due to the requirement that participants delay their response until the response cue was presented.NeuroimagingUnivariate GLM analysesWhole brain GLM analyses were used to examine regions of activ-ity during each trial epoch:encoding,delay and probe(cf.,Gazzaley et al.,2004,2007).Because the Category and Label trials were iden-tical until the onset of the second stimulus,these conditions were combined as the“categorical-encoding”condition for examination of activity during the encoding and delay epochs.In this section we present univariate regions of activity across the whole brain;we also discuss these results masked by each component later following the CPCA results.As can be seen in Table A.1and Fig.2,during encoding,the Categorical-Encoding trials elicited greater activity than Item trials pri-marily within frontal lobe regions(middle cingulate,superior medial gyrus,inferior frontal/anterior insula)and subcortical regions that are known to interact with the frontal lobe(right caudate,left cerebellar lobule VI).These regions participate in the frontoparietal intrinsic con-nectivity network(Yeo et al.,2011).In addition,categorical encoding recruited visual regions including the bilateral calcarine gyri.The Item condition elicited greater activity than Categorical-Encoding trials in the left inferior frontal gyrus,regions of the temporal and occipital lobe associated with high level visual processing,and the bilateral hip-pocampus.All of these regions have been identified in previous studies as being recruited during visual working memory encoding(Gazzaley et al.,2007;Sala et al.,2003).The only region showing significant activation in response to both conditions(conjunction analysis,contrast with implicit baseline)at encoding was the crus I region of the right cerebellum.During the delay period,the majority of regions sensitive to dif-ferences between conditions showed patterns of activity suppressed below implicit baseline(cf.Gazzaley et al.,2004).To avoid difficul-ties in interpreting deactivation,we conducted a conjunction analy-sis,and have reported only regions that showed activity greater than implicit baseline and were also sensitive to direct contrasts between conditions.We found that regions in the right superior temporal lobe and middle cingulate gyrus showed significantly greater activity during Item trials than during Categorical-Encoding trials.No re-gions showed greater activity during Categorical-Encoding trials than during Item trials.During the probe epoch,Category and Label trials were analyzed separately,and compared with each other and with Item trials.Not sur-prisingly,during the probe epoch,conditions in which participants viewed faces(Category and Item)had greater activity in higher order visual processing regions than the Label condition(in which partici-pants viewed the Category Label,“A”or“B”).As shown in Fig.2,these included bilateral inferior occipital and bilateral fusiform gyri.Converse-ly,Label trials led to greater activity than Category and Item trials in other visual processing regions including the right cuneus/superior oc-cipital gyrus,and a region of the left fusiform(Label N Category only). These differences are likely due to visual processing differences be-tween faces and letters.In addition to visual regions,the Category N Label contrast during the probe epoch revealed recruitment of frontoparietal regions including the right superior medial gyrus,and the middle and posterior cingulate,along with a region of the cerebel-lum(left cerebellar crus II).The Category versus Item contrast(see Fig.2,bottom row)was the most direct comparison between categorization and item recognition; both conditions had similar requirements for viewing and processing face stimuli and making same-different judgments.The only region showing greater activity during Item trials than during Category trials was a region in the left middle temporal gyrus.Category trials elicited greater activity than Item trials in executive regions of the cerebellum, frontal(middle frontal,anterior insula/inferior frontal,and superior me-dial gyrus)and parietal regions(inferior parietal,angular gyrus,and precuneus),including the salience network.Finally a conjunction anal-ysis revealed that motor planning regions of the SMA were recruited in all three conditions,consistent with the similar motor response de-mands across the conditions.CPCAThe GLM model,GC,accounted for36.31%of the variance in the BOLD signal.Based on inspection of the scree-plot,we extractedfive components.After varimax rotation,thefirst throughfifth components accounted for14.15%,8.13%,4.95%,4.90%,and4.16%of the task-related variance,respectively.151K.Braunlich et al./NeuroImage107(2015)146–162。
第十七章中枢神经系统

背侧丘脑
上丘脑 中脑 小脑 底丘脑
组成
包括五部分
背侧丘脑 上丘脑 下丘脑 底丘脑 后丘脑
丘脑位于间脑的背侧部,是一对卵圆形
的灰质团块。被Y形的白质分为三个部分。 分成的三个部分是: 丘脑前核:与内脏活动有关。 丘脑内侧核:接受丘脑其它核团纤维 起整合作用。 丘脑外侧核:深、浅感觉纤维 外侧核 大脑皮质,是感觉的最后中继站。
分为31个节段。
脊髓全长有二个膨大,颈膨大在颈5至胸
1节段处。腰膨大位于腰2至骶3节段处。 脊髓膨大与肢体发达程度有关。
脊髓的外形
脊神经节 后根
前根
脊髓节段 与椎骨的对应关系
脊髓节段
C1—4 C5—8 T1—4 T5—8 T9—12 L1—5 S1—5、Co
对应椎骨
同序椎骨 高 1个椎骨 高2个椎骨 高3个椎骨 平对T 10 - 12 平对 T 12、L 1
的冲动直接或间接地传给前角运动神经 元,支配躯干和四肢骨骼肌的随意运动。
2)红核脊髓束:起自红核,纤维立即交
叉后下行,终止于脊髓。主要作用是调 节肌张力和协调肌群的运动。
白质 white matter 主要纤维束
薄束和楔束
传导深感觉
皮质脊髓侧束
支配同侧肢体运动
脊髓小脑后束
传导同侧下半身本体感
第十七章 中枢神经系统
脑(encephlon)• 位于颅腔内,由大脑、间
脑、中脑、脑桥、延髓及小脑 6 部分组 成,• 通常将延髓、脑桥、中脑3部分合称 脑干。
第一节 脊髓
(一)脊髓的外形 脊髓位于椎管内,呈圆柱形,上端平枕
骨大孔与延髓相连,下端平第一腰锥下 缘,长约45厘米。
从脊髓上发出31对脊神经。所以将脊髓
大脑的结构副本
间脑的分部
背侧丘脑 Dorsal Thalamus
后 丘 脑 Metathalamus
上 丘 脑 Epithalamus
下 丘 脑 Hypothalamus 底 丘 脑 Subthalamus
第四十七页,共99页。
背侧丘脑
下丘脑沟
上丘脑 下丘脑
大脑水管
第四十八页,共99页。
尾状核
终纹
背侧丘脑
中脑
• 动眼神经核
• 滑车神经核 • 展神经核 • 舌下神经核
第二十八页,共99页。
一般躯体运动柱
名称
位置 相关脑神经 分布区
动眼神经核 上丘 动眼神经 5块
水平
眼外肌
滑车神经核 下丘水平 滑车神经 上斜肌
展神经核 面神经丘 展神经 水平
外直肌
舌下神经核 舌下神经 舌下神经 舌肌
三角深方
第二十九页,共99页。
第七十四页,共99页。
躯体感觉区
位置中央后回及中央旁小叶后部。 特点倒立人形、头部正置
交叉支配 投影区大小与感觉的敏感性有关
第七十五页,共99页。
视区
位置 距状沟上下的皮质。 特点 一侧视皮质接受两眼同侧半来
的视网膜冲动
第七十六页,共99页。
运动性语言中枢-说话中枢
位置 额下回后部。 临床 此区受损,发音正常,不能用语言
居统治地位
脑颅骨生长速度差异
沟回扩大表面积
脑的正中矢状切面
第六十三页,共99页。
中央沟 外侧沟 顶枕沟
端脑三沟
第六十四页,共99页。
端脑五叶
额叶
顶叶
颞叶
枕叶
岛叶
第六十五页,共99页。
端脑三个极
84端脑

胼胝体沟 额上回 扣带回 中央旁小叶 楔前叶 扣带沟 胼胝体干 胼胝体 (压部) 穹窿
半球下面
周围部:嗅球、嗅束、嗅三角、内、外 侧嗅纹、前穿质。 1)嗅脑 (旧皮质) 中枢部:海马回前部、海马、齿状回、 杏仁核等。
穹隆体
齿状回 海马回 海 马 海马伞
半球下面
嗅球 嗅束 嗅三角 前穿质
嗅三角 灰结节
皮质神经元间及传入纤维间联系模式图
从系统发生角度:
原皮质(海马、齿状回)和 旧皮质(嗅脑)为3层结构 海马三层结构: 分子层 锥体细胞层 多形细胞层
新皮质基本为6层结构 不同区域的皮质,各层的厚 薄、纤维的疏密以及细胞成 分都不同
海马与海马旁回 间有过渡区
大脑纵裂
(一) 端脑的外形和分叶 中央沟 大脑纵裂 胼胝体 纵裂底连接两半球的纤维束板 大脑横裂 外侧沟 中央沟 顶枕沟 额叶 颞叶 枕叶 顶叶 岛叶
纹状体在调节躯体运动中起重要作用 苍白球参与学习与记忆 杏仁核是一个重要的情绪中枢,主要负责与恐惧相关 的情绪
纹状体病变:
①运动过多和肌张力降低:Huntington舞蹈 症(HD)、手足徐动症——新纹状体病变;
②运动过少和肌张力增高:Parkinson病 (PD)——黑质或苍白球(旧纹状体)病变。
Wernicke区 视觉性语言中枢 书写中枢 运动性语言中枢
听觉性语言中枢
(三)端脑的内部结构 纹状体
尾状核 豆状核
新纹状体 壳 苍白球—旧纹状体
1.基底神经核: 位于大脑半 球基底部大 的灰质团块, 位置靠近脑 底,包括纹 状体、屏状 核、杏仁体。
尾状核 纹状体 豆状核
新纹状体 壳 苍白球—旧纹状体
• 白质:不含胞体只有神经纤维的部分
