Oracle11g等待事件解析
Oracle数据库buffer busy wait等待事件

当会话意图访问缓冲存储器中的数据块,而该数据块正在被其它会话使用时产生buffer busy waits事件。
其它会话可能正在从数据文件向缓冲区存储器度曲同样的数据块,或正在缓冲存储器中对其进行修改。
为了确保读取器会话拥有与获得所有更改或无更改的数据块一致的映像,正在修改该数据块的会话在其标题中标记一个标志,让其他会话知道有一个更改正在进行而等候更改的的完成。
视图v$waitstat不是OWI的组件,但其为没一类缓冲区提供了有用的等待统计。
遭遇buffer busy等待事件最常见的缓冲区类为块、段标题、撤消块、撤消标题。
显示一个查询v$waitstat视图的采样输出:具体示例如下:SELECT * FROM V$waitstat WHERE COUNT>0;CLASS COUNT TIME------------------ ---------- ----------data block 4170082 1668098segment header 116 98undo header 916 1134undo block 2087 16811、等待参数buffer wait busy的等待参数描述如下:P1 在Oracle 8及其以后版本的数据库里,P1显示询问数据块驻留的绝对文件号。
P2 进程需要访问的实际块号。
P3 在Oracle10g以前的版本中,着是表示等待原因的数字。
Oracle在内河代码中在多个地方用不同的原因码提交。
该原因码取决于版本。
2、等待时间100厘秒或1秒。
· Oracle会话正在等待钉住一个缓冲区。
必须在读取或修改缓冲区前将它钉住。
在任何时刻只有一个进程可以钉住一个缓冲区。
·buffer busy waits表明读/读、读/写、写/写争用。
·采取的适当措施取决于P3参数中的原因码。
在SGA中读取或修改缓冲区的会话必须首先获取cache buffers chains锁存器,并且遍历这个缓冲区链,直到他发现必需的缓冲区头。
安装了oracle 11g之后遇到的问题及解决方法
安装了oracle 11g之后遇到的问题及解决方法
之前电脑上安装的是oracle 10g的客户端,后来又安装了oracle 11g 的客户端,却发现原来的项目不能正常运行了,登录总是提示用户名不存在,怀疑根本没有连接上数据库,后来捕获异常信息提示:
ORA-12154: TNS:could not resolve the connect identifier specified
即无法解析指定的连接标识符
这是缺少环境变量:TNS_ADMIN
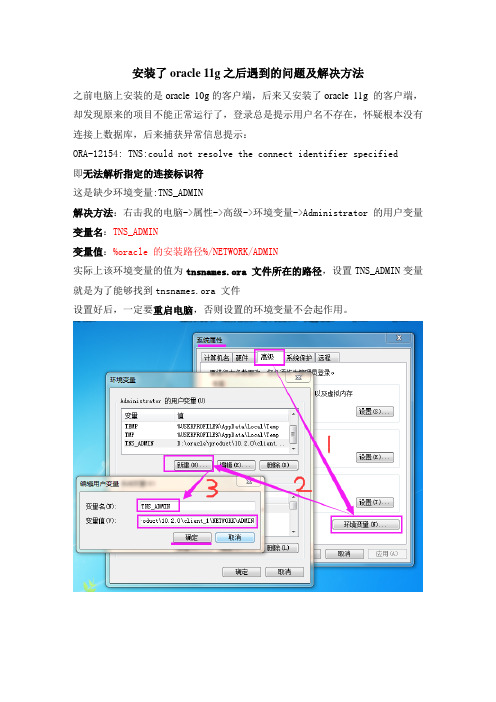
解决方法:右击我的电脑->属性->高级->环境变量->Administrator 的用户变量变量名:TNS_ADMIN
变量值:%oracle 的安装路径%/NETWORK/ADMIN
实际上该环境变量的值为tnsnames.ora 文件所在的路径,设置TNS_ADMIN变量就是为了能够找到tnsnames.ora 文件
设置好后,一定要重启电脑,否则设置的环境变量不会起作用。
后来又发现执行sql语句,中文字符全部显示乱码,这是字符集的问题,同样需要添加一个环境变量
解决方法:右击我的电脑->属性->高级->环境变量->Administrator 的用户变量变量名:NLS_LANG
变量值:SIMPLIFIED CHINESE_CHINA.ZHS16GBK。
oracle11G AWR使用及分析

1.先看一张图片,描述awr和ash的一些基础信息1 SQL> conn /as sysdba2 Connected.3 SQL> @?/rdbms/admin/awrrpt.sql45 Current Instance 6~~~~~~~~~~~~~~~~ 7 8 DB Id DB Name Inst Num Instance 9 ----------- ------------ -------- ------------103918594034ORCL 1orcl1112 13 Specify the Report Type14~~~~~~~~~~~~~~~~~~~~~~~15 Would you like an HTML report, or a plain text report?16 Enter 'html'for an HTML report, or'text' for plain text17 Defaults to'html'18 Enter value for report_type: html1920 Type Specified: html212223 Instances in this Workload Repository schema24 ~~~~~~~~~~~~~~~~~~~~~~~~~~~~~~~~~~~~~~~~~~~~2526 DB Id Inst Num DB Name Instance Host27------------ -------- ------------ ------------ ------------28 *39185940341 ORCL orcl DCMSBDM2930 Using 3918594034for database Id31 Using 1for instance number323334 Specify the number of days of snapshots to choose from35~~~~~~~~~~~~~~~~~~~~~~~~~~~~~~~~~~~~~~~~~~~~~~~~~~~~~~36 Entering the number of days (n) will result in the most recent37 (n) days of snapshots being listed. Pressing <return>without38 specifying a number lists all completed snapshots.394041 Enter value for num_days: 24243Listing the last 2days of Completed Snapshots4445 Snap46 Instance DB Name Snap Id Snap Started Level47------------ ------------ --------------------------- -----48 kobra KOBRA 122720Aug 201200:00149122820Aug 201201:00150122920 Aug 201202:00151123020 Aug 201203:001521231 20Aug 201204:00153 ...54126321Aug 201212:00155126421Aug 201213:00 156126521 Aug 201214:00157126621 Aug 201215:001585960 Specify the Begin and End Snapshot Ids61~~~~~~~~~~~~~~~~~~~~~~~~~~~~~~~~~~~~~~62 Enter value for begin_snap: 122763Begin Snapshot Id specified: 12276465 Enter value for end_snap: 126566End Snapshot Id specified: 1265676869 Specify the Report Name70~~~~~~~~~~~~~~~~~~~~~~~71 The default report file name is awrrpt_1_1227_1265.html. To use this name,72 press <return>to continue, otherwise enter an alternative.7374 Enter value for report_name:7576 Using the report name awrrpt_1_1227_1265.html7778<html><head><title>AWR Report for DB: KOBRA, Inst: kobra, Snaps: 1227-1265</title>7980 (8182)End of Report83</body></html>84 Report written to awrrpt_1_1227_1265.html85 86 SQL>exit2.AWR报告分析2.1CPU负载分析如果关注数据库的性能,那么当拿到一份AWR报告的时候,最想知道的第一件事情可能就是系统资源的利用情况了,而首当其冲的,就是CPU。
oracle常见等待事件及处理方法
我们可以通过视图v$session_wait来查看系统当前的等待事件,以及与等待事件相对应的资源的相关信息看书笔记db file scattered read DB ,db file sequential read DB,free buffer waits,log buffer space,log file switch,log file sync我们可以通过视图v$session_wait来查看系统当前的等待事件,以及与等待事件相对应的资源的相关信息,从而可确定出产生瓶颈的类型及其对象。
v$session_wait的p1、p2、p3告诉我们等待事件的具体含义,根据事件不同其内容也不相同,下面就一些常见的等待事件如何处理以及如何定位热点对象和阻塞会话作一些介绍。
<1> db file scattered read DB 文件分散读取(太多索引读,全表扫描-----调整代码,将小表放入内存)这种情况通常显示与全表扫描相关的等待。
当全表扫描被限制在内存时,它们很少会进入连续的缓冲区内,而是分散于整个缓冲存储器中。
如果这个数目很大,就表明该表找不到索引,或者只能找到有限的索引。
尽管在特定条件下执行全表扫描可能比索引扫描更有效,但如果出现这种等待时,最好检查一下这些全表扫描是否必要。
因为全表扫描被置于LRU(Least Recently Used,最近最少适用)列表的冷端(cold end),所以应尽量存储较小的表,以避免一次又一次地重复读取它们。
==================================================该类事件的p1text=file#,p1是file_id,p2是block_id,通过dba_extents即可确定出热点对象(表或索引)select owner,segment_name,segment_typefrom dba_extentswhere file_id = &file_idand &block_id between block_id and block_id + &blocks - 1;==================================================<2> db file sequential read DB 文件顺序读取(表连接顺序不佳-----调整代码,特别是表连接)这一事件通常显示单个块的读取(如索引读取)。
11g 错误密码延迟登录解决办法
问题11g, 默认情况FAILED_LOGIN_ATTEMPTS的值为10。
在连续10次错误登录之后,账户将被锁住,不能登录。
SQL> select profile, resource_name, limitfromdba_profileswhere profile = 'DEFAULT'andresource_name = 'FAILED_LOGIN_ATTEMPTS'; 2 3 4PROFILE RESOURCE_NAME LIMIT---------- -------------------- ----------DEFAULT FAILED_LOGIN_ATTEMPTS 10设置FALIED_LOGIN_ATTEMPTS值为unlimited,即账户不会被锁定。
SQL> alter profile default limit FAILED_LOGIN_ATTEMPTS unlimited;Profile altered.同时开三个session用错误密码登录同一账户,会造成一个等待事件,在11.2.0.1中该等待事件为row cache lock,据说在11.2.0.2之后中为libray cache lock(有待验证),实际上是11.2.0.1的一个bug:Bug 9720182: DUE TO ROW CACHE LOCK WAIT EVENTS IN DATABASE APPLICATION GOT HUNG,该bug在11.2.0.2中得到解决。
SELECT SID, USERNAME, PROGRAM, EVENT, wait_time, SECONDS_IN_WAITFROM V$SESSIONwhere OSUSER = 'JackLu'and program <> 'plsqldev.exe';在只有个session尝试登录时候,没有row cache lock的等待事件。
Oracle-11G-详解

•软件环境的一般要求–RHEL 5.x系统、RHEL 6.x系统–图形桌面环境+ 开发工具+ 中文Java支持–——在RHEL 6.x中安装时,ksh需改用5.x的软件包第一步:yum install yum*yum groupinstall “X 窗口系统”“桌面”“桌面平台”“开发工具”vi /etc/inittab 修改为5第二步:[root@dbserver ~]# yum -y install java-1.6.0[root@dbserver ~]# cd /usr/lib/jvm/jre-1.6.0/lib[root@dbserver lib]# mv fontconfig.bfc fontconfig.bfc.origin[root@dbserver lib]# cp fontconfig.RedHat.6.0.bfc fontconfig.bfc第三步:装之前看看有没有安装![root@dbserver ~]# rpm -e ksh[root@dbserver ~]# rpm -ivh .../ksh-5.2.14-36.el5.i386.rpm第四步:•用户环境要求–创建组账号oinstall、dba,用户账号oracle–创建Oracle基本目录–为用户oracle设置环境变量,并允许使用X终端[root@dbserver ~]# groupadd oinstall //安装组[root@dbserver ~]# groupadd dba //管理组[root@dbserver ~]# useradd -g oinstall -G dba oracle[root@dbserver ~]# passwd oracle[root@dbserver ~]# mkdir /opt/oracle[root@dbserver ~]# chown -R oracle:oinstall /opt/oracle/[root@dbserver ~]# chmod -R 775 /opt/oracle/第五步:[root@dbserver ~]# vi /home/oracle/.bash_profile……umask 022export ORACLE_BASE=/opt/oracleexport ORACLE_SID=orclexport DISPLAY=:0.0export LANG=zh_CN.UTF-8export ORACLE_HOME=/opt/oracle/product/11.2.0/dbhome_2[root@dbserver ~]# xhost +//须在图形环境执行access control disabled, clients can connect from any host看到以上提示,代表第五步成功!第六步:•内核及会话要求–修改内存调度参数、端口范围、I/O请求……–增大用户oracle的进程数、文件数限制[root@dbserver ~]# vi /etc/sysctl.conf……fs.aio-max-nr = 1048576 限制并发未完成的请求,应该设置避免I/O子系统故障fs.file-max = 6815744 文件句柄设置代表linux系统中可以打开的文件的数量。
oracle常见等待事件及处理方法

oracle常见等待事件及处理方法Oracle是一种流行的关系型数据库管理系统,它被广泛应用于企业级应用程序中。
在使用Oracle时,我们经常会遇到等待事件,这些事件可能会导致性能下降。
本文将介绍一些常见的Oracle等待事件及其处理方法。
1. DB FILE SEQUENTIAL READDB FILE SEQUENTIAL READ是一种等待事件,它表示Oracle正在等待从磁盘读取数据块。
这种等待事件通常发生在全表扫描或索引扫描期间。
要解决这个问题,可以考虑增加缓存大小或优化查询语句。
2. DB FILE SCATTERED READDB FILE SCATTERED READ是一种等待事件,它表示Oracle正在等待从磁盘读取散布的数据块。
这种等待事件通常发生在使用I/O密集型操作时。
要解决这个问题,可以考虑增加缓存大小或优化查询语句。
3. LOG FILE SYNCLOG FILE SYNC是一种等待事件,它表示Oracle正在等待将日志文件写入磁盘。
这种等待事件通常发生在事务提交时。
要解决这个问题,可以考虑增加日志缓存大小或优化事务提交频率。
4. ENQUEUEENQUEUE是一种等待事件,它表示Oracle正在等待获取锁。
这种等待事件通常发生在并发访问数据库时。
要解决这个问题,可以考虑优化锁定策略或减少并发访问。
5. LATCHLATCH是一种等待事件,它表示Oracle正在等待获取内部数据结构的锁。
这种等待事件通常发生在高并发访问数据库时。
要解决这个问题,可以考虑增加内存大小或优化查询语句。
6. CPU TIMECPU TIME是一种等待事件,它表示Oracle正在等待CPU资源。
这种等待事件通常发生在CPU密集型操作时。
要解决这个问题,可以考虑增加CPU资源或优化查询语句。
总之,Oracle等待事件可能会导致性能下降,但我们可以通过优化查询语句、增加缓存大小、优化锁定策略等方法来解决这些问题。
Oracle常见等待事件说明

Oracle的等待事件是衡量Oracle运行状况的重要依据及指标。
等待事件的概念是在Oracle7.0.1.2中引入的,大致有100个等待事件。
在Oracle 8.0中这个数目增加到了大约150个,在Oracle8i中大约有200个事件,在Oracle9i中大约有360个等待事件。
主要有两种类别的等待事件,即空闲(idle)等待事件和非空闲(non-idle)等待事件。
空闲事件指Oracle正等待某种工作,在诊断和优化数据库的时候,我们不用过多注意这部分事件。
常见的空闲事件有:• dispatcher timer• lock element cleanup• Null event• parallel query dequeue wait• parallel query idle wait - Slaves• pipe get• PL/SQL lock timer• pmon timer- pmon• rdbms ipc message• slave wait• smon timer• SQL*Net break/reset to client• SQL*Net message from client• SQL*Net message to client• SQL*Net more data to client• virtual circuit status• client message非空闲等待事件专门针对Oracle的活动,指数据库任务或应用运行过程中发生的等待,这些等待事件是我们在调整数据库的时候应该关注与研究的。
一些常见的非空闲等待事件有:• db file scattered read• db file sequential read• buffer busy waits• free buffer waits• enqueue• latch free• log file parallel write• log file sync1. db file scattered read-DB 文件分散读取这种情况通常显示与全表扫描相关的等待。
Oracle等待事件详解
Oracle等待事件详解个人分类:体系结构篇一.等待事件的相关知识:1.1 等待事件主要可以分为两类:即空闲(IDLE)等待事件和非空闲(NON-I DLE)等待事件。
1). 空闲等待事件指ORAC LE正等待某种工作,在诊断和优化数据库的时候,不用过多注意这部分事件。
2).非空闲等待事件专门针对ORAC LE的活动,指数据库任务或应用运行过程中发生的等待,这些等待事件是在调整数据库的时候需要关注与研究的。
在Or acle10g中的等待事件有872个,11g中等待事件1116个。
我们可以通过v$ev ent_n ame 视图来查看等待事件的相关信息。
1.2查看v$e vent_name视图的字段结构:SQ L> de sc v$event_name;名称是否为空?类型----------------------------------------- -----------------------EVE NT# NU MBEREVEN T_ID NUM BERNAME VARC HAR2(64)PARAM ETER1 VARC HAR2(64)PARAM ETER2 VARC HAR2(64)PARAM ETER3 VARC HAR2(64)WAIT_CLASS_ID NUMB ERW AIT_C LASS#NUMBE RWA IT_CL ASS V ARCHA R2(64)1.3 查看等待事件总数:SQL> sel ect c ount(*) fr om v$event_name;C OUNT(*)----------11161.4查看等待事件分类情况:/*Forma ttedon 2010/8/11 16:08:55 (QP5 v5.115.810.9015) */SEL ECT wait_class#, wait_clas s_id,w ait_c lass,C OUNT( * ) AS "count"FRO M v$eve nt_na meGR OUP B Y w ait_c lass#, wai t_cla ss_id, wai t_cla ssOR DER B Y w ait_c lass#;WAI T_CLA SS# W AIT_C LASS_ID WA IT_CL ASS c ount----------- ------------- -------------------- ---------- 0 1893977003 O ther 717 1 4217450380 App licat ion 1723290255840Confi gurat ion 24 3 4166625743 Ad minis trati ve 544 3875070507 Conc urren cy 32 5 3386400367 C ommit2 6 2723168908 Idl e 9472000153315Netwo rk 35 8 1740759767 Us er I/O 459 4108307767 Syst em I/O 30 10 2396326234 S chedu ler 711 3871361733 Clu ster 50 12644977587 Q ueuei ng 91.5相关的几个视图:V$SES SION:代表数据库活动的开始,视为源起。
数据库常见等待事件
等待事件的相关知识1.1 等待事件主要可以分为两类,即空闲(IDLE)等待事件和非空闲(NON-IDLE)等待事件。
1). 空闲等待事件指ORACLE正等待某种工作,在诊断和优化数据库的时候,不用过多注意这部分事件。
2). 非空闲等待事件专门针对ORACLE的活动,指数据库任务或应用运行过程中发生的等待,这些等待事件是在调整数据库的时候需要关注与研究的。
在Oracle 10g中的等待事件有872个,11g中等待事件1116个。
我们可以通过v$event_name 视图来查看等待事件的相关信息。
1.2 查看v$event_name视图的字段结构SQL> desc v$event_name;名称是否为空? 类型----------------------------------------- -------- ---------------EVENT#NUMBEREVENT_ID NUMBERNAME VARCHAR2(64)PARAMETER1VARCHAR2(64)PARAMETER2VARCHAR2(64)PARAMETER3VARCHAR2(64)WAIT_CLASS_ID NUMBERWAIT_CLASS#NUMBERWAIT_CLASS VARCHAR2(64)1.3 查看等待事件总数11gr2:SQL> select count(*) from v$event_name; COUNT(*)----------111610gr2 rac:sys@ORCL> select count(*) from v$event_name;COUNT(*)----------88910gr2:SQL> select count(*) from v$event_name;COUNT(*)----------8741.4 查看等待事件分类情况/* Formatted on 6/27/2011 12:54:45 PM (QP5 v5.114.809.3010) */ SELECT wait_class#,wait_class_id,wait_class,COUNT ( * ) AS "count"FROM v$event_nameGROUP BY wait_class#, wait_class_id, wait_classORDER BY wait_class#;WAIT_CLASS# WAIT_CLASS_ID WAIT_CLASS count----------- ------------- -------------------- ----------01893977003 Other71714217450380 Application1723290255840 Configuration2434166625743 Administrative5443875070507 Concurrency3253386400367 Commit 262723168908 Idle9472000153315 Network3581740759767 User I/O4594108307767 System I/O30102396326234 Scheduler7113871361733 Cluster5012644977587 Queueing91.5 相关的几个视图V$SESSION:代表数据库活动的开始,视为源起。
oracle遇到的问题及答案

oracle遇到的问题及答案问题⼀:Oracle 11G⽤EXP时,空表不能导出解决⽅法第⼀查询空表到底有多少张,也就是查询为分配分配segment的表有多少张SQL> select table_name from user_tables where NUM_ROWS=0;TABLE_NAME------------------------------DATA_BACKUPEQUIPMENTFEEDBACK_ACCESSORIESSPECIALPICTASK_THIRDTASK_THIRDBATCHTASK_THIRD_DATATASK_THIRD_FEEDBACKTESTDATA_THIRDTHIRD_ACCESSORIES已选择10⾏。
第⼆查询在当前⽤户下有总的有多少张表SQL> select count(*) FROM USER_TABLES;COUNT(*)----------32第三导出当前⽤户下的数据C:\Users\Administrator>exp lcpt/lcpt file=E:\0702bj\lcpt.dmp wner=lcpt log=E 702bj\lcpt.logExport: Release 11.2.0.1.0 - Production on 星期⼀ 7⽉ 2 10:42:07 2012 Copyright (c) 1982, 2009, Oracle and/or its affiliates. All rights reserved. 连接到: Oracle Database 11g Enterprise Edition Release 11.2.0.1.0 - Productio With the Partitioning, OLAP, Data Mining and Real Application Testing options 已导出 ZHS16GBK 字符集和 AL16UTF16 NCHAR 字符集即将导出指定的⽤户.... 正在导出 pre-schema 过程对象和操作. 正在导出⽤户 LCPT 的外部函数库名. 导出 PUBLIC 类型同义词. 正在导出专⽤类型同义词. 正在导出⽤户 LCPT 的对象类型定义即将导出 LCPT 的对象.... 正在导出数据库链接. 正在导出序号. 正在导出簇定义. 即将导出 LCPT 的表通过常规路径.... . 正在导出表 ACCESSORIES导出了 18 ⾏. . 正在导出表 AUTH导出了 240 ⾏. . 正在导出表 DATA_TEMP导出了 1 ⾏. . 正在导出表 FEEDBACK导出了 1 ⾏. . 正在导出表 FUNCTION导出了 112 ⾏. . 正在导出表 LIMIT导出了 1 ⾏. . 正在导出表MODULE导出了 37 ⾏. . 正在导出表 READ_ACCESSORIES导出了 2 ⾏. . 正在导出表 REGIONINFO导出了 19 ⾏. . 正在导出表 REPORT_EVENT导出了 8 ⾏. . 正在导出表 ROLE导出了 5 ⾏. . 正在导出表 ROLEAUTH导出了 606 ⾏. . 正在导出表STAFFLOG导出了 512 ⾏. . 正在导出表 STAFFROLE导出了 56 ⾏. . 正在导出表 STAFFS导出了 7 ⾏. . 正在导出表TASKINFO导出了 51 ⾏. . 正在导出表 TASK_FILIALE导出了 2 ⾏. . 正在导出表 TASK_FILIALE_FEEDBACK导出了 2 ⾏. . 正在导出表 TASK_SWARAJ_READ导出了 49 ⾏. . 正在导出表 TESTDATA导出了 407 ⾏. . 正在导出表 THIRDFACTURER导出了 3 ⾏. . 正在导出表 USESSION导出了 1 ⾏. 正在导出同义词. 正在导出视图. 正在导出存储过程. 正在导出运算符. 正在导出引⽤完整性约束条件. 正在导出触发器. 正在导出索引类型. 正在导出位图, 功能性索引和可扩展索引. 正在导出后期表活动. 正在导出实体化视图. 正在导出快照⽇志. 正在导出作业队列. 正在导出刷新组和⼦组. 正在导出维. 正在导出 post-schema 过程对象和操作. 正在导出统计信息成功终⽌导出, 没有出现警告。
Oracle11g数据库详解

Oracle11g数据库详解常见异常:ORA-14025:不能为实体化视图或实体化视图⽇志指定PARTITIONORA-14026:PARTITION和CLUSTER⼦句互相排斥ORA-14027:仅可以指定⼀个PARTITION⼦句ORA-14028:缺少AT或VALUES关键字ORA-14029:GLOBAL分区索引必须加上前缀ORA-14030:CREATETABLE语句中有不存在的分区列ORA-14031:分区列的类型不可以是LONG或LONGRAWORA-14032:分区编号的分区界限过⾼ORA-14033:ctchvl:未预期的strdef类型ORA-14034:ctchvl:未预期的操作数类型ORA-14035:ctchvl:未预期的字符串数据类型ORA-14036:列的分区界限值过⼤ORA-14037:分区""的分区界限过⾼ORA-14038:GLOBAL分区索引必须加上前缀ORA-14039:分区列必须构成UNIQUE索引的关键字列⼦集ORA-14040:传递给TABLE OR INDEX PART NUM的参数个数不当ORA-14041:可能没有为结果分区指定分区界限ORA-14042:可能没有为要移动,修改或重建的分区指定分区界限ORA-14043:仅可以添加⼀个分区ORA-14044:仅可以移动⼀个分区ORA-14045:仅可以修改⼀个分区ORA-14046:分区可以刚好分成两个新的分区ORA-14047:ALTERTABLE|INDEXRENAME不可以与其它分区组合ORA-14048:分区维护操作不可以与其它操作组合ORA-14049:⽆效的ALTERTABLEMODIFYPARTITION选项ORA-14050:⽆效的ALTERINDEXMODIFYPARTITION选项ORA-14051:ALTERMATERIALIZEDVIEW选项⽆效ORA-14052:此上下⽂中不允许分区扩展表名称语法ORA-14053:⾮法尝试修改(在语句中)ORA-14054:⽆效的ALTERTABLETRUNCATEPARTITION选项ORA-14055:ALTERINDEXREBUILD中的关键字REBUILD必须紧跟索引名称ORA-14056:分区编号:PCTUSED和PCTFREE的总和不可以超过100ORA-14057:分区"":PCTUSED和PCTFREE的总和不可以超过100ORA-14058:分区编号:INITRANS值必须⼩于MAXTRANS值ORA-14061:不可以更改索引分区列的数据类型或长度ORA-14062:⼀个或多个表分区驻留在只读表空间中ORA-14063:唯⼀/主约束条件关键字中存在⽆⽤索引ORA-14064:唯⼀/主约束条件关键字中存在⽆⽤分区的索引ORA-14065:不可以指定分区表的ALLOCATESTORAGEORA-14066:按索引组织的未分区表的选项⾮法ORA-14067:重复的TABLESPACE_NUMBER说明ORA-14068:不可以同时指定TABLESPACE和TABLESPACE_NUMBERORA-14069:⽆效的TABLESPACE_NUMBER值ORA-14070:仅可以指定分区索引或包含REBUILD的选项ORA-14071:⽤于强制约束条件的索引选项⽆效ORA-14072:不可以截断固定表ORA-14073:不可以截断引导程序表或群集ORA-14074:分区界限必须调整为⾼于最后⼀个分区界限ORA-14075:分区维护操作仅可以对分区索引执⾏ORA-14076:DROP/SPLITPARTITION不可以应⽤到LOCAL索引分区ORA-14078:您不可以删除GLOBAL索引的最⾼分区ORA-14079:标记为⽆⽤索引的分区选项⾮法ORA-14080:⽆法按指定的上限来分割分区ORA-14081:新分区名必须与旧分区名不同ORA-14082:新分区名必须与对象的任何其它分区名不同ORA-14083:⽆法删除分区表的唯⼀分区ORA-14084:您仅可以指定LOCAL索引的TABLESPACEDEFAULTORA-14085:分区表不能具有LONG数据类型的列ORA-14086:不可以将区索引作为整体重建⼀般权限⽤户的登录验证都是第三种⽅式,即数据库验证,因为⽤户名和密码都是存储在数据库当中的。
[ORACLE]oraclesql执行过程发生的等待事件
![[ORACLE]oraclesql执行过程发生的等待事件](https://img.taocdn.com/s3/m/e2cd8627a22d7375a417866fb84ae45c3b35c2ac.png)
[ORACLE]oraclesql执⾏过程发⽣的等待事件1.Parse 阶段常见的等待事件:Library cache pin这个等待事件和library cache lock ⼀样是发⽣在共享池中并发操作引起的事件。
通常来讲,如果Oracle 要对⼀些PL/SQL 或者视图这样的对象做重新编译,需要将这些对象pin到共享池中。
如果此时这个对象被其他的⽤户特有,就会产⽣⼀个library cache pin的等待。
这个等待事件也包含四个参数:Handle address: 被加载的对象的地址。
Lock address:锁的地址。
Mode:被加载对象的数据⽚段。
Namespace:被加载对象在v$db_object_cache 视图中namespace名称。
Library cache pin这个等待事件和library cache lock ⼀样是发⽣在共享池中并发操作引起的事件。
通常来讲,如果Oracle 要对⼀些PL/SQL 或者视图这样的对象做重新编译,需要将这些对象pin到共享池中。
如果此时这个对象被其他的⽤户特有,就会产⽣⼀个library cache pin的等待。
这个等待事件也包含四个参数:Handle address: 被加载的对象的地址。
Lock address:锁的地址。
Mode:被加载对象的数据⽚段。
Namespace:被加载对象在v$db_object_cache 视图中namespace名称latch:shared poolpin S wait on Xibrary cache: mutex X/cursor: pin S2.Execute阶段常见的等待事件:db file sequential read这个等待事件在实际⽣产库也很常见,当Oracle 需要每次I/O只读取单个数据块这样的操作时,会产⽣这个等待事件。
最常见的情况有索引的访问(除IFFS外的⽅式),回滚操作,以ROWID的⽅式访问表中的数据,重建控制⽂件,对⽂件头做DUMP等。
Oracle数据库教程 —— oracle常见的等待事件说明

Oracle数据库教程—— oracle常见的等待事件说明1. Buffer busy waits从本质上讲,这个等待事件的产生仅说明了一个会话在等待一个Buffer(数据块),但是导致这个现象的原因却有很多种。
常见的两种是:--当一个会话视图修改一个数据块,但这个数据块正在被另一个会话修改时。
--当一个会话需要读取一个数据块,但这个数据块正在被另一个会话读取到内存中时。
在新的版本中,第二种情况已经被独立出来,以read by other session取代~Buffer busy waits等待事件常见于数据库中存在的热快的时候,当多个用户频繁地读取或者修改同样的数据块时,这个等待事件就会产生。
如果等待的时间很长,我们在AWR或者statspack 报告中就可以看到。
这个等待事件有三个参数。
查看有几个参数我们可以用以下SQL:SQL> select name, parameter1, parameter2, parameter3 from v$event_name where name='buffer busy waits';NAME PARAMETER1 PARAMETER2 PARAMETER3-------------------- ---------- ---------- ----------buffer busy waits file# block# class#2.Buffer latch内存中数据块的存放位置是记录在一个hash列表(cache buffer chains)当中的。
当一个会话需要访问某个数据块时,它首先要搜索这个hash 列表,从列表中获得数据块的地址,然后通过这个地址去访问需要的数据块,这个列表Oracle会使用一个latch来保护它的完整性。
当一个会话需要访问这个列表时,需要获取一个Latch,只有这样,才能保证这个列表在这个会话的浏览当中不会发生变化。
Oracle数据库发生等待事件:enq:TX-rowlockcontention,排查思路
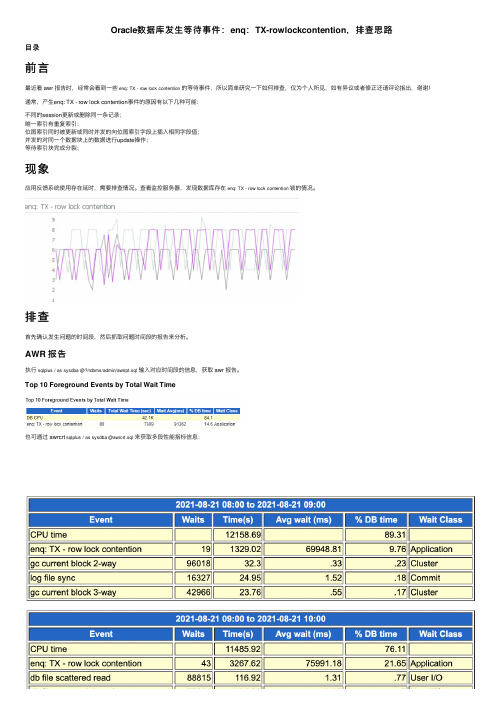
Oracle数据库发⽣等待事件:enq:TX-rowlockcontention,排查思路⽬录前⾔最近看 awr 报告时,经常会看到⼀些enq: TX - row lock contention的等待事件,所以简单研究⼀下如何排查,仅为个⼈所见,如有异议或者修正还请评论指出,谢谢!通常,产⽣enq: TX - row lock contention事件的原因有以下⼏种可能:不同的session更新或删除同⼀条记录;唯⼀索引有重复索引;位图索引同时被更新或同时并发的向位图索引字段上插⼊相同字段值;并发的对同⼀个数据块上的数据进⾏update操作;等待索引块完成分裂;现象应⽤反馈系统使⽤存在延时,需要排查情况。
查看监控服务器,发现数据库存在enq: TX - row lock contention锁的情况。
排查⾸先确认发⽣问题的时间段,然后抓取问题时间段的报告来分析。
AWR 报告执⾏sqlplus / as sysdba @?/rdbms/admin/awrrpt.sql输⼊对应时间段的信息,获取 awr 报告。
Top 10 Foreground Events by Total Wait Time也可通过 awrcrt sqlplus / as sysdba @awrcrt.sql来获取多段性能指标信息:通过观察 awr 报告中段的统计信息章节Segments by Row Lock Waits项,可以发现发⽣锁的对象主要是两张表A和B和A表的索引:与应⽤确认后,发现其中⼀张表A为核⼼业务表,暂时怀疑另⼀张表可能存在问题,这⾥称之为表B,所以A表暂且不考虑。
SQL ordered by Elapsed Time通过 搜索关键字,查出 B 表对应的UPDATE语句,执⾏较为频繁,先记录待查看:sql_id 为:2xb71ufa5wmrh。
ASH 报告抓取对应时间段的 ash 报告,查看是否存在有⽤信息。
D3-03_RAC_等待事件

16/85
Oracle系统等待事件-跟踪
10046事件 : 10046 是Oracle系统性能分析一个重要的事件 当激活这个事件后,将通知Oracle kernel追踪会话 的相关即时信息,并写入到相应trace文件中 。 信息包括SQL语句解析,绑定变量的使用,会话中 发生的等待事件等 。 10046 Event 可分成不同的级别: level 1:跟踪sql语句,包括解析、执行、提取 等。 level 4:包括变量的详细信息 ; level 8:包括等待事件 ; level 12:包括绑定变量与等待事件 。
Waits
Lock Redo SQL Net
TX Row Lock
TX ITL Lock HW Lock
Log File Log Buffer
Log File Sync
22/85
等待事件接口
Oracle等待事件接口-视图
:
V$Sxxx
V$SESSION
& GV$xxx
V$SESSION_WAIT
Oracle RDBMS
RAC与等待事件
赵元杰 zyj5681@ 2012.11
2/85
内容提要
生活中的等待 Oracle 系统等待事件 Oracle 事件构成与接口 Oracle RAC常见等待事件 Interconnect 调整 参考资料
3/85
Waiting, Waiting, Waiting
搜集等待统计 : TIMED_STATISTICS参数被设置为TRUE时,等待 (wait)才会被计时。 设置统计为TRUE对系统影响不大,可设置一段时 间再取消。 如果TIMED_STATISTICS=FALSE,Oracle也会记录 每个等待的开始与结束原因及是否发生超时 。 如果TIMED_STATISTICS=TRUE,Oracle会检查每 个等待前后的时刻并记录等待所花的时间以百分之 一秒。
Oracle数据库缓冲区忙等待的原因解析
众多Oracle有关问题中,其中最重要的一个是缓冲区忙等待(buffer busy wait)事件。
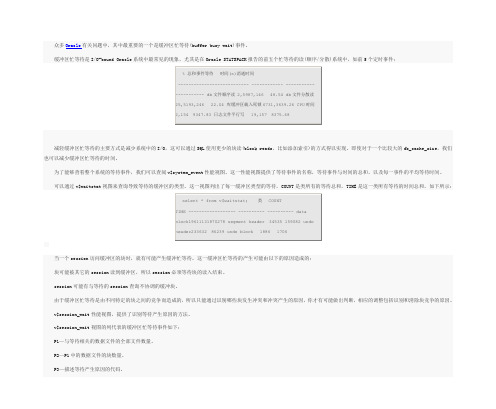
缓冲区忙等待是I/O-bound Oracle系统中最常见的现象,尤其是在Oracle STATSPACK报告的前五个忙等待的读(顺序/分散)系统中,如前5个定时事件:% 总和事件等待时间(s)消逝时间--------------------------- ------------ ----------------------db文件顺序读 2,5987,146 48.54db文件分散读25,5193,246 22.04库缓冲区载入死锁6731,3639.26CPU时间2,1549347.83日志文件平行写 19,1578375.68减轻缓冲区忙等待的主要方式是减少系统中的I/O,这可以通过SQL使用更少的块读(block reads,比如添加索引)的方式得以实现。
即使对于一个比较大的db_cache_size,我们也可以减少缓冲区忙等待的时间。
为了能够查看整个系统的等待事件,我们可以查阅v$system_event性能视图。
这一性能视图提供了等待事件的名称,等待事件与时间的总和,以及每一事件的平均等待时间。
可以通过v$waitstat视图来查询导致等待的缓冲区的类型。
这一视图列出了每一缓冲区类型的等待,COUNT是类所有的等待总和,TIME是这一类所有等待的时间总和,如下所示:select * from v$waitstat;类 COUNTTIME------------------ ---------- ----------datablock19611131870278segment header34535 159082undoheader23363286239undo block 1886 1706当一个session访问缓冲区的块时,就有可能产生缓冲忙等待。
这一缓冲区忙等待的产生可能由以下的原因造成的:块可能被其它的session读到缓冲区,所以session必须等待块的读入结束。
- 1、下载文档前请自行甄别文档内容的完整性,平台不提供额外的编辑、内容补充、找答案等附加服务。
- 2、"仅部分预览"的文档,不可在线预览部分如存在完整性等问题,可反馈申请退款(可完整预览的文档不适用该条件!)。
- 3、如文档侵犯您的权益,请联系客服反馈,我们会尽快为您处理(人工客服工作时间:9:00-18:30)。
10.3 Wait Events StatisticsThe V$SESSION, V$SESSION_WAIT, V$SESSION_HISTORY, V$SESSION_EVENT, and V$SYSTEM_EVENT views provide information on what resources were waited for, and, if the configuration parameter TIMED_STATISTICS is set to true, how long each resource was waited for.See Also:∙"Setting the Level of Statistics Collection" for information about STATISTICS_LEVEL settings∙Oracle Database Reference for a description of the V$ views and the Oracle wait eventsInvestigate wait events and related timing data when performing reactive performance tuning. The events with the most time listed against them are often strong indications of the performance bottleneck.The following views contain related, but different, views of the same data:∙V$SESSION lists session information for each current session. It lists either the event currently being waited for, or the event last waited for on each session. This view also contains information about blocking sessions, the wait state, and the wait time.∙V$SESSION_WAIT is a current state view. It lists either the event currently being waited for, or the event last waited for on each session, the wait state, and the wait time.∙V$SESSION_WAIT_HISTORY lists the last 10 wait events for each current session and the associated wait time.∙V$SESSION_EVENT lists the cumulative history of events waited for on each session. After a session exits, the wait event statistics for that session are removed from this view.∙V$SYSTEM_EVENT lists the events and times waited for by the whole instance (that is, all session wait events data rolled up) since instance startup.Because V$SESSION_WAIT is a current state view, it also contains a finer-granularity of information than V$SESSION_EVENT orV$SYSTEM_EVENT. It includes additional identifying data for the current event in three parameter columns: P1, P2, and P3.For example, V$SESSION_EVENT can show that session 124 (SID=124) had many waits on the db file scattered read, but it does not show which file and block number. However, V$SESSION_WAIT shows the file number in P1, the block number read in P2, and the number of blocks read in P3 (P1 and P2 let you determine for which segments the wait event is occurring).This section concentrates on examples using V$SESSION_WAIT. However, Oracle recommends capturing performance data over an interval and keeping this data for performance and capacity analysis. This form of rollup data is queried from the V$SYSTEM_EVENT view by AWR. See "Overview of the Automatic Workload Repository".Most commonly encountered events are described in this chapter, listed in case-sensitive alphabetical order. Other event-related data to examine is also included. The case used for each event name is that which appears in the V$SYSTEM_EVENT view.Oracle Database 11g accumulates wait counts and time outs for wait events (such as in the V$SYSTEM_EVENT view) differently than in past releases. Continuous waits for certain types of resources (such as enqueues) are internally divided into a set of shorter wait calls. In prior releases, each individual internal wait call was counted as a separate wait. Starting with release 11.1, a single resource wait is recorded as a single wait, irrespective of the number of internal time outs experienced by the session during the wait.This change allows Oracle Database to display a more representative wait count, and an accurate total time spent waiting for the resource. Time outs now refer to the resource wait, instead of the individual internal wait calls. This change also affects the average wait time and the maximum wait time. For example, if a user session must wait for an enqueue in order for a transaction row lock to update a single row in a table, and it takes 10 seconds to acquire the enqueue, Oracle Database breaks down the enqueue wait into 3-second wait calls. In this example, there will be three 3-second wait calls, followed by a 1-second wait call. From the session's perspective, however, there is only one wait on an enqueue.In prior releases, the V$SYSTEM_EVENT view would represent this wait scenario as follows:∙TOTAL_WAITS: 4 waits (three 3-second waits, one 1-second wait)∙TOTAL_TIMEOUTS: 3 time outs (the first three waits time out and the enqueue is acquired during the final wait) ∙TIME_WAITED: 10 seconds (sum of the times from the 4 waits)∙AVERAGE_WAIT: 2.5 seconds∙MAX_WAIT: 3 secondsIn Oracle Database 11g, this wait scenario is represented as:∙TOTAL_WAITS: 1 wait (one 10-second wait)∙TOTAL_TIMEOUTS: 0 time outs (the enqueue is acquired during the resource wait)∙TIME_WAITED: 10 seconds (time for the resource wait)∙AVERAGE_WAIT: 10 seconds∙MAX_WAIT: 10 secondsThe following common wait events are affected by this change:∙Enqueue waits (such as enq: name - reason waits)∙Library cache lock waits∙Library cache pin waits∙Row cache lock waitsThe following statistics are affected by this change:∙Wait counts∙Wait time outs∙Average wait time∙Maximum wait timeThe following views are affected by this change:∙V$EVENT_HISTOGRAM∙V$EVENTMETRIC∙V$SERVICE_EVENT∙V$SERVICE_WAIT_CLASS∙V$SESSION_EVENT∙V$SESSION_WAIT∙V$SESSION_WAIT_CLASS∙V$SESSION_WAIT_HISTORY∙V$SYSTEM_EVENT∙V$SYSTEM_WAIT_CLASS∙V$WAITCLASSMETRIC∙V$WAITCLASSMETRIC_HISTORYSee Also:Oracle Database Reference for a description of the V$SYSTEM_EVENT view10.3.1 buffer busy waitsThis wait indicates that there are some buffers in the buffer cache that multiple processes are attempting to access concurrently. Query V$WAITSTAT for the wait statistics for each class of buffer. Common buffer classes that have buffer busy waits include data block, segment header, undo header, and undo block.Check the following V$SESSION_WAIT parameter columns:∙P1: File ID∙P2: Block IDP3: Class ID10.3.1.1 CausesTo determine the possible causes, first query V$SESSION to identify the value of ROW_WAIT_OBJ# when the session waits for buffer busy waits. For example:SELECT row_wait_obj#FROM V$SESSIONWHERE EVENT = 'buffer busy waits';To identify the object and object type contended for, query DBA_OBJECTS using the value for ROW_WAIT_OBJ# that is returned fromV$SESSION. For example:SELECT owner, object_name, subobject_name, object_typeFROM DBA_OBJECTSWHERE data_object_id = &row_wait_obj;10.3.1.2 ActionsThe action required depends on the class of block contended for and the actual segment.10.3.1.2.1 segment headerIf the contention is on the segment header, then this is most likely free list contention.Automatic segment-space management in locally managed tablespaces eliminates the need to specify the PCTUSED, FREELISTS, and FREELIST GROUPS parameters. If possible, switch from manual space management to automatic segment-space management (ASSM).The following information is relevant if you are unable to use ASSM (for example, because the tablespace uses dictionary space management).A free list is a list of free data blocks that usually includes blocks existing in several different extents within the segment. Free lists are composed of blocks in which free space has not yet reached PCTFREE or used space has shrunk below PCTUSED. Specify the number of process free lists with the FREELISTS parameter. The default value of FREELISTS is one. The maximum value depends on the data block size.To find the current setting for free lists for that segment, run the following:SELECT SEGMENT_NAME, FREELISTSFROM DBA_SEGMENTSWHERE SEGMENT_NAME = segment nameAND SEGMENT_TYPE = segment type;Set free lists, or increase the number of free lists. If adding more free lists does not alleviate the problem, then use free list groups (even in single instance this can make a difference). If using Oracle RAC, then ensure that each instance has its own free list group(s).See Also:Oracle Database Concepts for information about automatic segment-space management, free lists, PCTFREE, and PCTUSED10.3.1.2.2 data blockIf the contention is on tables or indexes (not the segment header):∙Check for right-hand indexes. These are indexes that are inserted into at the same point by many processes. For example, those that use sequence number generators for the key values.∙Consider using ASSM, global hash partitioned indexes, or increasing free lists to avoid multiple processes attempting to insert into the same block.10.3.1.2.3 undo headerFor contention on rollback segment header:∙If you are not using automatic undo management, then add more rollback segments.10.3.1.2.4 undo blockFor contention on rollback segment block:∙If you are not using automatic undo management, then consider making rollback segment sizes larger.10.3.2 db file scattered readThis event signifies that the user process is reading buffers into the SGA buffer cache and is waiting for a physical I/O call to return. A db file scattered read issues a scattered read to read the data into multiple discontinuous memory locations. A scattered read is usually a multiblock read. It can occur for a fast full scan (of an index) in addition to a full table scan.The db file scattered read wait event identifies that a full scan is occurring. When performing a full scan into the buffer cache, the blocks read are read into memory locations that are not physically adjacent to each other. Such reads are called scattered read calls, because the blocks are scattered throughout memory. This is why the corresponding wait event is called 'db file scattered read'. multiblock (up toDB_FILE_MULTIBLOCK_READ_COUNT blocks) reads due to full scans into the buffer cache show up as waits for 'db file scattered read'.Check the following V$SESSION_WAIT parameter columns:∙P1: The absolute file number∙P2: The block being read∙P3: The number of blocks (should be greater than 1)10.3.2.1 ActionsOn a healthy system, physical read waits should be the biggest waits after the idle waits. However, also consider whether there are direct read waits (signifying full table scans with parallel query) or db file scattered read waits on an operational (OLTP) system that should be doing small indexed accesses.Other things that could indicate excessive I/O load on the system include the following:∙Poor buffer cache hit ratio∙These wait events accruing most of the wait time for a user experiencing poor response time10.3.2.2 Managing Excessive I/OThere are several ways to handle excessive I/O waits. In the order of effectiveness, these are as follows:∙Reduce the I/O activity by SQL tuning.∙Reduce the need to do I/O by managing the workload.∙Gather system statistics with DBMS_STATS package, allowing the query optimizer to accurately cost possible access paths that use full scans.∙Use Automatic Storage Management.∙Add more disks to reduce the number of I/Os for each disk.∙Alleviate I/O hot spots by redistributing I/O across existing disks.See Also:Chapter 8, "I/O Configuration and Design"The first course of action should be to find opportunities to reduce I/O. Examine the SQL statements being run by sessions waiting for these events and statements causing high physical I/Os from V$SQLAREA. Factors that can adversely affect the execution plans causing excessive I/O include the following:∙Improperly optimized SQL∙Missing indexes∙High degree of parallelism for the table (skewing the optimizer toward scans)∙Lack of accurate statistics for the optimizer∙Setting the value for DB_FILE_MULTIBLOCK_READ_COUNT initialization parameter too high which favors full scans10.3.2.3 Inadequate I/O DistributionBesides reducing I/O, also examine the I/O distribution of files across the disks. Is I/O distributed uniformly across the disks, or are there hot spots on some disks? Are the number of disks sufficient to meet the I/O needs of the database?See the total I/O operations (reads and writes) by the database, and compare those with the number of disks used. Remember to include the I/O activity of LGWR and ARCH processes.10.3.2.4 Finding the SQL Statement executed by Sessions Waiting for I/OUse the following query to determine, at a point in time, which sessions are waiting for I/O:SELECT SQL_ADDRESS, SQL_HASH_VALUEFROM V$SESSIONWHERE EVENT LIKE 'db file%read';10.3.2.5 Finding the Object Requiring I/OTo determine the possible causes, first query V$SESSION to identify the value of ROW_WAIT_OBJ# when the session waits for db file scattered read. For example:SELECT row_wait_obj#FROM V$SESSIONWHERE EVENT = 'db file scattered read';To identify the object and object type contended for, query DBA_OBJECTS using the value for ROW_WAIT_OBJ# that is returned fromV$SESSION. For example:SELECT owner, object_name, subobject_name, object_typeFROM DBA_OBJECTSWHERE data_object_id = &row_wait_obj;10.3.3 db file sequential readThis event signifies that the user process is reading a buffer into the SGA buffer cache and is waiting for a physical I/O call to return. A sequential read is a single-block read.Single block I/Os are usually the result of using indexes. Rarely, full table scan calls could get truncated to a single block call because of extent boundaries, or buffers present in the buffer cache. These waits would also show up as db file sequential read.Check the following V$SESSION_WAIT parameter columns:∙P1: The absolute file number∙P2: The block being read∙P3: The number of blocks (should be 1)See Also:"db file scattered read" for information about managing excessive I/O, inadequate I/O distribution, and finding the SQL causing the I/O and the segment the I/O is performed on10.3.3.1 ActionsOn a healthy system, physical read waits should be the biggest waits after the idle waits. However, also consider whether there are db file sequential reads on a large data warehouse that should be seeing mostly full table scans with parallel query.Figure 10-1 depicts the differences between the following wait events:∙db file sequential read (single block read into one SGA buffer)∙db file scattered read (multiblock read into many discontinuous SGA buffers)∙direct read (single or multiblock read into the PGA, bypassing the SGA)Figure 10-1 Scattered Read, Sequential Read, and Direct Path ReadDescription of "Figure 10-1 Scattered Read, Sequential Read, and Direct Path Read"10.3.4 direct path read and direct path read tempWhen a session is reading buffers from disk directly into the PGA (opposed to the buffer cache in SGA), it waits on this event. If the I/O subsystem does not support asynchronous I/Os, then each wait corresponds to a physical read request.If the I/O subsystem supports asynchronous I/O, then the process is able to overlap issuing read requests with processing the blocks existing in the PGA. When the process attempts to access a block in the PGA that has not yet been read from disk, it then issues a wait call and updates the statistics for this event. Hence, the number of waits is not necessarily the same as the number of read requests (unlike db file scattered read and db file sequential read).Check the following V$SESSION_WAIT parameter columns:∙P1: File_id for the read call∙P2: Start block_id for the read call∙P3: Number of blocks in the read call10.3.4.1 CausesThis situation occurs in the following situations:∙The sorts are too large to fit in memory and some of the sort data is written out directly to disk. This data is later read back in, using direct reads.∙Parallel slaves are used for scanning data.∙The server process is processing buffers faster than the I/O system can return the buffers. This can indicate an overloaded I/O system.10.3.4.2 ActionsThe file_id shows if the reads are for an object in TEMP tablespace (sorts to disk) or full table scans by parallel slaves. This wait is the largest wait for large data warehouse sites. However, if the workload is not a Decision Support Systems (DSS) workload, then examine why this situation is happening. 10.3.4.2.1 Sorts to DiskExamine the SQL statement currently being run by the session experiencing waits to see what is causing the sorts. Query V$TEMPSEG_USAGE to find the SQL statement that is generating the sort. Also query the statistics from V$SESSTAT for the session to determine the size of the sort. See if it is possible to reduce the sorting by tuning the SQL statement. If WORKAREA_SIZE_POLICY is MANUAL, then consider increasing theSORT_AREA_SIZE for the system (if the sorts are not too big) or for individual processes. If WORKAREA_SIZE_POLICY is AUTO, then investigate whether to increase PGA_AGGREGATE_TARGET. See "PGA Memory Management".10.3.4.2.2 Full Table ScansIf tables are defined with a high degree of parallelism, then this setting could skew the optimizer to use full table scans with parallel slaves. Check the object being read into using the direct path reads. If the full table scans are a valid part of the workload, then ensure that the I/O subsystem is adequate for the degree of parallelism. Consider using disk striping if you are not already using it or Oracle Automatic Storage Management (Oracle ASM).10.3.4.2.3 Hash Area SizeFor query plans that call for a hash join, excessive I/O could result from having HASH_AREA_SIZE too small. If WORKAREA_SIZE_POLICY is MANUAL, then consider increasing the HASH_AREA_SIZE for the system or for individual processes. If WORKAREA_SIZE_POLICY is AUTO, then investigate whether to increase PGA_AGGREGATE_TARGET.See Also:∙"Managing Excessive I/O"∙"PGA Memory Management"10.3.5 direct path write and direct path write tempWhen a process is writing buffers directly from PGA (as opposed to the DBWR writing them from the buffer cache), the process waits on this event for the write call to complete. Operations that could perform direct path writes include sorts on disk, parallel DML operations, direct-path INSERT s, parallel create table as select, and some LOB operations.Like direct path reads, the number of waits is not the same as number of write calls issued if the I/O subsystem supports asynchronous writes. The session waits if it has processed all buffers in the PGA and cannot continue work until an I/O request completes.See Also:Oracle Database Administrator's Guide for information about direct-path insertsCheck the following V$SESSION_WAIT parameter columns:∙P1: File_id for the write call∙P2: Start block_id for the write call∙P3: Number of blocks in the write call10.3.5.1 CausesThis happens in the following situations:∙Sorts are too large to fit in memory and are written to disk∙Parallel DML are issued to create/populate objects∙Direct path loads10.3.5.2 ActionsFor large sorts see "Sorts to Disk".For parallel DML, check the I/O distribution across disks and ensure that the I/O subsystem is adequately configured for the degree of parallelism.10.3.6 enqueue (enq:) waitsEnqueues are locks that coordinate access to database resources. This event indicates that the session is waiting for a lock that is held by another session. The name of the enqueue is included as part of the wait event name, in the form enq:enqueue_type-related_details. In some cases, the same enqueue type can be held for different purposes, such as the following related TX types:∙enq:TX-allocate ITL entry∙enq:TX-contention∙enq:TX-index contention∙enq:TX-row lock contentionThe V$EVENT_NAME view provides a complete list of all the enq: wait events.You can check the following V$SESSION_WAIT parameter columns for additional information:∙P1: Lock TYPE (or name) and MODE∙P2: Resource identifier ID1 for the lock∙P3: Resource identifier ID2 for the lockSee Also:Oracle Database Reference for information about Oracle Database enqueues10.3.6.1 Finding Locks and Lock HoldersQuery V$LOCK to find the sessions holding the lock. For every session waiting for the event enqueue, there is a row in V$LOCK with REQUEST <> 0. Use one of the following two queries to find the sessions holding the locks and waiting for the locks.If there are enqueue waits, you can see these using the following statement:SELECT * FROM V$LOCK WHERE request > 0;To show only holders and waiters for locks being waited on, use the following:SELECT DECODE(request,0,'Holder: ','Waiter: ') ||sid sess, id1, id2, lmode, request, typeFROM V$LOCKWHERE (id1, id2, type) IN (SELECT id1, id2, type FROM V$LOCK WHERE request > 0)ORDER BY id1, request;10.3.6.2 ActionsThe appropriate action depends on the type of enqueue.10.3.6.2.1 ST enqueueIf the contended-for enqueue is the ST enqueue, then the problem is most likely to be dynamic space allocation. Oracle Database dynamically allocates an extent to a segment when there is no more free space available in the segment. This enqueue is only used for dictionary managed tablespaces.To solve contention on this resource:∙Check to see whether the temporary (that is, sort) tablespace uses TEMPFILES. If not, then switch to using TEMPFILES.∙Switch to using locally managed tablespaces if the tablespace that contains segments that are growing dynamically is dictionary managed.See Also:Oracle Database Concepts for detailed information on TEMPFILE s and locally managed tablespaces∙If it is not possible to switch to locally managed tablespaces, then ST enqueue resource usage can be decreased by changing the next extent sizes of the growing objects to be large enough to avoid constant space allocation. To determine which segments are growing constantly, monitor the EXTENTS column of the DBA_SEGMENTS view for all SEGMENT_NAMEs. See Oracle Database Administrator's Guide for information about displaying information about space usage.∙Preallocate space in the segment, for example, by allocating extents using the ALTER TABLE ALLOCATE EXTENT SQL statement.10.3.6.2.2 HW enqueueThe HW enqueue is used to serialize the allocation of space beyond the high water mark of a segment.∙V$SESSION_WAIT.P2 / V$LOCK.ID1 is the tablespace number.∙V$SESSION_WAIT.P3 / V$LOCK.ID2 is the relative data block address (dba) of segment header of the object for which space is being allocated.If this is a point of contention for an object, then manual allocation of extents solves the problem.10.3.6.2.3 TM enqueueThe most common reason for waits on TM locks tend to involve foreign key constraints where the constrained columns are not indexed. Index the foreign key columns to avoid this problem.10.3.6.2.4 TX enqueueThese are acquired exclusive when a transaction initiates its first change and held until the transaction does a COMMIT or ROLLBACK.∙Waits for TX in mode 6: occurs when a session is waiting for a row level lock that is held by another session. This occurs when one user is updating or deleting a row, which another session wants to update or delete. This type of TX enqueue wait corresponds to the wait event enq:TX-row lock contention.The solution is to have the first session holding the lock perform a COMMIT or ROLLBACK.∙Waits for TX in mode 4 can occur if the session is waiting for an ITL (interested transaction list) slot in a block. This happens when the session wants to lock a row in the block but one or more other sessions have rows locked in the same block, and there is no free ITL slot in the block. Usually, Oracle Database dynamically adds another ITL slot. This may not be possible if there is insufficient free space in the block to add an ITL. If so, the session waits for a slot with a TX enqueue in mode 4. This type of TX enqueue wait corresponds to the wait event enq:TX-allocate ITL entry.The solution is to increase the number of ITLs available, either by changing the INITRANS or MAXTRANS for the table (either by using an ALTER statement, or by re-creating the table with the higher values).∙Waits for TX in mode 4 can also occur if a session is waiting due to potential duplicates in UNIQUE index. If two sessions try to insert the same key value the second session has to wait to see if an ORA-0001 should be raised or not. This type of TX enqueue wait corresponds to the wait event enq:TX-row lock contention.The solution is to have the first session holding the lock perform a COMMIT or ROLLBACK.∙Waits for TX in mode 4 is also possible if the session is waiting due to shared bitmap index fragment. Bitmap indexes index key values and a range of rowids. Each entry in a bitmap index can cover many rows in the actual table. If two sessions want to update rows covered by the same bitmap index fragment, then the second session waits for the first transaction to either COMMIT or ROLLBACK by waiting for the TX lock in mode 4.This type of TX enqueue wait corresponds to the wait event enq:TX-row lock contention.∙Waits for TX in Mode 4 can also occur waiting for a PREPARED transaction.∙Waits for TX in mode 4 also occur when a transaction inserting a row in an index has to wait for the end of an index block split being done by another transaction. This type of TX enqueue wait corresponds to the wait event enq:TX-index contention.See Also:Oracle Database Advanced Application Developer's Guide for more information about referential integrity and locking data explicitly10.3.7 events in wait class otherThis event belong to Other wait class and typically should not occur on a system. This event is an aggregate of all other events in the Other wait class, such as latch free, and is used in the V$SESSION_EVENT and V$SERVICE_EVENT views only. In these views, the events in the Other wait class will not be maintained individually in every session. Instead, these events will be rolled up into this single event to reduce the memory used for maintaining statistics on events in the Other wait class.10.3.8 free buffer waitsThis wait event indicates that a server process was unable to find a free buffer and has posted the database writer to make free buffers by writing out dirty buffers. A dirty buffer is a buffer whose contents have been modified. Dirty buffers are freed for reuse when DBWR has written the blocks to disk.10.3.8.1 CausesDBWR may not be keeping up with writing dirty buffers in the following situations:∙The I/O system is slow.∙There are resources it is waiting for, such as latches.∙The buffer cache is so small that DBWR spends most of its time cleaning out buffers for server processes.∙The buffer cache is so big that one DBWR process is not enough to free enough buffers in the cache to satisfy requests.10.3.8.2 ActionsIf this event occurs frequently, then examine the session waits for DBWR to see whether there is anything delaying DBWR.10.3.8.2.1 WritesIf it is waiting for writes, then determine what is delaying the writes and fix it. Check the following:∙Examine V$FILESTAT to see where most of the writes are happening.∙Examine the host operating system statistics for the I/O system. Are the write times acceptable?If I/O is slow:∙Consider using faster I/O alternatives to speed up write times.∙Spread the I/O activity across large number of spindles (disks) and controllers. See Chapter 8, "I/O Configuration and Design" for information about balancing I/O.10.3.8.2.2 Cache is Too SmallIt is possible DBWR is very active because the cache is too small. Investigate whether this is a probable cause by looking to see if the buffer cache hit ratio is low. Also use the V$DB_CACHE_ADVICE view to determine whether a larger cache size would be advantageous. See "Sizing the Buffer Cache". 10.3.8.2.3 Cache Is Too Big for One DBWRIf the cache size is adequate and the I/O is evenly spread, then you can potentially modify the behavior of DBWR by using asynchronous I/O or by using multiple database writers.。
