环境化学_多介质环境模型分解共25页文档
环境化学课件-2024鲜版

2024/3/28
1
目
录
2024/3/28
• 环境化学概述 • 大气环境化学 • 水环境化学 • 土壤环境化学 • 生物体内污染物质运移规律 • 环境污染治理技术与方法 • 环境化学未来发展趋势与挑战
2 contents
01 环境化学概述
2024/3/28
3
环境化学定义与发展
2024/3/28
定义
环境化学是研究化学物质在环境中 的存在、转化、行为和效应的科学。
发展
自20世纪60年代以来,随着工业 化和城市化的快速发展,环境问题 日益严重,环境化学逐渐发展成为 一门独立的学科。
4
研究对象与内容
研究对象
环境化学的研究对象包括大气、水、 土壤、生物等环境中的化学物质。
研究内容
环境化学主要研究化学物质在环境中的 来源、迁移、转化、归宿和生态效应等 方面的问题。
污染物质进入血液后,随血液循环分布到全身各组织器官。
淋巴循环
部分污染物质可进入淋巴液,通过淋巴循环转运至淋巴结等组织。
2024/3/28
细胞内转运
污染物质在细胞内可通过各种转运蛋白进行跨膜转运,影响细胞 正常生理功能。
21
生物体内污染物质排出机制
01
02
03
04
呼吸系统排出
部分挥发性污染物质可通过呼 吸系统以呼出气体的形式排出
化学处理技术
通过中和、氧化、还原等化学反应去除水中的溶 解性污染物。
生物处理技术
利用微生物的代谢作用降解水中的有机污染物, 包括活性污泥法、生物膜法等。
2024/3/28
25
土壤污染治理技术
2024/3/28
环境化学PPT课件
南宁市区 28.8 8.48 15.7 45.8 19.9 0.9 11.8 9.6 1985-1986
日本神户
19.5
31 18 31 6.5 3.5 15 3 52 4.30
50 12 22 5 16 6 2 114 3.94
31 28 21 3.5 3.5 24 2 39 4.41
19 10 21 11.5 5 24 39 19 7.5 3
- - 11 4.96 - - 40 4.4
注:本2表021摘/8/6自唐孝炎,1990。
环境化学
第一章 绪论
第一节 环境化学
一、环境问题
二、环境化学
第二节 环境污染物
一、环境污染物的类别
二、环境效应及其影响因素
三、环境污染物在环境各圈的迁移转化过程简
介
2021/8/6
1
2021/8/6
2
表1-1环境化学分支学科划分
研究领域 环境分析化学
分支学科 环境有机分析化学 环境无机分析化学
大气环境化学
季节 气温 湿度 日光 臭氧浓度 出现时间 毒性
发 生 较 早 (1873) , 至 今 已 多 次 出 现 颗粒物、SO2、硫酸雾等 煤
冬季 低(4℃以下) 高 弱 低 白天夜间连续 对呼吸道有刺激作用,严重时导 致死亡
发生较晚(1946),发生光化学反应 碳氢化合物、NOx、O3、PAN、醛 类等 汽油、煤气、石油
各圈层的环境化学
水环境化学
土壤环境化学
环境生态化学①
大气污染控制化学
环境工程化学
水污染控制化学
固体废物污染控制化学
注: ①“环境生态学也可列为平行的另一个分支学科
2021/8/6
环境化学
环境化学第一章绪论第二章大气环境化学第三章水环境化学第四章土壤环境化学第五章生物体内污染物质的运动过程及毒性第六章典型污染物在环境各圈层中的转归与效应第七章受污染环境的修复第八章绿色化学的基本原理与应用第一章绪论第一节环境化学一、环境问题二、环境化学1.环境化学的任务P42.元素的生物地球化学循环P73.环境化学的发展动向P10(1)环境分析化学(2)各圈层环境化学(3)污染控制化学第二节环境污染物一、环境污染物的类别1.人类社会活动不同功能产生的污染物P 12(1)工业(2)农业(3)交通运输(4)生活2.化学污染物P12(1)元素(2)无机物(3)有机化合物和烃类(4)金属有机物和准金属有机化合物(5)含氧有机化合物(6)有机氮化合物(7)有机卤化物(8)有机硫化合物(9)有机磷化合物二、环境效应及其影响因素P1.环境物理效应2.环境化学效应3.环境生物效应三、环境污染物在环境各圈层的迁移转化过程简介14P第二章大气环境化学第一节大气的组成及其主要污染物一、大气的主要成分P17二、大气层的结构P171.对流层2.平流层3.中间层4.热层三、大气中的主要污染物1.含硫化合物P21(1)SO①SO2的危害②SO2的来源与消除③SO2的浓度特征(2)H2S2.含氮化合物P27(1)NOX的来源与消除(2)燃料燃烧过程中NOx的形成机理①燃料中的含氮化合物在燃烧过程氧化生成NO x。
②燃烧过程中空气中的N2在高温(>2100C)条件下氧化生成NOx (3)燃料燃烧过程中影响NOx形成的因素①燃烧温度②空燃比(4)NOx的环境浓度(5)NOx的危害3.含碳化合物(1)COP31①CO的人为来源②CO的天然来源③CO的去除a.土壤吸收b.与HO·自由基的反应④CO的停留时间及浓度分布⑤CO的危害(2)CO2P33①CO2的来源②CO2的环境浓度③CO2的危害(3)碳氢化合物P38①甲烷a.大气中CH4的来源b.大气中CH4的消除c.大气中CH4的浓度分布特征②非甲烷烃a.天然来源产生的非甲烷烃b.人为来源产生的非甲烷烃4.含卤素化合物(1)简单的卤代烃P45(2)氟氯烃类①来源②消除方式③危害第二节大气中污染物的迁移P47一、辐射逆温层二、大气稳定度(小字不用看)三、大气污染数学模式(小字不用看)四、影响大气污染物迁移的因素1.风和大气湍流的影响2.天气形势和地理地势的影响(1)海陆风(2)城郊风(3)山谷风第三节大气中污染物的转化一、自由基化学基础1.自由基的产生方法P572.自由基的结构和性质的关系(1)自由基的结构与稳定性(2)自由基的结构和活性3.自由基反应(1)自由基反应的分类(2)自由基链反应(3)影响自由基反应的因素(小字不用看)(4)烷烃卤代动力学(小字不用看)二、光化学反应基础P661.光化学反应过程2.量子产率3.大气中重要吸光物质的光解(1)氧分子和氮分子的光解(2)臭氧的光解(3)NO2的光解(4)亚硝酸和硝酸的光解(5)二氧化硫对光的吸收(6)甲醛的光解(7)卤代烃的光解①卤代甲烷在近紫外光照射下,其解离方式②如果卤代甲烷中含有一种以上的卤素,则断裂的是最弱的键,其键强顺序为③高能量的短波长紫外光照射,可能发生两个键断裂,应断两个最弱键④即使是最短波长的光三、大气中重要自由基的来源P741.大气中HO·和HO2·自由基的含量2.大气中HO·和HO2·的来源3.R·,RO·和RO2·等自由基的来源四、氮氧化物的转化P761.NOX和空气混合体系中的光化学反应(小字不用看)2.NOX的气相转化(1)NO的氧化(2)NO2的转化(3)过氧乙酰基硝酸酯(PAN)3.NOX的液相转化(1)NOx的液相平衡(2)NH3和HNO3的液相平衡(小字不用看)(3)NOx的液相反应动力学(小字不用看)五、碳氢化合物的转化P831.烷烃的反应2.烯烃的反应3.环烃的氧化4.单环芳烃的反应5.多环芳烃的反应6.醚、醇、酮、醛的反应六、光化学烟雾P911.光化学烟雾现象(1)光化学烟雾的日变化曲线(2)烟雾箱模拟曲线2.光化学烟雾形成的简化机制3.光化学烟雾的控制对策(1)控制反应活性高的有机物的排放(2)控制臭氧的浓度七、硫氧化物的转化及硫酸烟雾型污染P991.二氧化硫的气相氧化(1)SO2的直接光氧化(2)SO2被自由基氧化①SO2与HO·的反应②SO2与其他自由基的反应(3)SO2被氧原子氧化2.二氧化硫的液相氧化(小字不用看)(1)SO2的液相平衡(2)O3对SO2的氧化(3)H2O2对SO2的氧化(4)金属离子对SO2液相氧化的催化作用3.硫酸烟雾型污染八、酸性降水P1081.降水的pH2.降水pH的背景值3.降水的化学组成(1)降水的组成(2)降水中的离子成分(3)降水中的有机酸(4)降水中的金属元素4.酸雨的化学组成5.影响酸雨形成的因素(1)酸性污染物的排放及其转化条件(2)大气中的NH3(3)颗粒物酸度及其缓冲能力(4)天气形势的影响九、温室气体和温室效应P119十、臭氧层的形成与耗损P1221.臭氧层破坏的化学机理(1)平流层中NOx对臭氧层破坏的影响①平流层中NOX的来源②NOx清除O3的催化循环反应③NOx的消除(2)平流层中HO·对臭氧层破坏的影响①平流层中HOX的来源x·清除O3的催化循环反应③平流层中HO x·的消除(3)平流层中CIO X·对臭氧层破坏的影响①平流层中CIO X·的来源②CIOX·清除O3的催化循环反应③CIOX·的消除(4)平流层中NO X·,HOX·与CIOX·的重要反应①形成HONO2②形成HO2③形成CIONO2④形成N2O2⑤形成HOCI⑥形成H2O2⑦形成HCI2.南极“臭氧洞”的形成机理(小字不用看)第四节大气颗粒物一、大气颗粒物的来源与消除P1291.大气颗粒物的来源2.大气颗粒物的消除(1)干沉降(2)湿沉降二、大气颗粒物的粒径分布P1.大气颗粒物的粒径(1)总悬浮颗粒物(2)飘尘(3)降尘(4)可吸入粒子2.大气颗粒物的三模态3.大气颗粒物的表面性质三、大气颗粒物的化学组成P1331.无机颗粒物(1)硫酸及硫酸盐颗粒物(2)硝酸及硝酸盐颗粒物2.有机颗粒物3.有机颗粒物中的多环芳烃(PAH)(小字不用看)四、大气颗粒物来源的识别(小字不用看)P 1381.富集因子法2.化学元素平衡法五、大气颗粒物中的PM2.5P1.大气中PM2.5来源2.影响大气中PM2.5含量的因素3.PM2.5的危害第三章水环境化学第一节天然水得基本特征及污染物得存在形态一、天然水的基本特征1.天然水的组成(1)天然水中的主要离子组成(2)水中的金属离子(3)气体在水中的溶解性①氧在水中的溶解度②CO2的溶解度(4)水生生物2.天然水的性质(1)碳酸平衡(2)天然水中的碱度和酸度(3)天然水体的缓冲能力(小字不用看)二、水中污染物的分布和存在形态三、水中营养元素及水体富营养化第二节水中无机污染物的迁移转化一、颗粒物与水之间的迁移二、水中颗粒物的聚集三、溶解和沉淀四、氧化还原五、配合作用第三节水中有机污染物的迁移转化一、分配作用二、挥发作用三、水解作用四、光解作用五、生物降解作用第四节水质模型一、氧平衡模型二、湖泊富营养化预测模型三、有毒有机污染物的归趋模型四、多介质环境数学模型第四章土壤环境化学第一节土壤的组成与性质一、土壤组成二、土壤的粒级分组与质地分组三、土壤吸附性四、土壤酸碱性五、土壤的氧化还原性第二节重金属在土壤—植物体系中的迁移及其机制一、影响重金属在土壤—植物体系中迁移的因素二、重金属在土壤—植物体系中的迁移转化规律三、主要重金属在土壤中的积累和迁移转化四、植物对重金属污染产生耐性的几种机制第三节土壤中农药的迁移转化一、土壤中农药的迁移二、非离子型农药与土壤有机质的作用三、典型农药在土壤中的迁移转化第五章生物体内污染物质的运动过程及毒性第一节物质通过生物膜的方式一、生物膜的结构二、物质通过生物膜的方式第二节污染物质在机体内的转运一、吸收二、分布三、排泄四、蓄积第三节污染物质的生物富集、放大和积累一、生物富集二、生物放大三、生物积累第四节污染物质的生物转化一、生物转化中的酶二、若干重要辅酶的功能三、生物氧化中的氢传递过程四、好氧有机污染物质的微生物降解五、有毒有机污染物质生物转化类型六、有毒有机污染物质的微生物降解七、氮及硫的微生物转化八、重金属元素的微生物转化九、污染物质的生物转化速率第五节污染物质的毒性一、毒物二、毒物的毒性三、毒物的联合作用四、毒作用的过程五、毒作用的生物化学机制第六节有机物的定量结构与活性关系一、概述二、Hansch分析法三、分子连接性指数法四、量化参数在QSAR研究中的应用五、比较分子力场分析方法第六章典型污染物在环境各圈层中的转归与效应第一节污染物在多介质多界面环境中的传输第二节重金属元素一、汞二、镉三、铬四、砷第三节有机污染物一、持久性有机污染物二、有机卤代物三、多环芳烃四、表面活性剂第七章受污染环境的修复第一节微生物修复技术一、概述二、影响微生物修复效率的因素三、强化生物修复的主要类型四、生物修复的优缺点第二节植物修复技术一、概述二、植物修复重金属污染的过程和机理三、植物修复有机污染物的过程和机理第三节化学氧化技术一、概述二、高锰酸钾氧化法三、臭氧氧化技术四、过氧化氢及Fenton氧化技术第四节电动力学修复一、基本原理二、影响因素三、联用技术第五节地下水修复的可渗透反应格栅技术一、概述二、Fe—PRB第六节表面活性剂及共溶剂淋洗技术一、基本原理二、影响因素第八章绿色化学的基本原理与应用第一节绿色化学的诞生和发展简史一、绿色化学的诞生二、绿色化学的定义和发展简史第二节绿色化学的基本原理一、绿色化学的12条原理及特点二、绿色化学与绿色工程三、工业生态学原理第三节绿色化学的应用一、绿色化学的主要研究方向二、绿色化学的应用。
环境化学课件

与其他学科的关系
与化学的关系
环境化学是化学的一个分支,它运用 化学的理论和方法来研究环境问题。
与环境科学的关系
与其他自然科学的关系
环境化学与地理学、地质学、气象学 等自然科学也有密切联系,这些学科 为环境化学提供了研究背景和基础数 据。
环境化学是环境科学的重要组成部分, 它与环境工程学、环境生物学、环境 医学等学科相互交叉、渗透。
重量法
通过测量物质的质量变化来确定其含量,如沉淀法、挥发法等。
滴定法
利用化学反应的计量关系,通过滴定操作来测定物质的含量,如酸 碱滴定、氧化还原滴定等。
比色法和分光光度法
利用物质的颜色反应或吸光度来测定其含量,具有操作简便、快速 等优点。
仪器分析方法和技术
光谱法
利用物质对光的吸收、发射或散 射等性质进行分析,如原子吸收 光谱、原子发射光谱、分子光谱
温度、压力、pH值、氧化还原电位、光照和催化剂等。
水体中污染物的转化与归宿
污染物的转化
包括物理转化(如挥发、吸附和解析等)、化学转化(如氧化、 还原、水解和光解等)和生物转化(如生物降解和生物富集 等)。
污染物的归宿
包括污染物的迁移(如扩散、对流和弥散等)、转化(如上述 各种转化过程)和最终归宿(如沉积物中的长期积累、生物体 内的富集以及通过食物链的传递等)。
二次污染物
由一次污染物在大气中经 过化学反应或光化学反应 形成的污染物质,如光化 学烟雾、硫酸盐等。
大气污染物的来源
工业排放、交通运输、农 业活动、生活排放等。
大气化学反应及影响因素
光化学反应
在阳光照射下,大气中的某些污 染物质会发生光化学反应,生成
二次污染物。
自由基链式反应
环境化学中常用模型介绍
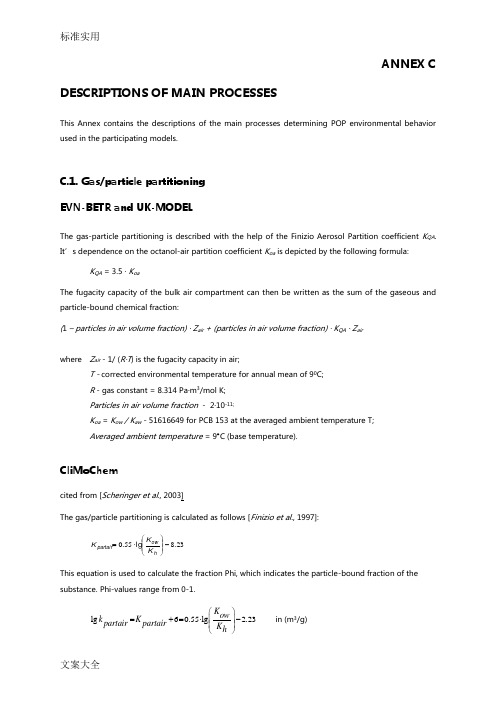
ANNEX CDESCRIPTIONS OF MAIN PROCESSESThis Annex contains the descriptions of the main processes determining POP environmental behavior used in the participating models.C.1. Gas/particle partitioning EVN-BETR and UK-MODELThe gas-particle partitioning is described with the help of the Finizio Aerosol Partition coefficient K QA . It ’s dependence on the octanol-air partition coefficient K oa is depicted by the following formula:K QA = 3.5 · K oaThe fugacity capacity of the bulk air compartment can then be written as the sum of the gaseous and particle-bound chemical fraction:(1 – particles in air volume fraction) · Z air + (particles in air volume fraction) · K QA · Z airwhere Z air - 1/ (R ·T ) is the fugacity capacity in air;T - corrected environmental temperature for annual mean of 90C; R - gas constant = 8.314 Pa ·m 3/mol K; Particles in air volume fraction - 2·10-11;K oa = K ow / K aw - 51616649 for PCB 153 at the averaged ambient temperature T; Averaged ambient temperature = 9︒C (base temperature).CliMoChemcited from [Scheringer et al ., 2003]The gas/particle partitioning is calculated as follows [Finizio et al ., 1997]:238550.lg .-⎪⎪⎭⎫⎝⎛⋅=h owpartair KK K This equation is used to calculate the fraction Phi, which indicates the particle-bound fraction of the substance. Phi-values range from 0-1.lg 60.55lg 2.23K ow k K partair partair K h ⎛⎫⎪=+=⋅- ⎪⎝⎭in (m 3/g)()tsp k tspk Phi partair partair ⋅+⋅=1G-CIEMSWhen K oa is not available as input:K qa = 6 · 106/P ls ,where K qa is dimensionless particle/gas partition coefficient and P ls is liquid vapour pressure. Final partitioning is calculated with TSP and density of aerosol particles in fugacity format. Vapour pressure is temperature corrected when the temperature is different from 25 ︒C. When K oa is available as input:K qa = y · K oa / (1000),where, K qa is dimensionless particle/gas partition coefficient, y is organic matter mass fraction, and isthe density of aerosol particles.(Note: G-CIEMS model can calculate V/P partitioning from only molecular weight (for preliminary assessment purpose) or from K oa . Two output 1 and 2 is presented in Chapter 4 as G-CIEMS-1 and G-SIEMS-2).DEHM-POPThe gas-particle partitioning is calculated using the absorption model:,)(1+=φTSP K TSP K p pwhere is the fraction of compound sorbed to particles, K p is gas-particle partitioning coefficient, andTSP is the total suspended particulate matter [e.g. Falconer and Harner , 2000]. K p is calculated using theK oa approach:log ,91.11log log -+=om oa r p f K m Kwhere m r is a constant expected to have a value close to +1 for equilibrium partitioning, K oa is the octanol-air partitioning coefficient, f om is the fraction of organic matter in the particles, and 11.91 is a constant determined by the intercept br = log f om – 11.91 [Finizio et al ., 1997, Falconer and Harner , 2000]. The temperature dependent K oa is calculated using the expression:)),11(exp()()(TT R U T K T K ref oa ref oa oa -∆= where ∆U oa is the internal energy of phase transfer, R is the universal gas constant, T is the temperature and K oa (T ref ) is the value of K oa at the reference temperature T ref [Beyer et al., 2002].SimpleBoxcited from[Brandes et al., 1996]Air-aerosol partition coefficients are usually not known. However, some information is frequently available on the fraction of the chemical that occurs in association with the aerosol phase. SimpleBox uses this information for the computations. A value for the fraction of the chemical that is associated with the aerosol phase, FRass aerosol, can be entered directly, or estimated on the basis of the chemical's vapor pressure, according to Junge[1977]. In this equation, the sub-cooled liquid vapour pressure should be used. For solids, a correction is applied according to Mackay [1991]:If MELTINGPOINT < TEMPERATURE [S] (substance is liquid): θθCONST.+T URE VAPORPRESS CONST.= FRass S aerosol )(][ If MELTINGPOINT > TEMPERATURE [S] (substance is solid):θθ-CONST.+e T URE VAPORPRESS CONST.= FRass S E TEMPERATUR NTMELTINGPOI S aerosol ).(.][][).(1796with FRassa erosol[S] - fraction of the chemical in air that is associated with aerosol particles at scale S [-] (A);VAPOR PRESSURE(T) - vapor pressure of the chemical at temperature T at scale S [Pa] (A);MELTINGPOINT - melting point of the chemical [K] (A);CONST- constant [Pa ·m] (C);- surface area of aerosol phase [m aerosol 2/m air 3] (C);TEMPERATURE [S ]- temperature at the air-water interface at scale S [K] (A). with the product CONSTset equal to 10-4 Pa.CAM/POPsIn the CAM/POPs model, the process of POP partitioning between the gas and particulate phases in atmosphere is based on Junge-Pankow adsorption model [Junge , 1977; Pankow , 1987] POP fraction Φ adsorbed on the atmospheric aerosol particles is given by:Θ⋅+Θ⋅=Φc P c L 0where, Φ - fraction of POPs adsorbed on aerosol particles;Θ - aerosol surface area available for adsorption, m 2 aerosol/m 3 air;P 0L - liquid-phase saturation vapour pressure of pure compound, Pa;c - parameter that depends on the thermodynamics of the adsorption process and surfaceproperties of the aerosol (Pa · cm).Junge ’s proposed value of the parameter c is 17.2 Pa · cm [P ankow , 1987; Falconer et al., 1994;Bidleman et al., 1998].The liquid vapour pressure, P 0L , are derived from:b TmP L +=010log ,where the slope (m) and the intercept (b) are estimated to calculate liquid vapour pressure of POPs with changing air temperature [Falconer et al., 1995; Harner et al., 1996]. Temperature dependence of P0L for each congener can be seen in Table C.1.Table C.1. Liquid vapour pressure of PCBs as a function of air temperatureAerosol surface area, , is calculated by multiplying aerosol number density by its wet surface area.MSCE-POPIn the current model version (MSCE-POP 1) the characterization of POP partitioning between the gas and particulate phase of a pollutant is performed using subcooled liquid vapour pressure p ol (Pa). According to the Junge-Pankow adsorption model [Junge , 1977; Pankow , 1987] POP fraction ϕ adsorbed on the atmospheric aerosol particles equals to:θθϕ⋅+⋅=c p c olwhere c is the constant depending on thermodynamic parameters of adsorption process and onproperties of aerosol particle surface. It assumed c = 0.17 Pa ·m [Junge , 1977] for background aerosol;is the specific surface of aerosol particles, m 2/m 3. Assumed= 1.5·10-4 [Whitby , 1978].The temperature dependence of p ol (Pa) is parameterized in the model by:⎪⎭⎫ ⎝⎛--⋅=0110T T a olol P e p p ,where T 0 = 283.15 K is the reference temperature, T (K) is the ambient temperature, p 0ol is p ol value at reference temperature, and a P is the coefficient of temperature dependence. The values of p 0ol and a P for considered PCB congeners used in the model are presented in Table C.2.Table C.2. Coefficients of p ol temperature dependence for three PCB congeners used in MSCE-POP modelCongener p 0ol a P PCB-28 6.43·10–3 9383 PCB-153 9.69·10–5 10995 PCB-1801.67·10–511610At present the work on modification of the description of gas aerosol partitioning within MSCE-POP model is ongoing. The approach using the octanol-air partitioning coefficient absorption model presented in [Falconer and Harner, 2000] is tested. Under this approach POP fraction ϕ adsorbed on the atmospheric aerosol particles is calculated as:TSPK TSP K p p ⋅+⋅=ϕ1where K p is the particle-gas partitioning coefficient and TSP is the total suspended particle concentration (μg ⋅m -3). The constant K p is calculated for PCBs via K oa by the following regression equations [Falconerand Harner, 2000]:log K p = log K oa + log f om – 11.91,(experimental version - MSCE-POP 2)where K oa is the octanol/air partitioning coefficient and f om is the fraction of organic matter in the atmospheric aerosol involved in partitioning.The temperature dependence of K oa is parameterized in the model by:⎪⎭⎫ ⎝⎛--⋅=0110T T a oaoa K eK K ,where K 0oa is K oa value at reference temperature, and a K is the coefficient of temperature dependence. The values of K 0oa and a for considered PCB congeners used in the model are presented in Table C.3.Table C.3. Coefficients of K oa temperature dependence for three PCB congeners used in MSCE-POP modelEVN-BETR and UK-MODELThe intermedia transport of chemicals is described using D-values (mol/Pa ·h), which represent how fast advective and reactive/degradation processes are occurring. In the case of the air to surface exchange, the D-value defining dry particle deposition is:Dair-surface = Surface Area · Particles in air volume fraction · V q · Z air · K QAKnowing these values can help calculate the flux of a chemical entering a region and, thus, it ’s amount in the compartment under study.Surface area - compartment specific;Particles in air volume fraction - 2 10-11; Vq - dry deposition velocity = 10.8 m/h.CliMoChemcited from [Scheringer et al ., 2003]Dry deposition to baresoil a , water, vegetation-covered soil bgas gas i drygas C V A v Phi dtdC ⋅⎪⎪⎭⎫⎝⎛⎪⎪⎭⎫ ⎝⎛⋅-=a If the year consists of exactly four seasons with varying temperatures,v dry for deposition to baresoil is changingtaking into account that in the cold season the atmosphere is more stable and the deposition rate therefore is smaller. The spring and fall values are interpolations between the summer and winter values. v dry changes as follows [Waniaand McLachlan , 2001]:bIf the year consists of exactly four seasons with varying temperatures, v dry for deposition to vegetation-covered soil ischanging taking into account that in the cold season the atmosphere is more stable and the deposition rate therefore is smaller. The spring and fall values are interpolations between the summer and winter values. v dry changes as follows [Wania and McLachlan , 2001]: The vegetation cover consists of three types: Grass, Coniferous Forest and Deciduous Forest. The variables VegGrass, VegCon and VegDec describe the fraction of the vegetation-covered soil occupied by the different cover types. Their numeric value is between 0-1 and depends on the climatic zone.Dry deposition to vegetationgas gas veg gas C V A vdryPhi dtdC ⋅⎪⎪⎭⎫⎝⎛⎪⎪⎭⎫⎝⎛⋅-=Paramete rDescriptionNumeric ValueC gas concentration of substance in gaseous phasePhi particle-bound fraction of the substance (see C.1.) between 0-1v drydeposition ratevariable, depending on climatic zone*A veg Area of vegetation (identical with Area of vegetation-covered soil)variableV gas Volume of gaseous phase variable* - the model contains three types of vegetation. For each type, the deposition rate (v dry ) is different (see table below). Depending on the composition of a climatic zone, v dry is calculated as follows:vdry fractiongrass vdry fractiondec vdry fractioncon vdry i i grass i dec i con =⋅+⋅+⋅ParameterDescriptionNumeric Value Referencevdry i deposition rate in climatic zone ivdry grass deposition rate to grass55.92 m/d Horstmann and McLachlan [1998] Möller [2002]vdry dec deposition rate to deciduous forest 447.6 m/d vdry condeposition rate to coniferous forest43.2 m/d fractiongrass ifraction of grass of total vegetation in climatic zone ivariablefractiondec i fraction of deciduous forest of total vegetation in climatic zone ivariablefractioncon i fraction of coniferous forest of total vegetation in climatic zone ivariableBecause of increased stability of the atmosphere in the spring, fall and winterseason, the deposition rates vdrygrass, vdrydec and vdrycon are divided by 3 for the winterseason and by 2 for the spring and fall seasons (given that the year consists of exactly four seasons with varying temperature [Wania andMcLachlan , 2001]).G-CIEMSF = v Dep · (TSP/) · C particleWhere F is mass flux of compound for this chemical, v Dep is dry deposition velocity of particles, TSP is particulate concentration of weight/volume dimensionis density of aerosol particles, C particleis compound volumetric concentration in particles. Same value is used on all land and water surfaces.DEHM-POPThe dry deposition of particulate phase is calculated as a flux given by the atmospheric concentration times a deposition velocity [Christensen , 1997]. The deposition velocity is highly dependent on the meteorological conditions and the surface properties. The size of the particles is assumed to be 1m[Christensen , 1997].For unstable conditions in the atmosphere (when L < 0, i.e. at day time with clear sky), the deposition velocity is calculated using:),)300(1()3/2(*La u v d -+=where u* is the surface friction velocity, a is a constant depending on the surface properties, and L is the Monin-Obukhov length.For stable conditions in the atmosphere (when L > 0, i.e. at night time with clear sky), the deposition velocity is calculated using:.*au v d =The surface friction velocity is calculated using:,*)10ln(*35.0*zUu =where U is the wind speed and z is the roughness length which depends on the properties of the surface, and varies seasonally.The Monin-Obukhov length is calculated using:,)(.)(*ρ-⋅⋅⋅=p dc H g Tu L 3503 where T is the temperature, g is the gravitational constant (g = 9.82), H d is the heat flux, c p is the specific heat at constant pressure, andis the air density. L is positive (stable atmosphere) when the heat flux isnegative (night time clear sky) and negative (unstable atmosphere) when the heat flux is positive (day time clear sky).SimpleBoxcited from [Brandes et al ., 1996]Value for the deposition mass transfer coefficients DRYDEP aerosol may be obtained by means of:FRass .RATE AEROSOLDEP = DRYDEP S aerosol S S aerosol ][][][with DRYDEP aerosol [S ]: mass transfer coefficient for dry deposition of aerosol-associated chemical at scaleS [m air /s] (D);AEROSOLDEPRATE [S ] - deposition velocity of the aerosol particles at scale S with which the chemicalis associated [m/s] (A);FRassaerosol [S ]: fraction of the chemical in air that is associated with aerosol particles at scale S [-](A).Deposition mass flows of the chemical depend on the rate of dry aerosol deposition. Deposition velocities of aerosols vary greatly with the size of the particles. As chemicals may be associated with particles of a specific size, the deposition velocities depend also on the chemical. The values given are typical values, to be used as a starting point:scm = RATE AEROSOLDEP S /1.0][with AEROSOLDEPRATE [S ]: deposition velocity of the aerosol particles with which the chemical isassociated at scale S [m/s] (A)CAM/POPsRemoval of POPs particles is coupled with the dry deposition of aerosols in the CAM model. The dry deposition flux can be written as:,p d d C v F ⋅-=where V d is the deposition velocity and C p is the particle concentration [G ong et al. 2003]. Dry deposition flux of POPs gas is written as:,g d d C v F ⋅-=where the dry deposition velocity of gas, V d , is calculated in CAM model [G ong et al. 2003].MSCE-POPDry deposition to grass and bare soilAccording to model of [Sehmel , 1980], deposition flux over grass is calculated as(),*soil C soil soil p z B u A C F 02+⋅=where as above *u , is the friction velocity;z 0 is the surface roughness, mm;A soil = 0.02,B soil = 0.01,C soil = 0.33.Dry deposition to forestAccording to model of [Ruijgrok et al., 1997], deposition flux over forest is calculated ashp u u E C F 2*⋅=,where u h is the wind speed at forest height h = z b ;*u is the friction velocity, m/s;()()()20/80exp 1*-+=RH u E γαβ, α = 0.048, β = 0.3 and γ = 0.25, RH =80.Dry deposition to seawaterAccording to model of [Lindfors et al., 1991], deposition flux over seawater is calculated as:)(*sea sea p B u A C F +⋅=2,where *u is the friction velocity, m/s;A sea = 0.15,B sea = 0.013Similar to DEHM-POP model values of deposition flux depend on meteorological conditions (friction velocity u *). Therefore, in the results of calculation experiments we present the range of obtained values of the flux together with its value at average environmental parameters.C.3. Wet deposition EVN-BETR and UK-MODELIn a similar way as for the dry particle deposition, wet scavenging is defined as the result of:D air-surface = Q · Surface Area · Particles in air fraction · K QA · U R · Z airIn the case of deposition in vegetation, the percentage of rain interception due to vegetation is taken into account.U R - rain rate = 8.84 x 10⁻⁵ m/h; Q - Rain Scavenging ratio = 200000;Or Snow Scavenging Ratio = 1000000CliMoChemcited from [Scheringer et al ., 2003]Wet deposition from gaseous phase to baresoil and water()gas h gas i rain gas C K V A v Phi dtdC ⋅⎪⎪⎭⎫⎝⎛⋅⎪⎪⎭⎫ ⎝⎛⋅--=11Wet deposition from gaseous phase to vegetation-covered soil()()gas rt h gas vsoil rain gas C f K V A v Phi dtdC ⋅-⋅⎪⎪⎭⎫ ⎝⎛⋅⎪⎪⎭⎫ ⎝⎛⋅--=111* - for deciduous and coniferous forest, the f rf -value is 0.35 for the summer season, for grass, the f rf -value is 0.12 forthe summer season. In the winter season, the value is at 10% of the summer season, in spring and fall season, the value is at the linear interpolation value between summer and winter season. Because the composition of the vegetation varies with the climatic zones, the contributions of grass, coniferous and deciduous forest to the overall f rf -value of a specific climate zone differ and are proportional to the fraction of the respective vegetation type in a climatic zone.Wet deposition from gaseous phase to vegetation()gas rt h gas vsoil rain gas C f K V A v Phi dtdC ⋅⋅⎪⎪⎭⎫⎝⎛⋅⎪⎪⎭⎫ ⎝⎛⋅--=11* - for deciduous and coniferous forest, the f rf -value is 0.35 for the summer season, for grass, the f rf -value is 0.12 for the summer season. In the winter season, the value is at 10% of the summer season, in spring and fall season, the value is at the linear interpolation value between summer and winter season. Because the composition of the vegetation varies with the climatic zones, the contributions of grass, coniferous and deciduous forest to the overall f rf -value of a specific climate zone differ and are proportional to the fraction of the respective vegetation type in a climatic zone.Wet deposition from particulate phase to bare soil and watergas gas i ratio rain gas C VA scav v Phi dtdC ⋅⎪⎪⎭⎫⎝⎛⎪⎪⎭⎫ ⎝⎛⋅⋅-=Wet deposition from particulate phase to vegetation-covered soil()gas rt gas vsoil ratio rain gas C f V A scav v Phi dtdC ⋅-⋅⎪⎪⎭⎫⎝⎛⎪⎪⎭⎫ ⎝⎛⋅⋅-=1* - for deciduous and coniferous forest, the f rf -value is 0.35 for the summer season, for grass, the f rf -value is 0.12 for the summer season. In the winter season, the value is at 10% of the summer season, in spring and fall season, the value is at the linear interpolation value between summer and winter season. Because the composition of the vegetation varies with the climatic zones, the contributions of grass, coniferous and deciduous forest to the overall f rf -value of a specific climate zone differ and are proportional to the fraction of the respective vegetation type in a climatic zone.Wet deposition from particulate phase to vegetationgas rt gas vsoil ratio rain gas C f V A scav v Phi dtdC ⋅⋅⎪⎪⎭⎫⎝⎛⎪⎪⎭⎫⎝⎛⋅⋅-=*- for deciduous and coniferous forest, the f rf -value is 0.35 for the summer season, for grass, the f rf -value is 0.12 forthe summer season. In the winter season, the value is at 10% of the summer season, in spring and fall season, the value is at the linear interpolation value between summer and winter season. Because the composition of the vegetation varies with the climatic zones, the contributions of grass, coniferous and deciduous forest to the overall f rf-value of a specific climate zone differ and are proportional to the fraction of the respective vegetation type in a climatic zone.G-CIEMSF = R rain · C air / H +(TSP/) · Q · C particle ,where F is total mass flux by this process, R rain is rain rate, C air is gaseous concentration of chemical, H is Henry ’s law constant, TSP is particulate concentration,is density of particles, Q is scavenging ratio ofparticles, and C particle is volumetric chemical concentration in particles. Same Q value is assumed over all land and water surfaces.DEHM-POPThe wet deposition is given as a flux calculated as the product between the air concentration and a scavenging ratio [Christensen , 1997]. Different scavenging ratios are used for in-cloud scavenging and below-cloud scavenging. It is assumed that air pollution is scavenged more efficient in the clouds than below the clouds. The below cloud scavenging rate at a given heightis given by:,)()(wa bc H P W ρσΛ=σwhere bc is the below cloud scavenging coefficient, P a is the total precipitation at the level, H is aneffective thickness for scavenging (H = 1000 m), and w is the density of water. The in cloud scavengingrate at a given height is given by:,)()(wc H P W ρσΛ=σ where c is the below cloud scavenging coefficient, P a is the is the total precipitation created inside thecloud layer. The used scavenging ratios are:bc = 100000 andc = 700000.The total amount of pollutant scavenged by the wet deposition is then dependent on the actual height of the formation of the precipitation, and on the vertical concentration profile.SimpleBoxcited from [Brandes et al ., 1996]Value for the deposition mass transfer coefficient WASHOUT may be obtained by means of: ][][][S S S .SCAVratio RAINRATE = WASHOUTwithWASHOUT [S ] - mass transfer coefficient for wet atmospheric deposition at scale S [m air ·s -1] (D);RAINRATE [S ]- rate of wet precipitation at scale S [m rain .s -1] (A);SCAVratio [S ] - scavenging ratio (quotient of the total concentration in rainwater and the totalconcentration in air) of the chemical at scale S [-] (A).The scavenging ratio may be known from measurements or estimated:][][][][][1S S aerosol S w ater air S aerosol S COLLECTeff FRass K FRass SCAVratio +-=-with SCAVratio [S ] - scavenging ratio (quotient of the total concentration in rainwater and the totalconcentration in air) of the chemical at scale S [-] (A);FRass aerosol [S ] - fraction of the chemical in air that is associated with aerosol particles at scale S [-](A);K air-water [S ] - air-water equilibrium distribution constant at scale S [mol ·m air -3/mol ·m water -3] (A);COLLECTeff [S ] - aerosol collection efficiency at scale S [-] (A),The first term represents an estimate of the (equilibrium) distribution between rain water in air and the gas phase of air. The second term represents the scavenging of aerosol particles by rain droplets. The proportionality constant of 2⋅105 is taken from Mackay [1991].Deposition mass flows of the chemical depend on the rate of wet precipitation. Collection efficiencies of aerosols vary greatly with the size of the particles. As chemicals may be associated with particles of a specific size, the collection efficiencies depends also on the chemical. The values given are typical values, to be used as a starting point:5][10.2 = COLLECTeff SwithCOLLECTeff [S ] - aerosol collection efficiency at scale S [-] (A ).Table C4. RAINRATE of the scales* - from Wania and Mackay [1995]CAM/POPsThe precipitation scavenging of POPs particles by falling rain or snow is coupled with the wet removal of aerosols in the CAM model.The particulate wet deposition flux, F p , can be written as:p snow or rain p C h F )(ψ-=,where h is the falling distance, C p is the particulate phase POPs concentration, ψ is the scavenging rate for rain or snow [Gong et al. 1997].The gas phase POPs are assumed to be in quasi-steady equilibrium with the rain drop. The air-water equilibrium coefficient, K aw , is a dimensionless partition coefficient that can be derived from Henry ’s Law constant, H (Pa ·m 3/mol) [Seinfeld , 1986].K aw = H / (R ·T)and, H = H 0 exp (a(1/T 0 - 1/T)),where T is the temperature (K) and R is the gas constant (8.314 Pa ·m 3/mol ·K or J/mol/K), H 0 is the value at the reference temperature T 0, and a is a parameter of temperature dependence.The net wet deposition flux, F w , is then written as:G AW w C K p F ⋅-=)/(where p is the precipitation rate, usually reported in mm/h and C G is the gas phase POPs concentration.MSCE-POPWet deposition of particulate phaseThe values of concentration in precipitation are given by the formula:p a p s w C W C =,where pa C - the particle bound phase concentration in the air surface layer, ng/m 3;sw C - the suspended phase concentration in precipitation water, ng/m 3;W p =1.5 ⋅ 105 - the dimensionless washout ratio for the particulate phase.Wet deposition of gaseous phaseg a g d w C W C =,where dw C - the dissolved phase concentration in precipitation water, ng/m 3;gaC - the gaseous phase concentration in air, ng/m 3; W g = 1/K H - the dimensionless washout ratio for the gaseous phase;K H - the dimensionless Henry ’s law constant.C.4. Gaseous exchange between atmosphere and soil EVN-BETR and UK-MODELAir-soil diffusionD air-soil = (Soil Area · Z air ) / [(Z air / (MTC as · Z air + MTC sw · Z water )) + 1 / MTC sabl ]where Average soil depth = 10 cm;Soil Area = 8.36 1012 m 2;Z water = Z air / K AW = 543 mol/m 3 Pa;MTC as - soil air-phase diffusion transport velocity = 0.04 m/h; MTC sw - soil water-phase diffusion transport velocity = 1 x 10⁻⁵ m/h; MTC sabl - soil air boundary layer transport velocity = 1 m/h.Air-soil rain dissolutionD air-soil = Soil Area · U R · Z waterCliMoChemcited from [Scheringer et al ., 2003]Diffusion from atmosphere to baresoil and vegetation-covered soil()gas gas i K foc rhoom regc K h gasS gas C V A vS K vL vG v Phi dtdC ow h⋅⋅⎪⎪⎭⎪⎪⎬⎫⎪⎪⎩⎪⎪⎨⎧+++--=-⋅⋅⋅1111Analogous to the procedure in subsection C.3, the parameter v gasS is changed if the year consists of exactly four seasons with varying temperatures (compare tables below).baresoil:vegetation-covered soil:The vegetation cover consists of three types: Grass, Coniferous Forest and Deciduous Forest. The variables VegGrass, VegCon and VegDec describe the fraction of the vegetation-covered soil occupied by the different cover types. Their numeric value is between 0-1 and depend on the climatic zone. Calculation of vG, vL, vS [Jury et al., 1983].When calculating the v i -value, the corresponding Di -value must be used (eg. for calculating vG, the DG-value is used):()⎥⎦⎤⎢⎣⎡⋅++--⋅⋅⋅⋅=h airsoil w soil airsoil w soil ow OC h h i i K frac frac frac frac K f rhoom regc K D v soil 12。
环境化学

• • • • • 绪论 生态学基础知识 大气环境化学 水环境化学 土壤环境化学 污染物生物体内的积累与转化
生态学基础知识
• • • • • • 生态系统的组成和结构 生态系统的生物生产 生态系统的能量流动 人类的生态环境结构 生态系统的物质循环 生态系统平衡
大气环境化学基础
• • • • • • • • 大气结构与大气压力随高度的变化 对流层大气的组成 气温垂直递减率和气团的干绝热减温率 大气的能量平衡 大气光化学基础 光化学平衡和光化学动力学 影响光化学反应速率的因素 大气中的光解反应
(1)人口膨胀导致过度开发 人口膨胀导致过度开发
• 世界人口快速增长,每年净增近1亿! 世界人口快速增长,每年净增近1 • 为供养如此大量的人口,已出现冲破自然规 为供养如此大量的人口, 律制约、掠夺性开发自然资源的问题, 律制约、掠夺性开发自然资源的问题,导致 资源耗竭、植被减少、土地沙化、水土流失, 资源耗竭、植被减少、土地沙化、水土流失, 出现生态环境恶化现象. 出现生态环境恶化现象.
二、环境问题的产生和环室气体过量排放
造成的气候变化)、臭氧层破坏、大气 广泛污染和酸雨(酸沉降)、海洋污染、 有毒有害的化学物质的污染危害和转移 等。
导致环境污染因素: 导致环境污染因素: 自然因素: 第一类 自然因素: 自然界各因素间相互作用或自然界自身不断 运动产生的那些危及人类生存的问题。 人为因素: 第二类 人为因素: 人类生产和生活所引起的。
环境污染定义: 环境污染定义:由于自然的或人为的(生产、生 活)原因,往原先处于正常状况的环境中附加了 物质、能量或强度超过了环境的自净能量(自动 调节能量),使环境质量变差,并对人们的健康 或环境中某些有价值物质产生有害影响者。 公式: 公式: 自然因素或人类活动的冲击破坏) (自然因素或人类活动的冲击破坏) —(包括自净机能在内的自然界动态平衡恢 ( 复能量) 复能量) 环境污染造成的危害) = (环境污染造成的危害)
环境化学_多介质环境模型

内容
第一节 基本概念 第二节 污染物在环境中的迁移转化过程 第三节 多介质环境逸度模型的类型及计算
第四节 代表性的多介质环境逸度模型
内容
第一节 基本概念
一、多介质环境系统 二、稳态和平衡
三、逸度
一、多介质环境系统
环境介质 (Environmental Media), 相 (Phase,Compartment)
n ciVi ZifiVi
2、开放系统,稳态方程
Iin Iout
3、非稳态方程
dc / ct Iin Iout
二、多介质环境逸度模型的分级
1、Ⅰ级多介质环境逸度模型 Ⅰ级模型对应的是稳态、平衡、无流动环境系统,封闭环境
2、Ⅱ级多介质环境逸度模型 Ⅱ级模型对应的是稳态、平衡、有流动环境系统,开放系统 3、Ⅲ级多介质环境逸度模型 Ⅲ级模型对应的是稳态、非平衡、有流动环境系统 4、Ⅳ级多介质环境逸度模型 Ⅳ级模型对应的是非稳态、非平衡、有流动环境系统
一、污染物在环境中的迁移过程
2、扩散 分子热运动引起的热力学自发的增墒过程。 (1)相内的分子扩散
JA B
1
d A M dy
c
JA:A在单位面积上的扩散通量,mol· m-2· hBM:A在介质B中的分子扩散系数,m2· h-1 cA:介质B中A的浓度,mol· m-3 y: A分子在扩散方向上经过的距离,m dc A :A沿扩散方向的浓度梯度 dy
二、表层土壤模型
表层土壤模型可以用来模拟污染物在土壤中的降解、挥发和渗 滤等过程,评价各种迁移转化过程的相对重要性,污染物在 土壤中的持久性和最终归趋,以及预测各种修复措施使土壤 恢复到可接受的污染程度和所需要的时间。
环境化学word讲义

附件4电子教案将大气、水、土壤、生物等各个圈层分开讲述,只是为了讲述上的方便,实际上环境中各个圈层之间的环境化学行为是相互联系的。
第一章:绪论Environmental Chemistry—Chemistry is all around us。
我们生活的环境无处不包含着化学过程,而且这些化学过程也在时时刻刻影响着我们生存的环境,为了说明化学和环境之间密不可分的关系,先讲述两个小故事:1)CO—CO2:早期的汽车尾气中,燃烧不充分,排放较多的CO。
人们很早就认识到CO 对人类的毒害性,因此想尽办法改善内燃机的燃烧效率,燃烧充分完全,这样尾气中排放的CO大大减少,这样大大净化了空气。
但是充分燃烧的C又转化为CO2,这是不可避免的。
后来人们才认识到大量的CO2会导致全球气候变暖(Global Warming),最终导致的全球气候问题可能更难于控制。
2)HC—NOx:在早期的洛杉矶烟雾发生时,人们当时认为这主要是由于其中碳氢化合物(HC)和CO导致的,因此出台了许多规定,严格限制汽车排放的HC和CO。
为此汽车制造商大动脑筋,增加空气/染料比率来使燃烧更为充分,从而减少HC和CO的排放量。
但是人们马上又认识到,这样做的代价就是尾气排放量增加,而且其中含有的NOx也明显增加了,这又是导致酸雨的重要污染气体。
——Dilemma—Environment Coin3)為什麼雨過天晴使人精神爽快? 這不僅是因為風雨洗淨了空氣當中令人討厭的塵埃,也是由於經過雨水淋洗之後,空氣當中二氧化碳、二氧化硫、硫化氫、氯化氫、氨等不良氣體成分溶於水中,使空氣得到純化,人們呼吸到了新鮮空氣。
使人感到精神爽快還有一個重要原因,就是在下雨的時候,常有雷電現象發生。
一般雷電發生時,可以產生高達二萬至二十萬安培的電流。
使空气分子电离,导致臭氣的生成:O2=O+OO+O2=O3臭氣不稳定,在空氣中可不斷分解,釋放出氧原子。
這樣實質上就延長了氧原子在空氣中存在的時間,並使氧原子從雷電生區域擴散到大氣其他部分。
环境化学第七章 多介质环境模型

三、多介质环境逸度模型的计算 3、模型构建和计算 、 4、模型验证 、 5、模型的灵敏度和不确定性分析 、 灵敏度: 灵敏度:模型输出对模型参数改变的响应 不确定性分析:模型输入的不确定性对预测结果可靠性的影响 不确定性分析:
第四节 代表性的多介质环境逸度模型
一、空气-水交换模型 空气 水交换模型 二、表层土壤模型 三、底泥-水交换模型 底泥 水交换模型 四、QWASI模型 模型 五、全球分布模型
一、污染物在4)在多孔介质中的扩散 ) (5)相间扩散过程 )
二、污染物在环境中的降解反应 对于整个环境而言, 对于整个环境而言,污染物只有通过降解反应才能真正的被 去除。描述污染物降解反应过程的动力学中, 去除。描述污染物降解反应过程的动力学中,应用最多的是 一级反应动力学: 一级反应动力学:
四、QWASI模型 模型 QWASI模型描述了点源排放、河水流入和大气沉降所引入的污 模型描述了点源排放、 模型描述了点源排放 染物在湖泊和河流中的多介质环境行为。 染物在湖泊和河流中的多介质环境行为。 1、湖泊中污染物归趋的QWASI模型 、湖泊中污染物归趋的 模型 该模型适用于水流和颗粒物流均匀混合的水体。 该模型适用于水流和颗粒物流均匀混合的水体。 2、河流中污染物归趋的QWASI模型 2、河流中污染物归趋的QWASI模型 3、多段 、多段QWASI模型 模型
一、污染物在环境中的迁移过程
环境中,污染物可以通过以下几种平流过程输入和输出: 环境中,污染物可以通过以下几种平流过程输入和输出: 1. 空气的输入和输出 2. 水的输入和输出 3. 水中存在的颗粒物和生物的输入和输出 4. 水从表层土壤渗入地下(地下水补给) 水从表层土壤渗入地下(地下水补给) 5. 空气中存在的气溶胶的输入和输出 6. 空气从对流层向平流层迁移,即空气的垂直运动 空气从对流层向平流层迁移, 7. 底泥的掩埋
环境介质

苯并(a)芘的环境多介质迁移和归趋 苯并 芘的环境多介质迁移和归趋 模拟
将某地区的环境相分为4个主相,即大气、 水体、土壤和沉积物,下标依次为1、2、3、 4;每个主相中又部分包括气、固和水等子 相。大气中包括气相和气溶胶;水体中包 括水、悬浮物、鱼(代表水生生物);土壤中 包括气相、固相和水相;沉积物中包括固 相和水相。根据稳态假设和质量平衡关系 可以建立涉及主相迁移量的平衡表达式,
需要收集的数据收集的数据包括模型验证的数据和用于模型输入的数据模型的计算过程共涉及到63个输入参数分为13个描述苯并a芘物理2化学性质的参数44个区域环境参数和6个表征系统输入量的参数大气和水平流过程中的输入浓度则取本地区的实测值苯并a芘在研究区域的来源当地系统向环境相中的排放和系统外大气和水的长距离平流输送工业燃油交通燃油工业含发电供热燃煤炼焦用煤家庭燃煤及天然气等
多介质归趋模型
我们把某种物质在各种介质中的持续 和运移统称为该物质在介质中的环境 归趋, 这种归趋不仅取决于农药本身固 有的性质(如蒸气压、水溶度、生物活 性等) , 而且还与外部的环境因素(如介 质性质和气候条件等) 密切相关,综合 考虑这些得出的一种模型即称为多介 归趋模型。
பைடு நூலகம்
归趋模型的背景
进入环境中的有机物,对动植物的危害性。 如果其进入环境后,可被分解为毒性小或 无毒,则对这类有机物处理得当,那么, 它就不属于禁用或严格控制之列,不但不 属于污染物,而且还是工农业生产的资源。 因此,研究水、土环境中各种有机毒物的 预测模型是一个十分重要的问题。预测归 趋模型可以帮助我们预测污染物在环境中 浓度的分布及通过各种迁移转化过程后的 最终归趋。
主讲人: 主讲人:eric 2011.1.4
一、环境介质的定义 二、多介归趋模型的介绍 苯并(a)芘归趋模型 三、苯并 芘归趋模型 四、环境多介质模型的发展
环境化学完整ppt课件

土壤空气是存在于土壤孔隙中的气体,对 植物生长和土壤微生物活动有重要影响。
土壤污染及危害
重金属污染
主要来自工业废水、废气、废渣的排放,以及农药、化肥 的过度使用。重金属在土壤中难以降解,会通过食物链富 集,对人体健康造成危害。
有机物污染
主要来源于工业和城市污水、石油泄漏、农药使用等。有 机物污染会破坏土壤生态平衡,影响农作物产量和品质。
面临挑战和机遇探讨
复杂环境问题
随着工业化和城市化的加速,复合型、区域性环境问题日益突出 ,对环境化学提出更高要求。
新兴污染物研究
新型污染物如纳米材料、微塑料等的环境行为、生态效应和风险 控制成为研究热点。
国际合作与交流
全球环境问题需要加强国际合作与交流,共同应对挑战。
未来发展方向预测
01
绿色化学与可持续发展
自20世纪70年代以来,环境化学逐渐 成为一个独立的学科领域,随着环境 问题日益严重,环境化学的研究和应 用也越来越受到重视。
环境化学研究内容
01
02
03
04
环境中化学物质的来源、分布 和归宿
化学物质在环境中的迁移、转 化和降解过程
化学物质对生物和生态系统的 毒性效应和风险评估
环境污染的监测、治理和修复 技术
生物转化
土壤中的微生物、植物根系等生物因素会对污染 物进行降解、转化或吸收。生物转化是土壤中污 染物去除的重要途径之一。
05
生物体内污染物质运输与转化
生物体内污染物质来源及危害
工业排放
废气、废水和固体废弃物中的 重金属、有机物等污染物,通
过食物链进入生物体内。
农业活动
农药、化肥的过度使用,导致 土壤、水源污染,进而影响生 物体。
2024年环境化学(带)

环境化学(带附件)环境化学是一门研究化学物质在环境中的存在、迁移、转化、归趋和影响的科学。
它是环境科学与化学的交叉学科,旨在揭示化学物质与环境的相互作用规律,为环境保护和污染控制提供科学依据。
本文将从环境化学的定义、研究内容、研究方法和发展趋势等方面进行阐述。
一、环境化学的定义环境化学是研究化学物质在环境中的行为、效应及其与环境相互作用的科学。
它关注化学物质在空气、水、土壤、生物等环境介质中的分布、迁移、转化、降解和生物可利用性等方面。
环境化学的研究对象包括自然环境中存在的化学物质和人类活动排放的化学物质。
二、环境化学的研究内容1.环境分析化学:研究环境中化学物质的检测、测定和监控方法,为环境化学研究提供数据支持。
2.环境污染化学:研究污染物的来源、排放、迁移、转化和归宿,探讨污染物的环境行为和生态效应。
3.环境生物化学:研究生物体与化学物质相互作用的规律,探讨化学物质对生物体的毒性、代谢和生物降解等过程。
4.环境催化化学:研究催化剂在环境污染物降解和资源化中的作用,为环境污染控制提供技术支持。
5.环境地球化学:研究地球表层环境中化学元素的分布、迁移和循环,探讨化学物质在地质历史演变中的作用。
6.环境化学污染控制:研究化学污染物的治理技术、政策和法规,为环境管理提供科学依据。
三、环境化学的研究方法1.采样与分析方法:采用现场采样、实验室分析和仪器检测等技术,获取化学物质在环境中的浓度、形态和分布等数据。
2.模型模拟方法:建立数学模型,模拟化学物质在环境中的迁移、转化和归趋过程,预测污染物的影响范围和程度。
3.实验室模拟方法:通过实验室模拟环境条件,研究化学物质的环境行为和生物效应。
4.现场监测方法:利用遥感、传感器等技术,实时监测环境中化学物质的浓度和分布。
5.联合研究方法:结合多种研究手段,从不同角度探讨化学物质与环境相互作用的过程和机制。
四、环境化学的发展趋势1.环境纳米化学:研究纳米材料在环境化学污染控制中的应用,探讨纳米技术在环境保护领域的潜力。
《环境化学课件》PPT课件

水体污染
工业废水、生活污水等 排放到水体中的污染物 ,通过饮水和食物链进
入生物体。
土壤污染
农药、重金属等污染物 在土壤中积累,通过食
物链进入生物体。
其他途径
包括食物摄入、皮肤接 触等途径,使污染物进
入生物体。
生物体内污染物质转化与排泄机制
01
生物转化
生物体内的酶系统可将污染物转化为低毒或无毒的代谢产物,如肝脏中
化学法
包括中和、氧化还原、电解和混凝等。
生物法
利用微生物的代谢作用,将有机物转化为无害物质,包括活性污泥 法、生物膜法和厌氧生物处理法等。
土壤污染治理技术与方法
物理化学修复技术
包括土壤淋洗、土壤固化/稳定化、热脱附和电动 修复等。
生物修复技术
利用微生物或植物对土壤中的污染物进行降解、 转化或固定,包括微生物修复和植物修复等。
REPORT
《环境化学课件》 PPT课件
CATALOG
DATE
ANALYSIS
SUMMARY
目录
CONTENTS
• 环境化学概述 • 大气环境化学 • 水环境化学 • 土壤环境化学 • 生物体内污染物质运动过程及毒性效
应 • 环境污染治理技术与方法
REPORT
CATALOG
DATE
ANALYSIS
危害
影响水生生物生存、破坏水生态平衡、危害人类健康等。
水环境化学原理
1 2
水中的化学反应
酸碱反应、沉淀溶解反应、氧化还原反应等。
水质指标与标准
pH值、溶解氧、化学需氧量、生物需氧量等。
3
水处理原理与技术
物理处理、化学处理、生物处理等。
REPORT
(完整版)环境化学.ppt

0.0
27
环境化学
4.2 各圈层环境化学的发展方向
土壤环境化学:有机物污染物(如农药) 在土壤中的吸附、降解过程机制,土壤 环境复合污染问题,以及污染土壤修复 的化学基础等。
0.0
28
环境化学
4.3 污染控制化学的发展方向
从末端污染控制模式转向全过程控制模 式,提倡污染预防(pollution prevention),清洁生产(cleaner production),循环经济(circular economy)和绿色化学(green chemistry) 。
0.0
25
环境化学
1943年,美国洛杉矶第一次出现,所以光化学烟雾也 称为洛杉矶烟雾,呈蓝色,具强氧化性,能使橡胶开 裂,刺激人的眼睛,伤害植物的叶子,使大气能见度 降低。
含有氮氧化物和碳氢化合物等一次污染物的大气,在 阳光照射下发生光化学反应而产生二次污染物,这种 一次污染物和二次污染物(如臭氧,醛等)的混合物 所形成的烟雾污染现象,称为光化学烟雾。
(2)农业:主要是农药、化肥、农业废弃物等。 (3)交通运输:主要是噪声、汽油(柴油)等燃料
燃烧产生的有毒有害气体。 (4)生活:主要是生活污水和垃圾。
0.0
34
环境污染物
3. 化学污染物的分类
(1)元素:重金属和准金属、卤素、臭氧、黄磷等。 (2)无机物:氰化物、一氧化碳、氮氧化物、卤化物、无
【其它】对环境问题的认识过程;环境 化学的任务、内容和特点;环境污染物 和化学污染物的分类及组成;环境污染
物在环境各圈层的迁移转化过程
0.0
本 章 重 点
5
第一节 环境化学 环境问题 环境化学
0.0
6
2006年十大环境事件之一