微波遥感简介(英文)
航天遥感专业英语(中英文对照)
航天遥感专业英语(中英文对照)遥感remote sensing资源与环境遥感remote sensing of natural resources and environment 主动式遥感active remote sensing被动式遥感passive remote sensing多谱段遥感multispectral remote sensing多时相遥感multitemporal remote sensing红外遥感infrared remote sensing微波遥感microwave remote sensing太阳辐射波谱solar radiation spectrum大气窗atmospheric window大气透过率atmospheric transmissivity大气噪声atmospheric noise大气传输特性characteristic of atmospheric transmission波谱特征曲线spectrum character curve波谱响应曲线spectrum response curve波谱特征空间spectrum feature space波谱集群spectrum cluster红外波谱infrared spectrum反射波谱reflectance spectrum电磁波谱electro-magnetic spectrum功率谱power spectrum地物波谱特性object spectrum characteristic热辐射thermal radiation微波辐射microwave radiation数据获取data acquisition数据传输data transmission数据处理data processing地面接收站ground receiving station数字磁带digital tape模拟磁带analog tape计算机兼容磁带computer compatible tape,CCT高密度数字磁带high density digital tape,HDDT图象复原image restoration模糊影象fuzzy image卫星像片图satellite photo map红外图象infrared imagery热红外图象thermal infrared imagery,thermal IR imagery微波图象microwave imagery成象雷达imaging radar熵编码entropy coding冗余码redundant code冗余信息redundant information信息量contents of information信息提取information extraction月球轨道飞行器lunar orbiter空间实验室Spacelab航天飞机space shuttle陆地卫星Landsat海洋卫星Seasat测图卫星Mapsat立体卫星Stereosat礼炮号航天站Salyut space station联盟号宇宙飞船Soyuz spacecraftSPOT卫星SPOT satellite,systeme pro batoire d’observation de la terse(法)地球资源卫星earth resources technology satellite,ERTS环境探测卫星environmental survey satellite地球同步卫星geo-synchronous satellite太阳同步卫星sun-synchronous satellite卫星姿态satellite attitude遥感平台remote sensing platform主动式传感器active sensor被动式传感器passive sensor推扫式传感器push-broom sensor静态传感器static sensor动态传感器dynamic sensor光学传感器optical sensor微波传感器microwave remote sensor光电传感器photoelectric sensor辐射传感器radiation sensor星载传感器satellite-borne sensor机载传感器airborne sensor姿态测量传感器attitude-measuring sensor 探测器detector摄谱仪spectrograph航空摄谱仪aerial spectrograph波谱测定仪spectrometer地面摄谱仪terrestrial spectrograPh测距雷达range-only radar微波辐射计microwave radiometer红外辐射计infrared radiometer侧视雷达side-looking radar, SLR真实孔径雷达real-aperture radar合成孔径雷达synthetic aperture radar,SAR 专题测图传感器thematic mapper,TM 红外扫描仪infrared scanner多谱段扫描仪multispectral scanner.MSS 数字图象处理digital image processing光学图象处理optical image processing实时处理real-time processing地面实况ground truth几何校正geometric correction辐射校正radiometric correction数字滤波digital filtering图象几何配准geometric registration of imagery图象几何纠正geometric rectification of imagery 图象镶嵌image mosaic图象数字化image digitisation彩色合成仪additive colir viewer假彩色合成false color composite直接法纠正direct scheme of digital rectification间接法纠正indirect scheme of digital rectification 图象识别image recognition图象编码image coding彩色编码color coding多时相分析multitemporal analysis彩色坐标系color coordinate system图象分割image segmentation图象复合image overlaying图象描述image description二值图象binary image直方图均衡histogram equalization直方图规格化histogram specification图象变换image transformation彩色变换color transformation伪彩色pseudo-color假彩色false color主分量变换principal component transformation 阿达马变换Hadamard transformation沃尔什变换Walsh transformation比值变换ratio transformation生物量指标变换biomass index transformation 穗帽变换tesseled cap transformation参照数据reference data图象增强image enhancement边缘增强edge enhancement边缘检测edge detection反差增强contrast enhancement纹理增强texture enhancement比例增强ratio enhancement纹理分析texture analysis彩色增强color enhancement模式识别pattern recognition特征feature特征提取feature extraction特征选择feature selection特征编码feature coding距离判决函数distance decision function概率判决函数probability decision function模式分析pattern analysis分类器classifier监督分类supervised classification非监督分类unsupervised classification盒式分类法box classifier method模糊分类法fuzzy classifier method最大似然分类maximum likelihood classification 最小距离分类minimum distance classification 贝叶斯分类Bayesian classification机助分类computer-assisted classification 图象分析image analysis。
遥感介绍英文作文高中
遥感介绍英文作文高中英文:Remote sensing is a fascinating technology that allows us to gather information about the Earth's surface and atmosphere from a distance. It involves the use of sensors, such as cameras and radar, to capture data about the environment. This data can then be processed and analyzed to provide valuable insights into a wide range of applications, from agriculture and forestry to weather forecasting and disaster management.One of the key benefits of remote sensing is itsability to provide information about large areas of the Earth's surface quickly and efficiently. For example, satellite imagery can be used to monitor the health of crops across an entire region, or to track the movement of a hurricane across the ocean. This information can then be used to make informed decisions about how to manage resources, respond to emergencies, or plan for futuredevelopment.Another advantage of remote sensing is its ability to provide information about areas that are difficult or dangerous to access. For example, remote sensing can be used to monitor the health of forests in remote or mountainous areas, or to track the movement of glaciers in polar regions. This information can then be used to inform conservation efforts, or to better understand the impacts of climate change on these sensitive ecosystems.Overall, remote sensing is a powerful tool for understanding our planet and making informed decisions about how to manage it. Whether you're a scientist, a farmer, or a policy maker, remote sensing can provide valuable insights into the complex systems that make up our world.中文:遥感技术是一项令人着迷的技术,它可以从远处收集有关地球表面和大气的信息。
微波遥感2

主要内容 • • • • 简介 天线 被动微波传感器 主动微波传感器
2.1 简介
In the microwave region the wavelength is often similar to that of major scatterers in the medium, and we can make physical models for their interactions. This helps in the understanding of the interactions and means that we are not primarily dependent on statistical aspects, which is often the case in the optical regime. This is the reason why models for electromagnetic waves and medium interactions are so important for microwave remote sensing.
350 100 200 400 1,000 3,000
75 x 43 51 x 29 27 x 16 32 x 18 14 x 8 6x4
JERS-1 日本
TMI (TRMM Microwave Imager) 热带降雨测量任务(Tropical Rainfall Measuring Mission)微波成像仪 WindSat
• 微波辐射计在海洋卫星上用来遥感海表面温度、海表面风速和风向
(sea surface wind vector)、海面上空水汽含量、降水率(total
column precipitable water vapor)等,在飞机上用来遥感海表面温度、 海表面盐度(sea surface salinity)等。
航天遥感专业英语
航天遥感专业英语(中英文对照)遥感remote sensing资源与环境遥感remote sensing of natural resources and environment 主动式遥感active remote sensing被动式遥感passive remote sensing多谱段遥感multispectral remote sensing多时相遥感multitemporal remote sensing红外遥感infrared remote sensing微波遥感microwave remote sensing太阳辐射波谱solar radiation spectrum大气窗atmospheric window大气透过率atmospheric transmissivity大气噪声atmospheric noise大气传输特性characteristic of atmospheric transmission波谱特征曲线spectrum character curve波谱响应曲线spectrum response curve波谱特征空间spectrum feature space波谱集群spectrum cluster红外波谱infrared spectrum反射波谱reflectance spectrum电磁波谱electro-magnetic spectrum功率谱power spectrum地物波谱特性object spectrum characteristic热辐射thermal radiation微波辐射microwave radiation数据获取data acquisition数据传输data transmission数据处理data processing地面接收站ground receiving station数字磁带digital tape模拟磁带analog tape计算机兼容磁带computer compatible tape,CCT高密度数字磁带high density digital tape,HDDT图象复原image restoration模糊影象fuzzy image卫星像片图satellite photo map红外图象infrared imagery热红外图象thermal infrared imagery,thermal IR imagery微波图象microwave imagery成象雷达imaging radar熵编码entropy coding冗余码redundant code冗余信息redundant information信息量contents of information信息提取information extraction月球轨道飞行器lunar orbiter空间实验室Spacelab航天飞机space shuttle陆地卫星Landsat海洋卫星Seasat测图卫星Mapsat立体卫星Stereosat礼炮号航天站Salyut space station联盟号宇宙飞船Soyuz spacecraftSPOT卫星SPOT satellite,systeme pro batoire d’observation de la terse(法)地球资源卫星earth resources technology satellite,ERTS环境探测卫星environmental survey satellite地球同步卫星geo-synchronous satellite太阳同步卫星sun-synchronous satellite卫星姿态satellite attitude遥感平台remote sensing platform主动式传感器active sensor被动式传感器passive sensor推扫式传感器push-broom sensor静态传感器static sensor动态传感器dynamic sensor光学传感器optical sensor微波传感器microwave remote sensor光电传感器photoelectric sensor辐射传感器radiation sensor星载传感器satellite-borne sensor机载传感器airborne sensor姿态测量传感器attitude-measuring sensor探测器detector摄谱仪spectrograph航空摄谱仪aerial spectrograph波谱测定仪spectrometer地面摄谱仪terrestrial spectrograPh测距雷达range-only radar微波辐射计microwave radiometer红外辐射计infrared radiometer侧视雷达side-looking radar, SLR真实孔径雷达real-aperture radar合成孔径雷达synthetic aperture radar,SAR专题测图传感器thematic mapper,TM红外扫描仪infrared scanner多谱段扫描仪multispectral scanner.MSS数字图象处理digital image processing光学图象处理optical image processing实时处理real-time processing地面实况ground truth几何校正geometric correction辐射校正radiometric correction数字滤波digital filtering图象几何配准geometric registration of imagery 图象几何纠正geometric rectification of imagery 图象镶嵌image mosaic图象数字化image digitisation彩色合成仪additive colir viewer假彩色合成false color composite直接法纠正direct scheme of digital rectification 间接法纠正indirect scheme of digital rectification 图象识别image recognition图象编码image coding彩色编码color coding多时相分析multitemporal analysis彩色坐标系color coordinate system图象分割image segmentation图象复合image overlaying图象描述image description二值图象binary image直方图均衡histogram equalization直方图规格化histogram specification图象变换image transformation彩色变换color transformation伪彩色pseudo-color假彩色false color主分量变换principal component transformation 阿达马变换Hadamard transformation沃尔什变换Walsh transformation比值变换ratio transformation生物量指标变换biomass index transformation 穗帽变换tesseled cap transformation参照数据reference data图象增强image enhancement边缘增强edge enhancement边缘检测edge detection反差增强contrast enhancement纹理增强texture enhancement比例增强ratio enhancement纹理分析texture analysis彩色增强color enhancement模式识别pattern recognition特征feature特征提取feature extraction特征选择feature selection特征编码feature coding距离判决函数distance decision function概率判决函数probability decision function模式分析pattern analysis分类器classifier监督分类supervised classification非监督分类unsupervised classification盒式分类法box classifier method模糊分类法fuzzy classifier method最大似然分类maximum likelihood classification 最小距离分类minimum distance classification 贝叶斯分类Bayesian classification机助分类computer-assisted classification图象分析image analysis。
第三章微波遥感
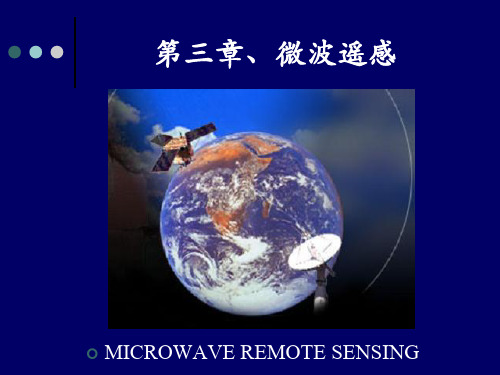
雷达波束与竖直方 向所夹的入射角 发射雷达脉冲投影 到海表面的长度
从卫星到观测 区域的距离
合成孔径雷达的方位分辨率:
卫星在整个采样时间 内移动的距离
2
合成孔径雷达平台的要求: 平台的姿态及速度要非常稳定。
重点:1、分析微波和热红外辐射的异同。 2、微波遥感的优点和不足。 3、微波与大气的作用有什么规律?这些规律 对微波波段遥感有哪些重要意义? 4、名词解释:天线增益、有效孔径、辐射方 向图。
重点: 1、写出雷达方程并说明雷达方程提供了哪些信
息?
2、说明合成孔径雷达的工作过程。
3、名词解释:多普勒频率、雷达的距离分辨率、 方位分辨率
应用:广泛用于微波辐射计、高度计、散射计等。
相控阵天线
由多个单元天线组合构成,分为线性阵列、平面 阵列、曲面阵列。
相控阵天线主要应用:合成孔径雷达。
相控阵天线的优点: (1)适用于多目标、多方向监测 ; (2)功能多,机动性强; (3)反应时间短、数据率高; (4)抗干扰能力强;可靠性高
不存在!!
各向同性天线: 在各方向上辐射的能量相同的天线。
天线增益:
天线增益表示为某一天线与标准天线都得到同样功 率时在同一方向上的功率密度之比。是描述一副天线将 能量聚集于一个窄的角度范围(方向性波束)的能力的一 个量。
方向性增益: 也常称做方向性系数,指最大辐射强度(每立体 弧度内的瓦数)与平均辐射强度之比。就是指实际的 最大辐射功率密度比辐射功率为各向同性分布时的 功率密度强的倍数。
波的干涉
1.波的干涉现象
频率相同、振动方向相同、有恒定的相位差的两列 波(或多列波)相遇时,在介质中某些位置的点振 幅始终最大,另一些位置振幅始终最小,而其它位 置,振动的强弱介乎二者之间,保持不变。称这种 稳定的叠加图样为干涉现象。
微波遥感翻译
英文题目:DEM generation using ASAR (ENVISAT) for addressing the lack of freshwater翻译人:(班级)064082-06翻译文章的作者:李杰老师:许丽娜作者的单位:加拉帕戈斯群岛:水资源综合研究中心作者主页:/locate/rse发表的刊物:N. d'Ozouville et al. / Remote Sensing of Environment 112 (2008) 4131-4147文章赞助来源:Noémi d'Ozouville under the Young Graduate Trainee program and New Opportunities forWomen (2003–2004); “Fondation de France,” “Naturalia &Biologia,” Schlumberger Foundation, Schlumberger SEED program, “Fondation d'Entreprise Veolia Environnement” for funding of the project; and “La Chancellerie des Universités de Paris”参考文献:Adelinet, M., Fortin, J., d'Ozouville, N., & Violette, S., (2007). The relationship betweenhydrodynamic properties and weathering of soils derived from volcanic rocks -Galapagos Islands (Ecuador). Environmental Geology.doi:10.1007/s00254-007-1138-3.Amelung, F., Jonsson, S., Zebker, H., & Segall, P. (2000). Widespread uplift and ‘trapdoor’faulting on Galapagos volcanoes observed with radar interferometry.Nature, 407,993−996.Bamler, R. (1997). Digital Terrain Models from radar interferometry. In Fritsch, &Hobbie (Eds.), Photogrammetric Week 1997 (pp. 93−105).Berry, P., Garlick, J., & Smith, R. (2007). Near-global validation of the SRTM DEM usingsatellite radar altimetry. Remote Sensing of Environment, 106, 17−27. Bourgine, B., & Baghdadi, N. (2005). Assessment of C-band SRTM DEM in a denseequatorial forest zone. Comptes Rendus Géoscience, 337, 1225−1234.Bow, C. (1979). The geology and petrogeneses of the lavas of Floreana and Santa CruzIslands: Galapagos Archipelago. Ph.D. thesis, University of Oregon, Eugene, USA,308pp.Charleux-Demagne, J. 2001. Qualité des modèles numériques de terrain pourl'hydrologie. Application à la caractérisation du régime de crues desbassinsversants. Ph.D. thesis, Univ. Marne-La-Vallée (France), Sciencesdel'InformationGéographique. 350 p.Crosetto, M. (2002). Calibration and validation of SAR interferometry for DEMgeneration. ISPRS Journal of Photogrammetry & Remote Sensing, 57,213−227.Crosetto, M., & Perez Aragues, F. (1999). Radargrammetry and SAR interferometry forDEM generation: Validation and data fusion. CEOS SAR Workshop,ESA-CNES,Toulouse, 26–29 October 1999 (http://www.estec.esa.nl/ceos99/)Darwin, C., 1859. On the origin of species by means of natural selection, or thepreservation of favoured races in the struggle for life. Published online atThecomplete work of Charles Darwin online (/)d'Ozouville, N. (2007). Etude du fonctionnement hydrologique dans les îles Galápagos:caractérisation d'un milieu volcanique insulaire et préalable a la gestion de laressource. Ph.D. thesis, Univ. Paris 6 Pierre et Marie Curie (France), Sciences de laTerre, Hydrogéologie. 471 pp.d'Ozouville, N., & Merlen, G. (2007). Agua Dulce o la supervivencia en Galápagos. InP.Ospina & C. y Falconí (Eds.), Galápagos: Migraciones, economía, cultura, conflictos yacuerdos. Biblioteca de Ciencias Sociales, 57. Universidad Andina Simón Bolivar, SedeEcuador; Programa de Naciones Unidas para el Desarrollo (pp. 297−313).CorporaciónEditora Nacional, Quito.Eliasson, U. (1984). Chapter 7: Native climax forest. In R. Perry (Ed.), Key environments:Galapagos (pp. 101−115). Bergamon Press.Endreny, T., & Wood, E. (2001). Representing elevation uncertainty in runoff modelingand flowpath mapping. Hydrological Processes, 15, 2223−2236.Endreny, T.,Wood, E., & Lettenmaier, D. (2000). Satellite derived digital elevation modelaccuracy: hydrological modeling requirements. Hydrological Processes, 14(2),177−194.Falorni,G.,Teles,V., Vivoni, E., Bras,R.,&Amartunga,K. (2005).Analysis and characterizationof the vertical accuracy of digital elevation models from Shuttle Radar TopographyMission. Journal of Geophysical Research, 110,doi:10.1029/2003JF000113Fundacion Charles Darwin, Servicio Parque Nacional Galapagos, of New Mexico, U(2004). (/herpetology/research. Data generated byFundacionCharles Darwin, Servicio Parque Nacional Galapagos and University of NewMexico).Garbrecht, J., & Martz, L. (1994). Grid size dependency of parameters extracted fromdigital elevation models. Computers and Geoscience, 20, 85−87.Garbrecht, J., & Martz, L. (1997). The assignment of drainage direction over flat surfacesin raster digital elevation models. Journal of Hydrology, 193, 204−213.Garbrecht, J., & Martz, L. (1999). DEM issues inwater resources modeling. Proceedings ofESRI User Conference, 1999.Gelautz, M., Paillou, P., Chen, C., & Zebker, H. (2003). Radar stereo and interferometryderived digital elevation models: Comparison and combination using Radarsat andERS-2 imagery. International Journal of Remote Sensing, 24,5243−5264.Gorokhovich, Y., & Voustianiouk, A. (2006). Accuracy assessment of the processedSRTM-based elevation data by CGIAR using field data from USA and Thailand and itsrelation to the terrain characteristics. Remote Sensing ofEnvironment, 104, 409−415.Guth, P. (2006). Geomorphometry from SRTM: Comparison to NED.PhotogrammetryEngineering & Remote Sensing. Journal of the American Society for Photogrammetryand Remote Sensing, 72.Grohmann, H. C., Riccomini, C., & Machado Alves, F. (2007). SRTM-based morphotectonicanalysis of the Poços de Caldas Alkaline Massif, southeastern Brazil.Computers& Geoscience, 33, 10−19.Hensley, S., Rosen, P., & Zebker, H. (1994). Generation of high resolution topographicmaps of the Galapagos Islands using TOPSAR data. Geoscience and Remote SensingSymposium, IGARSS 1994. Surface and Atmospheric Remote Sensing Technologies, DataAnalysis and Interpretation. Vol. 2. pp. 704–706.Hirano, A., Welch, R., & Lang, H. (2003). Mapping from ASTER stereo image data: DEMvalidation and accuracy assessment. ISPRS Journal of Photogrammetry & RemoteSensing, 57, 356−370.Hodgson, R., Jensen, J., Schmidt, L., Schill, S., & Davis, B. (2003). An evaluation of LIDARandIFSAR-derived digital elevation models in leaf-on conditions with USGS Level 1and Level 2 DEMs. Remote Sensing of Environment, 84, 295−308. Holzner, J., Eineder, M., & Schattler, B. (2002). First analysis of Envisat/ASAR image modeproducts for interferometry. Proceedings of the Envisat Calibration Review, SpecialPublication SP-520, 9–13 September 2002, ESTEC, Noordwijk, TheNetherlands (http://envisat.esa.int/calval/proceedings)Huttel, C. (1995). Vegetación en coladas de lava, Islas Galápagos, Ecuador. Quito, Ecuador-ORSTOM: Fundacion Charles Darwin 178pp.Ingala, Pronareg, & Orstom (Eds.). (1989). Inventario cartográfico de los recursosnaturales, geomorfología, vegetación, híídricos, ecológicos y biofísicos de las IslasGalápagos, Ecuador. Ingala (pp.159). Quito, Ecuador.Ingala (2002). Plan Regional para la Conservación y el Desarrollo Sustentable de Galápagos.Tech. rep., Instituto Nacional Galápagos.Jensen, S. K., & Domingue, J. O. (1998). Extracting topographic structure from digitalelevation data for geographic information systemanalysis.PhotogrammetricEngineering and Remote Sensing, 54, 1593−1600.Kenward, T., Lettenmaier, D., & Wood, E. E. F. (2000). Effects of digital elevation modelaccuracy on hydrological predictions. Remote Sensing of Environment, 74(2), 432−444.Kervyn, F. (2001). Modelling topography with SAR interferometry: Illustrations of afavourable and less favourable environment. Computer & Geoscience, 27,1039−1050.Kooij van der, M., Armour, B., Ehrismann, J., McConnell, P., Lynch, B., & Nazarho,D.(1999). SAR repeat pass interferometry —Operational accomplishments andfuturepotential. 21st CSRS/4th Airborne RS Conference, Ottawa, Canada, 21–24 June 1999.Ludwig, R., & Schneider, P. (2006). Validation of digital elevation models from SRTM XSARfor applications in hydrologic modeling. ISPRS Journal of Photogrammetry andRemote Sensing, 60, 339−358.Marinelli, L., Toutin, T., & Dowman, I. (1997). Génération de MNT par radargrammétrie:Etat de l'art et perspectives. Bulletin de la Société Française de PhotogrammétrieTélédetection, 148, 89−95.Martz, L.,&Garbrecht, J. (1992).Numerical definitionof drainagenetwork andsubcatchmentareas from Digital Elevation Models. Computers & Geosciences, 18, 747−761.Meisels, A., Raizman, S., & Karnieli, A. (1995). Skeletonizing a DEM into drainagenetworks. Computers & Geosciences, 21, 187−196.Navarro Latorre, J., Soler Liceras, C., & Jimenez Suarez, J. (1991). Bases para un PlanHidrologico del Archipielago de Galápagos —Republica de Ecuador. Tech.rep.,Gobierno Autonomo de Canarias and Consejeria de Obras Publicas Vivienda y Aguas,Direccion General de Aguas.Parcharidis, I., Sakkas, V., Ganas, A., & Katopodii, A. (2002). A production of DigitalElevation Model (D.E.M.) by means of SAR tandem images in a volcanic landscapeand its quality assessment. 6th Pan-Hellenic Geographical Congress, Thessalonik,volume II pp. 201–207.Rabus, B., Eineder, M., Roth, A., & Bamler, R. (2003). The shuttle radar topographymission —A new class of digital elevation models acquired byspaceborne radar.ISPRS Journal of Photogrammetry & Remote Sensing, 57,241−262.Rocca, F., Prati, C.,&Ferretti, A. (1997).Overviewof SAR interferometry. 3rd ERS Symposium,14–21 March 1997 (opening speech —http://earth.esa.int/symposia/program-details/speeches/rocca-et-al/. Opening speech 3rd ERS Symposium, 14–21 March 1997.Rodgriguez, E., Morris, C., & Belz, J. (2006). A global assessment of SRTM performance.Photogrammetric Engineering and Remote Sensing, 72, 249−260.Rosen, P., Hensley, S., Joughin, I., Li, F., Madsen, S., Rodriguez, E., & Goldstein, R.(2000).Synthetic aperture radar interferometry. Proceedings of the IEEE, 88, 333−379.Roth, A., Knopfle, W., Strunz, G., Lehner, M., & Reinartz, P. (2002). Towards a globalelevation product: Combination of multi-source digital elevation models.Symposiumon Geospatial Theory, Processing and Applications, Ottawa, 2002.Smith, D. P., & Atkinson, S. F. (2001). Accuracy of rectification using topographic mapversus GPS ground control points. Photogrammetric Engineering & Remote Sensing,67(5), 585−587.Snell, H., & Rea, S. (1999). The 1997–1998 El Niño in Galapagos: Can 34 years of dataestimate 120 years of pattern? Noticias de Galápagos, 60.Souris,M., 2001. http://rslultra.star.ait.ac.th/souris/ecuador.htm. Data available onwebsite.Stevens, N., Garbeil, H., & Mouginis-Mark, P. (2004). NASA EOS Terra ASTER: Volcanictopographic mapping and capability. Remote Sensing of Environment, 90, 405−414.Thornwaite, C. (1946). An approach towards a rational classification of climate.GeographyReview, 38, 55−89.Toutin, T. (1999). Error tracking of radargrammetric DEM from RADARSAT images.IEEETransactions on Geoscience and Remote Sensing, 37(5), 2227−2238.Toutin, T. (2000). Evaluation of radargrammetric DEM from RADARSAT images in highrelief areas. IEEE Transactions on Geoscience and Remote Sensing, 38(2), 782−789.Toutin, T. (2002). Impact of terrain slope and aspect on radargrammetric DEM accuracy.ISPRS Journal of Photogrammetry and Remote Sensing, 57, 228−240. Toutin, T., & Gray, L. (2000). State-of-the-art of elevation extraction from satellite SARdata. ISPRS Journal of Photogrammetry and Remote Sensing, 55, 13−33.Valeriano, M. M., Kuplich, T. M., Storino, M., Amaral, B. D., Mendes, J. N. J., & Lima, D.J.(2006). Modelling small watersheds in Brazilian Amazonia with shuttleradartopographic mission-90 m data. Computers & Geoscience, 32, 1169−1181.Walker, A.,Muller, J. -P.,Morley, J., Smith, A., & Naden, P. (1999).Multi-pass interferometricSARDEMs for hydrological network derivation. In E. P. Division (Ed.), Proceedings Fringe'99 Workshop: Advancing ERS SAR Interferometry fromApplications towards Operations,10–12 November 1999, Liège, Belgium. Vol. ESA SP-478.Walker, J., & Willgoose, G. (1999). On the effect of digital elevation model accuracy onhydrology and geomorphology. Water Resources Research, 35(7), 2259−2268. Wang, X., & Yin, Z. -Y. (1998). A comparison of drainage networks derived from digitalelevation models at two scales. Journal of Hydrology, 210, 221−241. Wechsler, S., (2000). Effect of DEM Uncertainty on Topographic Parameters, DEM Scaleand Terrain Evaluation. Ph.D. thesis, Sate Univeristy of New York, Syracuse, NewYork. 380pp.Wegmüller, U. (1999). Automated terrain corrected SAR geocoding. Proceedings ofIGARSS'99, Hamburg, 28 June – 2 July 1999.Wegmüller, U., Werner, C., Wiesmann, A., & Strozzi, T. (2003). Radargrammetry andspace triangulation for DEM generation and image ortho-rectification.Proceedingsof IGARSS'03, Toulouse, France, 21–25 July 2003.Werner, C., Wegmüller, U., Strozzi, T., & Wiesmann, A. (2005). Precision estimation oflocal offsets between SAR SLCs and detected SAR images. Proceedings ofIGARSS '05,Seoul, Korea, 25–29 July 2005.Wise, S. (2000). Assessing the quality of hydrological applications of digital elevationmodels derived from contours. Hydrological Processes, 14,1909−1929. Won, J. -H., Lee, J. -Y., & Kim, J. -W. (2006). Groundwater occurrence on Jeju Island, Korea.Hydrogeology Journal, 14, 532−547.Wright, R., Garbeil, H., Baloga, S., & Mouginis-Mark, P. (2006). An assessment of shuttleradar topography mission digital elevation data for studies of volcanomorphology.Remote Sensing of Environment, 105, 41−53.Zebker, H., Werner, C., Rosen, P., & Hensley, S. (1994). Accuracy of topographic mapderived from ERS-1 interferometry radar. IEEE Transactions on Geoscience andRemote Sensing, 32, 823−836.Abstracts(文摘):低浮雕海洋岛屿往往苦于缺乏淡水资源。
遥感技术的英文名词解释
遥感技术的英文名词解释遥感技术,又称为遥测遥感技术(Remote sensing),是一种利用空间传感器获取目标信息的技术手段。
通过遥感技术,可以获取到地球表面的各种信息,包括地形地貌、气候变化、土地利用、植被覆盖等等。
在现代科技的推动下,遥感技术已经成为地质勘探、环境保护、资源监测和农业发展等领域中的重要工具。
遥感技术在传感器技术、信号处理和数据分析等多个学科领域中发展起来。
传感器是遥感技术最重要的组成部分,它能够将电磁辐射转换为可用的数量信号。
常见的遥感传感器包括光电传感器、微波传感器和激光雷达传感器。
这些传感器能够通过不同的波长范围、方向性和分辨率等特性,获取到不同类型的目标信息。
光电传感器通常使用摄像机或者卫星上的成像设备,通过接收来自地球表面的反射光,获取到目标的光谱、形状和纹理等特征。
这些特征可以用来研究地球表面的物理和化学性质,例如植被的生长状态和海洋的温度变化等。
而微波传感器则利用微波辐射穿透云层和气体,获取地表的微波信号。
微波传感器可以穿透云层和烟雾等干扰,因此在大气变化监测和天气预警等方面具有独特优势。
此外,微波传感器还能够探测地下水和岩土结构,广泛用于地质勘探和城市规划等领域。
激光雷达传感器则利用激光束扫描地表,通过测量激光的回波时间和强度,获取地表表面的高程、形状和结构等信息。
激光雷达传感器具有高精度和高分辨率的特点,在数字地形模型(DTM)和三维城市建模等方面有着广泛应用。
除了传感器,信号处理和数据分析是遥感技术中不可或缺的环节。
信号处理的目的是提取感兴趣的信息,去除噪音和干扰,并提高图像的质量。
数据分析则进一步处理和解释图像数据,以生成有关地球表面的量化和定量信息。
数据分析方法包括图像分类、特征提取、变化检测和时序分析等。
遥感技术在现代社会中发挥着重要的作用。
首先,在资源监测和环境保护方面,遥感技术能够提供大面积、全时空尺度下的数据和信息,用于研究和评估自然资源的利用和保护情况。
微波遥感
遥感微波遥感分类被动微波遥感,主动微波遥感被动微波遥感信号来源:系统自身不发射微波波束,只是接收目标物发射或散射的微波辐射(用亮温表示).典型传感器:传感器一般为微波辐射计,辐射精度目前约1K,空间分辨率一般都在公里级(卫星遥感)或米级(航空遥感) .微波遥感分类主动微波遥感信号来源:系统自身发射微波辐射,并接收从目标反射或散射回来的电磁波.构成:一部发射机,一部接收机,通常共用一幅天线.典型传感器:高度计,散射计和成像雷达.高度计和散射计的空间分辨率较粗.雷达(Radar - Radio Detection and Ranging)微波遥感波段微波遥感波段:300MHz到300GHz(波长从1mm到1m) 被无线电界划分为:甚高频(VHF),特高频(UHF),超高频(SHF)和极高频(EHF).微波遥感波段5.75—10.90X56.0—100W4.20—5.75C46.0—56.0V1.550—4.20S36.0—46.0Q0.390—1.550L10.90—36.0K0.225—0.390P频率区间(GHz)波段名称频率区间(GHz)波段名称微波遥感波段地球资源应用中的常用波段:X, C,L波长增加,穿透能力增加.在晴朗天气状况下,大气对于波长小于30mm的微波略有衰减.随波长减小,衰减增大.波长小于10mm时,暴雨呈现强反射(用到了机载天气探测雷达系统)微波遥感波段ERS及RADARSAT利用C波段,日本的JERS利用L波段.C 波段可以用来对海洋及海冰进行成像,而L波段可以更深地穿透植被,所以在林业及植被研究中更有用.较长的波长可以穿透的更深,在冠层,树干及土壤间发生多次散射.微波遥感极化极化:电波的振动仅在单一平面水平极化:电场振动方向平行于水平面("H"极化)垂直极化:电场振动方向垂直于水平面("V"极化)微波遥感极化HH or VV imagery are referred to as 'like-polarised';HV or VH are 'cross-polarised'.与地表发生作用后,极化状态可能改变.背向散射通常为两种极化的混合.传感器可以设计成只探测H或V极化的背向散射.依据发射的及接收的极化的差别,可以有四种组合:HH,VV,HV,VH地物的微波辐射地物的微波发射热扫描波段8-14 m300K黑体辐射曲线1 m10 m100 m1000 m1000mm被动微波光谱辐射波长(λ)地物的微波辐射传感器所接收的被动微波信号由很多来源的信号(发射的,反射的和透射的)所组成1 目标的发射;2 大气的发射;3 地表的反射4 从地表下的透射4132被动微波传感器地物的微波辐射特点:辐射源多且微弱,需要很大面积的地表来提供能量,图像细节少;来自地面的信号受大气干扰小;不同物体的微波发射率差别往往比红外波段发射率差别大(如海水的微波发射率一般为0.4,陆地的微波发射率为0.8 )依据微波辐射鉴别地物波长范围:0.15 ~ 30 cm频率范围:1~200GHz中心频率:1, 4, 6, 10, 18, 21, 37, 55, 90, 157, 183 GHz地物的微波辐射应用:植被与空地想比,植被表面的发射较低.而且当植被覆盖度增加时,微波辐射的水平极化和垂直极化的差别减小.评估植被覆盖度.海洋水的微波辐射通常比较低,发射率随温度及盐分变化.监测海冰,估计海温.土壤湿度液态水吸收微波辐射.因此,湿润的土壤的微波辐射主要来自表面薄层.对于干燥的土壤,微波辐射可以来自10倍波长甚至100倍波长深的地里.对于雪和冰,微波可以透过,我们可以获得被雪或冰覆盖的地物的信息.地物的微波辐射北极地区海冰图.左图:冬季;右图:夏季利用被动微波遥感海冰地物的微波辐射利用被动微波估计陆地及海洋亮温美国南部陆地及墨西哥湾海水温度地物对微波的反射散射镜面反射角反射地物对微波的反射地物对微波的反射对于长波雷达,地表较光滑,背向散射小.同样的地表对于短波雷达就显粗糙,在雷达图像中由于背向散射强而显得亮.微波散射与表面粗糙程度的关系地物对微波的反射微波散射与入射角的关系入射角:雷达入射波束与地表法线的夹角ERS SAR 数据的入射角是23o,适合探测海洋波浪及其他海洋表面特征.大的入射角可以增加林地及空地的对比度.同一地区不同的入射角可以形成立体图像.地物对微波的反射微波散射与入射角的关系地物对微波的反射微波散射与地物的介电常数的关系介电常数:描述材料的电性质(电容,传导率,反射率).通常定义为物体电容与真空电容之比.自然界一般物体在干燥时,其介电常数在3~8之间,而水的介电常数接近80.岩石的介电常数差别很小,很难依据介电常数来区别不同的类型.介电常数增加,反射增加.土壤含水越多,反射越强.金属物体有很大导电率,故雷达回波信号也很强.地物对微波的反射冠层的背向散射与下列因素有关:散射几何(specular---diffuse)散射体尺寸分布冠层下表面反射率叶面积(density of scattering elements per unit volume)极化(垂直极化的背向散射较强)行结构及方位冠层背向散射与极化的关系(L-band at 1.5 GHz, C-band at 5 GHz, X-band at10.5 GHz)地物对微波的反射土壤的背向散射与下列因素有关:散射几何(specular---diffuse)雷达俯角(多数土壤近镜面反射)与土壤含水量正相关不同土壤湿度时背向散射的变化地物对微波的反射液体水的背向散射:水的介电常数依赖于:温度——波长大于10-15cm时,0摄氏度时的介电常数大于20度.波长——波长小于10-15cm时, 介电常数迅速减小盐分——波长大于3-5cm 时,纯的H20比海水的介电常数更大雷达是倾斜照射,水面平静时,背向散射很小,雷达图像上通常很黑.但当波浪的尺度足够大时,图像也可以探测到.地物对微波的反射冰的背向散射:冰的介电常数很低(e.g. 2.5-6.0)海冰的介电常数与盐分含量直接相关(greater salinity = greater dielectric constant)海冰的介电常数与温度直接相关(higher temperatures associated with greater dielectric constants)淡水冰的介电常数非常低,容易被雷达穿透可以识别冰下物质(water vs regolith)可以探测冰川内部结构地物对微波的反射雪的背向散射:干雪的背向散射比湿雪更大波长较短时,雪的背向散射大,长波的背向散射小.L波段基本看不到雪.对于干雪, 雪水当量与背向散射有强的正相关.利用雷达制作雪水当量图必须选在夜晚(since it is wet during the day)地物对微波的反射总的来说,背向散射需考虑以下因素:Physical factors such as the dielectric constantof the surface materials which also depends strongly on the moisture content;Geometric factorssuch as surface roughness, slopes, orientation of the objects relative to the radar beam direction;The types of landcover (soil, vegetation or man-made objects).Microwave frequency, polarisation and incidence angle. 微波对物体的透射微波辐射透入物体的深度和介电常数,电阻率及频率有关金属有良好的导电性能,微波的穿透系数等于0.冰和雪是不良导体,因此微波能穿透冰和雪的覆盖,以探测冰,雪覆盖下的地面情况.水的介电常数大,微波很难透射.微波遥感器Microwave radiometer:测量微波区域地球的热辐射.强度与目标的温度与发射率,反射率及透射率有关.波长较短.由于能量较低,图像相对'noisy',空间分辨率低,解译复杂.可以测量视场中大气总的含水量,进行海—冰制图,估算其他海洋参数(比如表面风及降雨速率)Radar altimeter非成像雷达垂直入射及接收高度可以从发射及接收脉冲的时间延迟来推断微波遥感器Microwave scatterometer非成像测量背向散射在两个或更多方向扫描地表(usually by multiple sensors) 主要应用为测量海洋表面的风矢量(that is, speed and direction) .基本原理是海洋表面粗糙度的变化由风引起. 虽然不能成像,但也可以在很大的尺度上重建全球的风速图.微波遥感器成像雷达(真实孔径雷达—RAR;合成孔径雷达—SAR) 一般结构发射机转换开关天线接收机记录显示器脉冲发生器脉冲回波发射脉冲微波遥感器(1) 脉冲发生器产生微波脉冲(2) 发射机(3) 双向通讯器(转换开关)(4) 方向天线把脉冲聚焦成一束(5) 返回的脉冲被天线接收,发送到接收器,进行转换,放大为视频信号.(6) 数字式记录或实时显示过程微波遥感器分辨率(1)距离分辨率在垂直于飞行方向上对目标物的分辨能力(所能分辨的目标间最小距离).由脉冲宽度(脉冲持续时间)决定.微波遥感器地距分辨率Rg斜距分辨率Rsθd: Depression angleθ1: off-nadir angleRs: slant-range resolution2CRsτ=Rg: ground-range resolutiondgCRθτcos2=C: speed of lightτ: pulse widthR: slant-range脉冲宽度τ,则在一个脉冲宽度内,电磁波往返距离:2Rs = Cτ微波遥感器距离分辨率的物理含义:脉冲时间为t, 两个不同距离的目标产生两个回波,要使两个回波不完全重叠,才能分清是哪一个回来的信号,必须有τ< 2 r/C距离分辨率与距离无关.若要提高距离分辨率,需要减小脉冲宽度.脉冲宽度小,则S/N降低,需加大发射功率,造成设备庞大,费用昂贵.目前一般采用脉冲压缩技术来提高距离分辨率.微波遥感器脉冲压缩技术(Pulse compression/ De-chirping)对宽脉冲进行线性调频调制(啁啾—Chirp),随时间的变化频率增加.接收时采用匹配滤波器对先收到的低频信号进行延迟,实现叠加增强,但脉冲宽度降低.来自两个相邻目标的回波可能重叠,但重叠区中两个回波在某一时刻的频率不同,也可以被分开.微波遥感器(2)方位分辨率由波束宽度与目标的距离决定.波束宽度由天线大小及波长决定.微波遥感器方位分辨率与天线大小,波长,距离有关,要提高方位分辨率,需采用波长较短的电磁波,加大天线孔径和缩短观测距离.这几项措施无论在飞机上或卫星上使用时都受到限制.目前是利用合成孔径侧视雷达来提高侧视雷达的方位分辨率.微波遥感器合成孔径雷达(Synthetic Aperture Radar -- SAR)特点:在距离向上,采用脉冲压缩(与真实孔径雷达相同)在方位上,采用合成孔径原理合成孔径基于多普勒效应Doppler effect:当目标与观测者之间有相对运动时,观测者接收到的频率与波源发出的频率不同,二者之差为多普勒频移.互相接近时,频率增加,远离时频率减少.θ波源θcos'CVffffd = =VV << C微波遥感器合成孔径原理方位压缩微波遥感器实际波束宽度:β= λ/ D实际分辨率: L = βR= Ls(合成孔径长度)合成波束宽度:βs= λ/ 2Ls= D/2R合成分辨率: Ls= βsR = D/2微波遥感器合成孔径雷达的方位分辨率与距离远近无关,因此可以用于高轨道卫星;分辨率的大小为小天线的一半,这将提供很高的分辨率.天线不能太小,因为合成孔径技术的基本原理是:小天线+信号处理=大天线缩小天线带来的一切技术问题都由星上的信号处理系统去解决,这对于星载的信号处理设备要求是很高的,使之技术复杂化.微波遥感平台典型的微波遥感平台:卫星:SAR sensors have been used on a number of satellites, (Seasat, ERS-1/2, JERS-1, RADARSAT)航天飞机:SIR-A, SIR-B, SIR-C/X-SAR微波遥感平台ERSEuropean Remote Sensing Satellite, European Space Agency微波遥感平台ERS-1 was launched in July 1991 and ERS-2 in April 1995. ERS-1 uses a SAR instrument to acquire images of ocean, ice and land regardless of cloud and sunlight conditions.Other microwave instruments measure sea state, sea surface winds, ocean circulation, sea and ice levels, as well as the sea's surface temperature.Near polar sun-synchronous orbitPrimarily oriented towards ocean and ice monitoring, but with an all-weather high resolution microwave imaging capability over land and coastal zones.微波遥感平台ERS-2 is practically identical to ERS-1, with the addition of the GOME sensor for global ozone monitoring.The orbits of ERS-1 and 2 are such that ERS-2 follows the same ground track as ERS-1, except for a 1-day delay. This provides an opportunity to obtain tandem interferometric data of an area using the SAR on the two satellites. The tandem data has better coherence property than the data obtained from 35-day repeat passes of a single satellite.Currently, only ERS-2 remains in active operation.微波遥感平台ERS-1,2 OrbitTypeSun-SynchronousAltitude782 kmInclination98.5 degPeriod100 minRepeat Cycle35 days微波遥感平台ERS SAR Instrument CharacteristicsFrequency5.3 GHz (C band)PolarisationLinear VVBandwidth15.55 MHzPeak power4.8 kWAntennae size10 m x 1 mIncidence angle23onominalSwath width100 kmResolution30 m (azimuth), 26.3 m (range)微波遥感平台RADARSATRADARSAT, Canada微波遥感平台RADARSAT is a Canadian satellite operated by the Canadian Space Agency (CSA)/Canadian Center for Remote Sensing (CCRS) for gathering global data on ice conditions, crops, forests, oceans and geology.The satellite was launched in November 1995, with the launch service provided by NASA, USA.Using a single frequency (C-Band), the RADARSAT SAR has the unique ability to shape and steer its radar beam over a 500 kilometre range. Users can have access to a variety of beam selections that can image swath from 35 kilometres to 500 kilometreswith resolutions from 10 metres to 100 metresrespectively. Incidence angles range from less than 20 degrees to more than 50 degrees.微波遥感平台RADARSAT OrbitTypeSun-SynchronousAltitude798 kmInclination98.6 degPeriod100.7 minRepeat Cycle24 days微波遥感平台SensorSAR(Synthetic Aperture Radar): The SAR is able to operate in several beam modes:Standard: Seven beam modes with incidence angle ranging from 20 to 49 deg nominal, 100 km swath width and 25 m resolution.Wide: Three beam modes with varying incidence angles,150 km swath width.Fine: Five beam modes with 50 km swath width and resolution better than 10 m.Scansar: Wide swath width (300 - 500 km) with a coarser resolution of 50 to 100 m.Extended mode.微波遥感平台RADARSAT Operating Modes微波遥感平台MODEResolution (m)Range x azimuth(m)LOOKSWIDTH(km)INCIDENCEANGLE(degrees)Standard25 x 28410020-49Wide - 148-30 x 28416520 - 31Wide - 232-25 x 28415031 - 39Fine resolution11-9 x 914537 - 48ScanSAR narrow50 x 502 - 430520 - 40ScanSAR wide100 x 1004 - 851020 - 49Extended (H)22-19 x 2847550 - 60Extended (L)63-28 x 28417010 - 23RADARSAT Operating Modes微波遥感平台Frequency/wavelength5.3 GHz (C band)/ 5.6 cm PolarisationLinear HHBandwidth11.6, 17.3 or 30.0 MHzPeak power5 kWAntennae size15 m x 1.5 mIncidence angleMode dependentResolutionMode dependentRADARSAT SAR Instrument Characteristics微波遥感平台JERS-1JERS-1 (Japanese Earth Resource Satellite), JapanJERS-1 was launched in February 1992 by NASDA (Japanese Space Agency).This satellite carries a L-band SAR and an optical sensor for generation of global data set in order to survey resources andto establish an integrated Earth observation system.微波遥感平台JERS-1 OrbitTypeSun-SynchronousAltitude568 kmInclination97.7 degPeriod96 minRepeat Cycle44 days微波遥感平台SensorsSAR(Synthetic Aperture Radar)OPS(Optical Sensor)JERS-1 SAR Instrument CharacteristicsFrequency1.275 GHz (L band)PolarisationLinear HHBandwidth15.55 MHzIncidence angle35onominalSwath width75 kmResolution18 m (azimuth, 3 looks), 18 m (range)微波遥感平台SEASATUSASeasat was the first Earth-orbiting satellite designed for remote sensing of the Earth's oceans and had onboard the first spaceborne synthetic aperture radar (SAR).Seasat was managed by JPL and was launched on June 28, 1978 into a nearly circular 800 km orbit with an inclination of 108 degrees.Fourteen Earth orbits were completed each day.The Seasat SAR operated for 105 days until October 10, 1978, when a massive short circuit in the satellite electrical system ended the mission.微波遥感平台Satellite Altitude800 kmRadar Frequency1.275 GHz (L-band)Radar Wavelength23.5 cmSystem Bandwidth19 MHzTheoretical Resolution on the Surface25 m (azimuth) x 25 m (range) Number of Looks4Swath Width100 kmAntenna Dimensions10.74 m x 2.16 mAntenna Look Angle20 degrees from verticalIncidence angle on the surface23 degrees 3 degrees across the swath PolarizationHorizontal transmit, Horizontal receive (HH) Transmitted Pulse Length33.4 microsecondsPulse repetition frequency (PRF) 1463-1640 HzTransmitted peak power1.0 kWData recorder bit rate (on the ground)110 Mbits/s (5 bits/word) Seasat参数雷达图像的特点目标物反射的回波强则影像呈浅色调,反射的回波弱则呈深色调.因此影像色调深浅与地物反射回波的强弱有关.但地物对微波的反射能量大小又与地物本身的导电率,表面粗糙度,入射波的角度以及极化波长等因素有关.入射角太小,距离分辨率低,入射角太大则镜面反射强,故目前大多采用10~50度入射.雷达图像特点雷达图像的特点雷达图像的变形:像片上呈正方形的田块,在雷达图像上往往被压缩成四边形或长方形.雷达阴影:有地形起伏时,背向雷达的斜坡往往照不到,产生阴影.因为雷达图像是根据天线对目标物的射程远近记录在图像上的,故近射程的地面部分在图像上被压缩,而远射程的地面部分则伸长.透视收缩(Foreshortening ):有地形起伏时,面向雷达一侧的斜坡在图像上被压缩,而另一侧则延长.由于透视收缩,导致前坡的能量集中,显得比后坡亮.顶底位移(Layover):观测角度进一步减小时,斜坡顶部反射的信号比底部反射的信号提前到达雷达.在图像上显示顶部与底部颠倒.雷达图像的特点雷达阴影透视收缩及顶底位移雷达图像特点雷达图像上显示的透视收缩雷达图像特点雷达图像解译从下图中判断第一年的冰和多年的冰:第一年的冰通常薄且光滑,反射大部份雷达波.多年的冰经过断裂及再结冰,表面粗糙,背向散射强.雷达图像解译One property of radar pulses gaverise to an extraordinary imageacquired from SIR-A in November,1981. The color scene below is aLandsat subimage of the SelmaSand Sheet in the Sahara Desertwithin northwestern Sudan.干沙的介电常数比较低,雷达穿透深(约10英尺).雷达条带显示了沙下的地形.雷达图像解译ERS SAR image (pixel size=12.5 m)城区的图像很亮(角散射),植被的色调中等(体散射),空地及水面色调很暗(镜面反射)雷达图像解译SPOT Multispectral image in Natural Colour(pixel size=20 m)雷达图像解译This SAR image shows an area of the sea near a busy port. Many ships can be seen as bright spots in this image due to corner reflection. The sea is calm, and hence the ships can be easily detected against the dark background.雷达图像解译Dry Soil: Some of the incident radarenergy is able to penetrate into the soilsurface, resulting in less backscatteredintensity.Wet Soil: The large difference inelectrical properties between waterand air results in higherbackscattered radar intensity.Flooded Soil: Radar is specularlyreflected off the water surface, resulting in low backscattered intensity. The flooded area appears dark in the SAR image.微波遥感应用利用雷达立体像对及干涉原理构建DEM微波遥感应用微波遥感应用进一步与光学遥感图像结合微波遥感应用变化检测微波遥感应用监测热带雨林Multiseasonal ERS-1SAR image (May 92,Dec. 92, April 92 inR,G,B).。
微波遥感基础

叠掩:雷达波束先到达坡顶,然 后到坡腰,最后到坡底
雷达影像的几何特点
雷达阴影
雷达阴影:在山的后坡雷达波束 不能达到,没有回波信号返回, 在图像上相应位置出现暗区。
α <β
β
整个背面都能接受波束,不会产生阴影
α =β
α
波束正好擦过背坡,如果背坡光滑,则不 能接受回波,若有起伏,则能接受回波
α >β
背坡坡度大于俯角,则必然产生阴影。
距离向分辨率与俯角关系甚大,侧视时距离分辨率好。
微波遥感分辨率
方位向分辨率(along-track resolution),即在航向所能分辨出的 两个目标的最小距离。 方位向分辨率特点:随着距离增加,方位向分辨率增加(影像 变得粗糙)。
微波遥感分辨率
利用天线的移动,可以将小孔径的天线虚拟成一个大孔径的天 线,可以获得类似大孔径天线的探测技术。
微波遥感基础
雷达基本原理
雷达(Radar)的英文全名: Radio Detection and Ranging 雷达系统使用调制波形和方向性天线来发射电磁能量到空间的特定区域来 搜索目标,根据目标反射的部分能量来提取目标的信息,例如距离、速度、 角位置和其他目标识别等。
搜索雷达
探地雷达
倒车雷达
气象雷达
Ka、K、Ku波段:早期主要用于机载雷达; X波段:广泛应用于军事探测和绘制地形图( TerraSAR-X和 Cosmo-Skymed ) C波段:机载雷达(Convair-580 and NASA AirSAR )和星载雷达 (ERS-1/2、Envisat ASAR和RADARSAT -1/2) S波段:只用于俄罗斯ALMAZ 卫星 L波段:NASA机载雷达,美国SEASAT、日本JERS-1和ALOS卫星 P波段:应用于NASA机载实验雷达
遥感部分5-红外及微波遥感

侧视雷达分类 — 真实孔径与合成孔径
三、机载侧视雷达图像的特性 (一)地面分辨率 1.距离分辨率(Rr):垂直于航线方向上的分辨力,指 在雷达脉冲发射的方向上能分辨两个目标的最小距离。
取决于脉冲宽度τ和波束照射俯角α:
Rr=C ·τ/(2COSα)
例α=50°,τ=0.1微秒
3 × 10 8 × 0.1 × 10 −6 Rr = = 23m o 2 × cos 50
第五章 红外遥感及 微波遥感图像
红外遥感图像 微波遥感图像
Microwave remote sensing Hyper-spectral remote sensing
Thermal infrared remote sensing
海面异常问题
全球变化
CO2 content variation in ice core with time
sensor 0 Bλ (θ , ϕ ) = [ ρ b ,λ (θ s , ϕ s ;θ , ϕ ) Es ,λ (θ s ) + ε λ (θ ) Bλ (T ) s
+
atm ρb,λ (θ ′, ϕ ′;θ , ϕ ) Latm↓ (θ ′) cosθ ′dω ′ ] τ λ + Latm↑ λ λ ∫
2、形状和大小
物体温度不高且与周围背景有温差时,能反映出地 物的真实或相似的形状。 较热物体,向周围辐射的红外线能量较大,产生较 大光晕现象,其影像被夸大,轮廓不规则。
3、阴影
热力阴影:由于地表阴影处得不到太阳直接照
射,温度较低,热辐射也低而成。是地物热辐射 强度低的地方。
热阴影在日落后或被云层覆盖后仍会存在
Thermography; Night Vision Systems
Envisat-1简介雷达遥感
雷达遥感雷达遥感(微波遥感)可分为主动和被动两种方式。
被动方式与可见光和红外遥感类似,是由微波扫描辐射计接收地表目标的微波辐射。
目前多数星载雷达采用主动方式,即由遥感平台发射电磁波,然后接收辐射和散射回波信号,主要探测地物的后向散射系数和介电常数。
它发射的电磁波波长一般较长,在1mm至1m之间。
合成孔径雷达(SAR)概念的提出是相对真实孔径雷达天线而提出的。
对于真实孔径雷达,当雷达随载体(飞机或卫星)飞行时,向地表发射雷达波束,然后接受地面反射信号,这样便得到了地表雷达图像。
我们知道卫星雷达天线越长,对地物的观测分辨率就越高。
由于受雷达天线长度的限制,真实孔径雷达的地表分辨率往往很低,难以满足应用要求。
而合成孔径雷达正是解决了利用有限的雷达天线长度来获取高分辨率雷达图像的问题。
合成孔径雷达(SAR,Synthetic Aperture Radar)技术是干涉合成孔径雷达(INSAR,Interferometric Synthetic Aperture Radar ,简称:干涉雷达)技术和差分干涉合成孔径雷达(D-INSAR,Differential Interferome- tric Synthetic Aperture Radar ,简称:差分干涉雷达)技术的基础,它涉及到侧视雷达系统、雷达波信号处理技术以及雷达图像的生成等诸方面。
而干涉雷达技术和差分干涉雷达技术则是基于合成孔径雷达技术的图像处理方法和模型,是合成孔径雷达技术的应用延伸和扩展。
合成孔径雷达干涉测量技术(INSAR,Interferometric Synthetic Aperture Radar;简称:干涉雷达测量)是以同一地区的两张SAR图像为基本处理数据,通过求取两幅SAR 图像的相位差,获取干涉图像,然后经相位解缠,从干涉条纹中获取地形高程数据的空间对地观测新技术。
差分干涉雷达测量技术(D-INSAR)是指利用同一地区的两幅干涉图像,其中一幅是通过形变事件前的两幅SAR获取的干涉图像,另一幅是通过形变事件前后两幅SAR图像获取的干涉图像,然后通过两幅干涉图差分处理(除去地球曲面、地形起伏影响)来获取地表微量形变的测量技术。
我研究微波遥感的英语作文
我研究微波遥感的英语作文Microwave remote sensing is a fascinating field that allows us to explore and understand our planet in a unique way. It utilizes microwave radiation to gather information about various Earth processes and phenomena. Frommonitoring weather patterns to studying the Earth's surface, microwave remote sensing has revolutionized our understanding of the world around us.In microwave remote sensing, antennas are used to transmit and receive microwave signals. These signals interact with the Earth's surface and atmosphere, providing valuable data that can be analyzed and interpreted. The microwave radiation is able to penetrate clouds, making it an ideal tool for studying weather patterns and climate change.One of the key applications of microwave remote sensing is in weather forecasting. By analyzing the microwave radiation emitted by clouds and precipitation,meteorologists can accurately predict the intensity and movement of storms. This information is crucial for issuing timely warnings and ensuring the safety of communities at risk.Microwave remote sensing is also used to study the Earth's surface, particularly in the field of hydrology. By measuring the microwave radiation reflected or emitted by the Earth's surface, scientists can determine soil moisture content and monitor changes in water bodies such as lakes and rivers. This data is vital for managing water resources and predicting droughts and floods.Another important application of microwave remote sensing is in agriculture. By analyzing the microwave radiation reflected by crops, scientists can assess their health and growth. This information can help farmers optimize their irrigation and fertilization practices, leading to higher crop yields and more sustainable agriculture.In addition to these applications, microwave remotesensing is also used in other fields such as geology, oceanography, and environmental monitoring. It provides valuable data on soil composition, ocean currents, and the health of ecosystems. This information is crucial for understanding and managing our natural resources.In conclusion, microwave remote sensing is a powerful tool that allows us to explore and understand our planet in new and exciting ways. From weather forecasting to agriculture and environmental monitoring, it has revolutionized our ability to gather data and make informed decisions. As technology continues to advance, the possibilities for microwave remote sensing are endless, and it will undoubtedly continue to play a crucial role in our understanding of the Earth.。
高光谱遥感与微波遥感
高光谱遥感高光谱遥感是高光谱分辨率遥感(Hyperspectral Remote Sensing)的简称。
它是在电磁波谱的可见光,近红外,中红外和热红外波段范围内,获取许多非常窄的光谱连续的影像数据的技术(Lillesand & Kiefer 2000)。
其成像光谱仪可以收集到上百个非常窄的光谱波段信息。
高光谱遥感是当前遥感技术的前沿领域,它利用很多很窄的电磁波波段从感兴趣的物体获得有关数据,它包含了丰富的空间、辐射和光谱三重信息。
高光谱遥感的出现是遥感界的一场革命,它使本来在宽波段遥感中不可探测的物质,在高光谱遥感中能被探测。
国际遥感界的共识是光谱分辨率在λ/10数量级范围的称为多光谱(Multispectral),这样的遥感器在可见光和近红外光谱区只有几个波段,如美国 LandsatMSS,TM,法国的SPOT等;而光谱分辨率在λ/100的遥感信息称之为高光谱遥感(HyPerspectral);随着遥感光谱分辨率的进一步提高,在达到λ/1000时,遥感即进入超高光谱(ultraspeetral)阶段(陈述彭等,1998)。
微波遥感科技名词定义中文名称:微波遥感英文名称:microwave remote sensing定义1:遥感器工作波段选择在微波波段范围的遥感。
所属学科:测绘学(一级学科);摄影测量与遥感学(二级学科)定义2:运用波长为1~1 000mm的微波电磁波的遥感技术。
包括通过接收地面目标物辐射的微波能量,或接收遥感器本身发射出的电磁波束的回波信号,根据其特征来判别目标物的性质,特征和状态,包括被动遥感和主动遥感技术。
所属学科:地理学(一级学科);遥感应用(二级学科)定义3:利用波长1~1000mm电磁波本身和在大气中传输的物理特性的遥感技术统称,该波段称为微波。
微波遥感对云层、地表植被、松散沙层和冰雪具有一定的穿透能力,可以全天侯工作。
所属学科:资源科技(一级学科);资源信息学(二级学科)本内容由全国科学技术名词审定委员会审定公布微波遥感是传感器的工作波长在微波波谱区的遥感技术,是利用微波投射于物体表面,由其反射回的微波波长改变及频移确定其大小、形态以及移动速度的技术。
遥感介绍英文作文模板
遥感介绍英文作文模板英文:Remote sensing is a technology that uses sensors to collect data about the Earth's surface without physically being there. This data can be used to create maps, monitor changes in the environment, and even predict natural disasters. Remote sensing can be done using various methods, such as satellites, airplanes, and drones.One of the advantages of remote sensing is that it allows us to gather data from areas that are difficult or dangerous to access. For example, we can use satellites to monitor changes in the polar ice caps, which would bedifficult and dangerous for humans to do in person. Another advantage is that remote sensing can provide data on alarge scale, allowing us to analyze entire regions or even the entire planet.However, there are also some limitations to remotesensing. For example, the quality of the data collected can be affected by weather conditions or other environmental factors. Additionally, interpreting the data collected can be challenging, as it requires specialized knowledge and skills.Overall, remote sensing is a powerful tool for gathering data about the Earth's surface. By combining remote sensing with other technologies and expertise, we can gain a better understanding of our planet and make informed decisions about how to protect it.中文:遥感是一种使用传感器收集地球表面数据的技术,不需要实际到达现场。
微波遥感讲课演示文稿-12-1
主要方向显著
归一化辐射方向图
能量大小相对估计
方向系数
能量分布比例
辐射立体角
单位立体角 dΩ =sin θ d θ d φ
辐射源与距它r 处的球面微分dA所开成的立体角
方向图立体角
可以理解为按每一个单位立体角的能量相对大 小加权和
近似表示为
为xz平面内半功率宽度
天线有效面积
由波辨角
雷达方程
黑体与电磁辐射定律
普朗克公式 随波长不同的辐射变化
斯蒂芬 —— 玻耳兹曼定律 某一温度状态下的辐射总和 ( 普朗克公式的积分 )
2 π5 k 4 W = ————— T 4 = σ T 4 15 c2 h3
维恩定律 辐射温度越高 辐射量最大值所对应波长越短 ( 普朗克公式的微分 )
瑞利 —— 金斯公式 ( 普朗克公式在波长很长时的表现形式 )
散射 地表粗糙 主要散射分量 保持相干特性 关键是后向散射 一部分为同极化, 与入射波极化方式相同 一部分为正交极化
透射 主要在长波 复介电常数小
复介电常数大
较干燥
则无透射
地物结构疏松
如水面、铜
如沙
折射 波的分解 T E (水平)TM(垂直) 反射系数表达式说明信号的不同
微分散射系数(和表面极化发射率)
无耗各向同性天线辐射的总功率为 Poi = 4πr2Sri 实际天线辐射的总功率 由 Sr(θ,φ) 在半径为 r 的球面内积分得
Po = ∫∫Sr(θ,φ) r2 dΩ = r2∫∫Sr(θ,φ)dΩ 4π 4π ( Po = ∫∫Sr(θ,φ) dA , dA = r2 dΩ)
由于 Pt = Poi = Po/ηl ,故有 (由 Po = ∫∫Sr(θ,φ) r2dΩ )
遥感英文
1. Definition of Remote Sensing•Remote sensing is the science and art of obtaining information about a phenomenoa without being in contact with it. Remote sensing deals with the detection and measurement of phenomena with devices sensitive to electromagnetic energy such as:• Light (cameras and scanners)• Heat (thermal scanners)• Radio Waves (radar)2. Passive Remote Sensing: Makes use of sensors that detect the reflected or emitted (散射)electro-magnetic radiation from natural sources.3. Active remote Sensing: Makes use of sensors that detect reflected responses from objects that are irradiated (辐射)from artificially-generated energy sources, such as radar.4. Platforms: Vehicle to carry the sensor (truck, aircraft, space shuttle, satellite, etc.)5. Sensors: Device to detect electro-magnetic radiation (camera, scanner, etc.) 1.Electro-Magnetic Spectrum (EMS): (电磁波谱)Wavelength regions of electro-magnetic radiation have different names ranging from Gamma ray, X-ray, Ultraviolet (UV), Visible light, Infrared (IR) to Radio Wave, in order from the shorter wavelengths.2.Atmospheric scattering(散射)is the unpredictable diffusion of radiation by particles in the atmosphere.3.Rayleigh scatter(瑞利散射)is common when radiation interacts with atmospheric molecules (gas molecules) and other tiny particles (aerosols) that are much smaller in diameter that the wavelength of the interacting radiation.4.Mie scatter(米氏散射)exists when the atmospheric particle diameter is essentially equal to the energy wavelengths being sensed.5.Extinction: (衰减)The sunlight transmission through the atmosphere is effected by absorption and scattering of atmospheric molecules and aerosols. This reduction of the sunlight's intensity is called extinction.6.A spectral reflectance curve: (反射波谱曲线)A graph of the spectral reflectance of an object as a function of wavelength is called a spectral reflectance curve.1.A sun synchronous orbit is a near polar orbit whose altitude is such that the satellite will always pass over a location at a given latitude at the same local solar time. In this way, the same solar illumination condition (except for seasonal variation) can be achieved for the images of a given location taken by the satellite.1.Electromechanical:(光机)the sensor oscillates(振荡)from side to side to form the image.2.Linear array:(线性列阵)an array of detectors is used to simultaneously(同时地)sense the pixel (像素)values along a line。
遥感介绍英文作文
遥感介绍英文作文英文:Remote sensing is a technology that allows us to gather information about the Earth's surface without actually being in physical contact with it. This is done using sensors on satellites or aircraft to capture images and data from a distance. These sensors can detect various forms of energy, such as visible light, infrared, and microwave radiation, and then convert this information into useful data.One of the most common applications of remote sensing is in the field of agriculture. For example, farmers can use remote sensing data to monitor the health of their crops, detect diseases or pests, and optimize the use of water and fertilizers. By analyzing the images and data obtained through remote sensing, farmers can make more informed decisions that can ultimately improve their crop yields.Another important application of remote sensing is in environmental monitoring. For instance, scientists can use remote sensing to track changes in land use, deforestation, and urbanization, as well as to monitor the health of ecosystems and the impact of climate change. This information is crucial for making informed decisions about land management and conservation efforts.In addition, remote sensing is also widely used in disaster management. For example, after a natural disaster such as a hurricane or earthquake, remote sensing data can be used to assess the extent of the damage, identify areas that are most in need of assistance, and plan for recovery and reconstruction efforts.Overall, remote sensing plays a crucial role in our understanding of the Earth and its processes, and it has a wide range of practical applications in various fields.中文:遥感是一种技术,可以让我们在不与地球表面实际接触的情况下收集有关地球表面的信息。
- 1、下载文档前请自行甄别文档内容的完整性,平台不提供额外的编辑、内容补充、找答案等附加服务。
- 2、"仅部分预览"的文档,不可在线预览部分如存在完整性等问题,可反馈申请退款(可完整预览的文档不适用该条件!)。
- 3、如文档侵犯您的权益,请联系客服反馈,我们会尽快为您处理(人工客服工作时间:9:00-18:30)。
Signal - Surface interactions and back-scattering
• Microwave interaction with natural surfaces is a function of:
– SAR configuration • incidence angle • frequency • polarisation
1 2
3
Backscatter behavior over vegetation
1 - Low incidence angle and short wavelengths (1) =>: no penetration into vegetation
2 - Strong incidence and large wavelengths (2): => penetration into vegetation =>information on moisture, soil and/or water
3 - Specific temporal behavior of certain crop types (e.g. rice)
1 2
Radar signal - surface interactions
ENVISAT
P 70cm
Specular
to
diffuse
Interaction of the Radar Signal with the Soil
1 - Backscatter over a rough surface (1):
=>radar response due to backscattered
radar = a ranging or distance measuring device with a transmitter, a receiver, an antenna, and an electronics system to process and record the data. Transmitter generates successive short bursts (or pulses of microwave (A) at regular intervals which are focused by the antenna into a beam (B). The antenna receives a portion of the transmitted energy reflected (or backscattered) from various objects within the illuminated beam (C).
Fundamental for SAR Remote Sensing
Passive remote sensing – Active remote sensing
Passive system Optical sensors
Active system radar sensors
RADAR = RAdio Detection And Ranging,
– Surface ’s physical and electrical properties • roughness • soil moisture • vegetation parameters
– Surface ’s geometry • Local and large scale
Signal - Surface interactions : Rayleigh criterion
signal
1
2 – Penetration in a dry soil (2): response depends upon subsurface layer
3 - Smooth surface or a super-saturated soil (3):
Specular reflection = low radar response
destructive interference from the multiple scattering returns that will occur within each resolution cell.
Homogeneous target
Constructive interference Destructive interference Various level of interference (between constructive and destructive)
3 2
Note: influence of radar wavelength and incidence angle
Backscatter of Radar Signal over Forests
Reflection off forest canopy (1) Penetration into foliage (2) (volume scattering) Multiple reflections on trees and soil (3)
Specular reflection (smooth surface) h< λ/ 8cos θ
Diffuse reflection (rough surface) h< λ/ 8cos θ
λ varies from
K 1cm
X 3cm C 5.6cm S 10cm L 23cm
RADARSAT ERS
பைடு நூலகம்
Radar and electromagnetic spectrum
Radar signal: amplitude and phase
SAR signal is a complex nature
SAR = Amplitude + phase
Speckle appears as a grainy "salt and pepper" texture in an image. This is caused by random constructive and
