Appendix to Ch 6(中级宏观经济学,香港中文大学)
Chapter 6 Economic Growth (中级宏观经济学,香港中文大学)

C is aggregate consumption
C
so that is current consumption per worker
N
• dg / d (C / N ) 0 , mainly due to the fact that higher food
consumption per worker reduces death rates through better nutrition
• From the perspective of the early 21st century: Malthus was wrong Why? - Did not allow for the effect of increases in the capital stock on production, and - Did not account for all the effects of economic forces on population growth
• •
Suppose the economy is initially in a steady state, with
then increases once and for all time to
c* unchanged
z2
z1
, which
• l * falls
• Steady state population N * increases
Y zF (L, N)
(1)
where
Y is current aggregate output L is current fixed supply of land
N is current labor
中级宏观经济学-纲
《中级宏观经济学》教学大纲“Intermediate Macroeconomics” CourseOutline课程编号:151133A课程类型:学科基础课总学时: 48学分:3适用对象:经济学, 金融学先修课程:高等数学、经济学原理、微观经济学Course Code: 151133ACourse Type: Discipline basic coursePeriods: 48Credits: 3Applicable Subjects: Economics, FinancePreparatory Courses: Advanced Math, Principles of Economics, Microeconomics.一、课程的教学目标本课程的教学目的旨在让金融以及经济类本科二年级学生掌握现代宏观经济学的基本概念和基本理论。
课程学习可以培养学生的经济学思维能力,使学生能够运用严谨科学的方法来思考宏观经济问题,并结合运用数学,图形作为分析工具。
课程结束后,学生应该具备运用和解决数学模型,提高运用模型解决现实问题的能力。
课程也会帮助今后研究生阶段的高级宏观经济学的学习打下良好基础。
Upon successful completion of the course, the second year students majoring in economics and finance should be able to demonstrate a basic understanding of modern macroeconomics concepts and theory. The course will train students to think in an analytically rigorous way about macroeconomic questions using the tools of advanced math and graph. After the course, the students should be able to use and solve mathematical models, and improve ability of applying economic models to analyze economic issues. In addition, the course also helps students prepare entering graduate education.二、教学基本要求中级宏观经济学提供分析问题的工具和模型来解释生产,通货膨胀,就业,利率,汇率和其他宏观经济指数。
CFA中级宏观经济学(双语)
中国海洋大学本科生课程大纲一、课程介绍1.课程描述CFA中级宏观经济学是在初级宏观经济学课程的基础上,结合微积分等数学工具,进一步深入讲授CFA中级宏观经济基本理论和分析方法,更加全面、系统地阐述CFA中级宏观经济理论的框架体系与发展演变。
本课程要求学生掌握基本的经济学模型构建方法,并通过各类习题加深对CFA中级宏观经济理论的理解,建立起经济学的基本思维框架,学会运用所学经济理论认识、分析全球现实经济问题。
CFA Intermediate Macroeconomics is an in-depth teaching of the intermediate macroeconomics basic theories and analytical methods in CFA,which is based on the basic macroeconomics courses and combined with calculus and other mathematical tools. It expounds the framework system and the development evolution of CFA intermediate macroeconomic theories comprehensively and systematically. This course requires students to master basic economic model building methods and deepen their understanding of CFA intermediate macroeconomic theories through various exercises, so as to establish the basic thinking framework of economics and improve their ability to understand, analyze and solve global economic problems with economic theory.2.设计思路本课程在内容上主要从中级宏观经济理论部分展开讲授。
中级宏观经济学(英文)16-Interest-Rate Differentials

LM
IS
r
r
NFI NFI NFI
Y
e
NX
23
NX
A Rule of Thumb
To find how any policy will affect any variable, find the answer in the two extreme cases and take an average.
Depends… on the ex-rate after 1 year How can we know the ex-rate after 1 year? depends on expectation
3
Interest-Rate Differentials
If expected ex-rate is still RMB 8/$ 5%
2.
Ex-rate expectations expect RMB to appreciate loans in RMB can pay a lower i-rate
2
Interest-Rate Differentials
$100, RMB 8/$, US: 5%. How large should the i-rate be in China, so that returns in 2 countries will be the same after 1 year?
10
Interest-Rate Differentials
Vicious circle
Default problems in the banking system Confidence↓ Risk premium and i-rate↑ Price of stock and other assets ↓ Value of collateral for bank loans ↓ Greater default exacerbated problems
中级宏观经济学英文课件 (2)
Aggregate Demand I
2
The Keynesian cross
§ A simple closed-economy model in which income
is determined by expenditure. (due to J. M. Keynes)
§ Notation:
I = planned investment PE = C + I + G = planned expenditure Y = real GDP = actual expenditure
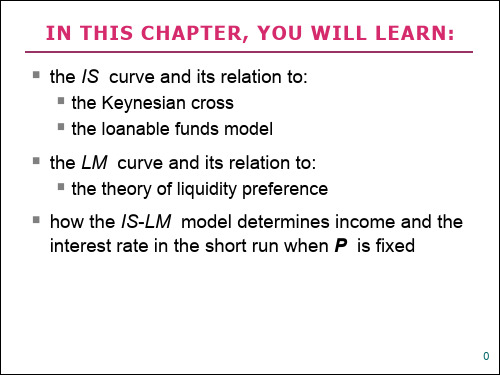
IN THIS CHAPTER, YOU WILL LEARN:
§ the IS curve and its relation to: § the Keynesian cross § the loanable funds model § the LM curve and its relation to: § the theory of liquidity preference § how the IS-LM model determines income and the
Y
PE =C2 +I +G
At Y1, there is now an unplanned inventory buildup…
C = MPC T
…so firms reduce output, and income falls toward a new equilibrium
CHAPTER 11
CHAPTER 11
Aggregate Demand I
16
An increase in spending with balanced budget
中级宏观经济学_江西财经大学3中国大学mooc课后章节答案期末考试题库2023年

中级宏观经济学_江西财经大学3中国大学mooc课后章节答案期末考试题库2023年1.石英的最大双折射率值为0.009,该矿物具有最大双折射率值的切面是()答案:平行光轴的切面2.某矿物Ng-Np=0.018,Nm-Np=0.012,该矿物为()答案:二轴负晶3.电气石为一轴负晶,在平行c轴的切面上,快光的振动方向是()答案:Ne4.刚玉为一轴负晶,在斜交c轴的切面上,快光的振动方向是()答案:Ne’5.电气石为三方晶系矿物,c轴方向折射率为1.624,a轴方向折射率为1.644,电气石的光性为()答案:一轴负晶6.磷灰石(六方晶系),平行c轴的偏光折射率为1.624,垂直c轴的偏光折射率为1.629,该矿物的轴性光性是()答案:一轴负晶7.黄玉(斜方晶系矿物)的(010)切面上的主折射率值分别为1.607和1.617,(001)切面上的主折射率值分别为1.607和1.610,该矿物的轴性光性是()答案:二轴正晶8.黄玉(斜方晶系矿物)的(010)切面上的主折射率值分别为1.607和1.617,(001)切面上的主折射率值分别为1.607和1.610,该矿物的光性方位是()答案:a∥Np,b∥Nm,c∥Ng9.方解石的No=1.658,Ne=1.486,在偏光镜下的突出特征是:()答案:具闪突起10.石英的折射率值为1.544-1.553,在单偏光镜下的突起等级为:()答案:正低突起11.已知方解石的No=1.658,Ne=1.486。
请问方解石平行光轴切面的突起等级()答案:闪突起12.已知方解石的No=1.658,Ne=1.486。
请问方解石哪个切面闪突起最明显()答案:平行光轴13.黑云母Ng≈Nm为深棕色,Np为淡黄色,已知主折射率为1.697、1.696、1.616,Np∧c=3°,请问黑云母∥(001)切面上的颜色及解理特征()答案:Ng=深棕色、Nm=深棕色,无解理14.黑云母Ng≈Nm为深棕色,Np为淡黄色,已知主折射率为1.697、1.696、1.616,Np∧c=3°,请问黑云母⊥(001)切面上的颜色及解理特征()答案:Ng或Nm=深棕色、Np=淡黄色,一组极完全解理15.两矿片在正交偏光镜下45°位时重叠,其光率体椭圆同名半径平行,看到的干涉色比原来两矿片的干涉色()答案:一定都高16.两矿片在正交偏光镜下45°位时重叠,其光率体椭圆异名半径平行,看到的干涉色比原来两矿片的干涉色()答案:不一定都低17.方解石最高干涉色为高级白,在此干涉色最亮位置,加入石膏试板,同名半径平行,看到的干涉色是()答案:高级白18.白云母三个主折射率分别为1.588、1.582和1.552,请问白云母的轴性光性()答案:二轴负晶19.贵橄榄石沿c轴延长,a∥Ng,b∥Np,c∥Nm,Ng=1.732,Nm=1.715,Np=1.694。
(完整版)【上海交通大学-安泰】中级宏观经济学作业答案

1.In the United States, the capital share of GDP is about 50%, the average growth in totaloutput is 3% per year, the depreciate rate is 5% per year, the capital-output ratio is 4.Suppose that the production function is Cobb-Douglas, so that the capital share ofoutput is constant, and the United States has been in a steady state. (10points)a)What must the saving rate be in the initial steady state?△Y/Y = 0.03 => n = 0.03sf(k) = (n +δ)ks = (n +δ)k/f(k)= (0.03 + 0.05)* 4 = 0.32b)What is the marginal product of capital in the initial steady state?MPK * K/Y = 0.5=> MPK = 0.5/(K/Y) = 0.5/4 = 0.125c)What will the capital-output ratio be at the Golden Rule steady state?MPK = (n +δ) = 0.03 +0.05 = 0.08MPK * K/Y = 0.5=> K/Y = 0.5/0.08 = 6.25d)What must the saving rate be to reach the Golden Rate steady state?sf(k) = (n +δ)ks = (n +δ)k/f(k) = 0.08 *6.25 = 0.52.Prove each of the following statements about the steady state of the Solow model withpopulation growth and technological progress. (10 points)a)The capital-output ratio is constantIn the steady state, we know that sy = (+ n + g)k. This implies that k/y = s/( + n + g).Since s, δ, n, and g are constant, this means that the ratio k/y is also constant. Since k/y = [K/(L* E)]/[Y/(L* E)] = K/Y, we can conclude that in the steady state, thecapital-output ratio is constantb)Capital and labor each earn a constant share of an economy’s income.We know that capital’s share of income =MPK (K/Y). In the steady state, we know from part (a) that the capital-output ratio K/Y is constant. We also know that the MPK is a function of k, which is constant in the steady state; therefore the MPK itself must be constant. Thus, capital’s share of income is constant. Labor’s share of income is 1 -[capital’s share]. Hence, if capital’s share is constant, we see that labor’s share ofincome is also constantc)Total capital income and total labor income both grow at the rate of populationgrowth plus the rate of technological progress, n + g.We know that in the steady state, total income grows at n + g--the rate of population growth plus the rate of technological change. In part (b) we showed that labor’s and capital’s share of income is constant. If the shares are constant, and total incomegrows at the rate n + g, then labor income and capital income must also grow at the rate n + g.d)The real rental price of capital is constant, and the real wage grows at the rate oftechnological progress g.Define the real rental price of capital R as:R = Total Capital Income/Capital Stock= (MPK *K)/K= MPK.We know that in the steady state, the MPK is constant because capital per effective worker k is constant. Therefore, we can conclude that the real rental price of capital is constant in the steady state.Output is divided between capital income and labor income. Therefore, the wage per efficiency unit of labor can be expressed as:w = f(k) –MPK • k.In the steady state, f(k), MPK and k are all constant numbers because capital per effective worker k is constant. Therefore, the wage per efficiency unit of labor is constant. The wage per unit of labor is related to the wage per efficiency unit of labor by the equationWage per Unit of L = wE.Thus, the growth rate of real wage equals the growth rate of E, g.3.The country of Leverett is a small open economy. Suddenly, a change in world fashionsmakes the exports of Leverett unpopular. (10 points)a)What happens in Leverett to saving, investment, net exports, the interest rate, and theexchange rate?When Le verett’s exports become less popular, its domestic saving Y – C – G does not change. This is because we assume that Y is determined by the amount of capital and labor, consumption depends only on disposable income, and government spending is a fixed exogenous variable. Investment also does not change, since investment depends on the interest rate, and Leverett is a small open economy that takes the world interest rate as given. Because neither saving nor investment changes, net exports, which equal S – I, do not change either. This is shown in the Figure as the unmoving S – I curve.The decreased popularity of Leverett’s exports leads to a shift inward of the net exports curve, as shown in the Figure. At the new equilibrium, net exports are unchanged but the currency has depreciated.Even though Leverett’s exports are less popular, its trade balance has remained the same. The reason for this is that the depreciated currency provides a stimulus to net exports, which overcomes the unpopularity of its exports by making them cheaper.b)The citizens of Leverett like to travel abroad. How will this change in the exchangerate affect them?Leverett’s currency now buys less foreign currency, so traveling abroad is more expensive. This is an example of the fact that imports (including foreign travel) have become more expensive—as required to keep net exports unchanged in the face of decreased demand for exports.c)The fiscal policymakers of Leverett want to adjust taxes to maintain the exchange rateat its previous level. What should they do? If they do this, what are the overall effects on saving, investment, net exports, and the interest rate?If the government reduces taxes, then disposable income and consumption rise. Hence, saving falls so that net exports also fall. This fall in net exports puts upward pressure on the exchange rate that offsets the decreased world demand. Investment and the interest rate would be unaffected by this policy since Leverett takes the world interest rate as given.4.Consider an economy with the following Cobb-Douglas production function:Y=K1/3L2/3The economy has 1000 units of capital and a labor force of 1000 workers.a)Derive the equation describing labor demand in this economy as a function of the realwage and the capital stockThe demand for labor is determined by the amount of labor that profit-maximizing firm wants to hire at a given real wage. The profit-maximizing condition is that the firm hire labor until the marginal product of labor equals the real wage,MPL = W/PThe marginal product of labor is found by differentiating the production functionwith respect to laborMPL=dY=d(K1/3L2/3)=2K1/3L−1/3In order to solve for labor demand, we set the MPL equal to the real wage and solve for L:2 3K1/3L−1/3=WP=>L=827K(WP)−3Notice that this expression has the intuitively desirable feature that increases in the real wage reduce the demand for labor.b)If the real wage can adjust to equilibrate labor supply and labor demand, what is thereal wage? In this equilibrium, what are employment, output, and the total amountearned by workers?We assume that the 1,000 units of capital and the 1,000 units of labor are supplied inelastically (i.e., they will work at any price). In this case we know that all 1,000 units of each will be used in equilibrium, so we can substitute them into the above labor demand function and solve for W/P.1000=8271000(WP)−3→WP=23In equilibrium, employment will be 1,000, and multiplying this by 2/3 we find that the workers earn 667 units of output. The total output is given by the production function:Y=K1/3L2/3=10001/310002/3=1000Notice that workers get two-thirds of output, which is consistent with what we know about the Cobb–Douglas production function from the appendix to Chapter 3.c)Now suppose that Congress, concerned about the welfare of the working class, passes alaw requiring firms to pay worker a real wage of 1 unit of output. How does this wage compare to the equilibrium wage?The congressionally mandated wage of 1 unit of output is above the equilibrium wage of 2/3 units of output.d)Congress cannot dictate how many workers firms hire at the mandated wage. Given thisfact, what are the effects of this law? Specifically, what happens to employment, output, and the total amount earned by workers?Firms will use their labor demand function to decide how many workers to hire at the given real wage of 1 and capital stock of 1,000: L=(8/27)1000(1)-3=296, so 296 workers will be hired for a total compensation of 296 units of output.e)Will Congress succeed in its goal of helping the working class? Explain.The policy redistributes output from the 704 workers who become involuntarilyunemployed to the 296 workers who get paid more than before. The lucky workersbenefit less than the losers lose as the total compensation to the working class falls from 667 to 296 units of output.5.Suppose we know that workers tend to receive 70% of all the income earned inGermany, that the German depreciation rate is 10%, and that there is no populationgrowth or technological progress. Suppose we CANNOT assume the productionfunction in Germany takes the convenient Cobb-Douglas form, but we can assume that whatever the production function is, it has constant returns to scale, that the only two factors of production are capital and labor, that markets are competitive, and that firms maximize profits. Using just this information, compute what saving rate Germanyshould try to have, if it wants to enjoy the maximum amount of consumption per person in steady state (that is, to achieve the golden rule)As the optimal point, the solution must satisfy the golden rule condition: MPK = δ.(1) Second, as a steady state, it must satisfy: sy* = δk*. (2) Also, using Euler’s theorem we know the share of income going to capital is1 – 0.70 = 0.30This is useful, because this share may be written as: MPK * K / Y So we know a third condition here: MPK(k*/y)= 0.30 (3) Combining conditions (1) and (2): s = MPK k*/y*And then using condition (3): s = 0.3。
中级宏观经济学(伯南克版)第二章参考答案

Answers to Textbook ProblemsReview Questions1. The three approaches to national income accounting are the product approach, theincome approach, and the expenditure approach. They all give the same answer because they are designed that way; any entry based on one approach has an entry in the other approaches with the same value. Whenever output is produced and sold, its production is counted in the product approach, its sale is counted in the expenditure approach, and the funds received by the seller are counted in the income approach.2. Goods are measured at market value in GDP accounting so that different types of goodsand services can be added together. Using market prices allows us to count up the total dollar value of all the economy’s output. T he problem with this approach is that not all goods and services are sold in markets, so we may not be able to count everything.Important examples are homemaking and environmental quality.3. Intermediate goods and services are used up in producing other goods in the same period(year) in which they were produced, while final goods and services are those that arepurchased by consumers or are capital goods that are used to produce future output. The distinction is important, because we want to count only the value of final goods produced in the economy, not the value of goods produced each step along the way.4. GNP is the market value of final goods and services newly produced by domestic factorsof production during the current period, whereas GDP is production taking place within a country.Thus, GNP differs from GDP when foreign factors are used to produce output in acountry, or when domestic factors are used to produce output in another country. GDP = GNP – NFP, where NFP = net factor payments from abroad, which equals income paid to domestic factors of production by the rest of the world minus income paid to foreign factors of production by the domestic economy. A country that employs many foreign workers will likely have negative NFP, so GDP will be higher than GNP.5. The four components of spending are consumption, investment, government purchases,and net exports. Imports must be subtracted, because they are produced abroad and we want GDP to count only those goods and services produced within the country. Forexample, suppose a car built inJapan is imported into the United States. The car counts as consumption spending in U.S.GDP, but is subtracted as an import as well, so on net it does not affect U.S. GDP.However, it is counted in Japan’s GDP as an export.6. Private saving is private disposable income minus consumption. Private disposableincome is total output minus taxes paid plus transfers and interest received from thegovernment. Private saving is used to finance investment spending, the governmentbudget deficit, and the current account.National saving is private saving plus government saving.7. National wealth is the total wealth of the residents of a country, and consists of itsdomestic physical assets and net foreign assets. Wealth is important because the long-run economic well-being of a country depends on it. National wealth is related to national saving because national saving is the flow of additions to the stock of national wealth.8. Real GDP is the useful concept for figuring out a country’s growth performance.Nominal GDP may rise because of increases in prices rather than growth in real output.9. The CPI is a price index that is calculated as the value of a fixed set of consumer goodsand services at current prices divided by the value of the fixed set at base-year prices.CPI inflation is the growth rate of the CPI. CPI inflation overstates true inflation because it is hard to measure changes in quality, and because t he price index doesn’t account for substitution away from goods that become relatively more expensive towards goods that become relatively cheaper.10. The nominal interest rate is the rate at which the nominal (or dollar) value of an assetincreases over time. The real interest rate is the rate at which the real value or purchasing power of an asset increases over time, and is equal to the nominal interest rate minus the inflation rate. The expected real interest rate is the rate at which the real value of an asset is expected to increase over time. It is equal to the nominal interest rate minus the expected inflation rate. The concept that is most important to borrowers and lenders is the expected real interest rate, because it affects their decisions to borrow or lend.Numerical Problems1. GDP is the value of all final goods and services produced during the year. The finaloutput of coconuts is 1000, which is worth 500 fish, because two coconuts are worth one fish. Of the 500 fish caught during the year, the 100 fish used as fertilizer are anintermediate good, so the final output is 400 fish. So in terms of fish, GDP consists of 500 fish worth of coconuts plus 400 fish, with a total value of 900 fish.To find consumption and investment, we must find out what happens to all the coconuts and fish. Gilligan consumes all his 200 coconuts (worth 100 fish) and 100 fish, so hisconsumption is worth 200 fish. The Professor stores 100 coconuts with a value of 50 fish.In an ideal accounting system, these stored coconuts would be treated as investment.However, in the national income accounts, because it is so difficult to tell when durable goods are consumed and when they are saved, they are counted as consumption. So the Professor’s consumption consists of 800 co conuts (value 400 fish) and 300 fish, for atotal value of 700 fish. Thus the economy’s total consumption is valued at 900 fish and investment is zero.In terms of income, Gilligan’s income is clearly worth 200 fish (100 fish plus 200coconuts worth 100 f ish). The Professor’s income is less easily calculated, because he uses 100 fish to fertilize the coconut trees. These 100 fish are therefore not income tohim. Thus the Professor’s income is800 coconuts (1000 coconuts minus the 200 coconuts paid to Gilligan) plus 300 fish(500 fish minus 100 fish paid to Gilligan and minus 100 fish used as fertilizer). In terms of fish, the Professor’s income has a value of 700 fish.This question illustrates some of the nuances of national income accounting. Manydifficult choices and measurement issues are involved in constructing the accounts. Here, for example, it is clear that what we call consumption really isn’t just the amount ofgoods consumers use up during the year, but also includes consumption goods that are purchased but saved for the future. Since there is no way to measure when goods areused after they are purchased, the accounts are unable to distinguish consumption from storage of goods.Another subtlety is the treatment of the fish used as fertilizer. If the fertilizer increases future output rather than current output, then the fertilizer is not used up during the year and represents investment of 100 fish. In this case, GDP would equal 1000 fish,consumption is 900 fish, investment is 100 fish, the Pr ofessor’s income is 800 fish, and Gilligan’s income is 200 fish.2. (a) Furniture made in North Carolina that is bought by consumers counts asconsumption,so consumption increases by $6 billion, investment is unchanged, governmentpurchases are unchanged, net exports are unchanged, and GDP increases by $6billion.(b) Furniture made in Sweden that is bought by consumers counts as consumption andimports,so consumption increases by $6 billion, investment is unchanged, governmentpurchases are unchanged, net exports fall by $6 billion, and GDP is unchanged.(c) Furniture made in North Carolina that is bought by businesses counts as investment,so consumption is unchanged, investment increases by $6 billion, governmentpurchases are unchanged, net exports are unchanged, and GDP increases by $6billion.(d) Furniture made in Sweden that is bought by businesses counts as investment andimports,so consumption is unchanged, investment increases by $6 billion, governmentpurchases are unchanged, net exports decline by $6 billion, and GDP is unchanged.3. (a) ABC produces output valued at $2 million and has total expenses of $1.3 million ($1million for labor, $0.1 million interest, $0.2 million taxes). So its profits are $0.7million. XYZ produces output valued at $3.8 million ($3 million for the threecomputers that were sold, plus $0.8 million for the unsold computer in inventory)and has expenses of $3.2 million ($2 million for components, $0.8 million for labor,and $0.4 million for taxes). So its profits are $0.6 million.According to the product approach, the GDP contributions of these companies are$3.8 million, the value of the final product of XYZ. ABC’s production is of anintermediate good, used completely by XYZ, and so is not counted in GDP.According to the expenditure approach, the GDP contribution is also $3.8 million,with$3 million (of sold computers) adding to the capital stock (as investment spending),and $0.8 million (the unsold computer) as inventory investment.The income approach yields the same GDP total contribution. The amounts are:ABC XYZ TOTAL Labor $1.0 million $0.8 million $1.8 millionProfit $0.7 million $0.6 million $1.3 millionTaxes $0.2 million $0.4 million $0.6 millionInterest $0.1 million $0.0 million $0.1 millionTotal of all incomes $3.8 million(b) If ABC pays an additional $.5 million for computer chips from abroad, the resultschange slightly. The correct answer is easiest to see using the expenditure approach.As in part a, there is $3.8 million spent on final goods, but now there are also netexports of –$0.5 million. So the total expenditure on domestically produced goods isonly $3.3 million. The product approach gets the same answer because the $0.5million is a contribution to GDP of the country in which the chips were made, and so must be deducted from the GDP of the United States. The value added in the UnitedStates is only $3.3 million. Finally, the income approach gives the same answer as inpart a, except that the cost of importing the chips reduces ABC’s profits by $0.5million, so the sum of the incomes is only $3.3 million.4. (a) Product approach: $2 =gas station’s value added = $28 product minus $26 value ofproduct produced in the previous year. Expenditure approach: $2 = $28 consumptionspending plus inventory investment of –$26. Income approach: $2 paid to the factors of production at the gas station (wages of employees, interest, taxes, profits).(b) Product approach: $60,000 broker’s fee for providing brokerage services.Expenditure approach: $60,000 counts as residential investment made by thehomebuyer. The important point here is that the transfer of an existing good, even ata higher value than that at which it was originally sold, does not add to GDP. Incomeapproach: $60,000 income to the broker for wages,profits, etc.(c) Product approach: $40,000 salary plus $16,000 childcare equals $56,000. Note thatthere is a sense in which the childcare is an intermediate service and should not becounted, because without it the homemaker would not be able to work. But inpractice there is no way to separate such intermediate services from final services, so they are all added to GDP. Expenditure approach: $56,000 ($16,000 consumptionspending on child care services plus $40,000 in categories that depend on what jobthe homemaker has). Income approach: $56,000 ($40,000 compensation ofhomemaker plus $16,000 income to the factors producing the child care: employees’wages, interest, taxes, profits).(d) Product approach: $100 million of a capital good. Since it is produced with locallabor and materials, and assuming no payments go to Japanese factors of production,this is all added to U.S. GDP. Expenditure approach: $100 million net exports, sincethe plant is owned by the Japanese. (It is not part of gross domestic investmentbecause the plant is not a capital good owned by U.S. residents.) Income approach:$100 million paid to U.S. factors of production.(e) Product approach: $0 because nothing is produced. Expenditure approach: $0because this is a transfer, not a government purchase of goods or services. Incomeapproach: $0, because this is not a payment to a factor of production, just a transfer.(f) Product approach: $5,000 worth of advertising services. Expenditure approach:$5,000 of government purchases. Income approach: $5,000 compensation ofemployees.(g) Product approach: $120 million composed of $100 million of new cars producedplus $20 million of sales services provided by the consortium ($60 million salesprice minus $40 million cost). Expenditure approach: $100 million by Hertz asinvestment plus $60 million by the public for consumption of the used cars minus$40 million of investment goods sold by Hertz, for a total of $120 million. Incomeapproach: $100 million to the factors of production of GM plus $20 million inpayments to the factors of production and profits for the consortium.5. Given data: I= 40, G= 30, GNP= 200, CA=–20 =NX+NFP, T =60, TR= 25, INT=15, NFP=7 –9 =–2. Since GDP=GNP–NFP, GDP= 200 – (–2) = 202 =Y. Since NX+NFP=CA,NX=CA–NFP=–20 – (–2) =–18. Since Y=C+I+G+NX, C=Y– (I+G+NX) = 202 – (40 + 30 + (–18)) = 150.S pvt= (Y+NFP – T+TR+INT) –C= (202 + (–2) – 60 + 25 + 15) –150 = 30. S govt= (T –TR–INT) –G= (60 – 25 – 15) – 30 =–10. S=S pvt+S govt= 30 + (–10) = 20.(a) Consumption = 150(b) Net exports =–18(c) GDP = 202(d) Net factor payments from abroad =–2(e) Private saving = 30(f) Government saving =–10(g) National saving = 206.Base-year quantities at current-year prices at base-year pricesApples 3000 ⨯ $3 =$ 9,0003000 ⨯ $2 = $ 6,000Bananas 6000 ⨯ $2 = $12,000 6000 ⨯ $3 = $18,000 Oranges 8000 ⨯ $5 = $40,000 8000 ⨯ $4 = $32,000 Total $61,000 $56,000 Current-year quantities at current-year prices at base-year prices Apples 4,000 ⨯ $3 = $ 12,000 4,000 ⨯ $2 = $ 8,000 Bananas 14,000 ⨯ $2 = $ 28,000 14,000 ⨯ $3 = $ 42,000 Oranges 32,000 ⨯ $5 =$160,00032,000 ⨯ $4 = $128,000Total $200,000$178,000(a) Nominal GDP is just the dollar value of production in a year at prices in that year.Nominal GDP is $56 thousand in the base year and $200 thousand in the currentyear. Nominal GDP grew 257% between the base year and the current year:[($200,000/$56,000) – 1] ⨯ 100% = 257%.(b) Real GDP is calculated by finding the value of production in each year at base-yearprices.Thus, from the table above, real GDP is $56,000 in the base year and $178,000 in thecurrent year. In percentage terms, real GDP increases from the base year to thecurrent year by[($178,000/$56,000) – 1] ⨯ 100% = 218%.(c) The GDP deflator is the ratio of nominal GDP to real GDP. In the base year,nominal GDP equals real GDP, so the GDP deflator is 1. In the current year, theGDP deflator is $200,000/$178,000 = 1.124. Thus the GDP deflator changes by[(1.124/1) – 1] ⨯ 100% = 12.4% from the base year to the current year.(d) Nominal GDP rose 257%, prices rose 12.4%, and real GDP rose 218%, so most ofthe increase in nominal GDP is because of the increase in real output, not prices.Notice that the quantity of oranges quadrupled and the quantity of bananas morethan doubled.7. Calculating inflation rates:1929–30: [(50.0/51.3) – 1] ⨯ 100% =–2.5%1930–31: [(45.6/50.0) – 1] ⨯ 100% =–8.8%1931–32: [(40.9/45.6) – 1] ⨯ 100% =–10.3%1932–33: [(38.8/40.9) – 1] ⨯ 100% = –5.1%These all show deflation (prices are declining over time), whereas recently we have had nothing but inflation (prices rising over time).8. The nominal interest rate is [(545/500) – 1] ⨯ 100% = 9%. The inflation rate is [(214/200)– 1] ⨯ 100% = 7%. So the real interest rate is 2% (9% nominal rate – 7% inflation rate).Expected inflation was only [(210/200) – 1] ⨯ 100% = 5%, so the expected real interest rate was 4% (9% nominal rate – 5% expected inflation rate).9. (a) The annual rate of inflation from January 1, 2005, to January 1, 2007, is 10%. Thiscan be found by calculating the constant rate of inflation that would raise the deflator from 200 to 242 in two years. This gives the equation (1 +π)(1 +π) = (242/200),which has the solution π= 10%.An easy way to think about this question is this. A constant inflation rate of π raisesthe deflator from 200 on January 1, 2005, to 200 ⨯ (1 +π) on January 1, 2006, and to200 ⨯ (1 +π) ⨯ (1 +π) = 242 on January 1, 2007. So we need to solve the expression(1 +π)2= 242/200.(b) By similar reasoning, the inflation rate over the three-year period is (1 +π)3=266.2/200,or π= 10%.(c) We can derive a general expression in the same way:1 +π=P1/P01 +π=P2/P1⋅⋅⋅⋅⋅⋅⋅⋅⋅1 +π=P n/P n–1Multiplying all these lines together, we get:(1 +π)n= (P1/P0) ⨯ (P2/P1) ⨯⋅⋅⋅⨯ (P n/P n –1) =P n/P0Analytical Problems1. The key to this question is that real GDP is not the same thing as well-being. People maybe better off even if real GDP is lower; for example, this may occur because theimprovement in the health of workers is more valuable to society than the loss of GDP due to the regulation. Ideally, we would like to be able to compare the costs and benefits of such regulations; they should be put in place if the overall costs (the reduced GDP in this case) are valued less than the overall benefits (the workers’ health).2. National saving does not rise because of the switch to CheapCall because althoughconsumption spending declines by $2 million, so have total expenditures (GDP), which equal total income. Since income and spending both declined by the same amount,national saving is unchanged.3. (a) The problem in a planned economy is that prices do not measure market value.When the price of an item is too low, then goods are really more expensive than their listed price suggests—we should include in their market value the value of timespent by consumers waiting to make purchases. Because the it em’s value exceeds its cost, measured GDP is too low.When the price of an item is too high, goods stocked on the shelves may be valuedtoo highly. This results in an overvaluation of firms’ inventories, so that measuredGDP is too high.A possible strategy for dealing with this problem is to have GDP analysts estimatewhat the market price should be (perhaps by looking at prices of the same goods inmarket economies) and use this ―shadow‖ price in the GDP calculations.(b) The goods and services that people produce at home are not counted in the GDPfigures because they are not sold on the market, making their value difficult tomeasure. One way to do it might be to look at the standard of living relative to amarket economy, and estimate what income it would take in a market economy tosupport that standard of living.4. Under the old definition, old govt S = (T – TR – INT ) – G ; under the new definition, new govt S =(T – TR – INT ) – GCE , where GCE = government consumption expenditures, G = GCE + GI ,and GI = government investment. With those definitions: old govt S = (T – TR – INT ) – G= (T – TR – INT ) – (GCE+ GI )= [(T – TR – INT ) – GCE ]– GI= new govt S – GI .The uses-of-savings identity isS pvt = I + ()old govt -S + CA= I – ()new govt -S GI + CA= I + GI + ()new govt -S + CA .Using data for 2002, the old uses-of-savings identity is (where sd is the statisticaldiscrepancy):S pvt + sd = I + ()old govt -S + CA1595 + (–117) = 1593 + 374 + (–489)1478 = 1478 so the identity holds.The new uses-of-savings identity is:S pvt + sd = I + GI + ()new govt -S + CA1595 + (–117) = 1593 + 352 +22 + (–489)1478 = 1478 so the identity holds.。
宏观经济学课件 研究生+本科生

学习宏观经济学的意义:
•理解经济的变化,每个时代都有自己
的经济问题,收入、物价、失业、财政 预算赤字等。 •预测宏观经济政策对日常生活的影响 •参与经济问题的讨论
Macroeconomics Yu Huixin School of Economics & Management HEBUT 5
经济学的研究方法:建立模型
模型是复杂现实的简化版本,如地球仪 模型的特征: • 抽象性:无足轻重的细节被删除,从而 更准确地显示经济变量之间的关系 • 多样性:不同的模型服务于不同的目的, 没有一个模型能够回答我们所关心的所 有问题
Macroeconomics
Yu Huixin School of Economics & Management HEBUT
税收
财政支出
货币政策
货币供给的扩张与紧缩
Macroeconomics
Yu Huixin School of Economics & Management HEBUT
25
三、宏观经济学的产生和发展
(一) 四个阶段 从经济学史的发展角度看,宏观经济学大体经历了四 个阶段: 17世纪中叶-19 古典宏观经济学阶段 世纪中叶 宏 现代宏观经济学产生的 观 19世纪末-20世纪 准备时期 经 30年代 济 现代宏观经济学产生和发展 学 20世纪30年代的 60年代 发 现代宏观经济学进一步 展 20世纪70年代发展和演化
14
二、宏观经济学研究的主要问题
㈠产出水平
波动与经济周期
•长期看各国实际GDP是不断增长的 •短期看有周期性波动 •本世纪美国经历了19个完整的经济周期 •最严重的一次是大萧条( Great Depression1929-1933)
中级宏观经济学(英文)10-Inflation, Unemployment, and the Phillips Curve
Inflation, Unemployment, and the Phillips Curve
1861-1913 Original Phillips Curve
gw (u u*)
gw
u
Inflation, Unemployment, and the Phillips Curve
①
②
New Keynesian Economics
1.
Small menu costs and AD externalities
How can small menu costs explain recessions? Externalities to price adjustment p↓ P ↓ (M/P) ↑ LM shift outward “AD externality”
New Keynesian Economics
Game theory
Firm 2 Cut price Cut price Firm 1 --- $100 Firm 2 --- $100 Firm 1 --- $70 Firm 2 --- $10 Keep high price Firm 1 --- $10 Firm 2 --- $70 Firm 1 --- $30 Firm 2 --- $30
Firm 1 Keep high price
New Keynesian Economics
When there is multiple equilibria, the optimal equilibrium is not always the result Prisoners’ Dilemma
Confess Confess Both w Keynesian Economics
中级宏观经济学CHAP16

CHAPTER 16
Consumption
slide 18
How C responds to changes in r
C2
如同图表, C1 下降and C2 上升.
然而,it could turn out differently…
r 上升将预算线 围绕 点(Y1,Y2 ) 转动.
B A
Y2 Y1
CHAPTER 16
CHAPTER 16
Consumption
slide 20
Constraints on borrowing
In Fisher’s theory,无论收入发生在第一期还是第二期,
消费者可以通过借贷的方式增加两个时期的消费。 the timing of income is irrelevant: Consumer can borrow and lend across periods.
Notation
Y1, Y2 = income in period 1, 2
C1, C2 = consumption in period 1, 2
S = Y1 - C1 = saving in period 1 (S < 0 if the consumer borrows in period 1)
The slope of the budget line equals -(1+r )
ห้องสมุดไป่ตู้Y2
1
(1+r )
Y1
CHAPTER 16
C1
slide 13
Consumption
Consumer preferences
An indifference curve 表明C1 and C2 所有组合都使得 消费者同等快乐。
ch8A Two-Period Model(中级宏观经济学,香港中文大学)
2) The consumer likes diversity in consumption bundle.
– Corresponds to the consumer’s desire to smooth co, consumer dislikes consuming a lot in a single period and very few in another.
Chapter 8
A Two-Period Model: Consumption-Savings Decision & Ricardian Equivalence
Two-Period Model of the Economy
• In Chapter 8, we will focus on the consumers’ and government’s behavior. Firms’ behavior is reintroduced in Chapter 9. • A consumer’s consumption-savings decision involves a tradeoff between current and future consumption. • By saving, a consumer gives up consumption in exchange for assets in the present, in order to consume more in the future. • The government’s decision concerning the financing of government expenditure, involves a trade-off between current and future taxes.
ofTradePolicy(中级宏观经济学,香港中文大学)-文档资料

Copyright © 2003 Pearson Education, Inc.
Slide 8-3
Introduction
Classification of Commercial Policy Instruments
Commercial Policy Instruments
Trade Contraction
• Modern governments usually prefer to protect domestic
industries through a variety of nontariff barriers, such as:
– Import quotas
– Limit the quantity of imports
• A small country is a country that cannot affect its
terms of trade no matter how much it trades with the rest of the world.
▪ The analytical framework will be based on either of
• In each country, wheat is a competitive industry.
• Suppose that in the absence of trade the price of wheat
at Home exceeds the corresponding price at Foreign.
instruments?
– Who will benefit and who will lose from these trade policy instruments?
亚伯《中级宏观经济学》(第6版)笔记和课后习题详解

亚伯《中级宏观经济学》(第6版)笔记和课后习题详解第一部分导论第1章宏观经济学概述1.1 复习笔记一、宏观经济学的研究内容宏观经济学(macroeconomics)是研究国民经济构成及其运行,以及政府用以调节经济运行的政策。
宏观经济学关注以下六个方面的问题:一国长期经济增长的决定因素是什么?一国经济波动的根源何在?失业产生的原因是什么?引起价格上涨的因素是什么?一国作为全球经济体系的一部分,如何影响其他国家的经济?政府政策能否用来改善一国经济的运行?1.长期经济增长(1)富国与穷国存在差距的原因富国在其历史的某一时点上经历过长期的经济高速增长,而穷国要么从未经历过持续的经济增长,要么其经济增长的成果因随后的经济衰退而损失殆尽。
(2)美国的长期经济增长的原因①人口增加为经济发展提供了源源不断的劳动力。
②给定劳动力数量的条件下劳动所带来的产量的增加。
单位劳动投入(如每位工人或每单位工作时间)所生产的产量被称为平均劳动生产率(average labor productivity)。
(3)经济增长率的决定因素①储蓄率和投资率的增加。
②技术进步率以及其他一些有助于提高机器和工人生产率的因素。
2.经济周期美国产出的增长历程表明:产出的增长路径并不总是平滑的,而是存在谷峰和谷底。
宏观经济学家用经济周期来描绘经济活动的短期收缩与扩张,但一些非常剧烈的收缩与扩张有时并不是经济周期。
经济周期的下降阶段为衰退期,在这一时期国民产出可能下降,也可能以极慢的速度增长。
衰退还是一个重要的政治焦点。
因为对于每个希望再次当选的政治家来说,经济在任期间内处于繁荣期(而不是衰退期)将使其再次当选的把握更大。
3.失业经济衰退往往伴随着失业(unemployment)。
失业是指有能力工作并正在积极寻找工作但未能找到工作的劳动者数目。
失业率是用来衡量失业最常见的指标,其计算公式为失业人口除以总劳动力人口,其中总劳动力人口指正在工作或正在寻找工作的劳动者的总数目。
港中文econ的class size

港中文econ的class size一、概述1. 港中文econ经济学课程的重要性港中文econ课程是香港中文大学(The Chinese University of Hong Kong)经济与金融学系(Department of Economics and Finance)的核心课程之一,针对本科生开设。
该课程旨在帮助学生掌握经济学的基本理论和实际应用,培养学生的分析和解决问题的能力,为他们未来的学术研究和职业发展打下坚实基础。
二、港中文econ的class size2. 大班授课的挑战随着香港中文大学经济与金融学系对本科生招生人数的增加,经济学课程所面临的一个重要问题是班级规模的增加。
大班授课给教师和学生带来了诸多挑战。
大班授课增加了教师的负担,他们需要投入更多的时间和精力来准备课堂教学和批改作业。
对学生来说,大班授课可能降低了他们的学习效果,因为在大班内,教师难以对每个学生进行个性化指导。
3. 小班授课的优势与大班授课相比,小班授课有着明显的优势。
小班授课可以提供更多的互动机会,教师可以更好地了解每个学生的学习需求,并及时进行调整和帮助。
小班授课可以激发学生的学习兴趣和积极性,因为学生有更多的机会参与到课堂讨论和互动中。
三、港中文econ的课程形式4. 目前的课程设置目前,港中文econ课程的教学方式主要是以大班授课为主,配合一定的小组讨论和作业辅导。
这种课程设置虽然可以满足较大班级的教学需求,但也存在一些问题。
学生的个性化学习需求无法得到充分关注,教学效果有限。
5. 改进的建议针对目前课程设置存在的不足,港中文econ课程可以考虑引入小班授课的形式。
具体来说,对于一些重要的课程,可以将班级分割成小班,每个小班由一名教师负责教学。
这样一来,老师可以更好地与学生互动,学生也能够得到更多的个性化指导。
四、改进措施的实施6. 教师队伍的培训如果港中文econ课程要引入小班授课的形式,那么首先需要对课程教师进行相应的培训。
MacroModel(中级宏观经济学,香港中文大学)

Graphical Illustrations
Step 1: Derive the production possibilities frontier ( PPF ), which describes the technological possibilities for the entire economy, in terms of the production of C and l.
is satisfied.
zF2 K, N d w
3) Market-clearing conditions:
– Labor market clearing Ns = Nd = N
4) Balanced Budget constraint: G = T.
We have: Goods market clearing Y = C + G
Production Possibilities Frontier
• Negative of the slope of the PPF is called the marginal rate of transformation, MRT l,C which is the rate at which one good can be converted into another.
max U( C, h-Ns )
C, Ns
subject to and
C = wNs + - T C 0 , Ns 0.
In other words, C and Ns must satisfy the FOC,