Statistics for Business:Statistical Tests
统计学在现代企业管理中的应用
统计学在现代企业管理中的应用英文回答:Statistics play a vital role in modern business management by providing valuable insights and enablingdata-driven decision-making. Here are some key applications of statistics in this field:1. Data Analysis: Statistics help businesses analyze large datasets and identify trends, patterns, and relationships. This information can be used to gain a deeper understanding of customers, market dynamics, and operational efficiency.2. Hypothesis Testing: Statistical methods allow businesses to test hypotheses and make inferences about their population based on sample data. This helps in assessing the effectiveness of marketing campaigns, product launches, and other initiatives.3. Forecasting and Prediction: Statistics enable businesses to make informed predictions about future outcomes based on historical data. This is crucial for planning, budgeting, and managing risk.4. Risk Management: Statistical techniques are used to quantify and mitigate risks in various aspects of business operations, such as financial planning, supply chain management, and project management.5. Quality Control: Statistics are essential for monitoring and maintaining product and service quality. Statistical process control (SPC) techniques help identify and reduce defects, ensuring customer satisfaction.6. Inventory Management: Statistical methods assist in optimizing inventory levels to minimize costs and avoid stockouts. These techniques help determine optimal reorder points, safety stock levels, and lead times.7. Customer Segmentation: Statistics help businesses divide their customer base into distinct segments based ondemographics, behavior, and preferences. This enables targeted marketing and personalized experiences.8. Performance Measurement: Statistical tools are used to measure and evaluate key performance indicators (KPIs) such as profitability, market share, and customer satisfaction. This information helps businesses track progress and identify areas for improvement.中文回答:统计学在现代企业管理中的应用。
商务与经济统计 第14版 Ch21 Statistical Methods
4
Statistics for Business and Economics (14e, Metric Version)
control • Constructed a diagram that would now be recognized as a statistical control chart • Brought together the disciplines of statistics, engineering, and economics and
5
Statistics for Business and Economics (14e, Metric Version)
Quality Philosophies (1 of 4)
Dr. Walter A. Shewhart • Developed a set of principles that are the basis for what is known today as process
ability to satisfy given needs.” • Organizations recognize that they must strive for high levels of quality. • They have increased the emphasis on methods for monitoring and maintaining quality.
1
Statistics for Business and Economics (14e, Metric Version)
《Business statistic》复习参考(第一章至第八章)

《Business Statistic》中国人民大学出版社英文版第五版chapter1~8复习参考Part1名词解释1、Statistics is a method of extracting useful information from a set of numerical data in orderto make a more effective and informed decision.2、Descriptive Statistics:These are statistical methods of organizing, summarizing andpresenting numerical data in convenient forms such as graphs, charts and tables.3、Inferential statistics is defined as statistical methods used for drawing conclusions about apopulation based on samples.4、Primary data is obtained first hand.5、Secondary data already exists or has been previously collected such as company accounts, orsales figures.6、Mean: The arithmetic average and the most common measure ofaaaaaaa central tendency.①All values are included in computing the mean.②A set of data has a unique mean ③Themean is affected by unusually large or small data points (outliers / extreme values).7、*8、Mode: The most frequent data, or data corresponding to the highest frequency. ①Mode isnot affected by extreme values. ②There may not be a mode. ③There may be several modes. ④Used for either numerical or categorical data.9、Median is the value that splits a ranked set of data into two equal parts. ①Median is notaffected by extremely large or small values and is therefore a valuable measure of central tendency when such values occur.10、Standard Deviation: ①A measure of the variation of data from the mean. ②The mostcommonly used measure of variation. ③Represented by the symbol ‘s’. ④Shows how the data is distributed around the mean.11、Probability is the chance of an occurrence of an event. ①Probability of an eventalways lies between 0 and 1. ②The sum of the probabilities of every possible outcome or event is 1. ③The probability of the complement A’ is given by 1-P(A).12、Properties of Normal distribution:①Continuous random variable. ②‘Bell-shaped’ &symmetrical. ③Mean, median, mode are equal ④Area under the curve is 1.13、The Central Limited Theorem:①If the population followed normal distribution, thesampling distribution of mean is followed normal distribution. ②If the population do not followed normal distribution, but the sample size is larger than 30, the sampling distribution of mean is followed normal distribution.Part2选择题Topic 1 - Introduction to Business Statistics & Data CollectionQ1. The universe or totality of items or things under consideration is called:a.【b. a sample.c. a population.d. a parameter.e.none of the above.Q2. Those methods involving the collection, presentation, and characterization of a set of data in order to properly describe the various features of that set of data are called:a.inferential statistics.b.total quality management.c.sampling.d.descriptive statistics.Q3. The portion of the universe that has been selected for analysis is called:a.—b. a sample.c. a frame.d. a parameter.e. a statistic.Q4. A summary measure that is computed to describe a numerical characteristic from only a sample of the population is called:a. a parameter.b. a census.c. a statistic.d.the scientific method.Q5. A summary measure that is computed to describe a characteristic of an entire population is called:a.)b. a parameter.c. a census.d. a statistic.e.total quality management.Q6. The process of using sample statistics to draw conclusions about population parameters is called:a.inferential statistics.b.experimentation.c.primary sources.d.descriptive statistics.Q7. Which of the four methods of data collection is involved when a person retrieves data from an online databasea.(b.published sources.c.experimentation.d.surveying.e.observation.Q8. Which of the four methods of data collection is involved when people are asked to complete a questionnairea.published sources.b.experimentation.c.surveying.d.observation.Q9. Which of the four methods of data collection is involved when a person records the use of the Los Angeles freeway systema.@b.published sources.c.experimentation.d.surveying.e.observation.Q10. A focus group is an example of which of the four methods of data collectiona.published sources.b.experimentation.c.surveying.d.observation.Q11. Which of the following is true about response ratesa.】b.The longer the questionnaire, the lower the rate.c.Mail surveys usually produce lower response rates than personal interviews or telephonesurveys.d.Question wording can affect a response rate.e. d. All of the above.Q12. Which of the following is a reason that a manager needs to know about statisticsa.To know how to properly present and describe information.b.To know how to draw conclusions about the population based on sample information.c.To know how to improve processes.d.All of the above.~Scenario 1-1Questions 13-15 refer to this scenario:An insurance company evaluates many variables about a person before deciding on an appropriate rate for automobile insurance. Some of these variables can be classified as categorical, discrete and numerical, or continuous and numerical.Q13. Referring to Scenario 1-1 (above), the number of claims a person has made in the last three years is what type of variablea.Categorical.b.Discrete and numerical.c.Continuous and numerical.d.None of the above.Q14. Referring to Scenario 1-1 (above), a person's age is what type of variablea.—b.Categorical.c.Discrete and numerical.d.Continuous and numerical.e.None of the above.Q15. Referring to Scenario 1-1 (above), a person's gender is what type of variablea.Categorical.b.Discrete and numerical.c.Continuous and numerical.d.None of the above.{Q16. Which of the following can be reduced by proper interviewer traininga.Sampling error.b.Measurement error.c.Coverage error.d.Nonresponse error.Scenario 1-2Questions 17-19 refer to this scenario:Mediterranean fruit flies were discovered in California a few years ago and badly damaged the oranges grown in that state. Suppose the manager of a large farm wanted to study the impact of the fruit flies on the orange crops on a daily basis over a 6-week period. On each day a random sample of orange trees was selected from within a random sample of acres. The daily average number of damaged oranges per tree and the proportion of trees having damaged oranges were calculated.,Q17. Referring to Scenario 1-2 (above), the two main measures calculated each day ., average number of damaged oranges per tree and proportion of trees having damaged oranges) are called _______.a.statistics.b.parameters.c.samples.d.populations.Q18. Referring to Scenario 1-2 (above), the two main measures calculated each day ., average number of damaged oranges per tree and proportion of trees having damaged oranges) may be used on a daily basis to estimate the respective true population _______.a.estimates.b.parameters.c.statistics.d.frame.(Q19. Referring to Scenario 1-2 (above), in this study, drawing conclusions on any one day about the true population characteristics based on information obtained from the sample is called _______.a.evaluation.b.descriptive statistics.c.inferential statistics.d.survey.Scenario 1-3Questions 20 and 21 refer to this scenario:The Quality Assurance Department of a large urban hospital is attempting to monitor and evaluate patient satisfaction with hospital services. Prior to discharge, a random sample of patients is asked to fill out a questionnaire to rate such services as medical care, nursing, therapy, laboratory, food, and cleaning. The Quality Assurance Department prepares weekly reports that are presented at the Board of Directors meetings and extraordinary/atypical ratings are easy to flag.、Q20. Referring to Scenario 1-3 (above), true population characteristics estimated from the sample results each week are called _____________.a.inferences.b.parameters.c.estimates.d.data.Q21. Referring to Scenario 1-3 (above), a listing of all hospitalised patients in this institution over a particular week would constitute the ________.a.sample.b.population.c.statistics.d.parameters.`Scenario 1-4Questions 22-24 refer to this scenario:The following are the questions given to Sheila Drucker-Ferris in her college alumni association survey. Each variable can be classified as categorical or numerical, discrete or continuous.Q22. Referring to Scenario 1-4 (above), the data for the number of years since graduation is categorised as: __________________.a.numerical discrete.b.categorical.c.numerical continuous.d.none of the above.:Q23. Referring to Scenario 1-4 (above), the data for the number of science majors is categorised as: ____________.a.categorical.b.numerical continuous.c.numerical discrete.d.none of the above.Q24. Referring to Scenario 1-4 (above), the data for tabulating the level of job satisfaction (High, Moderate, Low) is categorised as: _________.a.numerical continuous.b.categorical.c.numerical discrete.d.none of the above.'Topic 2: Organising and Presenting dataQ1 The width of each bar in a histogram corresponds to the:a.boundaries of the classes.b.number of observations in the classes.c.midpoint of the classes.d.percentage of observations in the classes.Q2 When constructing charts, which of the following chart types is plotted at the class midpointsa.Frequency histograms.b.Percentage polygons.c.$d.Cumulative relative frequency ogives.e.Relative frequency histograms.Q3 When polygons or histograms are constructed, which axis must show the true zero or "origin"a.The horizontal axis.b.The vertical axis.c.Both the horizontal and vertical axes.d.Neither the horizontal nor the vertical axis.Q4 To determine the appropriate width of each class interval in a grouped frequency distribution, we:a.divide the range of the data by the number of desired class intervals.b.divide the number of desired class intervals by the range of the datac.】d.take the square root of the number of observations.e.take the square of the number of observations.Q5 When grouping data into classes it is recommended that we have:a.less than 5 classes.b.between 5 and 15 classes.c.more than 15 classes.d.between 10 and 30 classes.Q6 Which of the following charts would give you information regarding the number of observations "up to and including" a given groupa.Frequency histograms.b.Polygons.c.}d.Percentage polygons.e.Cumulative relative frequency ogives.Q7 Another name for an "ogive" is a:a.frequency histogram.b.polygon.c.percentage polygon.d.cumulative percentage polygon.Q8 In analyzing categorical data, the following graphical device is NOT appropriate:a.bar chart.b.Pareto diagram.c.!d.stem and leaf display.e.pie chart.Table 2The opinions of a sample of 200 people broken down by gender about the latest congressionalFor Neutral Against】Totals Female385412104Male123648(96 Totals509060200about the latest congressional plan to eliminate anti-trust exemptions for professional baseball. Referring to Table 2, the number of people who are neutral to the plan is _______.a.36b.54c.90d.、e.200Q10 Referring to Table 2, the number of males who are against the plan is _______.a.12b.48c.60d.96Q11 Referring to Table 2, the percentage of males among those who are for the plan is ______.a.%b.24%c.25%d.(e.76%Q12 Referring to Table 2, the percentage who are against the plan among the females is _______.a.%b.20%c.30%d.52%Topic 3: Numerical Descriptive StatisticsQ1 Which measure of central tendency can be used for both numerical and categorical variablesa.Mean.b./c.Median.d.Mode.e.Quartiles.Q2 Which of the following statistics is not a measure of central tendencya.Mean.b.Median.c.Mode.d.Q3.Q3 Which of the following statements about the median is NOT truea.It is more affected by extreme values than the mean.b.\c.It is a measure of central tendency.d.It is equal to Q2.e.It is equal to the mode in bell-shaped distributions.Q4 The value in a data set that appears most frequently is called:a.the median.b.the mode.c.the mean.d.the variance.Q5 In a perfectly symmetrical distribution:a.the mean equals the median.b.,c.the median equals the mode.d.the mean equals the mode.e.All of the above.Q6 When extreme values are present in a set of data, which of the following descriptive summary measures are most appropriatea.CV and range.b.Mean and standard deviation.c.Median and interquartile range.d.Mode and variance.Q7 The smaller the spread of scores around the mean:a.the smaller the interquartile range.b.(c.the smaller the standard deviation.d.the smaller the coefficient of variation.e.All the above.Q8 In a right-skewed distribution:a.the median equals the mean.b.the mean is less than the median.c.the mean is greater than the median.d.the mean is less than the mode.a.b.c.d.Q10 Referring to Table 3 (above), the median carbohydrate amount in the cereal is ________ grams.a.19b.20c.[d.21e.Q11 Referring to Table 3 (above), the 1st quartile of the carbohydrate amounts is ________ grams.a.15b.20c.21d.25Q12 Referring to Table 3 (above), the range in the carbohydrate amounts is ________ grams.a.16b.18c.$d.20e.21Topic 4: Basics probability and discrete probability distributionsInformation A, needed to answer Questions 1 to 2The Health and Safety committee in a large retail firm is examining the relationship between the number of days of sick leave an employee takes and whether an employee works on the day shift (D) or night shift (N). The committee looks at a sample of 50 employees and notes which shiftthey work on and whether the number of days of sick leave they take in a year is less than 6 daysthe values in the table of probabilities is not correcta.The probability of an employee taking 6 or more days of sick leave P(M) isb.The probability that an employee is on the Night Shift (N) and takes less than 6 days ofleave (L), is called a conditional probability P(N | L) =c.)d.If you know that an employee is on day shift (D) then the probability that they will takeless than 6 days of leave (L) is the conditional probability P(L | D) =e.The probability that an employee works Day Shift (D) or takes 6 or more days of leave (M)is found using the addition rule to be P(D or M) =f.They are all correctQ2 The analyst wishes to use the Probabilities table from Information A to determine whether the work shift variable and the number of days of sick leave variable are or are not independent variables. Which of the following statements about the work shift and the number of days of sick leave variables is correcta.These variables are independent because the marginal probabilities such as P(L) are thesame as the conditional probabilities P(L | D)b.These variables are not independent because the marginal probability P(L) is differentfrom the conditional probability P(N | L)c.These variables are not independent because the joint probabilities such as P(L and N)are equal to the product of the probabilities P(L).P(N).d.These variables are dependent because the marginal probabilities such as P(L) are equalto the conditional probability P(L | N)e.None of the above】Information B, needed to answer Question 3Suppose the manager of a home ware retailer decides in a 5-minute period no more than 4 customers can arrive at a counter. Using past records he obtains the following probabilityTable 4-3Arrivals (X)01234~.15.20.30.20.15 P(X)Q3 Use Information B to answer this question. If values are rounded to 3 decimal places which of the following is the correct pair of values for the mean, the variance or standard deviation of the number of arrivals at the counter.a.Mean mu = 2 and variance sigma-squared =b.Mean mu = and variance sigma-squared =c.Mean mu = 2 and standard deviation sigma =d.、e.Mean mu = and variance sigma-squared =f.None of the aboveInformation C, needed to answer Questions 4-6The section manager in an insurance company is interested in evaluating how well staff at the inquiry counter handle customer complaints. She interviews a sample of n = 6 customers who have made complaints and asks each of them whether staff had handled their complaints well. Each interview is called a trial. If a customer says their complaint was handled well this is called a success. She thinks that as long as these people are interviewed independently of each other then the number of people who say their complaint was handled well is a random variable with a Binomial probability distribution. The section manager thinks that the probability that a customers complaint will be handled well is p = .Q4 Use Information C to answer this question. A total of n = 6 people are interviewed independently of each other. Which of the following statements about the probability that 5 out of the 6 complaints will be handled well is correcta.less thanb.between andc.more thand.between ande.`f.None of the aboveQ5 Using Information C, which of the following statements about the probability that 4 or less of the 6 complaints will be handled well is correcta.less thanb.more thanc.between andd.between ande.None of the aboveQ6 Suppose the section manager from Information C is interested in the measures of central tendency and variation for the number of complaints which are handled well. Which of the following sets of values, where values are rounded to 3 decimal places, is the correct set of valuesa.Mean mu = and variance sigma-squared =b.Mean mu = and variance sigma-squared =c.!d.Mean mu = and variance sigma-squared =e.Mean mu = and standard deviation sigma =f.None of the aboveInformation D, needed to answer Questions 7-9The manager of a large retailer thinks that one reason why staff at the complaints counter fail to handle customer complaints well is that not enough staff are allocated to this counter. Past experience has shown that the number of customers who arrive at this counter has a Poisson distribution where the average number who arrive each hour is 36. He decides to look at how many customers are likely to arrive at the complaints counter during a 5-minute period.Q7 Use Information D to answer this question. Which of the following statements concerning the probability that exactly 2 customers will arrive at the counter in a 5-minute period is correcta.less thanb.between andc.between andd.…e.more thanf.None of the aboveQ8 Use Information D to answer this question. Which of the following statements concerning the probability that 3 or more customers will arrive at a counter in a 5-minute period is correcta.between andb.less thanc.more thand.between ande.None of the aboveQ9 The section manager from Information D is interested in the mean and variance of the number of customers who arrive during a 1 hour period. Which of the following is the correct set of values for these two measuresa.Mean mu = 3 and variance sigma-squared = 3b./c.Mean mu = 36 and standard deviation sigma =d.Mean mu = 30 and variance sigma-squared = 30e.Mean mu = 36 and standard deviation sigma = 6f.None of the aboveTopic 5: Normal probability distribution & sampling distributionQ1 Which of the following is not a property of the normal distributiona.It is bell-shaped.b.It is slightly skewed left.c.Its measures of central tendency are all identical.d.%e.Its range is from negative infinity to positive infinity.Q2 The area under the standardized normal curve from 0 to would be:a.the same as the area from 0 to .b.equal to .c.found by using Table in your textbook.d.all of the above.Q3 Which of the following about the normal distribution is not truea.Theoretically, the mean, median, and mode are the same.b.About two-thirds of the observations fall within ± 1 standard deviation from the mean.c.It is a discrete probability distribution.d.(e.Its parameters are the mean and standard deviation.Q4 In its standardized form, the normal distribution:a.has a mean of 0 and a standard deviation of 1.b.has a mean of 1 and a variance of 0.c.has a total area equal to .d.cannot be used to approximate discrete binomial probability distributions.Q5 In the standardized normal distribution, the probability that Z > 0 is _______.a.b.c.d.]e.cannot be found without more informationQ6 The probability of obtaining a value greater than 110 in a normal distribution in which the mean is 100 and the standard deviation is 10 is ______________ the probability of obtaining a value greater than 650 in a normal distribution with a mean of 500 and a standard deviation of 100.a.less thanb.equal to.c.greater thand.It is unknown without more information.Q7 The probability of getting a Z score greater than is ________.a.close tob.c. a negative numberd.%e.almost zeroQ8 For some positive value of Z, the probability that a standardized normal variable is between 0 and Z is . The value of Z isa.b.c.d.Q9 For some value of Z, the probability that a standardized normal variable is below Z is . The value of Z isa.b.c.d.【e.Q10 Given that X is a normally distributed random variable with a mean of 50 and a standard deviation of 2, the probability that X is between 47 and 54 isa.b.c.d.Q11 For some positive value of X, the probability that a standardized normal variable is between 0 and + is . The value of X isa.b.c.d.'e.Q12 The owner of a fish market determined that the average weight for a catfish is pounds with a standard deviation of pounds. A citation catfish should be one of the top 2 percent in weight. Assuming the weights of catfish are normally distributed, at what weight (in pounds) should the citation designation be establisheda.poundsb.poundsc.poundsd.poundsQ13 Which of the following is NOT a property of the arithmetic meana.It is unbiased.b.It is always equal to the population mean.c.Its average is equal to the population mean.d.(e.Its variance becomes smaller when the sample size gets bigger.Q14 The sampling distribution of the mean is a distribution of:a.individual population values.b.individual sample values.c.statistics.d.parameters.Q15 The standard deviation of the sampling distribution of the mean is called the:a.standard error of the sample.b.standard error of the estimate.c.standard error of the mean.d.~e.All of the aboveQ16 According to the central limit theorem, the sampling distribution of the mean can be approximated by the normal distribution:a.as the number of samples gets "large enough."b.as the sample size (number of observations) gets "large enough."c.as the size of the population standard deviation increases.d.as the size of the sample standard deviation decreases.Q17 For a sample size of n=10, the sampling distribution of the mean will be normally distributed:a.regardless of the population's distribution.b.if the shape of the population is symmetrical.c.if the variance of the mean is known.d.{e.if the population is normally distributedTopic 6: EstimationQ1 The interval estimate using the t critical value is ________ than the interval estimate using the z critical value.a.Narrowerb.The same asc.Widerd.More powerfulQ2 To estimate the mean of a normal population with unknown standard deviation using a small sample, we use the ______ distribution.a.'t'b.:c.'Z'd.samplinge.alphaQ3 If the population does not follow a normal distribution, then to use the t distribution to give a confidence interval estimate for the population mean, the sample size should be:a.at least 5b.at least 30c.at least 100d.less than 30Q4 The 'z' value or 't' value used in the confidence interval formula is called the:a.sigma valueb.:c.critical valued.alpha valuee.none of the aboveQ5 The 'z' value that is used to construct a 90 percent confident interval is:a.b.c.d.Q6 The 'z' value that is used to construct a 95 percent confidence interval is:a.b.c.d.Q7 The sample size needed to construct a 90 percent confidence interval estimate for the population mean with sampling error ± when sigma is known to be 10 units is:a.9b.32c.75d.107Q8 The t critical value approaches the z critical value when:a.the sample size decreasesb.the sample size approaches infinityc.the confidence level increasesd.the sample is smallQ9 The t-critical value used when constructing a 99 percent confidence interval estimate with a sample of size 18 is:a.b.c.d.Q10 The t-value that would be used to construct a 90 percent confidence interval for the mean with a sample of size n 36 would be:a.b.c.d.Q11 The value of alpha (two tailed) for a 96 percent confidence interval would be: a.b.c.d.Q12 When using the t distribution for confidence interval estimates for the mean, the degrees of freedom value is:a.nb.n-1c.n-2d.n %2B 1Q13 You would interpret a 90 percent confidence interval for the population mean as:a.you can be 90 percent confident that you have selected a sample whose interval doesinclude the population meanb.if all possible samples are selected and CI's are calculated, 90 percent of those intervalswould include the true population meanc.90 percent of the population is in that intervald.both A and B are trueQ14 From a sample of 100 items, 30 were defective. A 95 percent confidence interval for the proportion of defectives in the population is:a.(.2, .4)b.(.21, .39)c.(.225, .375)d.(.236, .364)Q15 A confidence interval was used to estimate the proportion of statistics students that are male. A random sample of 70 statistics students generated the following 90 percent confidence interval: , . Using the information above, what size sample would be necessary if we wanted to estimate the true proportion to within ± using 95 percent confidencea.240b.450c.550d.150整理人:阿桤。
Business Statistics Chapter01
1.14
Inferential statistics
- The information we would like to acquire in Case 12.1 is an estimate of annual profits from the exclusivity agreement. The data are the numbers of cans of soft drinks consumed in 7 days by the 500 students in the sample. - We want to know the mean number of soft drinks consumed by all 50,000 students on campus. - To accomplish this goal we need another branch of statistics - inferential statistics.
Copyright © 2009 Cengage Learning
1.பைடு நூலகம்5
Inferential statistics
- Inferential statistics is a body of methods used to draw conclusions or inferences about characteristics of populations based on sample data. - The population in question in this case is the soft drink consumption of the university's 50,000 students. The cost of interviewing each student would be prohibitive and extremely time consuming. - Instead, we can sample a much smaller number of students (the sample size is 500) and infer from the data the number of soft drinks consumed by all 50,000 students. We can then estimate annual profits for Pepsi.
Statistics for Business:Introduction

1.2 Previews
Scatterplot of Price Versus Mileage
1.2 Previews
Line and Region of Uncertainty
1.2 Previews
Conclusions
The range of uncertainty is so wide because factors other than mileage affect price This model uses all of the data to answer the question about one used car (borrowing strength) $22,000 isn’t too much to pay (it is less than predicted by our line and within the range)
Patterns and models
1.1 What is Statistics?
Statistics as a Discipline
Science and art of extracting answers from data A statistic is a property of data
Statistics for Business:Introduction
1.1 What is Statistics?
Some Basic Ideas
Statistics as a discipline Questions we can answer with statistics
Variation
1.2 Previews
《Business statistic》复习参考(第一章至第八章)
《Business Statistic》中国人民大学出版社英文版第五版chapter1~8复习参考Part1名词解释1、Statistics is a method of extracting useful information from a set of numerical data in orderto make a more effective and informed decision.2、Descriptive Statistics:These are statistical methods of organizing, summarizing andpresenting numerical data in convenient forms such as graphs, charts and tables.3、Inferential statistics is defined as statistical methods used for drawing conclusions about apopulation based on samples.4、Primary data is obtained first hand.5、Secondary data already exists or has been previously collected such as company accounts, orsales figures.6、Mean: The arithmetic average and the most common measure ofaaaaaaa central tendency.①All values are included in computing the mean.②A set of data has a unique mean ③Themean is affected by unusually large or small data points (outliers / extreme values).7、Mode: The most frequent data, or data corresponding to the highest frequency. ①Mode isnot affected by extreme values. ②There may not be a mode. ③There may be several modes. ④Used for either numerical or categorical data.8、Median is the value that splits a ranked set of data into two equal parts. ①Median is notaffected by extremely large or small values and is therefore a valuable measure of central tendency when such values occur.9、Standard Deviation: ①A measure of the variation of data from the mean. ②The mostcommonly used measure of variation. ③Represented by the symbol ‘s’. ④Shows how the data is distributed around the mean.10、Probability is the chance of an occurrence of an event. ①Probability of an eventalways lies between 0 and 1. ②The sum of the probabilities of every possible outcome or event is 1. ③The probability of the complement A’ is given by 1-P(A).11、Properties of Normal distribution:①Continuous random variable. ②‘Bell-shaped’ &symmetrical. ③Mean, median, mode are equal ④Area under the curve is 1.12、The Central Limited Theorem:①If the population followed normal distribution, thesampling distribution of mean is followed normal distribution. ②If the population do not followed normal distribution, but the sample size is larger than 30, the sampling distribution of mean is followed normal distribution.Part2选择题Topic 1 - Introduction to Business Statistics & Data CollectionQ1. The universe or totality of items or things under consideration is called:a. a sample.b. a population.c. a parameter.d.none of the above.Q2. Those methods involving the collection, presentation, and characterization of a set of data in order to properly describe the various features of that set of data are called:a.inferential statistics.b.total quality management.c.sampling.d.descriptive statistics.Q3. The portion of the universe that has been selected for analysis is called:a. a sample.b. a frame.c. a parameter.d. a statistic.Q4. A summary measure that is computed to describe a numerical characteristic from only a sample of the population is called:a. a parameter.b. a census.c. a statistic.d.the scientific method.Q5. A summary measure that is computed to describe a characteristic of an entire population is called:a. a parameter.b. a census.c. a statistic.d.total quality management.Q6. The process of using sample statistics to draw conclusions about population parameters is called:a.inferential statistics.b.experimentation.c.primary sources.d.descriptive statistics.Q7. Which of the four methods of data collection is involved when a person retrieves data from an online databasea.published sources.b.experimentation.c.surveying.d.observation.Q8. Which of the four methods of data collection is involved when people are asked to complete a questionnairea.published sources.b.experimentation.c.surveying.d.observation.Q9. Which of the four methods of data collection is involved when a person records the use of the Los Angeles freeway systema.published sources.b.experimentation.c.surveying.d.observation.Q10. A focus group is an example of which of the four methods of data collectiona.published sources.b.experimentation.c.surveying.d.observation.Q11. Which of the following is true about response ratesa.The longer the questionnaire, the lower the rate.b.Mail surveys usually produce lower response rates than personal interviews or telephonesurveys.c.Question wording can affect a response rate.d. d. All of the above.Q12. Which of the following is a reason that a manager needs to know about statisticsa.To know how to properly present and describe information.b.To know how to draw conclusions about the population based on sample information.c.To know how to improve processes.d.All of the above.Scenario 1-1Questions 13-15 refer to this scenario:An insurance company evaluates many variables about a person before deciding on an appropriate rate for automobile insurance. Some of these variables can be classified as categorical, discrete and numerical, or continuous and numerical.Q13. Referring to Scenario 1-1 (above), the number of claims a person has made in the last three years is what type of variablea.Categorical.b.Discrete and numerical.c.Continuous and numerical.d.None of the above.Q14. Referring to Scenario 1-1 (above), a person's age is what type of variablea.Categorical.b.Discrete and numerical.c.Continuous and numerical.d.None of the above.Q15. Referring to Scenario 1-1 (above), a person's gender is what type of variablea.Categorical.b.Discrete and numerical.c.Continuous and numerical.d.None of the above.Q16. Which of the following can be reduced by proper interviewer traininga.Sampling error.b.Measurement error.c.Coverage error.d.Nonresponse error.Scenario 1-2Questions 17-19 refer to this scenario:Mediterranean fruit flies were discovered in California a few years ago and badly damaged the oranges grown in that state. Suppose the manager of a large farm wanted to study the impact of the fruit flies on the orange crops on a daily basis over a 6-week period. On each day a random sample of orange trees was selected from within a random sample of acres. The daily average number of damaged oranges per tree and the proportion of trees having damaged oranges were calculated.Q17. Referring to Scenario 1-2 (above), the two main measures calculated each day ., average number of damaged oranges per tree and proportion of trees having damaged oranges) are called _______.a.statistics.b.parameters.c.samples.d.populations.Q18. Referring to Scenario 1-2 (above), the two main measures calculated each day ., average number of damaged oranges per tree and proportion of trees having damaged oranges) may be used on a daily basis to estimate the respective true population _______.a.estimates.b.parameters.c.statistics.d.frame.Q19. Referring to Scenario 1-2 (above), in this study, drawing conclusions on any one day about the true population characteristics based on information obtained from the sample is called _______.a.evaluation.b.descriptive statistics.c.inferential statistics.d.survey.Scenario 1-3Questions 20 and 21 refer to this scenario:The Quality Assurance Department of a large urban hospital is attempting to monitor and evaluate patient satisfaction with hospital services. Prior to discharge, a random sample of patients is asked to fill out a questionnaire to rate such services as medical care, nursing, therapy, laboratory, food, and cleaning. The Quality Assurance Department prepares weekly reports that are presented at the Board of Directors meetings and extraordinary/atypical ratings are easy to flag.Q20. Referring to Scenario 1-3 (above), true population characteristics estimated from thesample results each week are called _____________.a.inferences.b.parameters.c.estimates.d.data.Q21. Referring to Scenario 1-3 (above), a listing of all hospitalised patients in this institution over a particular week would constitute the ________.a.sample.b.population.c.statistics.d.parameters.Scenario 1-4Questions 22-24 refer to this scenario:The following are the questions given to Sheila Drucker-Ferris in her college alumni association survey. Each variable can be classified as categorical or numerical, discrete or continuous.Q22. Referring to Scenario 1-4 (above), the data for the number of years since graduation is categorised as: __________________.a.numerical discrete.b.categorical.c.numerical continuous.d.none of the above.Q23. Referring to Scenario 1-4 (above), the data for the number of science majors is categorised as: ____________.a.categorical.b.numerical continuous.c.numerical discrete.d.none of the above.Q24. Referring to Scenario 1-4 (above), the data for tabulating the level of job satisfaction (High, Moderate, Low) is categorised as: _________.a.numerical continuous.b.categorical.c.numerical discrete.d.none of the above.Topic 2: Organising and Presenting dataQ1 The width of each bar in a histogram corresponds to the:a.boundaries of the classes.b.number of observations in the classes.c.midpoint of the classes.d.percentage of observations in the classes.Q2 When constructing charts, which of the following chart types is plotted at the class midpointsa.Frequency histograms.b.Percentage polygons.c.Cumulative relative frequency ogives.d.Relative frequency histograms.Q3 When polygons or histograms are constructed, which axis must show the true zero or "origin"a.The horizontal axis.b.The vertical axis.c.Both the horizontal and vertical axes.d.Neither the horizontal nor the vertical axis.Q4 To determine the appropriate width of each class interval in a grouped frequency distribution, we:a.divide the range of the data by the number of desired class intervals.b.divide the number of desired class intervals by the range of the datac.take the square root of the number of observations.d.take the square of the number of observations.Q5 When grouping data into classes it is recommended that we have:a.less than 5 classes.b.between 5 and 15 classes.c.more than 15 classes.d.between 10 and 30 classes.Q6 Which of the following charts would give you information regarding the number of observations "up to and including" a given groupa.Frequency histograms.b.Polygons.c.Percentage polygons.d.Cumulative relative frequency ogives.Q7 Another name for an "ogive" is a:a.frequency histogram.b.polygon.c.percentage polygon.d.cumulative percentage polygon.Q8 In analyzing categorical data, the following graphical device is NOT appropriate:a.bar chart.b.Pareto diagram.c.stem and leaf display.d.pie chart.Table 2The opinions of a sample of 200 people broken down by gender about the latest congressionalQ9 Table 2 (above) contains the opinions of a sample of 200 people broken down by gender about the latest congressional plan to eliminate anti-trust exemptions for professional baseball. Referring to Table 2, the number of people who are neutral to the plan is _______.a.36b.54c.90d.200Q10 Referring to Table 2, the number of males who are against the plan is _______.a.12b.48c.60d.96Q11 Referring to Table 2, the percentage of males among those who are for the plan is ______.a.%b.24%c.25%d.76%Q12 Referring to Table 2, the percentage who are against the plan among the females is _______.a.%b.20%c.30%d.52%Topic 3: Numerical Descriptive StatisticsQ1 Which measure of central tendency can be used for both numerical and categorical variablesa.Mean.b.Median.c.Mode.d.Quartiles.Q2 Which of the following statistics is not a measure of central tendencya.Mean.b.Median.c.Mode.d.Q3.Q3 Which of the following statements about the median is NOT truea.It is more affected by extreme values than the mean.b.It is a measure of central tendency.c.It is equal to Q2.d.It is equal to the mode in bell-shaped distributions.Q4 The value in a data set that appears most frequently is called:a.the median.b.the mode.c.the mean.d.the variance.Q5 In a perfectly symmetrical distribution:a.the mean equals the median.b.the median equals the mode.c.the mean equals the mode.d.All of the above.Q6 When extreme values are present in a set of data, which of the following descriptive summary measures are most appropriatea.CV and range.b.Mean and standard deviation.c.Median and interquartile range.d.Mode and variance.Q7 The smaller the spread of scores around the mean:a.the smaller the interquartile range.b.the smaller the standard deviation.c.the smaller the coefficient of variation.d.All the above.Q8 In a right-skewed distribution:a.the median equals the mean.b.the mean is less than the median.c.the mean is greater than the median.d.the mean is less than the mode.a.b.c.d.Q10 Referring to Table 3 (above), the median carbohydrate amount in the cereal is ________ grams.a.19b.20c.21d.Q11 Referring to Table 3 (above), the 1st quartile of the carbohydrate amounts is ________ grams.a.15b.20c.21d.25Q12 Referring to Table 3 (above), the range in the carbohydrate amounts is ________ grams.a.16b.18c.20d.21Topic 4: Basics probability and discrete probability distributionsInformation A, needed to answer Questions 1 to 2The Health and Safety committee in a large retail firm is examining the relationship between the number of days of sick leave an employee takes and whether an employee works on the day shift (D) or night shift (N). The committee looks at a sample of 50 employees and notes which shift they work on and whether the number of days of sick leave they take in a year is less than 6 daysQ1 Use Information A to answer this question. Which of the following statements about the values in the table of probabilities is not correcta.The probability of an employee taking 6 or more days of sick leave P(M) isb.The probability that an employee is on the Night Shift (N) and takes less than 6 days ofleave (L), is called a conditional probability P(N | L) =c.If you know that an employee is on day shift (D) then the probability that they will takeless than 6 days of leave (L) is the conditional probability P(L | D) =d.The probability that an employee works Day Shift (D) or takes 6 or more days of leave (M)is found using the addition rule to be P(D or M) =e.They are all correctQ2 The analyst wishes to use the Probabilities table from Information A to determine whether the work shift variable and the number of days of sick leave variable are or are not independent variables. Which of the following statements about the work shift and the number of days of sick leave variables is correcta.These variables are independent because the marginal probabilities such as P(L) are thesame as the conditional probabilities P(L | D)b.These variables are not independent because the marginal probability P(L) is differentfrom the conditional probability P(N | L)c.These variables are not independent because the joint probabilities such as P(L and N)are equal to the product of the probabilities P(L).P(N).d.These variables are dependent because the marginal probabilities such as P(L) are equalto the conditional probability P(L | N)e.None of the aboveInformation B, needed to answer Question 3Suppose the manager of a home ware retailer decides in a 5-minute period no more than 4 customers can arrive at a counter. Using past records he obtains the following probabilitythe following is the correct pair of values for the mean, the variance or standard deviation of the number of arrivals at the counter.a.Mean mu = 2 and variance sigma-squared =b.Mean mu = and variance sigma-squared =c.Mean mu = 2 and standard deviation sigma =d.Mean mu = and variance sigma-squared =e.None of the aboveInformation C, needed to answer Questions 4-6The section manager in an insurance company is interested in evaluating how well staff at the inquiry counter handle customer complaints. She interviews a sample of n = 6 customers who have made complaints and asks each of them whether staff had handled their complaints well. Each interview is called a trial. If a customer says their complaint was handled well this is called a success. She thinks that as long as these people are interviewed independently of each other then the number of people who say their complaint was handled well is a random variable with a Binomial probability distribution. The section manager thinks that the probability that a customers complaint will be handled well is p = .Q4 Use Information C to answer this question. A total of n = 6 people are interviewed independently of each other. Which of the following statements about the probability that 5 out of the 6 complaints will be handled well is correcta.less thanb.between andc.more thand.between ande.None of the aboveQ5 Using Information C, which of the following statements about the probability that 4 or less of the 6 complaints will be handled well is correcta.less thanb.more thanc.between andd.between ande.None of the aboveQ6 Suppose the section manager from Information C is interested in the measures of central tendency and variation for the number of complaints which are handled well. Which of the following sets of values, where values are rounded to 3 decimal places, is the correct set of valuesa.Mean mu = and variance sigma-squared =b.Mean mu = and variance sigma-squared =c.Mean mu = and variance sigma-squared =d.Mean mu = and standard deviation sigma =e.None of the aboveInformation D, needed to answer Questions 7-9The manager of a large retailer thinks that one reason why staff at the complaints counter fail to handle customer complaints well is that not enough staff are allocated to this counter. Past experience has shown that the number of customers who arrive at this counter has a Poisson distribution where the average number who arrive each hour is 36. He decides to look at how many customers are likely to arrive at the complaints counter during a 5-minute period.Q7 Use Information D to answer this question. Which of the following statements concerning the probability that exactly 2 customers will arrive at the counter in a 5-minute period is correcta.less thanb.between andc.between andd.more thane.None of the aboveQ8 Use Information D to answer this question. Which of the following statements concerning the probability that 3 or more customers will arrive at a counter in a 5-minute period is correcta.between andb.less thanc.more thand.between ande.None of the aboveQ9 The section manager from Information D is interested in the mean and variance of the number of customers who arrive during a 1 hour period. Which of the following is the correct set of values for these two measuresa.Mean mu = 3 and variance sigma-squared = 3b.Mean mu = 36 and standard deviation sigma =c.Mean mu = 30 and variance sigma-squared = 30d.Mean mu = 36 and standard deviation sigma = 6e.None of the aboveTopic 5: Normal probability distribution & sampling distributionQ1 Which of the following is not a property of the normal distributiona.It is bell-shaped.b.It is slightly skewed left.c.Its measures of central tendency are all identical.d.Its range is from negative infinity to positive infinity.Q2 The area under the standardized normal curve from 0 to would be:a.the same as the area from 0 to .b.equal to .c.found by using Table in your textbook.d.all of the above.Q3 Which of the following about the normal distribution is not truea.Theoretically, the mean, median, and mode are the same.b.About two-thirds of the observations fall within ± 1 standard deviation from the mean.c.It is a discrete probability distribution.d.Its parameters are the mean and standard deviation.Q4 In its standardized form, the normal distribution:a.has a mean of 0 and a standard deviation of 1.b.has a mean of 1 and a variance of 0.c.has a total area equal to .d.cannot be used to approximate discrete binomial probability distributions.Q5 In the standardized normal distribution, the probability that Z > 0 is _______.a.b.c.d.cannot be found without more informationQ6 The probability of obtaining a value greater than 110 in a normal distribution in which the mean is 100 and the standard deviation is 10 is ______________ the probability of obtaining a value greater than 650 in a normal distribution with a mean of 500 and a standard deviation of 100.a.less thanb.equal to.c.greater thand.It is unknown without more information.Q7 The probability of getting a Z score greater than is ________.a.close tob.c. a negative numberd.almost zeroQ8 For some positive value of Z, the probability that a standardized normal variable is between 0 and Z is . The value of Z isa.b.c.d.Q9 For some value of Z, the probability that a standardized normal variable is below Z is . The value of Z isa.b.c.d.Q10 Given that X is a normally distributed random variable with a mean of 50 and a standard deviation of 2, the probability that X is between 47 and 54 isa.b.c.d.Q11 For some positive value of X, the probability that a standardized normal variable is between 0 and + is . The value of X isa.b.c.d.Q12 The owner of a fish market determined that the average weight for a catfish is pounds with a standard deviation of pounds. A citation catfish should be one of the top 2 percent in weight. Assuming the weights of catfish are normally distributed, at what weight (in pounds) should the citation designation be establisheda.poundsb.poundsc.poundsd.poundsQ13 Which of the following is NOT a property of the arithmetic meana.It is unbiased.b.It is always equal to the population mean.c.Its average is equal to the population mean.d.Its variance becomes smaller when the sample size gets bigger.Q14 The sampling distribution of the mean is a distribution of:a.individual population values.b.individual sample values.c.statistics.d.parameters.Q15 The standard deviation of the sampling distribution of the mean is called the:a.standard error of the sample.b.standard error of the estimate.c.standard error of the mean.d.All of the aboveQ16 According to the central limit theorem, the sampling distribution of the mean can be approximated by the normal distribution:a.as the number of samples gets "large enough."b.as the sample size (number of observations) gets "large enough."c.as the size of the population standard deviation increases.d.as the size of the sample standard deviation decreases.Q17 For a sample size of n=10, the sampling distribution of the mean will be normally distributed:a.regardless of the population's distribution.b.if the shape of the population is symmetrical.c.if the variance of the mean is known.d.if the population is normally distributedTopic 6: EstimationQ1 The interval estimate using the t critical value is ________ than the interval estimate using the z critical value.a.Narrowerb.The same asc.Widerd.More powerfulQ2 To estimate the mean of a normal population with unknown standard deviation using a small sample, we use the ______ distribution.a.'t'b.'Z'c.samplingd.alphaQ3 If the population does not follow a normal distribution, then to use the t distribution to give a confidence interval estimate for the population mean, the sample size should be:a.at least 5b.at least 30c.at least 100d.less than 30Q4 The 'z' value or 't' value used in the confidence interval formula is called the:a.sigma valueb.critical valuec.alpha valued.none of the aboveQ5 The 'z' value that is used to construct a 90 percent confident interval is:a.b.c.d.Q6 The 'z' value that is used to construct a 95 percent confidence interval is:a.b.c.d.Q7 The sample size needed to construct a 90 percent confidence interval estimate for the population mean with sampling error ± when sigma is known to be 10 units is:a.9b.32c.75d.107Q8 The t critical value approaches the z critical value when:a.the sample size decreasesb.the sample size approaches infinityc.the confidence level increasesd.the sample is smallQ9 The t-critical value used when constructing a 99 percent confidence interval estimate with a sample of size 18 is:a.b.c.d.Q10 The t-value that would be used to construct a 90 percent confidence interval for the mean with a sample of size n 36 would be:a.b.c.d.Q11 The value of alpha (two tailed) for a 96 percent confidence interval would be: a.b.c.d.Q12 When using the t distribution for confidence interval estimates for the mean, the degrees of freedom value is:a.nb.n-1c.n-2d.n %2B 1Q13 You would interpret a 90 percent confidence interval for the population mean as:a.you can be 90 percent confident that you have selected a sample whose interval doesinclude the population meanb.if all possible samples are selected and CI's are calculated, 90 percent of those intervalswould include the true population meanc.90 percent of the population is in that intervald.both A and B are trueQ14 From a sample of 100 items, 30 were defective. A 95 percent confidence interval for the proportion of defectives in the population is:a.(.2, .4)b.(.21, .39)c.(.225, .375)d.(.236, .364)Q15 A confidence interval was used to estimate the proportion of statistics students that are male. A random sample of 70 statistics students generated the following 90 percent confidence interval: , . Using the information above, what size sample would be necessary if we wanted to estimate the true proportion to within ± using 95 percent confidencea.240b.450c.550d.150整理人:阿桤。
《应用商务统计》-课程教学大纲

《应用商务统计学》课程教学大纲一、课程基本信息课程代码:16045003课程名称:应用商务统计学英文名称:Applied Business Statistics课程类别:专业课学时: 48学分: 3适用对象: 国际商务专业考核方式:考试先修课程:《微积分》、《概率论与数理统计》二、课程简介应用商务统计学介绍在商务经济活动当中常用的统计描述和统计推断的方法。
主要内容包括如何使用图形和统计指标对数据进行整理和描述、抽样分布、点估计、区间估计、假设检验、列联表分析、方差分析、回归分析。
课程的教学中将介绍计算机统计分析软件EXCEL的使用和案例分析。
Applied Business Statistics introduces some statistical description and statistical inference methods used in business and economic activities. The main contents include how to use graphics and statistical indicators to organize and describe the data, sampling distribution, point estimation, interval estimation, hypothesis testing, contingency table analysis, variance analysis and regression analysis. The course will introduce the use of computer statistical analysis software EXCEL and the analysis of several cases. 三、课程性质与教学目的应用商务统计学是一门应用性统计学课程,系统论述了统计理论与方法在商务经济活动中的应用。
统计学 第三章
3.1
Events, Sample Spaces, and Probability
© 2011 Pearson Education, Inc
Experiments & Sample Spaces
1. Experiment
• Process of observation that leads to a single outcome that cannot be predicted with certainty
© 2011 Pearson Education, Inc
2. Intersection
Event Union: Venn Diagram
Experiment: Draw 1 Card. Note Kind, Color & Suit.
Sample Space: 2♥, 2♦, 2♣, ..., A♠ Event Black: 2♣, 2♠, ..., A♠
n! = n (n − 1)(n − 2 )L (3)(2 )(1)
For example, 5! = 5 ⋅ 4 ⋅ 3⋅ 2 ⋅1
0! is defined to be 1.
© 2011 Pearson Education, Inc
3.2
Unions and Intersections
© 2011 Pearson Education, Inc
© 2011 Pearson Education, Inc
© 1984-1994 T/Maker Co.
Experiment: Observe Gender
Visualizing Sample Space
1. Listing
S = {Head, Tail}
商务统计学ppt课件
精选ppt课件
6
什么是统计?
1、统计工作
收集数据的活动
2、统计数据
对现象计量的结果
3、统计学
分析数据的方法和技术
精选ppt课件
7
什么是统计学?
➢收集、分析、表述和解释数据的科学 1、收集数据:取得数据 2、数据分析:分析数据 3、数据表述:图表展示数据 4、数据解释:结果的说明
一、分类数据、顺序数据、数值型数据 二、观测数据和实验数据 三、截面数据和时间序列数据
精选ppt课件
19
什么是统计数据?
1、对现象进行计量的结果 2、不是指单个的数字,而是由多个数据构成的数据
集 3、不仅仅是指数字,它可以是数字的,也可以是文
字的
精选ppt课件
20
统计数据的分类
统计数据的分类
按计量层次
商务统计学 Business Statistics
精选ppt课件
1
参考书籍:
• 商务统计学 戴维.M.莱文等著 贾俊平改编
•
中国人民大学出版社
• 统计学原理 谢启南 主编 暨南大学出版社
• 统计学原理 贾俊平 中国人民大学出版社
精选ppt课件
2
成绩评定方法
• 1.闭卷考试成绩(70%) • 2.平时作业、考勤和上机。(30%)
精选ppt课件
29
变量 (variable)
1、说明现象某种特征的概念
如商品销售额、受教育程度、产品的质量等级等 变量的具体表现称为变量值,即数据
2、变量可以分为
分类变量(categorical variable):说明事物类别的一个名称 顺序变量(rank variable):说明事物有序类别的一个名称 数值型变量(metric variable):说明事物数字特征的一个名
美国薪资高的专业:商业分析
随着互联网的发展,越来越多的数据产生,而能够有效分析这些数据并将他们应用于商业的人才却极其短缺,在这种趋势下,有不少学校开始开设BA 专业,都是社会企业用人需求所产生的结果。
其根本就是:大数据以前企业用Excel 、Word 做财务、市场、运营的分析就可以了,现在出现了大量新的数据可以帮助企业了解消费者、提升运营水平。
传统统计专业的学生,对分析实验结果很在行,对商业和市场却一窍不通。
另外,传统的business analysis 和学统计的同学,面对储存数据的系统、逐渐流行的分析数据的开源软件,也就是计算机方面的东西,明显知识储备不足。
但找学计算机的码农来做数据分析,他们对商业和统计知识基本一无所知。
也就是说,分析企业中的数据,也就是Business Analytics 这个领域,是Business 、Statistics和Computer Science 三个领域知识的结合。
传统的Business Analysis 、Statistician 和码农如果能够合体,才能成为适合新时代的Business Analytics 人员。
于是企业要求学校,特别是商学院,开设这样的专业,培养对Business 、统计和计算机都有所掌握的人员,于是Business Analytics 孕育而生。
Business跟商科课程是一致的,主要是Marketing 和Finance 的课程。
Statistics传统的统计,主要是学习对实验结果做显著性检验。
以前商业中大量招聘统计专业同学的是市场调研机构:一队消费者看了广告,一队消费者没看广告,谁对品牌认知度高?有没有显著性区别?另外,统计讲究抽样,消费者太多没办法一一访问,于是抽样,于是就要看抽样的合理性。
现代企业中的数据分析,可以说和这些传统的统计方法,有了很大的改变。
business analytics 的统计知识,主要是学习如何建立和评估多变量的统计模型,最典型的例子就是回归分析模型。
《Business statistic》复习参考(第一章至第八章)讲解学习
《Business Statistic》中国人民大学出版社英文版第五版chapter1~8复习参考Part1名词解释1、Statistics is a method of extracting useful information from a set of numerical data in order tomake a more effective and informed decision.2、Descriptive Statistics:These are statistical methods of organizing, summarizing andpresenting numerical data in convenient forms such as graphs, charts and tables.3、Inferential statistics is defined as statistical methods used for drawing conclusions about apopulation based on samples.4、Primary data is obtained first hand.5、Secondary data already exists or has been previously collected such as company accounts, orsales figures.6、Mean: The arithmetic average and the most common measure ofaaaaaaa central tendency. ①All values are included in computing the mean.②A set of data has a unique mean ③The mean is affected by unusually large or small data points (outliers / extreme values).7、Mode: The most frequent data, or data corresponding to the highest frequency. ①Mode is notaffected by extreme values. ②There may not be a mode. ③There may be several modes. ④Used for either numerical or categorical data.8、Median is the value that splits a ranked set of data into two equal parts. ①Median is notaffected by extremely large or small values and is therefore a valuable measure of central tendency when such values occur.9、Standard Deviation: ①A measure of the variation of data from the mean. ②The mostcommonly used measure of variation. ③Represented by the symbol ‘s’. ④Shows how the data is distributed around the mean.10、Probability is the chance of an occurrence of an event. ①Probability of an eventalways lies between 0 and 1. ②The sum of the probabilities of every possible outcome or event is 1. ③The probability of the complement A’ is given by 1-P(A).11、Properties of Normal distribution:①Continuous random variable. ②‘Bell-shaped’ &symmetrical. ③Mean, median, mode are equal ④Area under the curve is 1.12、The Central Limited Theorem:①If the population followed normal distribution, thesampling distribution of mean is followed normal distribution. ②If the population do not followed normal distribution, but the sample size is larger than 30, the sampling distribution of mean is followed normal distribution.Part2选择题Topic 1 - Introduction to Business Statistics & Data CollectionQ1. The universe or totality of items or things under consideration is called:a. a sample.b. a population.c. a parameter.d.none of the above.Q2. Those methods involving the collection, presentation, and characterization of a set of data in order to properly describe the various features of that set of data are called:a.inferential statistics.b.total quality management.c.sampling.d.descriptive statistics.Q3. The portion of the universe that has been selected for analysis is called:a. a sample.b. a frame.c. a parameter.d. a statistic.Q4. A summary measure that is computed to describe a numerical characteristic from only a sample of the population is called:a. a parameter.b. a census.c. a statistic.d.the scientific method.Q5. A summary measure that is computed to describe a characteristic of an entire population is called:a. a parameter.b. a census.c. a statistic.d.total quality management.Q6. The process of using sample statistics to draw conclusions about population parameters is called:a.inferential statistics.b.experimentation.c.primary sources.d.descriptive statistics.Q7. Which of the four methods of data collection is involved when a person retrieves data from an online database?a.published sources.b.experimentation.c.surveying.d.observation.Q8. Which of the four methods of data collection is involved when people are asked to complete a questionnaire?a.published sources.b.experimentation.c.surveying.d.observation.Q9. Which of the four methods of data collection is involved when a person records the use of the Los Angeles freeway system?a.published sources.b.experimentation.c.surveying.d.observation.Q10. A focus group is an example of which of the four methods of data collection?a.published sources.b.experimentation.c.surveying.d.observation.Q11. Which of the following is true about response rates?a.The longer the questionnaire, the lower the rate.b.Mail surveys usually produce lower response rates than personal interviews or telephonesurveys.c.Question wording can affect a response rate.d. d. All of the above.Q12. Which of the following is a reason that a manager needs to know about statistics?a.To know how to properly present and describe information.b.To know how to draw conclusions about the population based on sample information.c.To know how to improve processes.d.All of the above.Scenario 1-1Questions 13-15 refer to this scenario:An insurance company evaluates many variables about a person before deciding on an appropriate rate for automobile insurance. Some of these variables can be classified as categorical, discrete and numerical, or continuous and numerical.Q13. Referring to Scenario 1-1 (above), the number of claims a person has made in the last three years is what type of variable?a.Categorical.b.Discrete and numerical.c.Continuous and numerical.d.None of the above.Q14. Referring to Scenario 1-1 (above), a person's age is what type of variable?a.Categorical.b.Discrete and numerical.c.Continuous and numerical.d.None of the above.Q15. Referring to Scenario 1-1 (above), a person's gender is what type of variable?a.Categorical.b.Discrete and numerical.c.Continuous and numerical.d.None of the above.Q16. Which of the following can be reduced by proper interviewer training?a.Sampling error.b.Measurement error.c.Coverage error.d.Nonresponse error.Scenario 1-2Questions 17-19 refer to this scenario:Mediterranean fruit flies were discovered in California a few years ago and badly damaged the oranges grown in that state. Suppose the manager of a large farm wanted to study the impact of the fruit flies on the orange crops on a daily basis over a 6-week period. On each day a random sample of orange trees was selected from within a random sample of acres. The daily average number of damaged oranges per tree and the proportion of trees having damaged oranges were calculated.Q17. Referring to Scenario 1-2 (above), the two main measures calculated each day (i.e., average number of damaged oranges per tree and proportion of trees having damaged oranges) are called _______.a.statistics.b.parameters.c.samples.d.populations.Q18. Referring to Scenario 1-2 (above), the two main measures calculated each day (i.e., average number of damaged oranges per tree and proportion of trees having damaged oranges) may be used on a daily basis to estimate the respective true population _______.a.estimates.b.parameters.c.statistics.d.frame.Q19. Referring to Scenario 1-2 (above), in this study, drawing conclusions on any one day about the true population characteristics based on information obtained from the sample is called _______.a.evaluation.b.descriptive statistics.c.inferential statistics.d.survey.Scenario 1-3Questions 20 and 21 refer to this scenario:The Quality Assurance Department of a large urban hospital is attempting to monitor and evaluate patient satisfaction with hospital services. Prior to discharge, a random sample of patients is asked to fill out a questionnaire to rate such services as medical care, nursing, therapy, laboratory, food, and cleaning. The Quality Assurance Department prepares weekly reports that are presented at the Board of Directors meetings and extraordinary/atypical ratings are easy to flag.Q20. Referring to Scenario 1-3 (above), true population characteristics estimated from the sample results each week are called _____________.a.inferences.b.parameters.c.estimates.d.data.Q21. Referring to Scenario 1-3 (above), a listing of all hospitalised patients in this institution over a particular week would constitute the ________.a.sample.b.population.c.statistics.d.parameters.Scenario 1-4Questions 22-24 refer to this scenario:The following are the questions given to Sheila Drucker-Ferris in her college alumni association survey. Each variable can be classified as categorical or numerical, discrete or continuous.Q22. Referring to Scenario 1-4 (above), the data for the number of years since graduation is categorised as: __________________.a.numerical discrete.b.categorical.c.numerical continuous.d.none of the above.Q23. Referring to Scenario 1-4 (above), the data for the number of science majors is categorised as: ____________.a.categorical.b.numerical continuous.c.numerical discrete.d.none of the above.Q24. Referring to Scenario 1-4 (above), the data for tabulating the level of job satisfaction (High, Moderate, Low) is categorised as: _________.a.numerical continuous.b.categorical.c.numerical discrete.d.none of the above.Topic 2: Organising and Presenting dataQ1 The width of each bar in a histogram corresponds to the:a.boundaries of the classes.b.number of observations in the classes.c.midpoint of the classes.d.percentage of observations in the classes.Q2 When constructing charts, which of the following chart types is plotted at the class midpoints?a.Frequency histograms.b.Percentage polygons.c.Cumulative relative frequency ogives.d.Relative frequency histograms.Q3 When polygons or histograms are constructed, which axis must show the true zero or "origin"?a.The horizontal axis.b.The vertical axis.c.Both the horizontal and vertical axes.d.Neither the horizontal nor the vertical axis.Q4 To determine the appropriate width of each class interval in a grouped frequency distribution, we:a.divide the range of the data by the number of desired class intervals.b.divide the number of desired class intervals by the range of the datac.take the square root of the number of observations.d.take the square of the number of observations.Q5 When grouping data into classes it is recommended that we have:a.less than 5 classes.b.between 5 and 15 classes.c.more than 15 classes.d.between 10 and 30 classes.Q6 Which of the following charts would give you information regarding the number of observations "up to and including" a given group?a.Frequency histograms.b.Polygons.c.Percentage polygons.d.Cumulative relative frequency ogives.Q7 Another name for an "ogive" is a:a.frequency histogram.b.polygon.c.percentage polygon.d.cumulative percentage polygon.Q8 In analyzing categorical data, the following graphical device is NOT appropriate:a.bar chart.b.Pareto diagram.c.stem and leaf display.d.pie chart.Table 2The opinions of a sample of 200 people broken down by gender about the latest congressional For Neutral Against Totals Female 38 54 12 104Male 12 36 48 96Q9 Table 2 (above) contains the opinions of a sample of 200 people broken down by gender about the latest congressional plan to eliminate anti-trust exemptions for professional baseball. Referring to Table 2, the number of people who are neutral to the plan is _______.a.36b.54c.90d.200Q10 Referring to Table 2, the number of males who are against the plan is _______.a.12b.48c.60d.96Q11 Referring to Table 2, the percentage of males among those who are for the plan is ______.a.12.5%b.24%c.25%d.76%Q12 Referring to Table 2, the percentage who are against the plan among the females is _______.a.11.54%b.20%c.30%d.52%Topic 3: Numerical Descriptive StatisticsQ1 Which measure of central tendency can be used for both numerical and categorical variables?a.Mean.b.Median.c.Mode.d.Quartiles.Q2 Which of the following statistics is not a measure of central tendency?a.Mean.b.Median.c.Mode.d.Q3.Q3 Which of the following statements about the median is NOT true?a.It is more affected by extreme values than the mean.b.It is a measure of central tendency.c.It is equal to Q2.d.It is equal to the mode in bell-shaped distributions.Q4 The value in a data set that appears most frequently is called:a.the median.b.the mode.c.the mean.d.the variance.Q5 In a perfectly symmetrical distribution:a.the mean equals the median.b.the median equals the mode.c.the mean equals the mode.d.All of the above.Q6 When extreme values are present in a set of data, which of the following descriptive summary measures are most appropriate?a.CV and range.b.Mean and standard deviation.c.Median and interquartile range.d.Mode and variance.Q7 The smaller the spread of scores around the mean:a.the smaller the interquartile range.b.the smaller the standard deviation.c.the smaller the coefficient of variation.d.All the above.Q8 In a right-skewed distribution:a.the median equals the mean.b.the mean is less than the median.c.the mean is greater than the median.d.the mean is less than the mode.Q9 Referring to Table 3 (above), the mean carbohydrates in this sample is ________ grams.a.15.25b.19.73c.21.42d.21.70Q10 Referring to Table 3 (above), the median carbohydrate amount in the cereal is ________ grams.a.19b.20c.21d.21.5Q11 Referring to Table 3 (above), the 1st quartile of the carbohydrate amounts is ________ grams.a.15b.20c.21d.25Q12 Referring to Table 3 (above), the range in the carbohydrate amounts is ________ grams.a.16b.18c.20d.21Topic 4: Basics probability and discrete probability distributionsInformation A, needed to answer Questions 1 to 2The Health and Safety committee in a large retail firm is examining the relationship between the number of days of sick leave an employee takes and whether an employee works on the day shift (D) or night shift (N). The committee looks at a sample of 50 employees and notes which shift they work on and whether the number of days of sick leave they take in a year is less than 6 daysQ1 Use Information A to answer this question. Which of the following statements about the values in the table of probabilities is not correct?a.The probability of an employee taking 6 or more days of sick leave P(M) is 0.6b.The probability that an employee is on the Night Shift (N) and takes less than 6 days ofleave (L), is called a conditional probability P(N | L) = 0.6c.If you know that an employee is on day shift (D) then the probability that they will takeless than 6 days of leave (L) is the conditional probability P(L | D) = 0.4d.The probability that an employee works Day Shift (D) or takes 6 or more days of leave(M) is found using the addition rule to be P(D or M) = 0.76e.They are all correctQ2 The analyst wishes to use the Probabilities table from Information A to determine whether the work shift variable and the number of days of sick leave variable are or are not independent variables. Which of the following statements about the work shift and the number of days of sickleave variables is correct ?a.These variables are independent because the marginal probabilities such as P(L) are thesame as the conditional probabilities P(L | D)b.These variables are not independent because the marginal probability P(L) is differentfrom the conditional probability P(N | L)c.These variables are not independent because the joint probabilities such as P(L and N) areequal to the product of the probabilities P(L).P(N).d.These variables are dependent because the marginal probabilities such as P(L) are equalto the conditional probability P(L | N)e.None of the aboveInformation B, needed to answer Question 3Suppose the manager of a home ware retailer decides in a 5-minute period no more than 4 customers can arrive at a counter. Using past records he obtains the following probabilityTable 4-3Arrivals (X) 0 1 2 3 4P(X) .15 .20 .30 .20 .15Q3 Use Information B to answer this question. If values are rounded to 3 decimal places which of the following is the correct pair of values for the mean, the variance or standard deviation of the number of arrivals at the counter.a.Mean mu = 2 and variance sigma-squared = 1.265b.Mean mu = 2.5 and variance sigma-squared = 1.6c.Mean mu = 2 and standard deviation sigma = 1.6d.Mean mu = 2.4 and variance sigma-squared = 1.6e.None of the aboveInformation C, needed to answer Questions 4-6The section manager in an insurance company is interested in evaluating how well staff at the inquiry counter handle customer complaints. She interviews a sample of n = 6 customers who have made complaints and asks each of them whether staff had handled their complaints well. Each interview is called a trial. If a customer says their complaint was handled well this is called a success. She thinks that as long as these people are interviewed independently of each other then the number of people who say their complaint was handled well is a random variable with a Binomial probability distribution. The section manager thinks that the probability that a customers complaint will be handled well is p = 0.75.Q4 Use Information C to answer this question. A total of n = 6 people are interviewed independently of each other. Which of the following statements about the probability that 5 out of the 6 complaints will be handled well is correcta.less than 0.06b.between 0.23 and 0.24c.more than 0.35d.between 0.30 and 0.32e.None of the aboveQ5 Using Information C, which of the following statements about the probability that 4 or less of the 6 complaints will be handled well is correcta.less than 0.36b.more than 0.52c.between 0.45 and 0.475d.between 0.15 and 0.175e.None of the aboveQ6 Suppose the section manager from Information C is interested in the measures of central tendency and variation for the number of complaints which are handled well. Which of the following sets of values, where values are rounded to 3 decimal places, is the correct set of valuesa.Mean mu = 4.5 and variance sigma-squared = 1.125b.Mean mu = 4.5 and variance sigma-squared = 1.061c.Mean mu = 1.5 and variance sigma-squared = 1.125d.Mean mu = 1.5 and standard deviation sigma = 1.061e.None of the aboveInformation D, needed to answer Questions 7-9The manager of a large retailer thinks that one reason why staff at the complaints counter fail to handle customer complaints well is that not enough staff are allocated to this counter. Past experience has shown that the number of customers who arrive at this counter has a Poisson distribution where the average number who arrive each hour is 36. He decides to look at how many customers are likely to arrive at the complaints counter during a 5-minute period.Q7 Use Information D to answer this question. Which of the following statements concerning the probability that exactly 2 customers will arrive at the counter in a 5-minute period is correcta.less than 0.05b.between 0.21 and 0.23c.between 0.16 and 0.18d.more than 0.25e.None of the aboveQ8 Use Information D to answer this question. Which of the following statements concerning the probability that 3 or more customers will arrive at a counter in a 5-minute period is correcta.between 0.10 and 0.15b.less than 0.23c.more than 0.77d.between 0.60 and 0.55e.None of the aboveQ9 The section manager from Information D is interested in the mean and variance of the number of customers who arrive during a 1 hour period. Which of the following is the correct set of values for these two measuresa.Mean mu = 3 and variance sigma-squared = 3b.Mean mu = 36 and standard deviation sigma = 1.732c.Mean mu = 30 and variance sigma-squared = 30d.Mean mu = 36 and standard deviation sigma = 6e.None of the aboveTopic 5: Normal probability distribution & sampling distributionQ1 Which of the following is not a property of the normal distribution?a.It is bell-shaped.b.It is slightly skewed left.c.Its measures of central tendency are all identical.d.Its range is from negative infinity to positive infinity.Q2 The area under the standardized normal curve from 0 to 1.96 would be:a.the same as the area from 0 to -1.96.b.equal to 0.4750.c.found by using Table E.2 in your textbook.d.all of the above.Q3 Which of the following about the normal distribution is not true?a.Theoretically, the mean, median, and mode are the same.b.About two-thirds of the observations fall within ± 1 standard deviation from the mean.c.It is a discrete probability distribution.d.Its parameters are the mean and standard deviation.Q4 In its standardized form, the normal distribution:a.has a mean of 0 and a standard deviation of 1.b.has a mean of 1 and a variance of 0.c.has a total area equal to 0.5.d.cannot be used to approximate discrete binomial probability distributions.Q5 In the standardized normal distribution, the probability that Z > 0 is _______.a.0.00b.0.50c. 1.00d.cannot be found without more informationQ6 The probability of obtaining a value greater than 110 in a normal distribution in which the mean is 100 and the standard deviation is 10 is ______________ the probability of obtaining a value greater than 650 in a normal distribution with a mean of 500 and a standard deviation of 100.a.less thanb.equal to.c.greater thand.It is unknown without more information.Q7 The probability of getting a Z score greater than 4.0 is ________.a.close to 1.0b.0.50c. a negative numberd.almost zeroQ8 For some positive value of Z, the probability that a standardized normal variable is between 0 and Z is 0.3770. The value of Z isa.0.18b.0.81c. 1.16d. 1.47Q9 For some value of Z, the probability that a standardized normal variable is below Z is 0.2090. The value of Z isa.-0.81b.-0.31c.0.31d. 1.96Q10 Given that X is a normally distributed random variable with a mean of 50 and a standard deviation of 2, the probability that X is between 47 and 54 isa.0.0896b.0.4104c.0.5896d.0.9104Q11 For some positive value of X, the probability that a standardized normal variable is between 0 and +1.5X is 0.4332. The value of X isa.0.10b.0.50c. 1.00d. 1.50Q12 The owner of a fish market determined that the average weight for a catfish is 3.2 pounds with a standard deviation of 0.8 pounds. A citation catfish should be one of the top 2 percent in weight. Assuming the weights of catfish are normally distributed, at what weight (in pounds) should the citation designation be established?a. 1.56 poundsb. 4.84 poundsc. 5.20 poundsd.7.36 poundsQ13 Which of the following is NOT a property of the arithmetic mean?a.It is unbiased.b.It is always equal to the population mean.c.Its average is equal to the population mean.d.Its variance becomes smaller when the sample size gets bigger.Q14 The sampling distribution of the mean is a distribution of:a.individual population values.b.individual sample values.c.statistics.d.parameters.Q15 The standard deviation of the sampling distribution of the mean is called the:a.standard error of the sample.b.standard error of the estimate.c.standard error of the mean.d.All of the aboveQ16 According to the central limit theorem, the sampling distribution of the mean can be approximated by the normal distribution:a.as the number of samples gets "large enough."b.as the sample size (number of observations) gets "large enough."c.as the size of the population standard deviation increases.d.as the size of the sample standard deviation decreases.Q17 For a sample size of n=10, the sampling distribution of the mean will be normally distributed:a.regardless of the population's distribution.b.if the shape of the population is symmetrical.c.if the variance of the mean is known.d.if the population is normally distributedTopic 6: EstimationQ1 The interval estimate using the t critical value is ________ than the interval estimate using the z critical value.a.Narrowerb.The same asc.Widerd.More powerfulQ2 To estimate the mean of a normal population with unknown standard deviation using a small sample, we use the ______ distribution.a.'t'b.'Z'c.samplingd.alphaQ3 If the population does not follow a normal distribution, then to use the t distribution to give a confidence interval estimate for the population mean, the sample size should be:a.at least 5b.at least 30c.at least 100d.less than 30Q4 The 'z' value or 't' value used in the confidence interval formula is called the:a.sigma valueb.critical valuec.alpha valued.none of the aboveQ5 The 'z' value that is used to construct a 90 percent confident interval is:a. 1.645b. 1.96c. 2.33d. 2.58Q6 The 'z' value that is used to construct a 95 percent confidence interval is:a. 1.645b. 1.96c. 2.33d. 2.58Q7 The sample size needed to construct a 90 percent confidence interval estimate for the population mean with sampling error ±1.9 when sigma is known to be 10 units is:a.9b.32c.75d.107Q8 The t critical value approaches the z critical value when:a.the sample size decreasesb.the sample size approaches infinityc.the confidence level increasesd.the sample is smallQ9 The t-critical value used when constructing a 99 percent confidence interval estimate with a sample of size 18 is:a. 2.552b. 2.567c. 2.878d. 2.898Q10 The t-value that would be used to construct a 90 percent confidence interval for the mean with a sample of size n 36 would be:a. 1.3062b. 1.6499c. 1.6883d. 1.6896Q11 The value of alpha (two tailed) for a 96 percent confidence interval would be:a.0.02b.0.04c.0.2d.0.4Q12 When using the t distribution for confidence interval estimates for the mean, the degrees of freedom value is:a.nb.n-1c.n-2d.n %2B 1Q13 You would interpret a 90 percent confidence interval for the population mean as:a.you can be 90 percent confident that you have selected a sample whose interval doesinclude the population meanb.if all possible samples are selected and CI's are calculated, 90 percent of those intervalswould include the true population meanc.90 percent of the population is in that intervald.both A and B are trueQ14 From a sample of 100 items, 30 were defective. A 95 percent confidence interval for the proportion of defectives in the population is:a.(.2, .4)b.(.21, .39)c.(.225, .375)d.(.236, .364)Q15 A confidence interval was used to estimate the proportion of statistics students that are male.A random sample of 70 statistics students generated the following 90 percent confidence interval:(0.45, 0.64). Using the information above, what size sample would be necessary if we wanted to estimate the true proportion to within ±0.08 using 95 percent confidence?a.240b.450c.550d.150整理人:阿桤。
Statistics for business and economics Ch14a
Slide 2
Simple Linear Regression
Managerial decisions often are based on the relationship between two or more variables. Regression analysis can be used to develop an equation showing how the variables are related. The variable being predicted is called the dependent variable and is denoted by y. The variables being used to predict the value of the dependent variable are called the independent variables and are denoted by x.
Slide 1
Chapter 14, Part A Simple Linear Regression
Simple Linear Regression Model Least Squares Method Coefficient of Determination Model Assumptions Testing for Significance
Slide 7
Simple Linear Regression Equation
Negative Linear Relationship E(y)
Intercept
b0
Regression line Slope b1 is negative x
《商务数学与统计》课程经要中英对照
《商务数学与统计》课程经要中英对照Business Mathematics & Statistics《商务数学与统计》学习精要一.本门课程主要内容《商务数学与统计》这门课程主要包含以下内容:第一部分商务数学●代数●百分数在商务中的应用●利息●折旧●图解法与盈亏平衡分析第二部分商务统计●统计简介●数据的直观表示●频数分布图●集中趋势的度量●离散趋势的度量●概率●概率分布●相关分析●线性回归分析●时间序列分析●时间序列分析与预测●指数●数据收集与抽样●估计●假设检验二.指定教材《商务数学与统计》评分方式平时成绩40%(两次考试,一个作业)期末成绩60%三.主要章节及内容第一部分商务数学(1)在这部分你将学习以下内容:●百分数在商务中的应用(佣金、折扣、盈利与亏损的计算)●利息的计算(单利、复利)●折旧的计算(直线法、余额递减法、产量法)●盈亏平衡点的求法(公式计算、图解法)(2)主要专业词汇中英文对照1. 代数Algebraic Expression 代数表达式Numerical 数值的Quantitative 数量的Evaluate 求……的数值Variable 变量Constant 常量Expression 表达式Proprietorship 所有者权益Owner’s equity 所有者权益Liability 负债Asset 资产Power 幂Formula 公式Simple interest 单利Compound interest 复利Quotient 商Product 积Numerator 分子Denominator 分母Equation 方程Square root 平方根2. 百分数的应用Commission 佣金Discount 折扣Tax 税Profit and loss 盈利与亏损A straight commission 直接佣金A graduated commission 累进佣金A retainer plus commission 底薪加佣金Decimal 小数Principal 本金Real estate 房地产Mark-up 加价G.S.T-------Goods and Services Tax 商品与服务税,消费税Trade discounts 交易折扣Cash discounts 现金折扣Chain discounts 链锁折扣Profit and loss 盈利与亏损List price 标价,定价Net price 净价,实价3. 利息Simple interest 单利Compound interest 复利Rate of interest 利率Future value 终值Compounded semi-annually 按半年计利Compounded half-yearly 按半年计利Compounded quarterly 按季计利Compounded monthly 按月计利Inflation 通货膨胀Outstanding 未尝付的The effective rate 有效利率The number of instalment分期付款的次数The flat rate of interest 名义利率Accumulated value 终值,累积值Instalment = Installment 分期付款4. 折旧Depreciation 折旧Original cost 原始成本Accumulated depreciation 累积折旧Book value 账面值Useful life 使用寿命Annual depreciation 年折旧The Prime cost method 直线折旧法The straight line method 直线折旧法The units of use 产品法Units-of-production method产品法Depreciation schedule 折旧表Annual rate of depreciation年折旧率The reducing balance method余额递减法Diminishing value method余额递减法5. 图解法与盈亏平衡分析The Cartesian plane 笛卡儿平面Linear equation 线性方程Gradient 斜率Intercept 截距Fixed costs 固定成本Variable costs 可变成本Break-even points 盈亏平衡点Ordered pair序对Co-ordinate 坐标Quadrant 象限Plotting points 描点Break even 盈亏平衡第二部分商务统计(1)在这部分你将学习以下内容:●描述统计与统计推断●数据的直观表示(统计图表)●频数分布图●集中趋势与离散趋势的度量●概率与分布●相关分析与回归分析●时间序列分析与预测●抽样与估计●假设检验(2)本部分主要专业词汇中英文对照1. 统计简介Statistics 统计Descriptive statistics 描述统计Statistical inference 统计推断Primary data 一手数据Secondary data 二手数据Bias 偏差Target population 目标总体Random sampling 随机抽样Size 样本容量Sampled population 样本总体Discrete 离散的Continuous 连续的Finite 有限的Countably infinite 无限可数的Discrete random variable离散型随机变量Continuous random variable连续型随机变量Discrete data 离散型数据Continuous data连续型数据2.数据的直观表示Tables 表,一览表Data streams 数组Bar charts 条形图Rectangular 长方形Sectors 扇形Segment 部分Graphs 线图Pie charts 饼形图Multiple bar charts 多重条形图Compound bar charts 复合条形图Simple bar chart 简单条形图Pictograms 象形图3. 数据收集与抽样Benchmark data 基准数据System parameters 系统参数Raw data 原始数据Population 总体Sample size 样本容量Population characteristics 总体特征Multistage sampling 多阶段抽样Importance sampling 重要性抽样Sampling method 抽样方法Probability sampling methods 概率抽样方法Simple random sampling 简单随机抽样Stratified sampling 分层抽样Systematic sampling 系统抽样Quota sampling 定额抽样Cluster sampling 整群抽样4. 频数分布Double numeric data 重复数值型数据Ungrouped data 未分组数据Grouped data 分组数据Histogram 频数直方图Frequency polygon 频数多边形Closed plane figure 封闭的平面图形Relative frequency 相对频数Frequency table 频数分布表Cumulative frequency 累积频数Ogive curve 卵形线,累积曲线Class interval 分组区间,组距The spread of numbers 数字的离差Sampling method 抽样方法Probability sampling methods概率抽样方法Simple random sampling 简单随机抽样Stratified sampling 分层抽样Systematic sampling 系统抽样Quota sampling 定额抽样Cluster sampling 整群抽样Frequency distribution graphs频数分布图Real class boundary 实际组限、组界5. 集中趋势的度量Measuring central tendency 集中趋势的度量Arithmetic mean 算术平均值Mean 均值Mode 众数Median 中位数Qualitative 定性的Unimodal 单峰的Bimodal distribution 双峰分布Odd number 奇数Even number 偶数Modal class 众数组Median class 中位数组Quantitative 定量的6. 离散趋势的度量Measuring dispersion 离散趋势的度量Data variation 数据变异Statistician 统计学家,统计人员Range 极差,全距Mean deviation 平均离差Interquartile (IQR) 四分位极差Midspread (IQR) 四分位极差Lower quartile (Q1) 下四分位数First quartile (Q1) 第一四分位数Second quartile (Q2) = median Absolute values 绝对值Standard deviation 标准差Variance 方差Absolute deviation 绝对离差第二四分位数,中位数Upper quartile (Q3) 上四分位数Third quartile (Q3) 第三四分位数Coefficient of variation 变异系数7. 概率与分布ProbabilityRandom experiment 随机试验Trial 试验Event 事件Sample space 样本空间Event space 样本空间Venn diagram 文氏图Fair die 均匀的骰子Cube 立方体Complementary probability 逆概率Complement 补事件Impossibility 不可能事件Certainty 必然事件Compound event 复合事件Independent event 独立事件Mutually exclusive 互相排斥Dependent event 相依事件Conditional probability 条件概率Probability distributions 概率分布Discrete probability distributions 离散型概率分布independent trials 独立试验Mean 均值Expected value 期望值Binomial 二项分布Hypergeometric 超几何分布Poisson 泊松分布Geometric 几何分布Normal curve 正态曲线Normal distribution 正态分布A smooth bell-shaped curve光滑钟形曲线Normal distribution density function 正态分布密度函数Symmetry 对称的Asymptotic 渐进的The standard normal distribution 标准正态分布Integral 积分8. 抽样与估计Sampling methods 抽样方法Simple random sampling 简单随机抽样Stratified sampling 分层抽样Systematic sampling 系统抽样Cluster sampling 整群抽样Sampling errors 抽样误差Non-sampling errors 非抽样误差Sampling distribution 抽样分布Sample mean 样本均值Standard error of the mean均值的标准差Central limit theorem 中心极限定理Estimation 估计Population parameter 总体参数Sample statistic 样本统计量Population mean 总体均值Point estimators 点估计Unbiased estimator 无偏估计Consistent 一致的Lower confidence limit 置信上限Upper confidence limit置信下限Interval estimators 区间估计9. 相关分析与线性回归分析A scatter diagram 散点图Correlation coefficient 相关系数Pearson product-moment correlation coefficient 皮尔逊积矩相关系数Independent variable 自变量Positive correlation 正相关Negative correlation 负相关Spearman rank correlation coefficient 斯皮尔曼等级相关系数Dependent variable 因变量Regression equation 回归方程Regression line 回归直线Inflation rate 通货膨胀率Method of least squares 最小二乘法Fit 拟合Fitted line 拟合直线Sum of squares for error 误差平方和In descending order 降序10. 时间序列分析与预测Time series analysis 时间序列分析Trend analysis趋势分析Secular trend 长期趋势Cyclical movements 周期性变动Seasonal variation 季节变化Irregular variation 不规则变化Straight line trend 直线趋势Free hand graphical method随手画图法Semi averaging 半平均数法Percentage trend 趋势百分数Population growth 人口增长Consumer price index 消费者价格指数Gross domestic product (GDP)国内生产总值Gross national product (GNP)国民生产总值Least squares最小二乘法Moving average 移动平均数法Polygon format 多角图形、折线图Polygon line 多角线、折线Moving averages 移动平均数法Exponential smoothing 指数平滑法Smoothing constant 修匀常数Cyclical effect 循环效应,周期效应Seasonal adjustment 季节调整值Seasonal index 季节指数Simple price index 简单价格指数Price relative 价比Current period 现期,当期Base period 基期Unbiased estimator 无偏估计Consistent 一致的Lower confidence limit 置信上限Upper confidence limit置信下限Interval estimators 区间估计Simple average method 简单平均数方法Weighted index numbers 加权指数Average of weighted price relatives 加权价比平均指数11. 假设检验Hypothesis 假设Sample statistics 样本统计量Sampling variation 样本方差1-tailed test 单尾检验2-tailed test 双尾检验Test statistics 检验统计量Region of rejection 拒绝域Region of acceptance 接受域Alternative hypothesis 备选假设Null hypothesis 零假设(原假设)Critical value 临界值The level of significance 显著性水平Significance level 显著性水平Population parameters 总体参数Degrees of freedom 自由度Decision making 决策主要参考书目:1. 商务统计学——初级教程(3版),作者:戴维.M. 莱文,蒂莫西.C.克雷比尔,马克.L.贝伦森著;李鹏宇,许红燕等译,中国人民大学出版社2. 初级统计学(8版),作者:Mario F. Triola 著;刘新立译,清华大学出版社。
莱文《商务统计学(第7版)》完整学习笔记
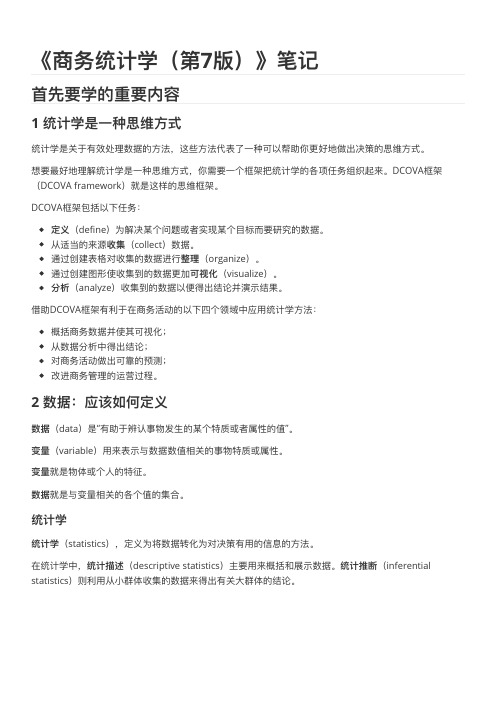
《商务统计学(第7版)》笔记⾸先要学的重要内容1 统计学是⼀种思维⽅式统计学是关于有效处理数据的⽅法,这些⽅法代表了⼀种可以帮助你更好地做出决策的思维⽅式。
想要最好地理解统计学是⼀种思维⽅式,你需要⼀个框架把统计学的各项任务组织起来。
DCOVA框架(DCOVA framework)就是这样的思维框架。
DCOVA框架包括以下任务:定义(define)为解决某个问题或者实现某个⽬标⽽要研究的数据。
从适当的来源收集(collect)数据。
通过创建表格对收集的数据进⾏整理(organize)。
通过创建图形使收集到的数据更加可视化(visualize)。
分析(analyze)收集到的数据以便得出结论并演示结果。
借助DCOVA框架有利于在商务活动的以下四个领域中应⽤统计学⽅法:概括商务数据并使其可视化;从数据分析中得出结论;对商务活动做出可靠的预测;改进商务管理的运营过程。
2 数据:应该如何定义数据(data)是“有助于辨认事物发⽣的某个特质或者属性的值”。
变量(variable)⽤来表示与数据数值相关的事物特质或属性。
变量就是物体或个⼈的特征。
数据就是与变量相关的各个值的集合。
统计学统计学(statistics),定义为将数据转化为对决策有⽤的信息的⽅法。
在统计学中,统计描述(descriptive statistics)主要⽤来概括和展示数据。
统计推断(inferential statistics)则利⽤从⼩群体收集的数据来得出有关⼤群体的结论。
3 统计学正在改变⾯貌商务分析学商务分析学(business analytics)将传统的统计⽅法与管理科学和信息科学⽅法结合在⼀起,形成了⼀套跨学科的分析⼯具,⽤来⽀持以事实为依据的管理决策。
商务分析学能够帮助你:应⽤统计⽅法分析和探讨数据,找出此前⼈们⽆法预料的事物间的关联关系。
应⽤管理科学的⽅法开发优化模型,改进从战略制定到各个层⾯的⽇常运营管理。
使⽤信息系统的⽅法来收集和处理不同容量的数据集,包括那些原本难以开展有效研究的容量巨⼤的收据集。
CH1INTRODUCTION TO STATISTICS(商务统计,英文版)
b)
c)
BEO1106 - Week 1
8
Ex 2: (Selvanathan, p.8, ex.1.6 (2000 edition – p.7, ex. 1.6)) You are shown a coin that its owner says is fair in the sense that it will produce the same number of heads and tails when flipped repeatedly. a) Describe an experiment to test this claim. Flip the coin, e.g. 30 times, and observe the outcomes (H or T). The claim is false, if H (or T) is not produced exactly 50% of the trials. What is the population in your experiment? The set of outcomes (H or T) of large number (e.g. 10 000) of possible trials. What is the sample? The set of outcomes (H or T) of the 30 trials actually performed.
Calculator: A calculator is essential for this subject. You are permitted to take to the exam any hand held scientific, statistical or graphics calculator. Subject Coordinator: Hubert Fernando Office Location: A534 Footscray Park Campus, E-mail: Hubert.Fernando@.au Telephone: 9919 4575 Tutorial times: After week-2 for all inquiries relating to tutorial times, contact: Ms Mira Machut, Footscray Park Campus, A543
Statistics for Business and Economics(英文版)(pdf 36页)

1. Involves
• Collecting Data
$
• Presenting Data
50
• Characterizing Data 25
2. Purpose
• Describe Data
0 Q1 Q2 Q3 Q4
GX = 30.5 S2 = tion, Inc
1.3
Fundamental Elements of Statistics
© 2011 Pearson Education, Inc
Fundamental Elements
1. Experimental unit
• Object upon which we collect data
2. Population
• Engineering
– Construction – Materials
• Sports
– Individual & Team Performance
• Business
– Consumer Preferences – Financial Trends
© 2011 Pearson Education, Inc
Inferential Statistics
1. Involves
• Estimation • Hypothesis
Testing
2. Purpose
• Make decisions about population characteristics
Population?
© 2011 Pearson Education, Inc
© 2011 Pearson Education, Inc
e.g., Average
Business Statistics
Business StatisticsBusiness statistics is a branch of statistics that deals with the collection, analysis, and interpretation of data that is relevant to business. It provides a framework for decision-making that is based on data-driven insights rather than gut instincts or the guesses of business owners and managers. Business statistics is used to answer questions like what customers want, how to price a product, how to market it, and how to optimize operations for efficiency and profitability.Types of Business StatisticsBusiness statistics can be divided into two main categories: descriptive and inferential statistics. Descriptive statistics are used to summarize and describe data, while inferential statistics are used to make inferences about a population based on a sample.Descriptive StatisticsDescriptive statistics can be used to describe central tendency (mean, median, and mode), dispersion (range, variance, and standard deviation), and skewness (symmetry or asymmetry) of data. Some common descriptive statistics used in business are:- Frequency distributions: Used to categorize data into intervals or classes, and show how frequently each interval appears in the data. - Measures of central tendency: Used to describe the location of the data, including the mean, median, and mode.- Measures of dispersion: Used to describe the spread of the data, including the range, variance, and standard deviation.- Skewness: Used to describe whether the data is symmetric (normal distribution) or skewed (non-normal distribution). Inferential StatisticsInferential statistics are used to make predictions or generalizations about a population based on a sample. Inferential statistics can be used to test hypotheses, estimate parameters, and calculate confidence intervals. Some common inferential statistics used in business are:- Hypothesis testing: Used to determine whether there is a significant difference between two groups or whether an observed correlation is statistically significant.- Confidence intervals: Used to estimate the range of values that a population parameter is likely to fall within.- Regression analysis: Used to model relationships between a dependent variable and one or more independent variables. Applications of Business StatisticsBusiness statistics has numerous applications in business, and is used to help companies make data-driven decisions. Some of the most common applications of business statistics include:1. Market ResearchBusinesses use market research to better understand their customers and their competitors. By collecting and analyzing data on customer behavior, preferences, and buying habits, companiescan make informed decisions about their products, pricing, and marketing strategies. Business statistics can be used to analyze data from surveys, focus groups, and other research methods.2. Financial ForecastingBusinesses use financial forecasting to predict future revenue, expenses, and profits. By analyzing historical data and forecasting future trends, companies can make informed decisions about investments, acquisitions, and other financial decisions. Business statistics can be used to develop financial models and analyze trends in financial data.3. Operations ManagementBusinesses use operations management to optimize their production processes and reduce costs. By collecting and analyzing data on operations, businesses can make informed decisions about how to improve efficiency, reduce waste, and increase productivity. Business statistics can be used to develop models for forecasting demand, optimizing inventory levels, and measuring efficiency.4. Quality ControlBusinesses use quality control to ensure that their products and services meet customer expectations. By collecting and analyzing data on product quality, businesses can make informed decisions about how to improve their products and reduce defects. Business statistics can be used to analyze data from quality control inspections, customer feedback, and other sources.ConclusionIn conclusion, business statistics is a powerful tool that enables businesses to make data-driven decisions. By collecting and analyzing data, businesses can gain insights into customer behavior, market trends, and operational efficiency. Business statistics can be used to improve product quality, increase efficiency, reduce costs, and optimize profits. Whether you are a small business owner or a Fortune 500 executive, business statistics can help you make informed decisions and achieve your business goals.5. Human Resources ManagementBusinesses use human resources management to recruit, train, and retain employees. By collecting and analyzing data on employee performance, satisfaction, and turnover, companies can make informed decisions about how to manage their workforce. Business statistics can be used to develop models for predicting employee turnover, measuring employee performance, and identifying areas for improvement in training programs.6. Risk ManagementBusinesses use risk management to identify and mitigate potential risks that could negatively impact their operations. By collecting and analyzing data on potential risks, businesses can make informed decisions about how to reduce their exposure to those risks. Business statistics can be used to develop models for predicting risks, measuring their likelihood and impact, and developing strategies for managing them.7. Sales and Marketing OptimizationBusinesses use sales and marketing optimization to improve their customer acquisition and retention rates. By collecting and analyzing data on customer behavior, campaign performance, and sales data, businesses can make informed decisions about how to optimize their sales and marketing strategies. Business statistics can be used to develop models for predicting customer behavior, measuring campaign effectiveness, and identifying areas for improvement in sales and marketing programs.8. Customer Service ImprovementBusinesses use customer service improvement to improve customer satisfaction and retention. By collecting and analyzing data on customer feedback, complaints, and satisfaction ratings, businesses can make informed decisions about how to improve their customer service offerings. Business statistics can be used to develop models for predicting customer satisfaction, measuring the impact of customer service initiatives, and identifying areas for improvement in customer service programs.9. Supply Chain ManagementBusinesses use supply chain management to optimize their supply chain operations and reduce costs. By collecting and analyzing data on inventory levels, lead times, and supplier performance, companies can make informed decisions about how to improve their supply chain efficiency. Business statistics can be used todevelop models for forecasting demand, optimizing inventory levels, and measuring supplier performance.10. Competitive AnalysisBusinesses use competitive analysis to understand their competitors and identify areas for improvement in their own operations. By collecting and analyzing data on competitor pricing, product offerings, and marketing strategies, businesses can make informed decisions about how to compete more effectively. Business statistics can be used to develop models for analyzing market share, measuring customer preferences, and predicting competitor behavior.In summary, business statistics is a crucial tool for businesses of all sizes and industries. By collecting and analyzing data, companies can make informed decisions about how to improve profitability, efficiency, customer satisfaction, and competitive advantage. Whether you are a small business owner or a Fortune 500 executive, business statistics can help you gain valuable insights into your operations and make data-driven decisions that lead to success.。
商务统计英文课件 (15)
Best Practices
§ Provide a context for your data. § Use clear names for your variables. § Distinguish numerical data from categorical data. § Track down the details when you get the data. § Keep track of the source of data.
examples
2.2 Categorical and Numerical Data
Measurement Scales
§ Nominal – name categories without implying order (categorical)
§ Ordinal – name categories that can be ordered (categorical)
§ Aggregate: reduce rows in a data table by counting or summing values within categories
2.3 Recoding and Aggregation
An Example of Aggregation
4M Example 2.1: MEDICAL ADVICE
Pitfalls
§ Do not assume that a list of numbers provides numerical data.
§ Don’t trust all of the data that you get from the Internet.
§ Don’t believe every claim based on survey data.
- 1、下载文档前请自行甄别文档内容的完整性,平台不提供额外的编辑、内容补充、找答案等附加服务。
- 2、"仅部分预览"的文档,不可在线预览部分如存在完整性等问题,可反馈申请退款(可完整预览的文档不适用该条件!)。
- 3、如文档侵犯您的权益,请联系客服反馈,我们会尽快为您处理(人工客服工作时间:9:00-18:30)。
Statistical hypothesis: claim about a parameter of a population. Null hypothesis (H0): specifies a default course of action, preserves the status quo. Alternative hypothesis (Ha): contradicts the assertion of the null hypothesis.
For Example, in a Normal Quantile Plot
H0: Data are a sample from a normally distributed population
There is only a 5% chance of any point lying outside limits. Data are close enough to line; we do not reject H0
16.1 Concepts of Statistical Tests
One- and Two-Sided Tests
One-sided test: the null hypothesis allows any value of a parameter larger (or smaller) than a specified value.
Two-sided test: the null hypothesis asserts a specific value for the population parameter.
16.1 Concepts of Statistical Tests
Type I and II Errors
Reject H0 incorrectly (buying software that will not be cost effective) Retain H0 incorrectly (not buying software that would have been cost effective)
For example, the null hypothesis in a visual test for association is that there is no association between two variables shown in the scatterplot.
16.1 Concepts of Statistical Tests
16.1 Concepts of Statistical Tests
SPAM Software Example Let p = email that slips past the filter H0: p ≥ 0.20 Ha: p < 0.20
These hypotheses lead to a one-sided test.
16.1 Concepts of Statistical Tests
Type I and II Errors
indicates a correct decision
16.1 Concepts of Statistical Tests
Other Tests
Visual inspection for association, normal quantile plots and control charts all use tests of hypotheses.
Use a statistical test to answer this question Consider the plausibility of a specific claim (claims are called hypotheses)
16.1 Concepts of Statistical Proportion
SPAM Software Example
The analysis of profitability indicates the manager should reject H0 and license the software only if is ˆ is small enough (less than a threshold). p
Key question: What is the chance of getting a test statistic this far from H0 if H0 is true?
16.2 Testing the Proportion
SPAM Software Example
Apparent savings of licensing the software depends on the sample proportion.
Statistical Tests
16.1 Concepts of Statistical Tests
A manager is evaluating software to filter SPAM e-mails (cost $15,000). To make it profitable, the software must reduce SPAM to less than 20%. Should the manager buy the software?
16.1 Concepts of Statistical Tests
Test Statistic
Statistical tests rely on the sampling distribution of the test statistic that estimates the parameter specified in the null and alternative hypotheses.