Triple Neutral Gauge Boson Couplings in Noncommutative Standard Model
PACSnumbers1215Ff,1130Hv,1210Dm,1125Mj…
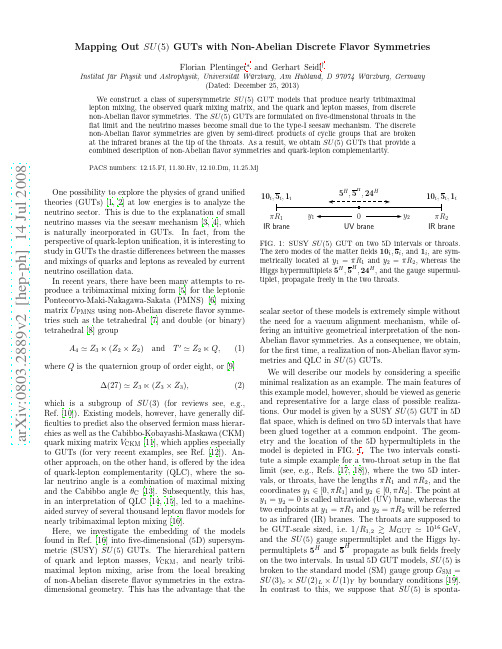
a r X i v :0803.2889v 2 [h e p -p h ] 14 J u l 2008Mapping Out SU (5)GUTs with Non-Abelian Discrete Flavor SymmetriesFlorian Plentinger ∗and Gerhart Seidl †Institut f¨u r Physik und Astrophysik,Universit¨a t W¨u rzburg,Am Hubland,D 97074W¨u rzburg,Germany(Dated:December 25,2013)We construct a class of supersymmetric SU (5)GUT models that produce nearly tribimaximal lepton mixing,the observed quark mixing matrix,and the quark and lepton masses,from discrete non-Abelian flavor symmetries.The SU (5)GUTs are formulated on five-dimensional throats in the flat limit and the neutrino masses become small due to the type-I seesaw mechanism.The discrete non-Abelian flavor symmetries are given by semi-direct products of cyclic groups that are broken at the infrared branes at the tip of the throats.As a result,we obtain SU (5)GUTs that provide a combined description of non-Abelian flavor symmetries and quark-lepton complementarity.PACS numbers:12.15.Ff,11.30.Hv,12.10.Dm,One possibility to explore the physics of grand unified theories (GUTs)[1,2]at low energies is to analyze the neutrino sector.This is due to the explanation of small neutrino masses via the seesaw mechanism [3,4],which is naturally incorporated in GUTs.In fact,from the perspective of quark-lepton unification,it is interesting to study in GUTs the drastic differences between the masses and mixings of quarks and leptons as revealed by current neutrino oscillation data.In recent years,there have been many attempts to re-produce a tribimaximal mixing form [5]for the leptonic Pontecorvo-Maki-Nakagawa-Sakata (PMNS)[6]mixing matrix U PMNS using non-Abelian discrete flavor symme-tries such as the tetrahedral [7]and double (or binary)tetrahedral [8]groupA 4≃Z 3⋉(Z 2×Z 2)and T ′≃Z 2⋉Q,(1)where Q is the quaternion group of order eight,or [9]∆(27)≃Z 3⋉(Z 3×Z 3),(2)which is a subgroup of SU (3)(for reviews see, e.g.,Ref.[10]).Existing models,however,have generally dif-ficulties to predict also the observed fermion mass hierar-chies as well as the Cabibbo-Kobayashi-Maskawa (CKM)quark mixing matrix V CKM [11],which applies especially to GUTs (for very recent examples,see Ref.[12]).An-other approach,on the other hand,is offered by the idea of quark-lepton complementarity (QLC),where the so-lar neutrino angle is a combination of maximal mixing and the Cabibbo angle θC [13].Subsequently,this has,in an interpretation of QLC [14,15],led to a machine-aided survey of several thousand lepton flavor models for nearly tribimaximal lepton mixing [16].Here,we investigate the embedding of the models found in Ref.[16]into five-dimensional (5D)supersym-metric (SUSY)SU (5)GUTs.The hierarchical pattern of quark and lepton masses,V CKM ,and nearly tribi-maximal lepton mixing,arise from the local breaking of non-Abelian discrete flavor symmetries in the extra-dimensional geometry.This has the advantage that theFIG.1:SUSY SU (5)GUT on two 5D intervals or throats.The zero modes of the matter fields 10i ,5H,24H ,and the gauge supermul-tiplet,propagate freely in the two throats.scalar sector of these models is extremely simple without the need for a vacuum alignment mechanism,while of-fering an intuitive geometrical interpretation of the non-Abelian flavor symmetries.As a consequence,we obtain,for the first time,a realization of non-Abelian flavor sym-metries and QLC in SU (5)GUTs.We will describe our models by considering a specific minimal realization as an example.The main features of this example model,however,should be viewed as generic and representative for a large class of possible realiza-tions.Our model is given by a SUSY SU (5)GUT in 5D flat space,which is defined on two 5D intervals that have been glued together at a common endpoint.The geom-etry and the location of the 5D hypermultiplets in the model is depicted in FIG.1.The two intervals consti-tute a simple example for a two-throat setup in the flat limit (see,e.g.,Refs.[17,18]),where the two 5D inter-vals,or throats,have the lengths πR 1and πR 2,and the coordinates y 1∈[0,πR 1]and y 2∈[0,πR 2].The point at y 1=y 2=0is called ultraviolet (UV)brane,whereas the two endpoints at y 1=πR 1and y 2=πR 2will be referred to as infrared (IR)branes.The throats are supposed to be GUT-scale sized,i.e.1/R 1,2 M GUT ≃1016GeV,and the SU (5)gauge supermultiplet and the Higgs hy-permultiplets 5H and2neously broken to G SM by a 24H bulk Higgs hypermulti-plet propagating in the two throats that acquires a vac-uum expectation value pointing in the hypercharge direc-tion 24H ∝diag(−12,13,15i ,where i =1,2,3is the generation index.Toobtainsmall neutrino masses via the type-I seesaw mechanism [3],we introduce three right-handed SU (5)singlet neutrino superfields 1i .The 5D Lagrangian for the Yukawa couplings of the zero mode fermions then readsL 5D =d 2θ δ(y 1−πR 1) ˜Y uij,R 110i 10j 5H +˜Y d ij,R 110i 5H +˜Y νij,R 15j5i 1j 5H +M R ˜Y R ij,R 21i 1j+h.c. ,(3)where ˜Y x ij,R 1and ˜Y x ij,R 2(x =u,d,ν,R )are Yukawa cou-pling matrices (with mass dimension −1/2)and M R ≃1014GeV is the B −L breaking scale.In the four-dimensional (4D)low energy effective theory,L 5D gives rise to the 4D Yukawa couplingsL 4D =d 2θ Y u ij 10i 10j 5H +Y dij10i 5H +Y νij5i ∼(q i 1,q i 2,...,q i m ),(5)1i ∼(r i 1,r i 2,...,r im ),where the j th entry in each row vector denotes the Z n jcharge of the representation.In the 5D theory,we sup-pose that the group G A is spontaneously broken by singly charged flavon fields located at the IR branes.The Yukawa coupling matrices of quarks and leptons are then generated by the Froggatt-Nielsen mechanism [21].Applying a straightforward generalization of the flavor group space scan in Ref.[16]to the SU (5)×G A represen-tations in Eq.(5),we find a large number of about 4×10²flavor models that produce the hierarchies of quark and lepton masses and yield the CKM and PMNS mixing angles in perfect agreement with current data.A distri-bution of these models as a function of the group G A for increasing group order is shown in FIG.2.The selection criteria for the flavor models are as follows:First,all models have to be consistent with the quark and charged3 lepton mass ratiosm u:m c:m t=ǫ6:ǫ4:1,m d:m s:m b=ǫ4:ǫ2:1,(6)m e:mµ:mτ=ǫ4:ǫ2:1,and a normal hierarchical neutrino mass spectrumm1:m2:m3=ǫ2:ǫ:1,(7)whereǫ≃θC≃0.2is of the order of the Cabibbo angle.Second,each model has to reproduce the CKM anglesV us∼ǫ,V cb∼ǫ2,V ub∼ǫ3,(8)as well as nearly tribimaximal lepton mixing at3σCLwith an extremely small reactor angle 1◦.In perform-ing the group space scan,we have restricted ourselves togroups G A with orders roughly up to 102and FIG.2shows only groups admitting more than three valid mod-els.In FIG.2,we can observe the general trend thatwith increasing group order the number of valid modelsper group generally increases too.This rough observa-tion,however,is modified by a large“periodic”fluctu-ation of the number of models,which possibly singlesout certain groups G A as particularly interesting.Thehighly populated groups would deserve further system-atic investigation,which is,however,beyond the scopeof this paper.From this large set of models,let us choose the groupG A=Z3×Z8×Z9and,in the notation of Eq.(5),thecharge assignment101∼(1,1,6),102∼(0,3,1),103∼(0,0,0),52∼(0,7,0),52↔4FIG.3:Effect of the non-Abelian flavor symmetry on θ23for a 10%variation of all Yukawa couplings.Shown is θ23as a function of ǫfor the flavor group G A (left)and G A ⋉G B (right).The right plot illustrates the exact prediction of the zeroth order term π/4in the expansion θ23=π/4+ǫ/√2and the relation θ13≃ǫ2.The important point is that in the expression for θ23,the leading order term π/4is exactly predicted by thenon-Abelian flavor symmetry G F =G A ⋉G B (see FIG.3),while θ13≃θ2C is extremely small due to a suppression by the square of the Cabibbo angle.We thus predict a devi-ation ∼ǫ/√2,which is the well-known QLC relation for the solar angle.There have been attempts in the literature to reproduce QLC in quark-lepton unified models [26],however,the model presented here is the first realization of QLC in an SU (5)GUT.Although our analysis has been carried out for the CP conserving case,a simple numerical study shows that CP violating phases (cf.Ref.[27])relevant for neutri-noless double beta decay and leptogenesis can be easily included as well.Concerning proton decay,note that since SU (5)is bro-ken by a bulk Higgs field,the broken gauge boson masses are ≃M GUT .Therefore,all fermion zero modes can be localized at the IR branes of the throats without intro-ducing rapid proton decay through d =6operators.To achieve doublet-triplet splitting and suppress d =5pro-ton decay,we may then,e.g.,resort to suitable extensions of the Higgs sector [28].Moreover,although the flavor symmetry G F is global,quantum gravity effects might require G F to be gauged [29].Anomalies can then be canceled by Chern-Simons terms in the 5D bulk.We emphasize that the above discussion is focussed on a specific minimal example realization of the model.Many SU (5)GUTs with non-Abelian flavor symmetries,however,can be constructed along the same lines by varying the flavor charge assignment,choosing different groups G F ,or by modifying the throat geometry.A de-tailed analysis of these models and variations thereof will be presented in a future publication [30].To summarize,we have discussed the construction of 5D SUSY SU (5)GUTs that yield nearly tribimaximal lepton mixing,as well as the observed CKM mixing matrix,together with the hierarchy of quark and lepton masses.Small neutrino masses are generated only by the type-I seesaw mechanism.The fermion masses and mixings arise from the local breaking of non-Abelian flavor symmetries at the IR branes of a flat multi-throat geometry.For an example realization,we have shown that the non-Abelian flavor symmetries can exactly predict the leading order term π/4in the sum rule for the atmospheric mixing angle,while strongly suppress-ing the reactor angle.This makes this class of models testable in future neutrino oscillation experiments.In addition,we arrive,for the first time,at a combined description of QLC and non-Abelian flavor symmetries in SU (5)GUTs.One main advantage of our setup with throats is that the necessary symmetry breaking can be realized with a very simple Higgs sector and that it can be applied to and generalized for a large class of unified models.We would like to thank T.Ohl for useful comments.The research of F.P.is supported by Research Train-ing Group 1147“Theoretical Astrophysics and Particle Physics ”of Deutsche Forschungsgemeinschaft.G.S.is supported by the Federal Ministry of Education and Re-search (BMBF)under contract number 05HT6WWA.∗********************************.de †**************************.de[1]H.Georgi and S.L.Glashow,Phys.Rev.Lett.32,438(1974);H.Georgi,in Proceedings of Coral Gables 1975,Theories and Experiments in High Energy Physics ,New York,1975.[2]J.C.Pati and A.Salam,Phys.Rev.D 10,275(1974)[Erratum-ibid.D 11,703(1975)].[3]P.Minkowski,Phys.Lett.B 67,421(1977);T.Yanagida,in Proceedings of the Workshop on the Unified Theory and Baryon Number in the Universe ,KEK,Tsukuba,1979;M.Gell-Mann,P.Ramond and R.Slansky,in Pro-ceedings of the Workshop on Supergravity ,Stony Brook,5New York,1979;S.L.Glashow,in Proceedings of the 1979Cargese Summer Institute on Quarks and Leptons, New York,1980.[4]M.Magg and C.Wetterich,Phys.Lett.B94,61(1980);R.N.Mohapatra and G.Senjanovi´c,Phys.Rev.Lett.44, 912(1980);Phys.Rev.D23,165(1981);J.Schechter and J.W. F.Valle,Phys.Rev.D22,2227(1980);zarides,Q.Shafiand C.Wetterich,Nucl.Phys.B181,287(1981).[5]P.F.Harrison,D.H.Perkins and W.G.Scott,Phys.Lett.B458,79(1999);P.F.Harrison,D.H.Perkins and W.G.Scott,Phys.Lett.B530,167(2002).[6]B.Pontecorvo,Sov.Phys.JETP6,429(1957);Z.Maki,M.Nakagawa and S.Sakata,Prog.Theor.Phys.28,870 (1962).[7]E.Ma and G.Rajasekaran,Phys.Rev.D64,113012(2001);K.S.Babu,E.Ma and J.W.F.Valle,Phys.Lett.B552,207(2003);M.Hirsch et al.,Phys.Rev.D 69,093006(2004).[8]P.H.Frampton and T.W.Kephart,Int.J.Mod.Phys.A10,4689(1995); A.Aranda, C. D.Carone and R.F.Lebed,Phys.Rev.D62,016009(2000);P.D.Carr and P.H.Frampton,arXiv:hep-ph/0701034;A.Aranda, Phys.Rev.D76,111301(2007).[9]I.de Medeiros Varzielas,S.F.King and G.G.Ross,Phys.Lett.B648,201(2007);C.Luhn,S.Nasri and P.Ramond,J.Math.Phys.48,073501(2007);Phys.Lett.B652,27(2007).[10]E.Ma,arXiv:0705.0327[hep-ph];G.Altarelli,arXiv:0705.0860[hep-ph].[11]N.Cabibbo,Phys.Rev.Lett.10,531(1963);M.Kobayashi and T.Maskawa,Prog.Theor.Phys.49, 652(1973).[12]M.-C.Chen and K.T.Mahanthappa,Phys.Lett.B652,34(2007);W.Grimus and H.Kuhbock,Phys.Rev.D77, 055008(2008);F.Bazzocchi et al.,arXiv:0802.1693[hep-ph];G.Altarelli,F.Feruglio and C.Hagedorn,J.High Energy Phys.0803,052(2008).[13]A.Y.Smirnov,arXiv:hep-ph/0402264;M.Raidal,Phys.Rev.Lett.93,161801(2004);H.Minakata andA.Y.Smirnov,Phys.Rev.D70,073009(2004).[14]F.Plentinger,G.Seidl and W.Winter,Nucl.Phys.B791,60(2008).[15]F.Plentinger,G.Seidl and W.Winter,Phys.Rev.D76,113003(2007).[16]F.Plentinger,G.Seidl and W.Winter,J.High EnergyPhys.0804,077(2008).[17]G.Cacciapaglia,C.Csaki,C.Grojean and J.Terning,Phys.Rev.D74,045019(2006).[18]K.Agashe,A.Falkowski,I.Low and G.Servant,J.HighEnergy Phys.0804,027(2008);C.D.Carone,J.Erlich and M.Sher,arXiv:0802.3702[hep-ph].[19]Y.Kawamura,Prog.Theor.Phys.105,999(2001);G.Altarelli and F.Feruglio,Phys.Lett.B511,257(2001);A.B.Kobakhidze,Phys.Lett.B514,131(2001);A.Hebecker and J.March-Russell,Nucl.Phys.B613,3(2001);L.J.Hall and Y.Nomura,Phys.Rev.D66, 075004(2002).[20]D.E.Kaplan and T.M.P.Tait,J.High Energy Phys.0111,051(2001).[21]C.D.Froggatt and H.B.Nielsen,Nucl.Phys.B147,277(1979).[22]Y.Nomura,Phys.Rev.D65,085036(2002).[23]H.Georgi and C.Jarlskog,Phys.Lett.B86,297(1979).[24]H.Arason et al.,Phys.Rev.Lett.67,2933(1991);H.Arason et al.,Phys.Rev.D47,232(1993).[25]D.S.Ayres et al.[NOνA Collaboration],arXiv:hep-ex/0503053;Y.Hayato et al.,Letter of Intent.[26]S.Antusch,S.F.King and R.N.Mohapatra,Phys.Lett.B618,150(2005).[27]W.Winter,Phys.Lett.B659,275(2008).[28]K.S.Babu and S.M.Barr,Phys.Rev.D48,5354(1993);K.Kurosawa,N.Maru and T.Yanagida,Phys.Lett.B 512,203(2001).[29]L.M.Krauss and F.Wilczek,Phys.Rev.Lett.62,1221(1989).[30]F.Plentinger and G.Seidl,in preparation.。
正负电子对撞机上三规范粒子的伴随产生

正负电子对撞机上三规范粒子的伴随产生李小龙;武悦;吕立庭;宋昴【摘要】在标准型的理论框架下研究了国际直线对撞机(ILC)上W+W-Z、ZZZ的产生过程,给出了这两个过程在不同对撞能量下的截面,结果显示这两个过程的反应截面都很大,有足够的事件进行实验分析.还给出了这两个过程在能量为500 GeV 时末态W和Z粒子的横动量分布.【期刊名称】《宜宾学院学报》【年(卷),期】2014(014)006【总页数】3页(P30-32)【关键词】国际直线对撞机;规范耦合;标准模型【作者】李小龙;武悦;吕立庭;宋昴【作者单位】安徽大学物理与材料科学学院,安徽合肥230039;安徽大学物理与材料科学学院,安徽合肥230039;安徽大学物理与材料科学学院,安徽合肥230039;安徽大学物理与材料科学学院,安徽合肥230039【正文语种】中文【中图分类】O572标准模型是建立在SU(2)×U(1)对称群下的规范理论.通过电弱对称性的破缺,从而使基本粒子获得了质量[1-6].规范对称性对规范粒子的三线和四线耦合给出了严格的限制,任何超出标准模型的反常耦合都会在实验上引起大的偏差.多个规范粒子的伴随产生非常适合研究规范粒子的自耦合,尤其对于四线耦合,只有末态三个以上规范粒子伴随产生才会出现四线耦合的顶点.如果存在超出标准模型反常的规范耦合,实验上探测到的事例将与标准模型的预言有很大不同.因此,给出标准模型框架下多规范粒子在高能对撞机上伴随产生过程的理论预言是非常有意义的工作.计划建造的国际直线对撞机(ILC)是对撞能量在200到500 GeV的正负电子对撞机,升级以后可以达到1 TeV[7].相比于强子对撞机,正负电子对撞机的背景非常干净,对撞能量可以调节,并且正负电子的束流可以极化.在标准模型以及许多超出标准模型的其他模型下,研究正负电子对撞机上三规范粒子伴随产生和反常耦合的工作已经有很多[8-11].本文将在标准型的理论框架下研究ILC上W+W-Z、ZZZ的产生过程.在标准模型中,四线耦合只有W+W-AA、W+W-ZZ、W+W-AZ、W+W-W+W-四种耦合形式.在e+e¯→W+W-Z、ZZZ过程中,涉及到W+W-AA、W+W-ZZ、W+W-AZ这三种耦合.对应顶点的费曼规则为:采用FeynArts 3.3[12]程序包产生对应的费曼图和对应的费曼幅度,然后调用FormCalc 5.3[13]程序包进行费曼幅度的化简和γ矩阵的收缩,最后转化为Fortran程序进行数值运算.计算中采用’t Hooft-Feynman规范.计算过程可以表示为:这两个过程的微分截面可以表示为:其中,M代表各个过程所有的费曼幅度相加,1/4是对初态粒子的自旋求平均.Σ表示对所有的初末态粒子的自旋求平均.e+e¯→ZZZ的过程,由于末态是三个全同粒子,整个反应截面还需要除以3的阶乘.三体末态的相空间矩阵元dΦ3定义为:在数值计算中选取下面的相关参数[14]:图1(a,b)分别给出了e+e-→W+W-Z、ZZZ反应截面随着质心系能量变化的曲线.从图中可看出,随着质心系能量的增加,这两个过程的反应截面变化趋势是不一样的.当能量从300 GeV增加到1 000 GeV时,e+e-→W+W-Z过程的截面从36.24 fb增加到65.19 fb;对于e+e-→ZZZ过程,总截面不是单调增加,而是先增大后减小,在能量约等于550 GeV的地方有最大值,并且这个过程的总截面要比e+e-→W+W-Z过程的截面小几十倍.当然,由于ILC的年积分亮度非常高,约每年100 fb-1,这两个过程都可以收集到足够的事例.对于e+e-→W+W-Z来说,每年可以收集几千个事例;对于e+e-→ZZZ过程也可以收集到一百多个事例.这对于检验标准模型,或者给出是否有超出标准模型的新物理都是非常重要的.对于e+e-→W+W-Z过程,随着能量的增加,产生的事例也越多,这对于能量不断提高的ILC来说是有利于实验的探测的.而对于e+e-→ZZZ过程,能量的增加并不是探测这个过程最好的方式,因为这个过程是一个S道占优的过程,反应截面正比于质心系能量的倒数,随着能量的增加反应截面反而会减小.为了清楚给出图1中的结果,表1列出了能量为300 GeV、500 GeV、800 GeV和1 000 GeV四个能量时对应的反应截面,并且给出了对应的数值运算的积分误差.三规范玻色子产生是检验标准模型非常重要的过程,然而由于之前的大型正负电子对撞机LEP的能量最高只有200 GeV,没有达到产生三规范粒子的阈值,所以不能用来研究这些过程,即将建造的国际直线对撞机ILC正是为了弥补LEP的不足而设计的能量为500 GeV的正负电子对撞机.这些过程在ILC上将有足够多的事例可以产生,并且用来检验标准模型和发现一些新物理.图2给出了ILC上质心系能量为500 GeV时,e+e-→W+W-Z、ZZZ过程末态粒子W和Z玻色子的横动量分布.图2(a)分别给出了e+e-→W+W-Z中W和Z玻色子的横动量分布.由于在标准模型中CP守恒,W+和W-粒子的分布是相同的,因此这里不再区分W+和W-.图2 (b)给出了e+e-→ZZZ中Z玻色子的横动量分布,其中三个Z粒子是全同粒子,分布也应该相同,只需要给出其中一个的分布就可以了.从图中可以看出,W和Z玻色子的横动量分布都在横动量约等于50GeV处出现极大值.这是由于在横动量很小或很大的区域,相空间比较小,粒子在这些地方产生的几率也要小,而横动量为50 GeV附近是相空间最大的地方,产生的粒子也应该最多.横动量是一个重要的可观测量,它的分布与选取的参考系无关,对于理论计算与实验观测都非常方便.通过给出末态粒子横动量的分布,实验上不仅可以对比总截面的大小,还可以与不同横动量处的微分截面相比较.这也为实验观测提供了理论依据.本文在标准型的理论框架下,研究了国际直线对撞机(ILC)上W+W-Z、ZZZ的产生过程,计算了这两个过程在对撞能量从300 GeV到1TeV的总截面,并且绘制了这两个过程末态粒子W和Z玻色子的横动量分布.理论计算表明,这两个过程的反应截面比较大,在ILC上将有足够多的事例产生,为检验标准模型的规范粒子四线耦合和寻找超出标准模型的新物理提供了理论依据.【相关文献】[1]Glashow S L.Partial-symmetries of weak interactions[J].Nucl Phys, 1961,22(4):579-588.[2]Weinberg S.A model of leptons[J].Phys Rev Lett,1967,19:1264.[3]Politzer H D.Asymptotic freedom:an approach to strong interactions[J]. PhysRep,1974,14:129-180.[4]Englert F,Brout R.Broken symmetry and the mass of gauge vector mesons[J].Phys Rev Lett,1964,13:321.[5]Higgs P W.Broken symmetries,massless particles and gauge fields[J]. PhysLett,1964,12(2):132-133.[6]Higgs P W.Broken symmetries and the masses of gauge bosons[J].Phys RevLett,1964,13:508.[7]Barish B,Brau J E.The international linear collider[J].Int J Mod PhysA,2013,28(27):1330039.[8]Sun W,Ma W G,Zhang R Y,et al.Full electroweak one-loop corrections to W+W-Z0 production at the ILC[J].Phys Lett B,2009,680: 321-327.[9]Su J J,Ma W G,Zhang R Y,et plete one-loop electroweak corrections to ZZZ production at the ILC[J].Phys Rev D,2008,78:016007.[10]Han T,He H J,Yuan C P.Quartic gauge boson couplings at linear colliders:Interplay of WWZ/ZZZ production and WW fusion[J].Phys Lett B,1998,422:294.[11]Jiang R C,Li X Z,Ma W G,et al.Triple Z0-boson production in large extra dimensions model at ILC[J].Chin Phys Lett,2012,29:111101.[12]Hahn T.Generating Feynman diagrams and amplitudes with FeynArts 3 [J].Comput Phys Commun,2001,140:418-431.[13]Hahn T,Perez-Victoria M.Automatized one-loop calculations in 4 and d dimensions[J].Comput Phys Commun,1999,118:153-165.[14]Amsler C,Doser M,Antonelli M,et al.Review of Particle Physics[J]. Phys LettB,2008,667:1-6.。
英语
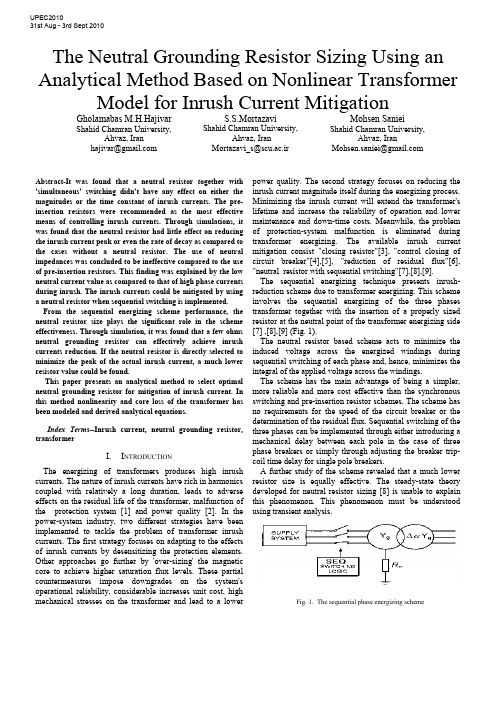
The Neutral Grounding Resistor Sizing Using an Analytical Method Based on Nonlinear Transformer Model for Inrush Current MitigationGholamabas M.H.Hajivar Shahid Chamran University,Ahvaz, Iranhajivar@S.S.MortazaviShahid Chamran University,Ahvaz, IranMortazavi_s@scu.ac.irMohsen SanieiShahid Chamran University,Ahvaz, IranMohsen.saniei@Abstract-It was found that a neutral resistor together with 'simultaneous' switching didn't have any effect on either the magnitudes or the time constant of inrush currents. The pre-insertion resistors were recommended as the most effective means of controlling inrush currents. Through simulations, it was found that the neutral resistor had little effect on reducing the inrush current peak or even the rate of decay as compared to the cases without a neutral resistor. The use of neutral impedances was concluded to be ineffective compared to the use of pre-insertion resistors. This finding was explained by the low neutral current value as compared to that of high phase currents during inrush. The inrush currents could be mitigated by using a neutral resistor when sequential switching is implemented. From the sequential energizing scheme performance, the neutral resistor size plays the significant role in the scheme effectiveness. Through simulation, it was found that a few ohms neutral grounding resistor can effectively achieve inrush currents reduction. If the neutral resistor is directly selected to minimize the peak of the actual inrush current, a much lower resistor value could be found.This paper presents an analytical method to select optimal neutral grounding resistor for mitigation of inrush current. In this method nonlinearity and core loss of the transformer has been modeled and derived analytical equations.Index Terms--Inrush current, neutral grounding resistor, transformerI.I NTRODUCTIONThe energizing of transformers produces high inrush currents. The nature of inrush currents have rich in harmonics coupled with relatively a long duration, leads to adverse effects on the residual life of the transformer, malfunction of the protection system [1] and power quality [2]. In the power-system industry, two different strategies have been implemented to tackle the problem of transformer inrush currents. The first strategy focuses on adapting to the effects of inrush currents by desensitizing the protection elements. Other approaches go further by 'over-sizing' the magnetic core to achieve higher saturation flux levels. These partial countermeasures impose downgrades on the system's operational reliability, considerable increases unit cost, high mechanical stresses on the transformer and lead to a lower power quality. The second strategy focuses on reducing the inrush current magnitude itself during the energizing process. Minimizing the inrush current will extend the transformer's lifetime and increase the reliability of operation and lower maintenance and down-time costs. Meanwhile, the problem of protection-system malfunction is eliminated during transformer energizing. The available inrush current mitigation consist "closing resistor"[3], "control closing of circuit breaker"[4],[5], "reduction of residual flux"[6], "neutral resistor with sequential switching"[7],[8],[9].The sequential energizing technique presents inrush-reduction scheme due to transformer energizing. This scheme involves the sequential energizing of the three phases transformer together with the insertion of a properly sized resistor at the neutral point of the transformer energizing side [7] ,[8],[9] (Fig. 1).The neutral resistor based scheme acts to minimize the induced voltage across the energized windings during sequential switching of each phase and, hence, minimizes the integral of the applied voltage across the windings.The scheme has the main advantage of being a simpler, more reliable and more cost effective than the synchronous switching and pre-insertion resistor schemes. The scheme has no requirements for the speed of the circuit breaker or the determination of the residual flux. Sequential switching of the three phases can be implemented through either introducing a mechanical delay between each pole in the case of three phase breakers or simply through adjusting the breaker trip-coil time delay for single pole breakers.A further study of the scheme revealed that a much lower resistor size is equally effective. The steady-state theory developed for neutral resistor sizing [8] is unable to explain this phenomenon. This phenomenon must be understood using transient analysis.Fig. 1. The sequential phase energizing schemeUPEC201031st Aug - 3rd Sept 2010The rise of neutral voltage is the main limitation of the scheme. Two methods present to control the neutral voltage rise: the use of surge arrestors and saturated reactors connected to the neutral point. The use of surge arresters was found to be more effective in overcoming the neutral voltage rise limitation [9].The main objective of this paper is to derive an analytical relationship between the peak of the inrush current and the size of the resistor. This paper presents a robust analytical study of the transformer energizing phenomenon. The results reveal a good deal of information on inrush currents and the characteristics of the sequential energizing scheme.II. SCHEME PERFORMANCESince the scheme adopts sequential switching, each switching stage can be investigated separately. For first-phase switching, the scheme's performance is straightforward. The neutral resistor is in series with the energized phase and this resistor's effect is similar to a pre-insertion resistor.The second- phase energizing is one of the most difficult to analyze. Fortunately, from simulation studies, it was found that the inrush current due to second-phase energizing is lower than that due to first-phase energizing for the same value of n R [9]. This result is true for the region where the inrush current of the first-phase is decreasing rapidly as n R increases. As a result, when developing a neutral-resistor-sizing criterion, the focus should be directed towards the analysis of the first-phase energizing.III. A NALYSIS OF F IRST -P HASE E NERGIZING The following analysis focuses on deriving an inrush current waveform expression covering both the unsaturatedand saturated modes of operation respectively. The presented analysis is based on a single saturated core element, but is suitable for analytical modelling of the single-phase transformers and for the single-phase switching of three-phase transformers. As shown in Fig. 2, the transformer's energized phase was modeled as a two segmented saturated magnetizing inductance in series with the transformer's winding resistance, leakage inductance and neutral resistance. The iron core non-l inear inductance as function of the operating flux linkages is represented as a linear inductor inunsaturated ‘‘m l ’’ and saturated ‘‘s l ’’ modes of operation respectively. (a)(b)Fig. 2. (a) Transformer electrical equivalent circuit (per-phase) referred to the primary side. (b) Simplified, two slope saturation curve.For the first-phase switching stage, the equivalent circuit represented in Fig. 2(a) can accurately represent behaviour of the transformer for any connection or core type by using only the positive sequence Flux-Current characteristics. Based on the transformer connection and core structure type, the phases are coupled either through the electrical circuit (3 single phase units in Yg-D connection) or through the Magnetic circuit (Core type transformers with Yg-Y connection) or through both, (the condition of Yg-D connection in an E-Core or a multi limb transformer). The coupling introduced between the windings will result in flux flowing through the limbs or magnetic circuits of un-energized phases. For the sequential switching application, the magnetic coupling will result in an increased reluctance (decreased reactance) for zero sequence flux path if present. The approach presented here is based on deriving an analytical expression relating the amount of inrush current reduction directly to the neutral resistor size. Investigation in this field has been done and some formulas were given to predict the general wave shape or the maximum peak current.A. Expression for magnitude of inrush currentIn Fig. 2(a), p r and p l present the total primary side resistance and leakage reactance. c R shows the total transformer core loss. Secondary side resistance sp r and leakage reactance sp l as referred to primary side are also shown. P V and s V represent the primary and secondary phase to ground terminal voltages, respectively.During first phase energizing, the differential equation describing behaviour of the transformer with saturated ironcore can be written as follows:()())sin((2) (1)φω+⋅⋅=⋅+⋅+⋅+=+⋅+⋅+=t V (t)V dtdi di d λdt di l (t)i R r (t)V dt d λdt di l (t)i R r (t)V m P ll p pp n p P p p p n p PAs the rate of change of the flux linkages with magnetizing current dt d /λcan be represented as an inductance equal to the slope of the i −λcurve, (2) can be re-written as follows;()(3) )()()(dtdi L dt di l t i R r t V lcore p p P n p P ⋅+⋅+⋅+=λ (4) )()(L core l p c l i i R dtdi−⋅=⋅λ⎩⎨⎧==sml core L L di d L λλ)(s s λλλλ>≤The general solution of the differential equations (3),(4) has the following form;⎪⎩⎪⎨⎧>−⋅⋅+−⋅+−−⋅+≤−⋅⋅+−⋅+−⋅=(5) )sin(//)()( )sin(//)(s s 22222221211112121111λλψωττλλψωττt B t e A t t e i A t B t e A t e A t i s s pSubscripts 11,12 and 21,22 denote un-saturated and saturated operation respectively. The parameters given in the equation (5) are given by;() )(/12221σ⋅++⎟⎟⎠⎞⎜⎜⎝⎛⋅−++⋅=m p c p m n p c m m x x R x x R r R x V B()2222)(/1σ⋅++⎟⎟⎠⎞⎜⎜⎝⎛⋅−++⋅=s p c p s n p c s m x x R x x R r R x V B⎟⎟⎟⎟⎟⎠⎞⎜⎜⎜⎜⎜⎝⎛⋅−+++=⋅−−⎟⎟⎟⎠⎞⎜⎜⎜⎝⎛−c p m n p m p c m R x x R r x x R x σφψ111tan tan ⎟⎟⎟⎟⎟⎠⎞⎜⎜⎜⎜⎜⎝⎛⋅−+++=⋅−−⎟⎟⎟⎠⎞⎜⎜⎜⎝⎛−c p s n p s p c m R R r x x R x σφψ112tan tan )sin(111211ψ⋅=+B A A )sin(222221s t B A A ⋅−⋅=+ωψ mp n p m p m p m p c xx R r x x x x x x R ⋅⋅+⋅−⋅+−⋅+⋅⋅⋅=)(4)()(21211σστm p n p m p m p m p c xx R r x x x x x x R ⋅⋅+⋅−⋅++⋅+⋅⋅⋅=)(4)()(21212σστ s p n p s p s p s p xx R r x x x x x x c R ⋅⋅+⋅−⋅+−⋅+⋅⋅⋅=)(4)()(21221σστ sp n p s p s p sp c xx R r x x x x x x R ⋅⋅+⋅−⋅++⋅+⋅⋅⋅=)(4)()(21222σστ ⎟⎟⎠⎞⎜⎜⎝⎛−⋅==s rs s ri i λλλ10 cnp R R r ++=1σ21221112 , ττττ>>>>⇒>>c R , 012≈A , 022≈A According to equation (5), the required inrush waveform assuming two-part segmented i −λcurve can be calculated for two separate un-saturated and saturated regions. For thefirst unsaturated mode, the current can be directly calculated from the first equation for all flux linkage values below the saturation level. After saturation is reached, the current waveform will follow the second given expression for fluxlinkage values above the saturation level. The saturation time s t can be found at the time when the current reaches the saturation current level s i .Where m λ,r λ,m V and ωare the nominal peak flux linkage, residual flux linkage, peak supply voltage and angular frequency, respectivelyThe inrush current waveform peak will essentially exist during saturation mode of operation. The focus should be concentrated on the second current waveform equation describing saturated operation mode, equation (5). The expression of inrush current peak could be directly evaluated when both saturation time s t and peak time of the inrush current waveform peak t t =are known [9].(10))( (9) )(2/)(222222121//)()(2B eA t e i A peak peak t s t s n peak n n peak R I R R t +−⋅+−−⋅+=+=ττωψπThe peak time peak t at which the inrush current will reachits peak can be numerically found through setting the derivative of equation (10) with respect to time equal to zero at peak t t =.()(11) )sin(/)(022222221212221/ψωωττττ−⋅⋅⋅−−−⋅+−=+−⋅peak t s t B A t te A i peak s peakeThe inrush waveform consists of exponentially decaying'DC' term and a sinusoidal 'AC' term. Both DC and AC amplitudes are significantly reduced with the increase of the available series impedance. The inrush waveform, neglecting the relatively small saturating current s i ,12A and 22A when extremely high could be normalized with respect to theamplitude of the sinusoidal term as follows; (12) )sin(/)()(2221221⎥⎦⎤⎢⎣⎡−⋅+−−⋅⋅=ψωτt t t e B A B t i s p(13) )sin(/)()sin()( 22221⎥⎦⎤⎢⎣⎡−⋅+−−⋅⋅−⋅=ψωτωψt t t e t B t i s s p ))(sin()( 2s n n t R R K ⋅−=ωψ (14) ωλλλφλφωλλφωmm m r s s t r m s mV t dt t V dtd t V V s=⎪⎭⎪⎬⎫⎪⎩⎪⎨⎧⎥⎥⎦⎤⎢⎢⎣⎡⎟⎟⎠⎞⎜⎜⎝⎛−−+−⋅=+⋅+⋅⋅==+⋅⋅=−∫(8) 1cos 1(7))sin((6))sin(10The factor )(n R K depends on transformer saturation characteristics (s λand r λ) and other parameters during saturation.Typical saturation and residual flux magnitudes for power transformers are in the range[9]; .).(35.1.).(2.1u p u p s <<λ and .).(9.0.).(7.0u p r u p <<λIt can be easily shown that with increased damping 'resistance' in the circuit, where the circuit phase angle 2ψhas lower values than the saturation angle s t ⋅ω, the exponential term is negative resulting in an inrush magnitude that is lowerthan the sinusoidal term amplitude.B. Neutral Grounding Resistor SizingBased on (10), the inrush current peak expression, it is now possible to select a neutral resistor size that can achieve a specific inrush current reduction ratio )(n R α given by:(15) )0(/)()(==n peak n peak n R I R I R α For the maximum inrush current condition (0=n R ), the total energized phase system impedance ratio X/R is high and accordingly, the damping of the exponential term in equation (10) during the first cycle can be neglected; [][](16))0(1)0()0(2212=⋅++⎥⎦⎤⎢⎣⎡⋅−+===⎟⎟⎠⎞⎜⎜⎝⎛+⋅⋅n s p c p s pR x n m n peak R x x R x x r R K V R I c s σ High n R values leading to considerable inrush current reduction will result in low X / R ratios. It is clear from (14) that X / R ratios equal to or less than 1 ensure negative DC component factor ')(n R K ' and hence the exponential term shown in (10) can be conservatively neglected. Accordingly, (10) can be re-written as follows;()[](17) )()(22122n s p c p s n p R x m n n peak R x x R x x R r V R B R I c s σ⋅++⎥⎦⎤⎢⎣⎡⋅−+=≈⎟⎟⎠⎞⎜⎜⎝⎛+⋅Using (16) and (17) to evaluate (15), the neutral resistorsize which corresponds to a specific reduction ratio can be given by;[][][](18) )0()(1)0( 12222=⋅++⋅−⋅++⋅−+⋅+=⎥⎥⎦⎤⎢⎢⎣⎡⎥⎥⎦⎤⎢⎢⎣⎡=n s p c p s p n s p c p s n p n R x x R x x r R x x R x x R r R K σσα Very high c R values leading to low transformer core loss, it can be re-written equation (18) as follows [9]; [][][][](19) 1)0(12222s p p s p n p n x x r x x R r R K +++++⋅+==α Equations (18) and (19) reveal that transformers require higher neutral resistor value to achieve the desired inrush current reduction rate. IV. A NALYSIS OF SECOND-P HASE E NERGIZING It is obvious that the analysis of the electric and magnetic circuit behavior during second phase switching will be sufficiently more complex than that for first phase switching.Transformer behaviour during second phase switching was served to vary with respect to connection and core structure type. However, a general behaviour trend exists within lowneutral resistor values where the scheme can effectively limitinrush current magnitude. For cases with delta winding or multi-limb core structure, the second phase inrush current is lower than that during first phase switching. Single phase units connected in star/star have a different performance as both first and second stage inrush currents has almost the same magnitude until a maximum reduction rate of about80% is achieved. V. NEUTRAL VOLTAGE RISEThe peak neutral voltage will reach values up to peak phasevoltage where the neutral resistor value is increased. Typicalneutral voltage peak profile against neutral resistor size is shown in Fig. 6- Fig. 8, for the 225 KVA transformer during 1st and 2nd phase switching. A del ay of 40 (ms) between each switching stage has been considered. VI. S IMULATION A 225 KVA, 2400V/600V, 50 Hz three phase transformer connected in star-star are used for the simulation study. The number of turns per phase primary (2400V) winding is 128=P N and )(01.0pu R R s P ==, )(05.0pu X X s P ==,active power losses in iron core=4.5 KW, average length and section of core limbs (L1=1.3462(m), A1=0.01155192)(2m ), average length and section of yokes (L2=0.5334(m),A2=0.01155192)(2m ), average length and section of air pathfor zero sequence flux return (L0=0.0127(m),A0=0.01155192)(2m ), three phase voltage for fluxinitialization=1 (pu) and B-H characteristic of iron core is inaccordance with Fig.3. A MATLAB program was prepared for the simulation study. Simulation results are shown in Fig.4-Fig.8.Fig. 3.B-H characteristic iron coreFig.4. Inrush current )(0Ω=n RFig.5. Inrush current )(5Ω=n RFig.6. Inrush current )(50Ω=n RFig.7. Maximum neutral voltage )(50Ω=n RFig.8. Maximum neutral voltage ).(5Ω=n RFig.9. Maximum inrush current in (pu), Maximum neutral voltage in (pu), Duration of the inrush current in (s)VII. ConclusionsIn this paper, Based on the sequential switching, presents an analytical method to select optimal neutral grounding resistor for transformer inrush current mitigation. In this method, complete transformer model, including core loss and nonlinearity core specification, has been used. It was shown that high reduction in inrush currents among the three phases can be achieved by using a neutral resistor .Other work presented in this paper also addressed the scheme's main practical limitation: the permissible rise of neutral voltage.VIII.R EFERENCES[1] Hanli Weng, Xiangning Lin "Studies on the UnusualMaloperation of Transformer Differential Protection During the Nonlinear Load Switch-In",IEEE Transaction on Power Delivery, vol. 24, no.4, october 2009.[2] Westinghouse Electric Corporation, Electric Transmissionand Distribution Reference Book, 4th ed. East Pittsburgh, PA, 1964.[3] K.P.Basu, Stella Morris"Reduction of Magnetizing inrushcurrent in traction transformer", DRPT2008 6-9 April 2008 Nanjing China.[4] J.H.Brunke, K.J.Frohlich “Elimination of TransformerInrush Currents by Controlled Switching-Part I: Theoretical Considerations” IEEE Trans. On Power Delivery, Vol.16,No.2,2001. [5] R. Apolonio,J.C.de Oliveira,H.S.Bronzeado,A.B.deVasconcellos,"Transformer Controlled Switching:a strategy proposal and laboratory validation",IEEE 2004, 11th International Conference on Harmonics and Quality of Power.[6] E. Andersen, S. Bereneryd and S. Lindahl, "SynchronousEnergizing of Shunt Reactors and Shunt Capacitors," OGRE paper 13-12, pp 1-6, September 1988.[7] Y. Cui, S. G. Abdulsalam, S. Chen, and W. Xu, “Asequential phase energizing method for transformer inrush current reduction—part I: Simulation and experimental results,” IEEE Trans. Power Del., vol. 20, no. 2, pt. 1, pp. 943–949, Apr. 2005.[8] W. Xu, S. G. Abdulsalam, Y. Cui, S. Liu, and X. Liu, “Asequential phase energizing method for transformer inrush current reduction—part II: Theoretical analysis and design guide,” IEEE Trans. Power Del., vol. 20, no. 2, pt. 1, pp. 950–957, Apr. 2005.[9] S.G. Abdulsalam and W. Xu "A Sequential PhaseEnergization Method for Transformer Inrush current Reduction-Transient Performance and Practical considerations", IEEE Transactions on Power Delivery,vol. 22, No.1, pp. 208-216,Jan. 2007.。
Quartic Gauge Boson Couplings Results at LEP
a r X i v :h e p -e x /0105063v 1 22 M a y 2001QUARTIC GAUGE BOSON COUPLINGS RESULTS AT LEPM.MUSY CERNThe study of charged and neutral boson vertices has been performed in different production channels at the LEP experiments.Decay rates and kinematic properties of these events are exploited to set constraints on the corresponding gauge couplings.1IntroductionThe study of quartic gauge boson couplings (QGCs)has become possible due to the recent theoretical developments on this topic.The presence of QGCs affects the data collected for different final states at LEP.The continous increase of the centre-of-mass energy in e +e −collisions allowed for the precise measurement of the W-pair cross section and couplings.Now,also the study of radiative W-pair events,e +e −→W +W −γ,has become possible.The Standard Model (SM)predicts the existence of quartic gauge boson couplings leading to W +W −γproduction via s -channel exchange of a γor a Z boson as shown in Fig.1a.The contribution of these two quartic Feynman diagrams with respect to the other competing diagrams,mainly initial state radiation,is negligible at the LEP centre of mass energies.Nonetheless,the process leading to the W +W −γfinal state can be sensitive to anomalous contributions to the SM quartic vertices W +W −γγand W +W −Z γ.The theoretical framework of Ref.[1]is used for the parametrisation of such anomalous couplings.The existence of Anomalous QGCs would also affect the e +e −→νe ¯νe γγprocess via the W +W −fusion Feynman diagram containing the W +W −γγvertex 2(see Figure 1b).In the SM the reaction e +e −→ν¯νγγproceeds predominantly through s -channel Z exchange and t -channel W exchange,with the two photons coming from initial state radiation,whereas the SM contribution from the W +W −fusion is again negligible at LEP.AQGCs would enhance the ν¯νγγproduction rate,especially for the hard tail of the photon energy distribution and for photons produced at large angles with respect to the beam direction.eeeeγγFigure 1:Feynman diagrams containing a four boson vertex leading to the (a)W +W −γ,(b)ν¯νγγ,and (c)Z γγfinal states.Finally,the Z γγproduction (see Fig.1c)can also be exploited to derive limits on AQGCs,as it will be discussed in the next paragraph.2QGCs Analyses at LEPTable 1shows the different data sets used for the AQGCs analyses at LEP.L3W +W −γ189-202GeV189-202GeV189GeVZ γγ130-202GeV Opal E γ>10GeV|cos θγ|<0.94cos θfγ<0.9–√s (GeV)σW W γ (p b )00.10.20.30.40.5Figure 2:Measured cross section for the process e +e −→W +W −γ.The resulting cross sections for the L3experiment are:σW W γ(188.6GeV)=0.29±0.08±0.02pb σW W γ(194.4GeV)=0.23±0.10±0.02pb σW W γ(200.2GeV)=0.39±0.12±0.02pbwhile for Opal,the measurement at 189GeV gives σW W γ=0.136±0.037±0.008pb,where the first error is statistic and the second systematic.All the obtained results are compatible with the SM expectations.Figure 2shows the L3measured cross section as a fuction of√The information from theν¯νγγtotal cross section,together with the information derived from the shape and normalisation of the photon spectra in W+W−γevents,produces the fol-lowing ADL combined limits on charged AQGCs using the data set of Table1(first two lines):−0.022GeV−2<a0/Λ2<0.021GeV−2−0.043GeV−2<a c/Λ2<0.058GeV−2−0.022GeV−2<a n/Λ2<0.020GeV−2,in good agreement with the SM expectation of zero for each coupling.The Feynman diagram of Fig.1c involves only neutral bosons,and it is not present in the SM.Besides,as it has been recently indicated3,under more general assumptions the quartic couplings in the neutral sector,still named a0/Λ2,and a c/Λ2in Ref.[1],can be regarded as independent from those in the charged sector.For this reason,on the experiimental side,the convention was used to keep apart the measurements in these channels not performing any combinations,in the wait for a unified theoretical approach.To obtain limits on AQGCs in the neutral sector,the hadronic Zγγ→qqγγevents are used. The signal consists in an enhancement in the rate of high energy photons,while the background mainly comes from doubly radiative returns to the Z.Figure3shows the Zγγcross section as predicted by the EEZGG2program a.The same program is used to model AQGCs and tofit these couplings to the observed data distributions of P Tγ1(for L3),Eγand max|cosθγi|(for Opal). The following LEP combined bounds are derived4:−0.0048GeV−2<a0/Λ2<0.0056GeV−2−0.0052GeV−2<a c/Λ2<0.0099GeV−2All experimental observations are compatible with the SM predictions.3ConclusionsThe measurements of rare processes as Zγγ,W+W−γandν¯νγγconstitute an important test of the SM.Preliminary results on AQGCs were presented here,including new results in the W+W−γchannel up to the centre-of-mass energy of202GeV with a significant increase in the final precision.References1.J.W.Stirling and A.Werthenbach,Phys.Lett.B446,369.2.J.W.Stirling and A.Werthenbach,Eur.Phys.J.C14(2000)103.3.G.Belanger and F.Boudjema,Nucl.Phys.B288(1992)201.4.The Opal Collaboration,ICHEP abs572(2000),Opal PN452;The L3Collaboration,ICHEP abs.505(2000),CERN-EP/2000-006.Recoil Mass (GeV)E v e n t s /5 G e V246810121400.511.5√s/GeVOPAL Preliminaryσ(e +e -→q q γγ) /p bFigure 3:Cross section for the process e +e −→Z γγas a function of√。
应用地球化学元素丰度数据手册-原版

应用地球化学元素丰度数据手册迟清华鄢明才编著地质出版社·北京·1内容提要本书汇编了国内外不同研究者提出的火成岩、沉积岩、变质岩、土壤、水系沉积物、泛滥平原沉积物、浅海沉积物和大陆地壳的化学组成与元素丰度,同时列出了勘查地球化学和环境地球化学研究中常用的中国主要地球化学标准物质的标准值,所提供内容均为地球化学工作者所必须了解的各种重要地质介质的地球化学基础数据。
本书供从事地球化学、岩石学、勘查地球化学、生态环境与农业地球化学、地质样品分析测试、矿产勘查、基础地质等领域的研究者阅读,也可供地球科学其它领域的研究者使用。
图书在版编目(CIP)数据应用地球化学元素丰度数据手册/迟清华,鄢明才编著. -北京:地质出版社,2007.12ISBN 978-7-116-05536-0Ⅰ. 应… Ⅱ. ①迟…②鄢…Ⅲ. 地球化学丰度-化学元素-数据-手册Ⅳ. P595-62中国版本图书馆CIP数据核字(2007)第185917号责任编辑:王永奉陈军中责任校对:李玫出版发行:地质出版社社址邮编:北京市海淀区学院路31号,100083电话:(010)82324508(邮购部)网址:电子邮箱:zbs@传真:(010)82310759印刷:北京地大彩印厂开本:889mm×1194mm 1/16印张:10.25字数:260千字印数:1-3000册版次:2007年12月北京第1版•第1次印刷定价:28.00元书号:ISBN 978-7-116-05536-0(如对本书有建议或意见,敬请致电本社;如本社有印装问题,本社负责调换)2关于应用地球化学元素丰度数据手册(代序)地球化学元素丰度数据,即地壳五个圈内多种元素在各种介质、各种尺度内含量的统计数据。
它是应用地球化学研究解决资源与环境问题上重要的资料。
将这些数据资料汇编在一起将使研究人员节省不少查找文献的劳动与时间。
这本小册子就是按照这样的想法编汇的。
核磁共振波普仪器专业词汇英汉翻译

APT Attached Proton Test 质子连接实验ASIS Aromatic Solvent Induced Shift 芳香溶剂诱导位移BBDR Broad Band Double Resonance 宽带双共振BIRD Bilinear Rotation Decoupling 双线性旋转去偶(脉冲)COLOC Correlated Spectroscopy for Long Range Coupling 远程偶合相关谱COSY ( Homonuclear chemical shift ) COrrelation SpectroscopY (同核化学位移)相关谱CP Cross Polarization 交叉极化CP/MAS Cross Polarization / Magic Angle Spinning 交叉极化魔角自旋CSA Chemical Shift Anisotropy 化学位移各向异性CSCM Chemical Shift Correlation Map 化学位移相关图CW continuous wave 连续波DD Dipole-Dipole 偶极-偶极DECSY Double-quantum Echo Correlated Spectroscopy 双量子回波相关谱DEPT Distortionless Enhancement by Polarization Transfer 无畸变极化转移增强2DFTS two Dimensional FT Spectroscopy 二维傅立叶变换谱DNMR Dynamic NMR 动态NMRDNP Dynamic Nuclear Polarization 动态核极化DQ(C) Double Quantum (Coherence) 双量子(相干)DQD Digital Quadrature Detection 数字正交检测DQF Double Quantum Filter 双量子滤波DQF-COSY Double Quantum Filtered COSY 双量子滤波COSY DRDS Double Resonance Difference Spectroscopy 双共振差谱EXSY Exchange Spectroscopy 交换谱FFT Fast Fourier Transformation 快速傅立叶变换FID Free Induction Decay 自由诱导衰减H,C-COSY 1H,13C chemical-shift COrrelation SpectroscopY 1H,13C 化学位移相关谱H,X-COSY 1H,X-nucleus chemical-shift COrrelation SpectroscopY1H,X-核化学位移相关谱HETCOR Heteronuclear Correlation Spectroscopy 异核相关谱HMBC Heteronuclear Multiple-Bond Correlation 异核多键相关HMQC Heteronuclear Multiple Quantum Coherence异核多量子相干HOESY Heteronuclear Overhauser Effect Spectroscopy 异核Overhause效应谱HOHAHA Homonuclear Hartmann-Hahn spectroscopy 同核Hartmann-Hahn谱HR High Resolution 高分辨HSQCHeteronuclear Single Quantum Coherence 异核单量子相干INADEQUATE Incredible Natural Abundance Double Quantum Transfer Experiment 稀核双量子转移实验(简称双量子实验,或双量子谱)INDOR Internuclear Double Resonance 核间双共振INEPT Insensitive Nuclei Enhanced by Polarization 非灵敏核极化转移增强INVERSE H,X correlation via 1H detection 检测1H的H,X核相关IR Inversion-Recovery 反(翻)转回复JRES J-resolved spectroscopy J-分解谱LIS Lanthanide (chemical shift reagent ) Induced Shift 镧系(化学位移试剂)诱导位移LSR Lanthanide Shift Reagent 镧系位移试剂MAS Magic-Angle Spinning 魔角自旋MQ(C) Multiple-Quantum ( Coherence ) 多量子(相干)MQF Multiple-Quantum Filter 多量子滤波MQMAS Multiple-Quantum Magic-Angle Spinning 多量子魔角自旋MQS Multi Quantum Spectroscopy 多量子谱NMR Nuclear Magnetic Resonance 核磁共振NOE Nuclear Overhauser Effect 核Overhauser效应(NOE)NOESY Nuclear Overhauser Effect Spectroscopy 二维NOE谱NQR Nuclear Quadrupole Resonance 核四极共振PFG Pulsed Gradient Field 脉冲梯度场PGSE Pulsed Gradient Spin Echo 脉冲梯度自旋回波PRFT Partially Relaxed Fourier Transform 部分弛豫傅立叶变换PSD Phase-sensitive Detection 相敏检测PW Pulse Width 脉宽RCT Relayed Coherence Transfer 接力相干转移RECSY Multistep Relayed Coherence Spectroscopy 多步接力相干谱REDOR Rotational Echo Double Resonance 旋转回波双共振RELAY Relayed Correlation Spectroscopy 接力相关谱RF Radio Frequency 射频ROESY Rotating Frame Overhauser Effect Spectroscopy 旋转坐标系NOE谱ROTO ROESY-TOCSY Relay ROESY-TOCSY 接力谱SC Scalar Coupling 标量偶合SDDS Spin Decoupling Difference Spectroscopy 自旋去偶差谱SE Spin Echo 自旋回波SECSY Spin-Echo Correlated Spectroscopy自旋回波相关谱SEDOR Spin Echo Double Resonance 自旋回波双共振SEFT Spin-Echo Fourier Transform Spectroscopy (with J modulation)(J-调制)自旋回波傅立叶变换谱SELINCOR Selective Inverse Correlation 选择性反相关SELINQUATE Selective INADEQUATE 选择性双量子(实验)SFORD Single Frequency Off-Resonance Decoupling 单频偏共振去偶SNR or S/N Signal-to-noise Ratio 信 / 燥比SQF Single-Quantum Filter 单量子滤波SR Saturation-Recovery 饱和恢复TCF Time Correlation Function 时间相关涵数TOCSY Total Correlation Spectroscopy 全(总)相关谱TORO TOCSY-ROESY Relay TOCSY-ROESY接力TQF Triple-Quantum Filter 三量子滤波WALTZ-16 A broadband decoupling sequence 宽带去偶序列WATERGATE Water suppression pulse sequence 水峰压制脉冲序列WEFT Water Eliminated Fourier Transform 水峰消除傅立叶变换ZQ(C) Zero-Quantum (Coherence) 零量子相干ZQF Zero-Quantum Filter 零量子滤波T1 Longitudinal (spin-lattice) relaxation time for MZ 纵向(自旋-晶格)弛豫时间T2 Transverse (spin-spin) relaxation time for Mxy 横向(自旋-自旋)弛豫时间tm mixing time 混合时间τc rotational correlation time 旋转相关时间。
磁共振成像技术中英文名词对照
Contrast enhanced magnetic resonance angiography,CE-MRA
对于比巩固磁共振血管成像
Chemical shift selective saturation,CHESS
化教位移采用鼓战
Contrast to noise ratio,CNR
霍我效力
Diameter of spherical volume ,DSV
球形空间曲径
Build-in body coil
内置体线圈
Gradient system ,orgradients
梯度系统
Gradient magnetic field
梯度磁场
Field of view , FOV
视线范畴
Slew rate
沉复时间
True Fast Imaging with Steady-state Precession,True FISP
实稳态进动赶快支集
Turbo spin echo,TSE
赶快自旋回波
Volume interpolated body examination, VIBE
容积内查体部查看
Static magnetic field
静磁场
Signal noise ratio,SNR
疑噪比
Homogeneity
磁场匀称性
Permanent magnet
永磁型磁体
Conventional magnet
常导型磁体
Resistive magnet
阻抗型磁体
Super conducting magnet
超导磁体
Low temperature superconducting material
Development and Validation of a Liquid Chromatogra

J. Chem. Chem. Eng. 5 (2011) 1-6.Development and Validation of a LiquidChromatography–Tandem Mass Spectrometry Method for Determination of Artemisinin in Rat PlasmaElhassan Gamal1,2, Yuen Kah1, Wong Jiawoei1, Chitneni Mallikarjun1,3, Al-Dahli Samer1, Khan Jiyauddin1 and Javed Qureshi31. School of Pharmaceutical Sciences, Universiti Sains Malaysia, Minden 11800, Penang, Malaysia2. Local Pharmaceutical Manufacturing Department, General Pharmacy Directorate, MOH, 11111, Khartoum-Sudan3. School of Pharmacy and Health Sciences, International Medical University, 5700, Kula Lumpur, MalaysiaReceived: September 03, 2010 / Accepted: October 11, 2010 / Published: January 10, 2011.Abstract: Artemisinin is a potent anti-malarial drug isolated from traditional Chinese medicinal herb, Artemisia annua. The objective of this study was to develop and validate a sensitive and specific LC-MS/MS method for the determination of artemisinin in rat plasma using amlodipine as Internal Standard. The method consist of a simple liquid-liquid extraction with methyl tertiary butyl ether (MTBE) with subsequent evaporation of the supernatant to dryness followed by the analysis of the reconstituted sample by LC-MS/MS with a Z-spray atmospheric pressure ionization (API) interface in the positive ion-multiple reaction monitoring mode to monitor precursor→product ions of m/z 282.70→m/z 209.0 for artemisinin and m/z 408.9→m/z 237.0 for amlodipine respectively. The method was linear (0.999) over the concentration range of 7.8–2000 ng/mL in rat plasma. The intra and inter-day accuracy were measured to be within 94-104.2% and precision (CV) were all less than 5%. The extraction recovery means for internal standard and all the artemisinin concentrations used were between 82-85%.Key words: Artemisinin, LC-MS/MS, amlodipine, plasma, accuracy and precision.1. IntroductionArtemsinin is the name given to the active principle of qinghaosu, an extract of the Chinese medicinal plant qinghaosu or green Artemisia (Artemisinin annua L.) which has been used for many years centuries in Chinese traditional medicine for treatment of fever and malaria [1]. In 1972, Chinese researchers isolated artemisinin from Artemisia annua L. sweet wormwood) and its structure was elucidate in 1979 as show in Fig. 1.The determination of artemisinin and its derivatives in biological matrices have previously been characterized using several analytical techniques suchCorresponding author: Gamal Osman Elhassan Ph.D., research field: pharmaceutical technology. E-mail: ******************.as LC, HPLC, GC-MS etc [3-8]. However, some of these methods suffer from few drawbacks. In particulars, interference with endogenous constituents in the plasma at the absorption wave length of the derivatized compounds may render these techniques unsatisfactory and few of them lacked the required sensitivity to be used for measurement of drugFig. 1 The chemical structure of artemisinin [2].ll Rights Reserved.Development and Validation of a Liquid Chromatography–Tandem Mass Spectrometry Method forDetermination of Artemisinin in Rat Plasma2concentration in blood sample obtained from clinical investigation [9].To increase the specificity and sensitivity of HPLC-UV method, some workers combined it with a mass spectrometry (MS) and the total system is described as LC-MS technique [10, 11]. The development of LC-tandem mass spectrometry (LC-MS/MS) has made a more specific and sensitive analysis of artemisinin and its derivatives possible [12, 13]. The objective of this study was to develop a sensitive and specific LC-MS/MS method for the determination of artemisinin in rat plasma by simple liquid-liquid extraction procedure.2. Materials and Methods2.1 MaterialsArtemisinin was purchased from Kunming Pharmaceutical Corporation (Kunming, China). Amlodipine was obtained from Sigma Chemical (Louis, USA). Acetonitrile (ACN), formic acid and methyl tertiary butyl ether (MTBE) were purchased from J.T Baker (USA).3. Methods3.1 Instrumentation and ConditionsThe instrumentation comprised of Quattro-micro tandem mass spectrometer with Z-spray atomospheric pressure ionization (API) source (Micromass, Manchester, UK) using electrospray ionization (ESI) operated at positive mode. Chromatography was performed on an Alliance 2,695 separation module (Waters, M.A, USA). The delivery system consisted of an autosampler and a column heater. The chromatographic separation was obtained using an X Terra MS C8 encapped (5 μm) (150 × 2.1 mm) analytical column (Water, USA).3.2 Sample PreparationA 250 μL aliquot of plasma was pipetted into a screw-capped culture tube, followed by 100 μL of internal standard solution (50 ng/mL). To each tube, 5 mL (MTBE) extraction solvent was then added and the mixture was vortexed for 2.5 minutes followed by centrifuging for 15 minutes at 3,500 rpm. The upper layer was transferred to a reactive vial and dried under nitrogen flow at 40 °C. The residue was then reconstituted with 250 μL of mobile phase and 20 μL was injected into the LC-MS/MS system.3.3 Assay ValidationCalibration curve at a concentration range of 7.8–2,000 ng/mL were constructed by spiking blank human plasma with a known amount of artemisinin. Plasma sample spiked with artemisinin at these concentrations 7.8, 62.5, 250, 2,000 ng/mL were used to determine the within and between-day accuracy and precision. For within-day accuracy and precision, replicates analysis (n = 6) for each concentration were performed in a single day. For between-day evaluation, analysis was carried out with a single sample of each concentration daily over 6 days, with calibration curve constructed on each day of analysis. The extraction recovery of artemisinin was estimated by comparing the peak height obtained after extraction of the samples from plasma with that of aqueous artemisinin solution of the corresponding concentration.4. Results and DiscussionBoth electrospray (TIS) and atmospheric pressure chemical ionisation (APCI) methods have been reported previously for the quantification of artemisinin derivatives in biological fluids [11, 12, 14-16]. According to the previously reported methods TIS was found to be superior to APCI for the quantification of artesunate and dihydroartemisinin (DHA) mainly because of improved linearity [16]. Therefore in this method electrospray ionization was used. When artemisinin and amlodipine were injected directly into the mass spectrometer along with mobile phase in the positive mode, the protonated molecules of artemisinin and amlodipine were set as precursorll Rights Reserved.Development and Validation of a Liquid Chromatography–Tandem Mass Spectrometry Method forDetermination of Artemisinin in Rat Plasma3(a)(b)Fig. 2 (a) Positive-ionization electrospray mass spectra of precursor ion for artemisinin; (b) Positive-ionization electrospray mass spectra of product ion for artemisinin.ions with m/z of 282.7 and 408.7, respectively. The product ion that gave the highest intensity was m/z of 209.0 for artemisinin and 237.7 for amlodipine. Fig 2(a) shows the spectra precursor ion, 2(b) production for artemisinin.Artemisinin and amlodipine have retention time of approximately 6.9 and 1.65 minutes, respectively (Fig.3). The peak was well resolved and free from interference from endogenous compounds in rat plasma (Fig. 4).ll Rights Reserved.Development and Validation of a Liquid Chromatography–Tandem Mass Spectrometry Method forDetermination of Artemisinin in Rat Plasma4Fig. 3 Plasma spiked with 500 ng/ml artemisinin and amlodipine 50 ng/mL.Fig. 4 Chromatograms for analysis of artemisinin in plasma (Rat blank plasma).Calibration curve was linear over the entire range of calibration curves with a mean correlation coefficient greater than 0.9995 (Fig. 5).The limit of quantification (LOQ) of the assay method was 7.8 ng/mL being the lowest concentration used to construct the calibration curve whereas the limit of detection (LOD) was 3.9 ng/mL at a signal to noise ratio of 3. The validation data demonstrated a good precision, accuracy and recovery. The extraction recovery means for internal standard and all artemisinin concentrations used were 75-85% (Table 1). The within-day and between-day accuracy and precision values are given in Table 2.Neither artemisinin nor the internal standard producedll Rights Reserved.Development and Validation of a Liquid Chromatography–Tandem Mass Spectrometry Method forDetermination of Artemisinin in Rat Plasma5Fig. 5 Mean calibration curve of artemisinin (ng/mL).Table 1 Extraction recovery.Concentration (ng/mL) Mean recovery (%) CV (%)7.81 75.081.5062.50 82.161.94250.00 82.03 2.072000.00 85.23 1.48Table 2 Within-day and between-day precision andaccuracy.Added (ng/mL)Within-day Between-day Accuracy (%) C.V (%) Accuracy (%) C.V (%)7.81 96.00 4.60 104.11 2.30 62.50 98.10 1.60 94.10 2.20 250.00 98.10 1.50 98.10 1.60 2000.00 96.10 2.50 97.10 1.80any detectable carry-over after three injections of upper limit of quantification. Blank rat plasma showed no interference with artemisinin. Interfering signals from blank plasma contributed less than 20% of the artemisinin signal at LOQ. There was no interference of artemisinin on the internal standard or vice versa. A small enhancement for artemisinin and the internal standard could be detected when references in neat injection solvent were compared with references in extracted blank biological matrix. The normalized matrix effects (artemisinin/internal standard) were close to 1 with a low variation in accordance with international guidelines. Post-column infusion experiments confirmed the absence of regions with severe matrix effects (i.e., no sharp drops or increases in the response) for blank human plasma extracted with the developed method.Xing et al. used artmether as an internal standard for the analysis of artemisinin [17]while for the analysis of artemisinin derivatives; artemisinin was used as internal standard [14]. In the present study amlodipine was found to be suitable because it could be separated chromatographically, ionized and fragmented under the conditions that optimized the intensity of artemisinin peak (Fig. 3).The analysis of artemisinin and its derivatives with mass spectrometry are most often performed with a different mode of ionization. Xing et al. used ESI inletin the positive ion-multiple reaction monitoring mode which relatively producing a higher sensitivity than in the SIM mode. Therefore, the mass spectrometry was operated at positive ion-MRM mode.4. ConclusionThe LC-MS/MS method described in this work is suitable for the determination of artemisinin in plasma. The assay procedure is simple with a relatively shortll Rights Reserved.Development and Validation of a Liquid Chromatography–Tandem Mass Spectrometry Method forDetermination of Artemisinin in Rat Plasma6retention time allowing sufficient sample to beprocessed to be applied to pharmacokinetic and bioavailability studies of artemisinin. The accuracy and precision of the assay method, as well as the recovery of extraction procedure were found to be satisfactory.References[1] D.L. Klayman, Qinghasou (Artemisinin): An antimalaria drug from China, Science 228 (1985) 1049-1055.[2] X.D. Luo, C.C. Shen, The chemistry, pharmacology andclinical applications of Qinghaosu (artemisinin) and it’sderivatives, Med. Res. Rev. 7 (1987) 29-52.[3] K.T. Batty, M. Ashton, K.F. Llett, G . Edwards, T.M. Davis,Selective high-performance liquid chromatography ofartesunate and α-and β-dihydroartemisinin in patients withfalciparum malaria, J. Chromatog. B 677 (2-3) (1996)345-350.[4] J. Karbwang, K. Na-Bangchang, P. Molunto, V . Banmairuroi, Determination of artemisinin and its majormetabolite, dihydroartemisinin, in plasma usinghigh-performance liquid chromatography withelectrochemical detector, J. Chromatog. B 7 (1-2) (1997)259-265.[5] K.L. Chan, K.H. Yuen, H. Takayanki, S. Jinandasa, K.K. Peh, Polymorphism of artemisinin from Artemisia annua,Phytochemistry 46 (7) (1997) 1209-1214.[6] G .Q. Li, T.O. Peggins, L.L. Fleckenstein, K. Masonic,M.H. Heiffles, T.G . Brewer, The pharmacokinetics andbiovailability of dihydroartemisinin, arteether, artemether,artesunic acid and artelinic acid in rats, J. Pharm.Pharmacol 5 (1998) 173-182.[7] B.A. Avery, K.K. Venkatesh, M.A. Avery, Rapid determination of artemisinin and related analogues usinghigh-perfomance liquid chromatography and anevaporative light scattering detector, J. Chromat. B 730 (1)(1999) 71-80.[8] S.S. Mohamed, S.A. Khalid, S.A. Ward, T.S.M. Wan,H.P.O. Tang, M. Zheng, R.K. Haynes, G . Edwards,Simultaneous determination of artemether and its majormetabolite dihydroartemisinin in plasma by gaschromatography-mass spectrometry-selected ionmonitoring, J. Chromat. B 731(1999) 251-260.[9] K.T. Batty, M. Ashton, K.F. Llett, G . Edward, T.M. Davis,The pharmacokinetics of artemisinin (ART) and artesunate (ARTS) in healthy volunteers, Am J. Trop Med. Hyg. 58(2) (1998) 125-126.[10] C. Souppart, N. Gouducheau, N. Sandenan, F. Richard,Development and validation of a high-performance liquid chromatography-mass spectrometry assay for the determination of artemisinin and its metabolite dihydraartemisinin in human plasma, J. Chromat. B 774(2002) 195-203.[11] H. Naik, D.J. Murry, L.E. Kirsch, L. Fleckenstein,Development and validation of high-performance liquid chromatography-mass spectroscopy assay for determination of artesunate and dihydrroartemisinin in human plasma, J. Chromat. B 816 (1-2) (2005) 233-242. [12] J. Xing, H. Yan, S. Zhang, G . Ren, Y . Gao, A high-performance liquid chromatography/tandem mass spectrometry method for the determination of artemisinin in rat plasma, Rapid Commun in Mass Spectro. 20 (9) (2006) 1463-1468. [13] J. Xing, H.X. Yan, R.L. Wang, L.F. Zhang, S.Q. Zhang,Liquid chromatography-tandem mass spectrometry assay for the quantitation of β-dihydroartemisinin in rat plasma, J. Chromat. B 852 (1-2) (2007) 202-207. [14] M. Rajanikanth, K.P. Madhusudanan, R.C. Gupta, An HPLC-MS method for simultaneous estimation of alpha, beta-arteether and its metabolite dihydroartemisinin, in rat plasma for application to pharmacokinetic study, J Biomed. Chromat. 17 (7) (2003) 440-446. [15] Y . Gu, Q. Li, M.V . Elendez, P. Weina, Comparison of HPLC with electrochemical detection and LC–MS/for the separation and validation of artesunate and dihydroartemisinin in animal and human plasma, J. Chromatogr B 867 (2008) 213-218. [16] W. Hanpithakpong, B. Kamanikom, A.M. Dondorp, P.Singhasivanon, N.J. White, N.P. Day, N. Lindegardh, A liquid chromatographic-tandem mass spectrometric method for determination of artesunate and its metabolite dihydroartemisinin in human plasma, J. Chromatogr. B 876 (2008) 61-68. [17] Y . Xing, H. Yan, S. Zhang, G . Ren, Y . Gao, A high-performance liquid chromatography/tandem mass spectrometry method for the determination of artemisinin rat plasma, Rapid Communication in Mass Spectrometry 20 (9) (2006) 1463-1468.ll Rights Reserved.。
Evolution of the Fine Structure Constant Driven by Dark Matter and the Cosmological Constan

Physics Department, McGill University, 3600 University St, Montreal,Quebec H3A 2T8, Canada
D´ epartement de Physique, Universit´ e du Qu´ ebec ` a Montr´ eal C.P. 8888, Succ. Centre-Ville, Montr´ eal, Qu´ ebec, Canada, H3C 3P8
1
Introduction
Speculations that fundamental constants may vary in time and/or space go back to the original idea of Dirac [1]. Despite the reputable origin, this idea has not received much attention during the last fifty years for the two following reasons. First, there exist various sensitive experimental checks that coupling constants do not change (See, e.g. [2]). Second, for a long time there has not been any credible theoretical framework which would predict such changes. Our theoretical mindset, however, has changed since the advent of the string theory. One of the most interesting low-energy features of string theory is the possible presence of a massless scalar particle, the dilaton, whose vacuum expectation value defines the size of the effective gauge coupling constants. A change in the dilaton v.e.v. induces a change in the fine structure constant as well as the other gauge and Yukawa couplings. The stabilization of the dilaton v.e.v., which usually renders the dilaton massive, represents one of the fundamental challenges to be addressed before string theory can aspire to describe the observable world. Besides the dilaton, string theory often predicts the presence of other massless or nearly massless moduli fields, whose existence may influence particle physics and cosmology and may also change the effective values of the coupling constants as well. Independent of the framework of string theory, Bekenstein [3] formulated a dynamical model of “changing α”. The model consists of a massless scalar field which has a linear −1 φFµν F µν , where M∗ is an associated coupling to the F 2 term of the U (1) gauge field, M∗ mass scale and thought to be of order the Planck scale. A change in the background value of φ, can be interpreted as a change of the effective coupling constant. Bekenstein noticed that F 2 has a non-vanishing matrix element over protons and neutrons, of order (10−3 − 10−2 )mN . This matrix element acts as a source in the φ equation of motion and naturally leads to the cosmological evolution of the φ field driven by the baryon energy density. Thus, the change in φ translates into a change in α on a characteristic time scale comparable to the lifetime of the Universe or larger. However, the presence of a massless scalar field φ in the theory leads to the existence of an additional attractive force which does not respect Einstein’s weak universality principle. The extremely accurate checks of the latter [4] lead to a firm lower limit on M∗ , M∗ /MPl > 103 that confines possible changes of α to the range ∆α < 10−10 − 10−9 for 0 < z < 5 [3, 5]. This range is five orders of magnitude tighter than the change ∆α/α ≃ 10−5 indicated in the observations of quasar absorption spectra at z = 0.5 − 3.5 and recently reported by Webb et al. [6]. Given the potential fundamental importance of such a result, one should remain cautious until this result is independently verified. Nevertheless, leaving aside the issue regarding the reliability of the conclusions reached by Webb et al. [6], it is interesting to explore the possibility of constructing a dynamical model, including 1
中英--西医神经科术语英文翻译

西医神经科术语英文翻译以下是常见的西医神经科术语英文翻译:1. 神经学:Neurology2. 神经系统:Nervous System3. 大脑:Brain4. 脊髓:Spinal Cord5. 神经元:Neuron6. 神经胶质细胞:Glial Cells7. 突触:Synapse8. 轴突:Axon9. 树突:Dendrites10. 髓鞘:Myelin Sheath11. 神经递质:Neurotransmitters12. 神经传导通路:Nerve Conduction Pathways13. 反射:Reflex14. 痛觉:Pain Sensation15. 感觉运动传导通路:Sensorimotor Pathways16. 自主神经系统:Autonomic Nervous System17. 中枢神经系统:Central Nervous System (CNS)18. 外周神经系统:Peripheral Nervous System (PNS)19. 神经肌肉接头:Neuromuscular Junction20. 癫痫:Epilepsy21. 帕金森病:Parkinson's Disease22. 多发性硬化症:Multiple Sclerosis (MS)23. 脑卒中:Stroke24. 脑外伤:Traumatic Brain Injury (TBI)25. 脑瘤:Brain Tumors26. 脑炎:Brain Infections / Encephalitis27. 神经痛:Neuralgia28. 头痛:Headache29. 失眠:Insomnia30. 肌肉萎缩:Muscle Atrophy31. 肌无力:Muscle Weakness32. 神经根病:Radiculopathy33. 神经丛病变:Plexopathy34. 脊髓病变:Myelopathy35. 脑积水:Hydrocephalus36. 脊髓空洞症:Syringomyelia37. 脑电图(EEG):Electroencephalogram (EEG)38. 肌电图(EMG):Electromyogram (EMG)39. 经颅磁刺激(TMS):Transcranial Magnetic Stimulation (TMS)40. 正电子发射断层扫描(PET):Positron Emission Tomography (PET)41. 功能磁共振成像(fMRI):Functional Magnetic Resonance Imaging (fMRI)42. 单光子发射计算机断层扫描(SPECT):Single Photon Emission Computed Tomography (SPECT)43. 经颅多普勒超声(TCD):Transcranial Doppler Ultrasound (TCD)44. 认知障碍:Cognitive Dysfunction45. 情绪障碍:Mood Disorders46. 神经退行性疾病:Neurodegenerative Diseases47. 中毒性脑病:Toxic Encephalopathy48. 脑死亡:Brain Death49. 昏迷:Coma50. 意识障碍:Disorders of Consciousness。
Peters (2010) Episodic Future Thinking Reduces Reward Delay Discounting
NeuronArticleEpisodic Future Thinking ReducesReward Delay Discounting through an Enhancement of Prefrontal-Mediotemporal InteractionsJan Peters1,*and Christian Bu¨chel11NeuroimageNord,Department of Systems Neuroscience,University Medical Center Hamburg-Eppendorf,Hamburg20246,Germany*Correspondence:j.peters@uke.uni-hamburg.deDOI10.1016/j.neuron.2010.03.026SUMMARYHumans discount the value of future rewards over time.Here we show using functional magnetic reso-nance imaging(fMRI)and neural coupling analyses that episodic future thinking reduces the rate of delay discounting through a modulation of neural decision-making and episodic future thinking networks.In addition to a standard control condition,real subject-specific episodic event cues were presented during a delay discounting task.Spontaneous episodic imagery during cue processing predicted how much subjects changed their preferences toward more future-minded choice behavior.Neural valuation signals in the anterior cingulate cortex and functional coupling of this region with hippo-campus and amygdala predicted the degree to which future thinking modulated individual preference functions.A second experiment replicated the behavioral effects and ruled out alternative explana-tions such as date-based processing and temporal focus.The present data reveal a mechanism through which neural decision-making and prospection networks can interact to generate future-minded choice behavior.INTRODUCTIONThe consequences of choices are often delayed in time,and in many cases it pays off to wait.While agents normally prefer larger over smaller rewards,this situation changes when rewards are associated with costs,such as delays,uncertainties,or effort requirements.Agents integrate such costs into a value function in an individual manner.In the hyperbolic model of delay dis-counting(also referred to as intertemporal choice),for example, a subject-specific discount parameter accurately describes how individuals discount delayed rewards in value(Green and Myer-son,2004;Mazur,1987).Although the degree of delay discount-ing varies considerably between individuals,humans in general have a particularly pronounced ability to delay gratification, and many of our choices only pay off after months or even years. It has been speculated that the capacity for episodic future thought(also referred to as mental time travel or prospective thinking)(Bar,2009;Schacter et al.,2007;Szpunar et al.,2007) may underlie the human ability to make choices with high long-term benefits(Boyer,2008),yielding higher evolutionaryfitness of our species.At the neural level,a number of models have been proposed for intertemporal decision-making in humans.In the so-called b-d model(McClure et al.,2004,2007),a limbic system(b)is thought to place special weight on immediate rewards,whereas a more cognitive,prefrontal-cortex-based system(d)is more involved in patient choices.In an alternative model,the values of both immediate and delayed rewards are thought to be repre-sented in a unitary system encompassing medial prefrontal cortex(mPFC),posterior cingulate cortex(PCC),and ventral striatum(VS)(Kable and Glimcher,2007;Kable and Glimcher, 2010;Peters and Bu¨chel,2009).Finally,in the self-control model, values are assumed to be represented in structures such as the ventromedial prefrontal cortex(vmPFC)but are subject to top-down modulation by prefrontal control regions such as the lateral PFC(Figner et al.,2010;Hare et al.,2009).Both the b-d model and the self-control model predict that reduced impulsivity in in-tertemporal choice,induced for example by episodic future thought,would involve prefrontal cortex regions implicated in cognitive control,such as the lateral PFC or the anterior cingulate cortex(ACC).Lesion studies,on the other hand,also implicated medial temporal lobe regions in decision-making and delay discounting. In rodents,damage to the basolateral amygdala(BLA)increases delay discounting(Winstanley et al.,2004),effort discounting (Floresco and Ghods-Sharifi,2007;Ghods-Sharifiet al.,2009), and probability discounting(Ghods-Sharifiet al.,2009).Interac-tions between the ACC and the BLA in particular have been proposed to regulate behavior in order to allow organisms to overcome a variety of different decision costs,including delays (Floresco and Ghods-Sharifi,2007).In line with thesefindings, impairments in decision-making are also observed in humans with damage to the ACC or amygdala(Bechara et al.,1994, 1999;Manes et al.,2002;Naccache et al.,2005).Along similar lines,hippocampal damage affects decision-making.Disadvantageous choice behavior has recently been documented in patients suffering from amnesia due to hippo-campal lesions(Gupta et al.,2009),and rats with hippocampal damage show increased delay discounting(Cheung and Cardinal,2005;Mariano et al.,2009;Rawlins et al.,1985).These observations are of particular interest given that hippocampal138Neuron66,138–148,April15,2010ª2010Elsevier Inc.damage impairs the ability to imagine novel experiences (Hassa-bis et al.,2007).Based on this and a range of other studies,it has recently been proposed that hippocampus and parahippocam-pal cortex play a crucial role in the formation of vivid event repre-sentations,regardless of whether they lie in the past,present,or future (Schacter and Addis,2009).The hippocampus may thus contribute to decision-making through its role in self-projection into the future (Bar,2009;Schacter et al.,2007),allowing an organism to evaluate future payoffs through mental simulation (Johnson and Redish,2007;Johnson et al.,2007).Future thinking may thus affect intertemporal choice through hippo-campal involvement.Here we used model-based fMRI,analyses of functional coupling,and extensive behavioral procedures to investigate how episodic future thinking affects delay discounting.In Exper-iment 1,subjects performed a classical delay discounting task(Kable and Glimcher,2007;Peters and Bu¨chel,2009)that involved a series of choices between smaller immediate and larger delayed rewards,while brain activity was measured using fMRI.Critically,we introduced a novel episodic condition that involved the presentation of episodic cue words (tags )obtained during an extensive prescan interview,referring to real,subject-specific future events planned for the respective day of reward delivery.This design allowed us to assess individual discount rates separately for the two experimental conditions,allowing us to investigate neural mechanisms mediating changes in delay discounting associated with episodic thinking.In a second behavioral study,we replicated the behavioral effects of Exper-iment 1and addressed a number of alternative explanations for the observed effects of episodic tags on discount rates.RESULTSExperiment 1:Prescan InterviewOn day 1,healthy young volunteers (n =30,mean age =25,15male)completed a computer-based delay discounting proce-dure to estimate their individual discount rate (Peters and Bu ¨-chel,2009).This discount rate was used solely for the purpose of constructing subject-specific trials for the fMRI session (see Experimental Procedures ).Furthermore,participants compiled a list of events that they had planned in the next 7months (e.g.,vacations,weddings,parties,courses,and so forth)andrated them on scales from 1to 6with respect to personal rele-vance,arousal,and valence.For each participant,seven subject-specific events were selected such that the spacing between events increased with increasing delay to the episode,and that events were roughly matched based on personal rele-vance,arousal,and valence.Multiple regression analysis of these ratings across the different delays showed no linear effects (relevance:p =0.867,arousal:p =0.120,valence:p =0.977,see Figure S1available online).For each subject,a separate set of seven delays was computed that was later used as delays in the control condition.Median and range for the delays used in each condition are listed in Table S1(available online).For each event,a label was selected that would serve as a verbal tag for the fMRI session.Experiment 1:fMRI Behavioral ResultsOn day 2,volunteers performed two sessions of a delay dis-counting procedure while fMRI was measured using a 3T Siemens Scanner with a 32-channel head-coil.In each session,subjects made a total of 118choices between 20V available immediately and larger but delayed amounts.Subjects were told that one of their choices would be randomly selected and paid out following scanning,with the respective delay.Critically,in half the trials,an additional subject-specific episodic tag (see above,e.g.,‘‘vacation paris’’or ‘‘birthday john’’)was displayed based on the prescan interview (see Figure 1)indicating which event they had planned on the particular day (episodic condi-tion),whereas in the remaining trials,no episodic tag was pre-sented (control condition).Amount and waiting time were thus displayed in both conditions,but only the episodic condition involved the presentation of an additional subject-specific event tag.Importantly,nonoverlapping sets of delays were used in the two conditions.Following scanning,subjects rated for each episodic tag how often it evoked episodic associations during scanning (frequency of associations:1,never;to 6,always)and how vivid these associations were (vividness of associa-tions:1,not vivid at all;to 6,highly vivid;see Figure S1).Addition-ally,written reports were obtained (see Supplemental Informa-tion ).Multiple regression revealed no significant linear effects of delay on postscan ratings (frequency:p =0.224,vividness:p =0.770).We averaged the postscan ratings acrosseventsFigure 1.Behavioral TaskDuring fMRI,subjects made repeated choices between a fixed immediate reward of 20V and larger but delayed amounts.In the control condi-tion,amounts were paired with a waiting time only,whereas in the episodic condition,amounts were paired with a waiting time and a subject-specific verbal episodic tag indicating to the subjects which event they had planned at the respective day of reward delivery.Events were real and collected in a separate testing session prior to the day of scanning.NeuronEpisodic Modulation of Delay DiscountingNeuron 66,138–148,April 15,2010ª2010Elsevier Inc.139and the frequency/vividness dimensions,yielding an‘‘imagery score’’for each subject.Individual participants’choice data from the fMRI session were then analyzed byfitting hyperbolic discount functions to subject-specific indifference points to obtain discount rates (k-parameters),separately for the episodic and control condi-tions(see Experimental Procedures).Subjective preferences were well-characterized by hyperbolic functions(median R2 episodic condition=0.81,control condition=0.85).Discount functions of four exemplary subjects are shown in Figure2A. For both conditions,considerable variability in the discount rate was observed(median[range]of discount rates:control condition=0.014[0.003–0.19],episodic condition=0.013 [0.002–0.18]).To account for the skewed distribution of discount rates,all further analyses were conducted on the log-trans-formed k-parameters.Across subjects,log-transformed discount rates were significantly lower in the episodic condition compared with the control condition(t(29)=2.27,p=0.016),indi-cating that participants’choice behavior was less impulsive in the episodic condition.The difference in log-discount rates between conditions is henceforth referred to as the episodic tag effect.Fitting hyperbolic functions to the median indifference points across subjects also showed reduced discounting in the episodic condition(discount rate control condition=0.0099, episodic condition=0.0077).The size of the tag effect was not related to the discount rate in the control condition(p=0.56). We next hypothesized that the tag effect would be positively correlated with postscan ratings of episodic thought(imagery scores,see above).Robust regression revealed an increase in the size of the tag effect with increasing imagery scores (t=2.08,p=0.023,see Figure2B),suggesting that the effect of the tags on preferences was stronger the more vividly subjects imagined the episodes.Examples of written postscan reports are provided in the Supplemental Results for participants from the entire range of imagination ratings.We also correlated the tag effect with standard neuropsychological measures,the Sensation Seeking Scale(SSS)V(Beauducel et al.,2003;Zuck-erman,1996)and the Behavioral Inhibition Scale/Behavioral Approach Scale(BIS/BAS)(Carver and White,1994).The tag effect was positively correlated with the experience-seeking subscale of the SSS(p=0.026)and inversely correlated with the reward-responsiveness subscale of the BIS/BAS scales (p<0.005).Repeated-measures ANOVA of reaction times(RTs)as a func-tion of option value(lower,similar,or higher relative to the refer-ence option;see Experimental Procedures and Figure2C)did not show a main effect of condition(p=0.712)or a condition 3value interaction(p=0.220),but revealed a main effect of value(F(1.8,53.9)=16.740,p<0.001).Post hoc comparisons revealed faster RTs for higher-valued options relative to similarly (p=0.002)or lower valued options(p<0.001)but no difference between lower and similarly valued options(p=0.081).FMRI DataFMRI data were modeled using the general linear model(GLM) as implemented in SPM5.Subjective value of each decision option was calculated by multiplying the objective amount of each delayed reward with the discount fraction estimated behaviorally based on the choices during scanning,and included as a parametric regressor in the GLM.Note that discount rates were estimated separately for the control and episodic conditions(see above and Figure2),and we thus used condition-specific k-parameters for calculation of the subjective value regressor.Additional parametric regressors for inverse delay-to-reward and absolute reward magnitude, orthogonalized with respect to subjective value,were included in theGLM.Figure2.Behavioral Data from Experiment1Shown are experimentally derived discount func-tions from the fMRI session for four exemplaryparticipants(A),correlation with imagery scores(B),and reaction times(RTs)(C).(A)Hyperbolicfunctions werefit to the indifference points sepa-rately for the control(dashed lines)and episodic(solid lines,filled circles)conditions,and thebest-fitting k-parameters(discount rates)and R2values are shown for each subject.The log-trans-formed difference between discount rates wastaken as a measure of the effect of the episodictags on choice preferences.(B)Robust regressionrevealed an association between log-differences indiscount rates and imagery scores obtained frompostscan ratings(see text).(C)RTs were signifi-cantly modulated by option value(main effectvalue p<0.001)with faster responses in trialswith a value of the delayed reward higher thanthe20V reference amount.Note that althoughseven delays were used for each condition,somedata points are missing,e.g.,onlyfive delay indif-ference points for the episodic condition areplotted for sub20.This indicates that,for the twolongest delays,this subject never chose the de-layed reward.***p<0.005.Error bars=SEM.Neuron Episodic Modulation of Delay Discounting140Neuron66,138–148,April15,2010ª2010Elsevier Inc.Episodic Tags Activate the Future Thinking NetworkWe first analyzed differences in the condition regressors without parametric pared to those of the control condi-tion,BOLD responses to the presentation of the delayed reward in the episodic condition yielded highly significant activations (corrected for whole-brain volume)in an extensive network of brain regions previously implicated in episodic future thinking (Addis et al.,2007;Schacter et al.,2007;Szpunar et al.,2007)(see Figure 3and Table S2),including retrosplenial cortex (RSC)/PCC (peak MNI coordinates:À6,À54,14,peak z value =6.26),left lateral parietal cortex (LPC,À44,À66,32,z value =5.35),and vmPFC (À8,34,À12,z value =5.50).Distributed Neural Coding of Subjective ValueWe then replicated previous findings (Kable and Glimcher,2007;Kable and Glimcher,2010;Peters and Bu¨chel,2009)using a conjunction analysis (Nichols et al.,2005)searching for regions showing a positive correlation between the height of the BOLD response and subjective value in the control and episodic condi-tions in a parametric analysis (Figure 4A and Table S3).Note that this is a conservative analysis that requires that a given voxel exceed the statistical threshold in both contrasts separately.This analysis revealed clusters in the lateral orbitofrontal cortex (OFC,À36,50,À10,z value =4.50)and central OFC (À18,12,À14,z value =4.05),bilateral VS (right:10,8,0,z value =4.22;left:À10,8,À6,z value =3.51),mPFC (6,26,16,z value =3.72),and PCC (À2,À28,24,z value =4.09),representing subjective (discounted)value in both conditions.We next analyzed the neural tag effect,i.e.,regions in which the subjective value correlation was greater for the episodic condi-tion as compared with the control condition (Figure 4B and Table S4).This analysis revealed clusters in the left LPC (À66,À42,32,z value =4.96,),ACC (À2,16,36,z value =4.76),left dorsolateral prefrontal cortex (DLPFC,À38,36,36,z value =4.81),and right amygdala (24,2,À24,z value =3.75).Finally,we performed a triple-conjunction analysis,testing for regions that were correlated with subjective value in both conditions,but in which the value correlation increased in the episodic condition.Only left LPC showed this pattern (À66,À42,30,z value =3.55,see Figure 4C and Table S5),the same region that we previously identified as delay-specific in valuation (Petersand Bu¨chel,2009).There were no regions in which the subjective value correlation was greater in the control condition when compared with the episodic condition at p <0.001uncorrected.ACC Valuation Signals and Functional Connectivity Predict Interindividual Differences in Discount Function ShiftsWe next correlated differences in the neural tag effect with inter-individual differences in the size of the behavioral tag effect.To this end,we performed a simple regression analysis in SPM5on the single-subject contrast images of the neural tag effect (i.e.,subjective value correlation episodic >control)using the behavioral tag effect [log(k control )–log(k episodic )]as an explana-tory variable.This analysis revealed clusters in the bilateral ACC (right:18,34,18,z value =3.95,p =0.021corrected,left:À20,34,20,z value =3.52,Figure 5,see Table S6for a complete list).Coronal sections (Figure 5C)clearly show that both ACC clusters are located in gray matter of the cingulate sulcus.Because ACC-limbic interactions have previously been impli-cated in the control of choice behavior (Floresco and Ghods-Sharifi,2007;Roiser et al.,2009),we next analyzed functional coupling with the right ACC from the above regression contrast (coordinates 18,34,18,see Figure 6A)using a psychophysiolog-ical interaction analysis (PPI)(Friston et al.,1997).Note that this analysis was conducted on a separate first-level GLM in which control and episodic trials were modeled as 10s miniblocks (see Experimental Procedures for details).We first identified regions in which coupling with the ACC changed in the episodic condition compared with the control condition (see Table S7)and then performed a simple regression analysis on these coupling parameters using the behavioral tag effect as an explanatory variable.The tag effect was associated with increased coupling between ACC and hippocampus (À32,À18,À16,z value =3.18,p =0.031corrected,Figure 6B)and ACC and left amygdala (À26,À4,À26,z value =2.95,p =0.051corrected,Figure 6B,see Table S8for a complete list of activa-tions).The same regression analysis in a second PPI with the seed voxel placed in the contralateral ACC region from the same regression contrast (À20,34,22,see above)yielded qual-itatively similar,though subthreshold,results in these same structures (hippocampus:À28,À32,À6,z value =1.96,amyg-dala:À28,À6,À16,z value =1.97).Experiment 2We conducted an additional behavioral experiment to address a number of alternative explanations for the observed effects of tags on choice behavior.First,it could be argued thatepisodicFigure 3.Categorical Effect of Episodic Tags on Brain ActivityGreater activity in lateral parietal cortex (left)and posterior cingulate/retrosplenial and ventro-medial prefrontal cortex (right)was observed in the episodic condition compared with the control condition.p <0.05,FWE-corrected for whole-brain volume.NeuronEpisodic Modulation of Delay DiscountingNeuron 66,138–148,April 15,2010ª2010Elsevier Inc.141tags increase subjective certainty that a reward would be forth-coming.In Experiment 2,we therefore collected postscan ratings of reward confidence.Second,it could be argued that events,always being associated with a particular date,may have shifted temporal focus from delay-based to more date-based processing.This would represent a potential confound,because date-associated rewards are discounted less than delay-associated rewards (Read et al.,2005).We therefore now collected postscan ratings of temporal focus (date-based versus delay-based).Finally,Experiment 1left open the question of whether the tag effect depends on the temporal specificity of the episodic cues.We therefore introduced an additional exper-imental condition that involved the presentation of subject-specific temporally unspecific future event cues.These tags (henceforth referred to as unspecific tags)were obtained by asking subjects to imagine events that could realistically happen to them in the next couple of months,but that were not directly tied to a particular point in time (see Experimental Procedures ).Episodic Imagery,Not Temporal Specificity,Reward Confidence,or Temporal Focus,Predicts the Size of the Tag EffectIn total,data from 16participants (9female)are included.Anal-ysis of pretest ratings confirmed that temporally unspecific and specific tags were matched in terms of personal relevance,arousal,valence,and preexisting associations (all p >0.15).Choice preferences were again well described by hyperbolic functions (median R 2control =0.84,unspecific =0.81,specific =0.80).We replicated the parametric tag effect (i.e.,increasing effect of tags on discount rates with increasing posttest imagery scores)in this independent sample for both temporally specific (p =0.047,Figure 7A)and temporally unspecific (p =0.022,Figure 7A)tags,showing that the effect depends on future thinking,rather than being specifically tied to the temporal spec-ificity of the event cues.Following testing,subjects rated how certain they were that a particular reward would actually be forth-coming.Overall,confidence in the payment procedure washighFigure 4.Neural Representation of Subjective Value (Parametric Analysis)(A)Regions in which the correlation with subjective value (parametric analysis)was significant in both the control and the episodic conditions (conjunction analysis)included central and lateral orbitofrontal cortex (OFC),bilateral ventral striatum (VS),medial prefrontal cortex (mPFC),and posterior cingulate cortex(PCC),replicating previous studies (Kable and Glimcher,2007;Peters and Bu¨chel,2009).(B)Regions in which the subjective value correlation was greater for the episodic compared with the control condition included lateral parietal cortex (LPC),ante-rior cingulate cortex (ACC),dorsolateral prefrontal cortex (DLPFC),and the right amygdala (Amy).(C)A conjunction analysis revealed that only LPC activity was positively correlated with subjective value in both conditions,but showed a greater regression slope in the episodic condition.No regions showed a better correlation with subjective value in the control condition.Error bars =SEM.All peaks are significant at p <0.001,uncorrected;(A)and (B)are thresholded at p <0.001uncorrected and (C)is thresholded at p <0.005,uncorrected for display purposes.NeuronEpisodic Modulation of Delay Discounting142Neuron 66,138–148,April 15,2010ª2010Elsevier Inc.(Figure 7B),and neither unspecific nor specific tags altered these subjective certainty estimates (one-way ANOVA:F (2,45)=0.113,p =0.894).Subjects also rated their temporal focus as either delay-based or date-based (see Experimental Procedures ),i.e.,whether they based their decisions on the delay-to-reward that was actually displayed,or whether they attempted to convert delays into the corresponding dates and then made their choices based on these dates.There was no overall significant effect of condition on temporal focus (one-way ANOVA:F (2,45)=1.485,p =0.237,Figure 7C),but a direct comparison between the control and the temporally specific condition showed a significant difference (t (15)=3.18,p =0.006).We there-fore correlated the differences in temporal focus ratings between conditions (control:unspecific and control:specific)with the respective tag effects (Figure 7D).There were no correlations (unspecific:p =0.71,specific:p =0.94),suggesting that the observed differences in discounting cannot be attributed to differences in temporal focus.High-Imagery,but Not Low-Imagery,Subjects Adjust Their Discount Function in an Episodic ContextFor a final analysis,we pooled the samples of Experiments 1and 2(n =46subjects in total),using only the temporally specific tag data from Experiment 2.We performed a median split into low-and high-imagery participants according to posttest imagery scores (low-imagery subjects:n =23[15/8Exp1/Exp2],imagery range =1.5–3.4,high-imagery subjects:n =23[15/8Exp1/Exp2],imagery range =3.5–5).The tag effect was significantly greater than 0in the high-imagery group (t (22)=2.6,p =0.0085,see Figure 7D),where subjects reduced their discount rate by onaverage 16%in the presence of episodic tags.In the low-imagery group,on the other hand,the tag effect was not different from zero (t (22)=0.573,p =0.286),yielding a significant group difference (t (44)=2.40,p =0.011).DISCUSSIONWe investigated the interactions between episodic future thought and intertemporal decision-making using behavioral testing and fMRI.Experiment 1shows that reward delay dis-counting is modulated by episodic future event cues,and the extent of this modulation is predicted by the degree of sponta-neous episodic imagery during decision-making,an effect that we replicated in Experiment 2(episodic tag effect).The neuroi-maging data (Experiment 1)highlight two mechanisms that support this effect:(1)valuation signals in the lateral ACC and (2)neural coupling between ACC and hippocampus/amygdala,both predicting the size of the tag effect.The size of the tag effect was directly related to posttest imagery scores,strongly suggesting that future thinking signifi-cantly contributed to this effect.Pooling subjects across both experiments revealed that high-imagery subjects reduced their discount rate by on average 16%in the episodic condition,whereas low-imagery subjects did not.Experiment 2addressed a number of alternative accounts for this effect.First,reward confidence was comparable for all conditions,arguing against the possibility that the tags may have somehow altered subjec-tive certainty that a reward would be forthcoming.Second,differences in temporal focus between conditions(date-basedFigure 5.Correlation between the Neural and Behavioral Tag Effect(A)Glass brain and (B and C)anatomical projection of the correlation between the neural tag effect (subjective value correlation episodic >control)and the behav-ioral tag effect (log difference between discount rates)in the bilateral ACC (p =0.021,FWE-corrected across an anatomical mask of bilateral ACC).(C)Coronal sections of the same contrast at a liberal threshold of p <0.01show that both left and right ACC clusters encompass gray matter of the cingulate gyrus.(D)Scatter-plot depicting the linear relationship between the neural and the behavioral tag effect in the right ACC.(A)and (B)are thresholded at p <0.001with 10contiguous voxels,whereas (C)is thresholded at p <0.01with 10contiguousvoxels.Figure 6.Results of the Psychophysiolog-ical Interaction Analysis(A)The seed for the psychophysiological interac-tion (PPI)analysis was placed in the right ACC (18,34,18).(B)The tag effect was associated with increased ACC-hippocampal coupling (p =0.031,corrected across bilateral hippocampus)and ACC-amyg-dala coupling (p =0.051,corrected across bilateral amygdala).Maps are thresholded at p <0.005,uncorrected for display purposes and projected onto the mean structural scan of all participants;HC,hippocampus;Amy,Amygdala;rACC,right anterior cingulate cortex.NeuronEpisodic Modulation of Delay DiscountingNeuron 66,138–148,April 15,2010ª2010Elsevier Inc.143。
大脑结构名词中英文对照
大脑结构名词中英文对照安蒙氏角 Ammom's horn白质 white matter背内侧丘脑 dorsalmedial thalamus背外侧通路 dorsallateral pathway背外侧膝状核 dorsal lateral geniculate nucleus被盖 tegmentum被盖背束 dorsal tegmental bundle被盖腹区 ventral tegmental area边缘皮质 limbic cortex边缘系统 limbic system布洛卡区 Broca's area苍白球 globus pallidus侧脑室 lateral ventricle齿状回 dentate gyrus穿质通路 perforant path传出纤维 efferent fibers传入纤维 afferent fibers大脑半球 cerebral hemisphere大脑导水管 cerebral aqueduct导水管周围灰质 periaqueductal grey matter第三脑室 third ventricle第四脑室 fourth ventricles顶盖 tectum顶盖脊髓束 tectospinal tract顶盖枕核系统 tectopulvinar system顶叶 parietal lobes豆状核 lentiform nucleus端脑 telecephalon额眶皮质 orbital frontal cortex额叶 frontal lobe额叶岛盖 frontal operculum耳蜗核 cochlear nucleus二级投射区 sencondary projection area非特异性投射系统 nonspecific projecting system 缝际核 raphe nucleus伏核 nucleus accumbens腹内侧通路 ventraomedial pathway腹内侧下丘脑 ventromedial hypothalamus隔区 septal area弓状核 arcuate nucleus弓状束 arcuate fasciculus沟 sulcus钩束 uncinate faciculus孤束核 solitary nucleus海马 hippocampus海马结构 hippocampus formation海马伞 fimbria黑质 substantia nigra黑质纹状体束 nigrotriatal bundles红核 red nucleus红核束 rubrospinal tract后脑 metencephalon灰质 gray substance基底神经节 basal ganglia基底外侧核群 basolateral nuclear group间脑 diencephalon交叉 decussation角回 angular gyrus旧纹状体(苍白球) paleostriatum距状裂 calcarine fissure壳核 putamen扣带 cingulum扣带回 cingulate gyrus扣带回皮质 cingulate cortex蓝斑 locus coeruleus连合 commissure联络皮质 associative cortex裂 fissure菱脑 rhombencephalon漏斗 infundibulum颅腔 endocast脉络丛 choroid plexus梅纳特基底核(无名核) basal nucleus of Meynert 末脑 myelencephalon内侧前脑束 medial forebrain bundle内侧膝状体 medial geniculate nucleus内囊 internal capsule内嗅皮质 entorhinal cortex脑干 brain stem脑干网状结构 brainstem reticular formation脑化 encephalization脑化指数 encephalization index脑回 gyrus脑脊膜 meninges脑脊液 cerebrospinal fluid脑桥 pons脑室 ventricles颞平台 planum temporale颞叶 temporal lobe旁臂核 parabranchial nucleus旁室核 paraventricular nucleus皮质脊髓侧束 lateral corticospinal tract皮质脊髓前束 ventral corticospinal tract皮质脊髓束 corticospinal system皮质脊髓通路 cortcospinal pathway皮质内侧核群 corticomedial nuclear group皮质下 subcortex皮质延髓束 corticobulbar tract胼胝体 corpus callosum前额皮质 prefrontal cortex前脑 proseucephalon前脑基底大细胞核 magnocellular nucleus of the basal forebrain 前下托 presubiculum穹窿 fornix穹窿下器官 subfornical organ丘 colliculus丘脑 thalamus丘脑腹后核 ventral posterior nucleus of thalamus 丘脑腹外侧核 ventrolateral nucleus of thalamus 丘脑前核 anterior nucleus thalamus丘系系统 lemniscal system躯体感觉皮质 somatosensory cortex躯体感觉区 somatosensory area乳头丘脑束 mammillothalamic tract乳头体 mammillary body软脑膜 pia matter塞尔维氏裂 Sylvian fissure三级投射区 tertiary projection area上橄榄核群 superior olivary complex上丘 superior colliculus上丘脑 epithalamus神经核 nucleus视顶盖 optic tectum视放核 optical radiation视交叉上核 suprachiasmatic nucleus视觉背侧系统 dorsal system of visual function视觉腹侧系统 ventral system of visual function 视觉皮质(枕极) visual cortex视前内侧区 medial preoptic area视前区 preoptic area视上核 supraoptic nucleus室周器官 circumventricular organ松果体 corpus pineale髓板 medullary lamina髓质 medullary substances or medulla特异性投射系统 specific projecting system听觉皮质 auditory cortex听觉皮质 auditory cortex外侧丘系 lateral lemniscus外侧膝状体 lateral geniculate nucleus外侧膝状体纹皮质系统 geniculostriate system外侧下丘脑 lateral hypothalamus area外囊 external capsuale网状脊髓束 reticulospinal tract网状结构 reticular formation维尔尼克区 Wernicke area尾状核 caudate nucleus纹前皮质 prestriate cortex纹状皮质 striate cortex纹状区 striate area下颞皮质 inferior temporal cortex下丘 inferior colliculus下丘脑 hypothalamus下托 subiculum小脑 cerebellum小脑上脚 superior cerebella peduncle小脑小叶 cerebellar folia小细胞神经分泌系统 parvocellular neurosecretory system 新纹状体 neostriatum杏仁核 amygdala杏仁核腹侧传出通路 ventral amygdalofugal pathway 性二型核 sexually dimorphic nucleus嗅脑 rhinencephalon嗅球 olfactory bulb延脑 medulla oblongata眼优势柱 ocular dominance columns一级感觉皮质=第一感觉区 primary sensory cortex 一级视觉皮质 primary visual cortex一级投射皮质 primary projection area一级运动皮质 primary motor cortex硬脑膜 dura matter运动控制系统 motor control system运动皮质 motor cortex枕骨大孔 occipital foramen枕核 pulvinar枕极 occipital pole枕角 occipital horns枕叶 occipital lobe中缝大核 nucleus raphe magnus中间块 massa intermedia中间皮质 mesocortex中脑 mesencephalon中央被盖束 central tegmental tract中央沟 central sulcus中央管 central canal中央后回 postcentral cortex中央前回 precentral gyrus终纹 stria terminalis蛛网膜 arachnoid蛛网膜下腔 subarachnoid锥体区 pyramidalis area锥体外运动系统 extrapyramidal motor system 锥体运动系统 pyramidal motor system。
Neuron overload and the juggling physician

Neuron overload and the juggling physicianDanielle Ofri aPatients often complain that their doctors don't listen. Although there are probably a few doctors who truly are tone deaf, most are reasonably empathic human beings, and I wonder why even these doctors seem prey to this criticism. I often wonder whether it is sheer neuron overload on the doctor side that leads to this problem. Sometimes it feels as though my brain is juggling so many competing details, that one stray request from a patient—even one that is quite relevant—might send the delicately balanced three-ring circus tumbling down.One day, I tried to work out how many details a doctor needs to keep spinning in her head in order to do a satisfactory job, by calculating how many thoughts I have to juggle in a typical office visit. Mrs Osorio is a 56-year-old woman in my practice. She is somewhat overweight. She has reasonably well-controlled diabetes and hypertension. Her cholesterol is on the high side but she doesn't take any medications for this. She doesn't exercise as much as she should, and her last DEXA scan showed some thinning of her bones. She describes her life as stressful, although she's been good about keeping her appointments and getting her blood tests. She's generally healthy, someone who'd probably be described as an average patient in a medical practice, not excessively complicated.Here are the thoughts that run through my head as I proceed through our 20-min consultation.Good thing she did her blood tests. Glucose is a little better. Cholesterol isn't great. May need to think about starting a statin. Are her liver enzymes normal?Her weight is a little up. I need to give her my talk about five fruits and vegetables and 30 min of walking each day.Diabetes: how do her morning sugars compare to her evening sugars? Has she spoken with the nutritionist lately? Has she been to the eye doctor? The podiatrist?Her blood pressure is good but not great. Should I add another BP med? Will more pills be confusing? Does the benefit of possible better blood pressure control outweigh the risk of her possibly not taking all of her meds?Her bones are a little thin on the DEXA. Should I start a bisphosphonate that might prevent osteoporosis? But now I'm piling yet another pill onto her, and one that requires detailed instructions. Maybe leave this until next time?How are things at home? Is she experiencing just the usual stress of life, or might there be depression or anxiety disorder lurking? Is there time for the depression questionnaire?Health maintenance: when was her last mammogram? PAP smear? Has she had a colonoscopy since she turned 50? Has she had a tetanus booster in the past 10 years? Does she qualify for a pneumonia vaccine?Ms Osorio interrupts my train of thought to tell me that her back has been aching for the past few months. From her perspective, this is probably the most important item in our visit, but the fact is that she's caught one of my neurons in mid-fire (the one that's thinking about her blood sugar, which is segueing into the neuron that's preparing the diet-and-exercise discussion, which is intersecting with the one that's debating about initiating a statin). My instinct is to put one hand up and keep all interruptions at bay. It's not that I don't want to hear what she has to say, but the sensation that I'm juggling so many thoughts, and need to resolve them all before the clock runs down, that keeps me in moderate state of panic. What if I drop one—what if one of my thoughts evaporates while I address another concern? I'm trying to type as fast as I can, for the very sake of not letting any thoughts escape, but every time I turn to the computer to write, I'm not making eye contact with Mrs Osorio. I don't want my patient to think that the computer is more important than she is, but I have to keep looking toward the screen to get her lab results, check her mammogram report, document the progress of her illnesses, order the tests, refill her prescriptions.Then she pulls a form out her of bag: her insurance company needs this form for some reason or another. An innocent—and completely justified—request, but I feel that this could be the straw that breaks the camel's back, that the precarious balance of all that I'm keeping in the air will be simply unhinged. I nod, but indicate that we need to do her physical examination first. I barrel through the basics, then quickly check for any red-flag signs that might suggest that her back pain is anything more than routine muscle strain. I return to the computer to input all the information, mentally running through my checklist, anxious that nothing important slips from my brain's holding bay.I want to do everything properly and cover all our bases, but the more effort I place into accurate and thorough documentation, the less time I have to actually interact with my patient. A glance at the clock tells me that we've gone well beyond our allotted time. I stand up and hand Mrs Os orio her prescriptions. “What about my insurance form,” she asks. “It needs to be in by Friday, otherwise I might lose my coverage.” I clap my hand against my forehead; I've completely forgotten about the form she'd asked about just a few minutes ago.Studies have debunked the myth of multitasking in human beings. The concept of multitasking was developed in the computer field to explain the idea of a microprocessor doing two jobs at one time. It turns out that microprocessors are in fact linear, and actually perform only one task at a time. Our computers give the illusion of simultaneous action based on the microprocessor “scheduling” competing activities in a complicated integratedalgorithm. Like microprocessors, we humans can't actually concentrate on two thoughts at the same exact time. We merely zip back and forth between them, generally losing accuracy in the process. At best, we can juggle only a handful of thoughts in this manner. The more thoughts we juggle, the less we are able to attune fully to any given thought. To me, this is a recipe for disaster. Today I only forgot an insurance company form. But what if I'd forgotten to order her mammogram, or what if I'd refilled only five of her six medicines? What if I'd forgotten to fully explain the side-effects of one of her medications? The list goes on, as does the anxiety.At the end of the day, my mind spins as I try to remember if I've forgotten anything. Mrs Osorio had seven medical issues to consider, each of which required at least five separate thoughts: that's 35 thoughts. I saw ten patients that afternoon: that's 350. I'd supervised five residents that morning, each of whom saw four patients, each of whom generated at least ten thoughts. That's another 200 thoughts. It's not to say that we can't handle 550 thoughts in a working day, but each of these thoughts potentially carries great risk if improperly evaluated. If I do a good job juggling 98% of the time, that still leaves ten thoughts that might get lost in the process. Any one of those lost thoughts could translate into a disastrous outcome, not to mention a possible lawsuit. Most doctors are reasonably competent, caring individuals, but the overwhelming swirl of thoughts that we must keep track of leaves many of us in a perpetual panic that something serious might slip. This is what keeps us awake at night.There are many proposed solutions—computer-generated reminders, case managers, ancillary services. To me, the simplest one would be time. If I had an hour for each patient, I'd be a spectacular doctor. If I could let my thoughts roll linearly and singularly, rather than simultaneously and haphazardly, I wouldn't fear losing anything. I suspect that it would actually be more efficient, as my patients probably wouldn't have to return as frequently. But realistically, no one is going to hand me a golden hour for each of my patients. My choices seem to boil down to entertaining fewer thoughts, accepting decreased accuracy for each thought, giving up on thorough documentation, or having a constant headache from neuronal overload.These are the choices that practising physicians face every day, with every patient. Mostly we rely on our clinical judgment to prioritise, accepting the trade-off that is inevitable with any compromise. We attend to the medical issues that carry the greatest weight and then have to let some of the lesser ones slide, with the hope that none of these seemingly lesser ones masks something grave.Some computers have indeed achieved the goal of true multitasking, by virtue of having more than one microprocessor. In practice, that is like possessing an additional brain that can function independently and thus truly simultaneously. Unless the transplant field advances drastically, there is little hope for that particular deus ex machina. In some cases,having a dedicated and competent clinical partner such as a one-on-one nurse can come close to simulating a second brain, but most medical budgets don't allow for such staffing indulgence.As it stands, it seems that we will simply have to continue this impossible mental high-wire act, juggling dozens of clinical issues in our brains, panicking about dropping a critical one. The resultant neuronal overload will continue to present a distracted air to our patients that may be interpreted as us not listening, or perhaps not caring.When my computer becomes overloaded, it simply crashes. Usually, I reboot in a fury, angry about all my lost work. Now, however, I view my computer with a tinge of envy. It has the luxury of being able to crash, and of a reassuring, omniscient hand to press the reboot button. Physicians are permitted no such extravagance. I pull out the bottle of paracetamol tablets from my desk drawer and set about disabling the childproof cap. It's about the only thing I truly have control over.。
玻色因的结构

玻色因的结构玻色因(Bose-Einstein condensate)是一种特殊的物质状态,它是由一群低能量的玻色子(Bose particles)组成的。
在这种状态下,这些玻色子会集中在一个量子态中,形成一个巨大的波函数,表现出量子行为的统一性。
玻色因是量子物理学中的一个重要现象,对于我们理解物质的行为和探索量子世界具有重要意义。
玻色因最早由印度物理学家博塞(Satyendra Nath Bose)和爱因斯坦(Albert Einstein)在1924年提出。
他们基于玻色子的统计性质,预言了一种新的物质状态,即玻色-Einstein凝聚态。
这一预言在1995年得到了实验上的验证,斯蒂芬·温斯(Eric A. Cornell)、卡尔·韦曼(Carl E. Wieman)和沃尔夫冈·凯特勒(Wolfgang Ketterle)三位科学家通过冷却稀释的气体获得了玻色因。
玻色因的形成需要极低的温度和高密度。
当气体冷却到绝对零度附近时,原子的动能减小,原子之间的相互作用变得显著。
在这种极端条件下,玻色子会趋向于占据最低能级,形成一个集体的量子态。
在这个状态下,玻色子会失去个体特性,成为一个整体,表现出波粒二象性。
与传统的气体不同,玻色因可以表现出粒子之间的相干性,即波函数的幅度可以相互加强或抵消,使得整个系统表现出惊人的一致性。
玻色因的研究不仅对于基础物理学有重要意义,还有许多潜在的应用。
例如,玻色因可以用于制造更精确的量子计量仪器,实现更高效的信息处理和传输。
此外,玻色因还可以模拟宇宙中的宏观量子现象,帮助我们理解黑洞、引力等复杂的物理现象。
在实验室中,科学家们通过使用激光冷却和磁场调控等技术,成功地制备了玻色因。
这些实验不仅为我们提供了研究玻色因的重要工具,还为理解和探索量子世界打开了一扇新的窗口。
通过观察和测量玻色因的行为,科学家们可以揭示量子统计和量子相干性的奥秘,为量子计算和量子通信等领域的发展提供新的思路和技术支持。
研究揭示人类皮质树突特殊动作电位

研究揭示人类皮质树突特殊动作电位
作者:
来源:《科学导报》2020年第02期
德国柏林洪堡大学Matthew Evan Larkum团队揭示人类2/3层皮质神经元中的树突动作电位和计算过程。
该研究1月3日发表于《科学》。
研究人员研究了离体人类大脑皮层的第2层和第3层(L2/3)锥体神经元的树突。
在这些神经元中,研究人员发现了一类钙介导的树突动作电位(dCaAP),其波形和对神经元输出的影响以前没有被描述过。
与典型的全有或全无动作电位相反,dCaAP可被分级。
对于阈值水平的刺激,它们的振幅是最大的,但是对于较强的刺激,它们的振幅是衰减的。
这些dCaAP使人类新皮质锥体神经元的树突能够对线性不可分离的输入进行分类,而这种计算過程通常被认为需要多层网络。
据《科学网》。
突触小泡循环的测定和系统[发明专利]
![突触小泡循环的测定和系统[发明专利]](https://img.taocdn.com/s3/m/b6cf2628a1c7aa00b42acb9d.png)
专利名称:突触小泡循环的测定和系统
专利类型:发明专利
发明人:大卫·J·格伯,杰弗里·R·科特雷尔,蒂莫西·A·瑞安,乔纳森·M·利文森
申请号:CN200980144076.9
申请日:20090831
公开号:CN102203622A
公开日:
20110928
专利内容由知识产权出版社提供
摘要:部分而言,本发明提供用于分析突触小泡循环的方面的平台。
根据其他方面,本发明提供神经元细胞培养平台和用于分析突触小泡循环的方面的平台。
根据其他方面,本发明提供测量多个细胞中突触小泡循环的方面的方法。
根据其他方面,本发明提供用于鉴定测试物的方法,所述测试物作为突触小泡循环的方面的调节剂。
申请人:加利尼公司
地址:美国马萨诸塞州
国籍:US
代理机构:北京集佳知识产权代理有限公司
更多信息请下载全文后查看。
磁共振常用英文缩写

磁共振常用英文缩写AACR 美国放射学会ADC 模数转换器、表面扩散系数BBBB 血脑屏障BOLD 血氧合水平依赖性(成像法)CCBF 脑血流量CBV 脑血容量CE 对比度增强CSI 化学位移成像CHESS 化学位移选择性(波谱分析法)CNR 对比度噪声比CNS 中枢神经系统Cr 肌酸CSF 脑脊液DDAC 数模转换器DDR 偶极-偶极驰豫、对称质子驰豫DICOM 医学数字成像和通信标准DTPA 对二亚乙基三胺五乙酸DWI 扩散加权成像DSA 数字减影成像术DRESS 磷谱研究所用空间定位法,又称深度分辨表面线圈波普EEPI 回波平面成像TE 回波时间ETL 回波链长度ETS 回波间隔时间EVI 回波容积成像EDTA 乙二胺四乙酸ETE 有效回波时间EPR 电子顺磁共振ESR 电子自旋共振FFFT 快速傅里叶变换FLASH 快速小角度激发FSE 快速自旋回波FE 场回波FID 自由感应衰减FOV 成像野FISP 稳定进动快速成像FLAIR 液体抑制的反转恢复fMRI 功能磁共振成像FID 自由感应衰减信号FIS 自由感应信号FT 傅里叶变换FWHH 半高宽GGM 灰质GMC 梯度矩补偿GMN 梯度矩置零GMR 梯度矩重聚GRE 梯度回波HHPG-MRI 超极化气体磁共振成像术IIR 反转序列IRSE 反转恢复自旋回波序列KK-space K空间LLMR 定域磁共振MMRA 磁共振血管成像MRCM 磁共振对比剂MRI 磁共振成像MRM 磁共振微成像MRS 磁共振波谱学MRSI 磁共振波谱成像MRV 磁共振静脉造影MT 磁化转移MTC 磁化转移对比度MAST 运动伪影抑制技术MIP 最大密度投影法MTT 平均转运时间MESA 多回波采集MPR 多平面重建MP-RAGE 磁化准备的快速采集梯度回波序列MS-EPI 多次激发的EPINNEX 激励次数NMR 核磁共振NMRS 核磁共振波谱学NSA 信号(叠加)平均次数NV 信号采集次数PPCM 顺磁性对比度增强剂PEACH 突出化学位移的顺磁性增强PS 部分饱和PSSE 部分饱和自旋回波PC 相位对比PCr 磷酸肌酸PCSI 信号强度变化率PD 质子密度PDW 质子密度加权PEDRI 质子电子双共振成像RRF 射频脉冲RARE 驰豫增强的快速采集方法ROI 感兴趣区SSAR (射频)特定吸收率SR 饱和恢复序列SE 自旋回波SNR,S/N 信噪比SS-EPI 单激发EPISPIR 谱预饱和反转恢复SSFP 稳态自由进动SSI 固态成像STE 受激回波SSC 稳定状态相干技术STEAM 空间定域的受激回波采集序列STIR 短TI反转恢复TTE 回波时间TI 反转时间TOF 时间飞越效应TMR 局部磁共振(波谱法)TSE 快速自旋回波VVOI 感兴趣空间VSE 容积选择性激发WWI 加权像WM 白质。
- 1、下载文档前请自行甄别文档内容的完整性,平台不提供额外的编辑、内容补充、找答案等附加服务。
- 2、"仅部分预览"的文档,不可在线预览部分如存在完整性等问题,可反馈申请退款(可完整预览的文档不适用该条件!)。
- 3、如文档侵犯您的权益,请联系客服反馈,我们会尽快为您处理(人工客服工作时间:9:00-18:30)。
2 Department
of Physics, National Taiwan University, Taipei, Taiwan 10764, R.O.C.
Abstract
It has been shown recently that the triple neutral gauge boson couplings are not uniquely determined in noncommutative extension of the Standard Model (NCSM). Depending on specific schemes used, the couplings are different and may even be zero. To distinguish different realizations of the NCSM, additional information either from theoretical or experimental considerations is needed. In this paper we show that these couplings can be uniquely determined from considerations of unification of electroweak and strong interactions. Using SU (5) as the underlying theory and integrating out the heavy degrees of freedom, we obtain unique non-zero new triple γγγ , γγZ , γZZ , ZZZ , γGG, ZGG and GGG couplings at the leading order in the NCSM. We also briefly discuss experimental implications. PACS numbers:
We consider the case with θµν be a constant real anti-symmetric matrix which commutes ˆ µ. with X NC quantum field theory based on the above commutation relation can be easily studied ˆ ) and B (X ˆ) using the Weyl-Moyal correspondence replacing the product of two fields A(X with NC coordinates by the star “*” product [2], ˆ )B (X ˆ ) → A(x) ∗ B (x) = Exp[i 1 θµν ∂x,µ ∂y,ν ]A(x)B (y )|x=y . A(X 2 (2)
Typeset using REVTEX 1
The property of space-time has fundamental importance in understanding the law of nature. Noncommutative (NC) quantum field theory, which modifies the space-time conmmutation relations, provides an alternative to the ordinary quantum field theory which may shed some light on the detailed structure of space-time. A simple way to modify the space-time properties is to change the usual space-time coordinate x to nonconmmutative ˆ such that [1] coordinate X ˆ µ, X ˆ ν ] = iθµν . [X (1)
(n) field strength of a ˆµ ), the resulting kinetic energy will be different even though the proper
normalization to obtain the correct kinetic energy in the commutative limit is imposed [7]. In the Standard Model, there are six different matter field multiplets for each generation, i.e. UR , dR , (u, d)L, eR , (ν, e)L and (H 0 , H − ), a priori one can choose a different gi for each of them. After identifying three combinations with the usual g3 , g2 and g1 couplings for the SM gauge groups, there is still freedom to choose different gauge boson self interaction couplings at non-zero orders in θµν (we refer these choices as different schemes). This leads to ambiguities in self interactions of gauge bosons when non-zero order terms in θµν are included. This point was nicely demonstrated in Ref. [7]. It is shown there that with one particular scheme, there are no triple photon self interactions, and with a different scheme there are. This results in non-uniqueness of the theory. This problem needs to be resolved either by performing experiments to test different schemes or applying a underlying theory which uniquely determines the kinetic energy terms. In this paper we propose a solution to this problem from grand unification theory point of view. The problem with the non-uniqueness of gauge boson kinetic energy is due to the fact that in order to overcome the charge quantization problem, new degrees of freedom have to be introduced. If the degrees of freedom can be reduced and at the same time the correct charge quantization can be obtained, the problem will be solved. To this end we note that 3
Phenomenology for NC electromagnetic theory U (1)em has been studied recently [3], but less has been done for noncommutative Standard Model (NCSM) because it is non-trivial to construct such a theory. Due to the noncommuting nature of the “*” product, even with a U (1) gauge theory the charges of matter fields in the theory are fixed to only three possible values, 1, 0, -1 [4]. Also SU (N ) group can not simply be gauged with “*” product, but U (N ) can be [4]. These pose certain difficulties in constructing NCSM, since in the SM the U (1)Y charges are not just 1, 0, -1, but some of them are fractionally charged, such as 1/6, 2/3, -1/3 for left handed quarks, right handed up and down quarks, respectively. There are also the problems with gauging the SU (3)C and SU (2)L groups. However, all these difficulties can be overcome with the use of the Seiberg-Witten map [5] which maps noncommutative U (N ) gauge fields to commutative SU (N ) gauge fields. Therefore, consistent noncommutative SU (N ) gauge theory can be constructed. The same map can also cure the charge quantization problem as shown in Ref. [6,7] by introducing new degrees of freedom. With 2