Abstract Generating fuzzy membership function with self-organizing feature map q
对fuzzy K-means的认识

俗话说:“物以类聚,人以群分”,在自然科学和社会科学中,存在着大量的分类问题。
聚类(Cluster)分析是由若干模式(Pattern)组成的。
通常,模式是一个度量(Measurement)的向量,或者是多维空间中的一个点。
聚类分析以相似性为基础,在一个聚类中的模式之间比不在同一聚类中的模式之间具有更多的相似性。
所以,聚类分析依赖于对观测间的接近程度(距离)或相似程度的理解,定义不同的距离量度和相似性量度就可以产生不同的聚类结果。
所谓类,通俗地说,就是指相似元素的集合。
聚类就是按照事物间的相似性进行区分和分类的过程。
聚类分析又称群分析,它是研究(样品或指标)分类问题的一种统计分析方法。
聚类分析起源于分类学,聚类分析也可以作为其他分析算法的一个预处理步骤。
Clustering 中文翻译作“聚类”,简单地说就是把相似的东西分到一组,同Classification (分类)不同,理想情况下,一个classifier 会从它得到的训练集中进行“学习”,从而具备对未知数据进行分类的能力,这种提供训练数据的过程通常叫做supervised learning (监督学习),而在聚类的时候,我们并不关心某一类是什么,我们需要实现的目标只是把相似的东西聚到一起,因此,一个聚类算法通常只需要知道如何计算相似度就可以开始工作了,称作 unsupervised learning (无监督学习)。
无监督分类最常用的方法之一是K均值或ISODATA、模糊C均值和EM (Expectation-Maximization)。
K-MEANS有其缺点:产生类的大小相差不会很大,对于脏数据很敏感。
不得不承认这并不是很好的结果。
不过其实大多数情况下 k-means 给出的结果都还是很令人满意的,算是一种简单高效应用广泛的 clustering 方法。
选定 K 个中心的这个过程通常是针对具体的问题有一些启发式的选取方法,或者大多数情况下采用随机选取的办法。
期刊论文格式
国际期刊排版要求及样张关于论文1.论文的书写顺序是:标题:准确地命题,以平叙为主,不能超过15个实词。
题名应该避免使用不常见的缩略词、首字母缩写字、字符、代号和公式等。
如使用缩略语最多一个,而且应在摘要中展开;作者姓名:姓在前用大写英文字母,名在后首字母大写;作者单位:如两位以上作者,单位前需标明与作者姓名相应的角标(作者最多不能超过三位);摘要:摘要应具有独立性和自含性。
摘要中有数据、有结论,是一篇完整的短文,可以独立使用,可以引用。
摘要一般应说明研究工作目的、实验方法、结果和最终结论等,而重点是结果和结论。
摘要不宜超过250个实词;关键词:关键词为3-8个名词,不能少于3个;引言:引言(或绪论)简要说明研究工作的目的、范围、相关领域的前人工作和知识空白、理论基础和分析、研究设想、研究方法和实验设计、预期结果和意义等。
应言简意赅,不要与摘要雷同,不要成为摘要的注释。
正文:正文中的公式、算式或方程式等应编排序号(见6.2.2),序号标注于该式所在行(当有续行时,应标注于最后一行)的最右边。
较长的式,另行居中横排。
如式必须转行时,只能在十,-,×,÷,<,>处转行。
上下式尽可能在等号“=”处对齐。
小数点用“.”表示。
大于999的整数和多于三位数的小数,一律用半个阿拉伯数字符的小间隔分开,不用千位撇。
对于纯小数应将0列于小数点之前。
结论:论文的结论是最终的、总体的结论,不是正文中各段的小结的简单重复。
结论应该准确、完整、明确、精练。
参考文献:不少于3篇,中文参考文献需括号注明In Chinese。
2.论文中附图、附表应附于论文的适当位置,图中文字均必须为打印字,不能用手写体以免误差。
表应编排序号(如see6.2.2)。
每一表应有简短确切的题名,连同表号置于表上。
必要时,应将表中的符号、标记、代码,以及需要说明事项,以最简练的文字,横排于表题下,作为表注。
按表、图、公式在论文中出现的先后顺序分别编号。
玉米自交系不同生育期的抗旱性鉴定及生理响应机制研究

玉米自交系不同生育期的抗旱性鉴定及生理响应机制研究张新',曹丽茹",朱卫红',张前进',魏昕',魏良明',王振华二鲁晓民”(1.河南省农业科学院粮食作物研究所,河南郑州450002: 2.河南农业大学河南粮食作物协同创新中心,河南郑州450002)摘要:以17份黄淮海常用竹干系及自选系为材料,不同生育期进行干旱胁迫,旨在筛选出一批抗旱性强的玉米种植资源,并探讨其抗旱的生理机制。
方差分析表明与正常水分相比,胁迫后的抽雄一散粉间隔未达到显著水平,但ASI间隔达到显著水平:不同生育期自交系的叶绿素含量、Fv/Fm和Fv/F。
均下降,SOD和POD活性均提髙,但不同自交系下降或上升的幅度不同,且不同自交系间、胁迫与对照间指标差异及两因素交互作用均达到极显著水平:灰色关联度表明POD活性无论是拔卩期还是抽雄期都与ASI关联度很高,可作为筛选抗旱型材料的一个重要指标;模糊隶属函数法鉴定出超4F、郑36、CIMBL12、郑63、HCL645、郑6611和PH6WC在两个生育期均属于抗旱型自交系;英中自交系超4F、郑36和郑63拔肖期和抽雄期旱胁迫后,ASI 增大幅度较小,叶绿素含虽、叶绿素荧光参数Fv/Fm和Fv/F。
抗旱指数均较高,说明这三个自交系遭受旱胁迫时主要通过调巧光合系统这种机制来提高抗旱性。
本研究结果可加快抗旱型品种的培育,同时为建立玉米抗旱性鉴泄体系奠泄基础。
关键词:玉米自交系;拔节期;抽雄期:ASI:抗旱性:种质资源基金项目:国家玉米产业技术体系(CARS-O2-O8):国家重点研发计划(2016YFD0101205-4) 作者简介:张新(1968-),女,河南罗山人,研究员,学士,主要从事玉米遗传冇种研究。
E-mail:zh5733764@ 王振华和鲁晓民为本文通讯作者:王振华E-mail:wzh201@ :鲁晓民E-mail :luxiaomin2004@ Drought Resistance Identification and Physiological Response Mechanism of Maize Inbred Lines atDifferent Growth StagesZHANG Xin'-,CAO Liru12,ZHU Weihong1, ZHANG Qianjin>,WEI Xin*,WEI Liangming1,WANG Zhenhua*\LU Xiaomin1*(1 .Grain Crop Research Institute, Henan Academy of Agricultural Sciences, Henan Zliengzhou 450002;2.Henan Agriculture University and Collaborative Innovation Center of Henan Grain Crops. Henan Zhengzhou 450002,)Abstract:17 parts of Huanghuaihai commonly used backbone and self-selected lines were used as materials, and drought stress was carried out at different growth stages. A series of drought-tolerant maize planting resources were selected to explore the physiological mechanism of drought resistance.Analysisof variance showed that the male-dispersion interval after stress did not reach a significant level comparedwith normal water, but the ASI interval reached a significant level.The chlorophyll content, Fv/Fm and Fv/Fo of inbred lines in different growth stages decreased, SOD and POD activities increased. but the amplitudes of different inbred lines decreased or increased, and different inbred lines, stress and control in indicators and interactions between the two factors reached extremely significant levels.The grey correlation degree indicates that the POD activity is highly correlated with ASI in both jointing and tasseling stages, and can be used as an important indicator for screening drought-resistant materials.Fuzzy membership function method to identify Chao 4E Zheng 36, CIMBL12, Zheng 63, HCL645, Zheng 6611 and PH6WC are drought-resistant inbred lines in both growth stages.Among them, the ASI increased slightly after the inbred lines of Chao 4E Zheng 36 and Zheng 63 jointing and tasseling stress. and the chlorophyll content, chlorophyll fluorescence parameters Fv/Fm and Fv/Fo drought indexs were higher, indicating that these three When the inbred lines are subjected to drought stress, the mechanism of photosynthetic system is mainly adjusted to improve drought resistance.The results of this study can accelerate the cultivation of drought-resistant varieties and lay the foundation for the establishment ofdrought resistance identification system for maize・Keywords: maize inbred line;jointing stage;tasseling stage:ASI: drought resistance;gerniplasni resources 玉米是世界上主要的粮食和饲料作物之一,也是需水较多对水分敏感的作物"切。
A simplified type-2 fuzzy logic controller for real-time control

0019-0578/2006/$ - see front matter © 2006 ISA—The Instrumentation, Systems, and Automation Society.
504
D. Wu and W. W. Tan / ISA Transactions 45, (2006) 503–516
a
Department of Electrical and Computer Engineering, National University of Singapore, 4, Engineering Drive 3, Singapore 117576, Singapore
͑Received 23 February 2005; accepted 3 November 2005͒
and survey processing ͓13,5͔, word modeling ͓14,15͔, phoneme recognition ͓16͔, plant monitoring and diagnostics ͓17͔, etc. Even though fuzzy control is the most widely used application of fuzzy set theory, a literature search reveals that only a few type-2 FLSs are employed in the field of control. Interval type-2 FLCs were applied to mobile robot control ͓6͔, quality control of sound speakers ͓18͔, connection admission control in ATM networks ͓19͔. A dynamical optimal training algorithm for type-2 fuzzy neural networks ͑T2FNNs͒ has also been proposed ͓20͔. T2FNNs have been used in nonlinear plant control ͓21͔ and truck back up control ͓20͔. The structure of a typical type-2 FLC is shown in Fig. 2. Input signals are the feedback error e ˙ , and the output is the and the change of error e ˙ . Compared with their change of control signal u type-1 counterparts, type-2 FLCs are better suited to eliminate persistent oscillations ͓22–24͔. The most likely explanation for this behavior is a
20 个甘蔗品种(系)的抗旱性比较

热带作物学报2020, 41(12): 2482 2491Chinese Journal of Tropical Crops20个甘蔗品种(系)的抗旱性比较李晓君1,罗正清2,陆昌强3,唐吉昌2,周中2,曹琦11. 滇西科技师范学院生物技术与工程学院,云南临沧 677000;2. 临沧市甘蔗技术推广站,云南临沧 677000;3. 双江县甘蔗技术推广站,云南双江 677300摘要:干旱是限制我国甘蔗产量提高的主要原因。
采用桶栽和人工控水的方法,对云南省甘蔗主产区临沧市选取的20个甘蔗品种(系)进行抗旱性分析,通过测定苗期和分蘖期的8个抗逆生理指标,以及分蘖率、成活率和株高3个生长指标,采用模糊隶属函数、主成分分析和系统聚类分析方法对各甘蔗品种(系)的抗旱性进行综合评价。
结果表明,干旱胁迫后,甘蔗叶片相对含水量、叶绿素含量、甘蔗分蘖率、株高和成活率呈下降趋势,而甘蔗叶片丙二醛、脯氨酸和可溶性糖含量、质膜透性、SOD和POD酶活性则呈上升趋势。
通过模糊隶属函数、主成分分析和系统聚类分析可将20份甘蔗品种(系)材料分为3类,其中7个为抗旱品种(系),6个为中等抗旱品种(系),7个为不抗旱品种(系);根据抗旱综合值,7个抗旱品种(系)的抗旱能力排名为:‘桂糖06-2081’>‘柳城05-136’>‘福农38’>‘柳城03-1137’>‘德蔗03-83’>‘云蔗05-49’>‘福农40’。
相关分析表明,与甘蔗抗旱性呈显著正相关的指标分别为成活率、株高和叶片相对含水量,呈显著负相关的指标分别为质膜透性、脯氨酸和可溶性糖含量。
关键词:干旱;甘蔗;抗旱性;品种(系)中图分类号:S566.1 文献标识码:AEvaluation of Drought Resistance on Twenty Sugarcane Varieties (Strains)LI Xiaojun1, LUO Zhengqing2, LU Changqiang3, TANG Jichang2, ZHOU Zhong2, CAO Qi11. School of Biotechnology and Engineering, West Yunnan University, Lincang, Yunnan 677000, China;2. Lincang Sugarcane Technology Extension Station, Lincang, Yunnan 677000, China;3. Shuangjiang Sugarcane Technology Extension Station, Shuang-jiang, Yunnan 677300, ChinaAbstract: Drought is the main reason to limit the increase of sugarcane yield in China. The drought resistance of 20 sugarcane varieties (strains)selected from Lincang, the main sugarcane planting area in Yunnan, was analyzed under pot and artificial water control conditions. Eight physiological indexes of stress tolerance at seedling and tillering stage, and tillering rate, survival rate and plant height were determined. Drought resistance of the sugarcane varieties was evalu-ated by fuzzy membership function, principal component analysis and systematic cluster analysis. After drought stress, the relative water content and chlorophyll content of sugarcane leaves, the tiller rate, plant height and survival rate de-creased significantly, while the content of malondialdehyde, proline and soluble sugar, plasma membrane permeability, enzyme activities of SOD and POD showed an increasing trend. 20 sugarcane varieties (strains) could be divided into 3 categories through fuzzy membership function, principal component analysis and systematic cluster analysis, including 7 drought-resistant varieties (strains), 6 moderately drought-resistant varieties/strains and 7 drought-sensitive varieties (strains). The 7 drought-resistant varieties (strains) ranked as ‘GT06-2081’>‘LC05-136’> ‘FN38’>‘LC03-1137’>‘DZ03-83’>‘YZ05-49’>‘FN40’ according to the comprehensive value. Correlation analysis showed that survival rate, plant height and relative water content of leaves were significantly positively correlated with drought resistance, while plasma membrane permeability, proline and soluble sugar content were significantly negatively correlated with drought resistance.收稿日期 2019-10-17;修回日期 2020-02-16基金项目 云南省科技厅青年项目基金项目(No. 2017FD249)。
工程常用英语词汇

目录1、电力设计基本术语2、给水排水设计基本术语3、水泵专业英语词汇4、阀门种类英汉术语对照5、阀门专用英语词汇6、照明术语7、工程结构设计基本术语电力设计基本术语abrasion-Proof component of burner 燃烧器耐磨件arm-brace 撑脚ash conditoner 调灰器basket removal panel 元件盒检修护板BDV blow down valve 疏水阀,排污阀blind 堵板blind flange 法兰堵板/盲板法兰(盖calling 催交campell diagram 叶片埃贝尔曲线dado 墙裙daily service fuel tank level switch 日用油缸液位掣damage 损毁damper 挡板damper linkage 风闸联动装置damper motor 风闸马达damping mat 阻尼垫dangerous earth potential 危险性对地电势dashpot 减震器data transmission 数据传输DC/AC converter 直流电/交流电转换器dead 不带电dead weight 自重decanter 沉淀分取器declaration of conformity 符合标准声明decommissioning 解除运作;停止运作decompression chamber 减压室decorative lighting 装饰照明;灯饰deep bore well pump 深钻井泵defect liability period 故障修理责任期;保用期defectograph 钢缆探伤仪;故障检查仪defence in depth 纵深防御definite sequence 固定次序deflection 偏转;挠度deflector sheave 折向轮;导向轮defrost timer 防霜时间掣defrost unit 溶雪组合dehumidifier 抽湿机deleterious substance 有害物质delivery and return air temperature 送风及回风温度delivery connection 出油接头delivery pressure 输出压力demand side management 用电需求管理demand side management agreement 用电需求管理协议demand side management programme 用电需求管理计划dent 凹痕dental instrument 牙科仪器dental scaler 洗牙具Departmental Administration Division [Electrical and Mechanical Services Department] 行政部〔机电工程署〕Departmental Safety Unit [Electrical and Mechanical Services Department] 部门安全组〔机电工程署〕deposition 沉积物depth measuring facility 深度测量装置derating factor 额定值降低因子derust 除锈descale 清除氧化皮design current 设计电流design parameter 设计参数designated employee 指定雇员detachable grip 可拆除的夹扣Details of Branch Offices of Registered Electrical Contractors 注册电业承办商分行详情申报deterioration 变质;变坏Deutsche Industrie Normen [DIN] 德国工业标准device 器件;装置dewatering 脱水;排水diaphragm 膜片;隔板dielectric strength test 电介质强度测试diesel fuel tank 柴油燃料缸diesel oil 柴油differential gasket 差速器衬垫differential lock 差速器锁differential oil 差速器机油diffuser 透光罩;扩散器dilute 稀释dim sum trolley 点心手推车dim transformer 光暗变压器diminution of value 减值dimmer 调光器;光暗掣;光暗器dip tube 液位探测管Diploma in Electrical Engineering 电机工程学文凭dipstick 量油尺direct current [DC] 直流电direct current control 直流控制direct current electric drive 直流电电力驱动direct current reactor 直流电抗器direct drive 直接驱动direct purging 直接驱气direct-acting lift 直接驱动升降机direct-fired vaporizer 明火直热式汽化器direction arrow 方向箭头direction arrow plate 方向指示板direction indicator 方向指示器Director of Electrical and Mechanical Services 机电工程署署长Directory of Accredited Laboratories 认可实验所名册Directory of Quality System Registration Bodies 品质系统注册团体指南disassemble 拆散discharge 放电;卸载discharge lamp 放电灯;放电管discharge lighting 放电照明设施discharge of electricity 释电;放电discharge valve 排水阀disciplinary board 纪律审裁委员会disciplinary board panel 纪律审裁委员团disciplinary tribunal 纪律审裁小组disciplinary tribunal panel 纪律审裁委员团;纪律审裁委员会discolouring 变色disconnection 截断;截离steam hamerring analysis 汽锤分析steam packing unloading valve 汽封卸载阀steam purity 蒸汽纯度steam seal diverting valve 汽封分流阀steam seal feed valve 汽封给水阀steam water mixture 汽水混合物steel bar 扁钢steel supporting 钢支架steel wire brush 钢丝轮steel works 钢结构step load change 负荷阶跃still air 蒸馏气体stirrup 镫形夹stoikiometric ratio 化学当量比stopper 制动器、塞子storage vessell 贮水箱stppage alarm 停转报警stranded copper cable 铜绞线电缆strength 强度strong backs 支撑stud bolt 柱头螺栓、双头螺栓sub cooling line 欠热管submerged arc welding 埋弧焊substation 配电装置substation island 电气岛superficial corrosion 表面腐蚀superheat 过热度supersaturation 过饱和supervisory instrument 监测装置supply transformer 供电变压器support trunnion 支撑端轴surfactant 表面活性剂surge 喘振suspended diode 中断二极管suspended particles 悬浮颗粒switch board 开关柜switch gear 开关柜sychronization 并网sychroscope 同步指示器、同步示波器T square 丁字尺T/G transformer 发变组tackling system 起吊系统tamped/compacted backfill 夯实回填土tanks and accessories 箱罐和附件taper land thrust bearing 斜面式推力轴承tar epoxy paint 柏油环氧漆tarpaulin 防水布temperature digital display meter 温度数显表tensile test 拉伸试验tension test 拉伸试验,张力试验tensioning rod 拉杆terminal box 接线盒terminal poit 接口termination flange 接口法兰tertiary air 三次风test connection 试验接头test permition 试验合格the expansion coordinate system 热膨胀系统theodilite\transit instrument 经纬仪thermal insulatiion for tuebine casing 汽缸保温thermo resistor 热电阻thermostat 恒温器、恒温调节器thinner 稀释剂threaded flange 螺纹法兰throudh type 直通式、穿入式through bolt 贯穿螺栓、双头螺栓thrust plate 推力板tier tube 间隔管tilting pad 可倾瓦块tilting pad bearing 可倾瓦块轴承tip shroud 围带、环形叶栅外柱面tip speed 叶顶速度toe board/plate (kick plate) 踢脚板top crown plate seal 高冠板式密封装置top girder 顶板top penthouse 顶部雨棚top plan view 俯视图torquemeter 扭矩测量仪totalnumber of welding 焊口总数trajectory 轨道、轨迹transducer board 变送器屏transfer pipe 引出管transition piece 过渡连接件transtion piece 过渡段transverse strength 弯曲强度、抗挠强度transverse stress 横向应力、弯曲应力transverse test 抗弯试验trapezoid corrugated plate seperater 梯形波形板分离器、顶帽travelling crab 小车起重机travelling hoist 移动卷扬机tread width 踏步宽度trestle 组合支架trim and grind the welding 修磨焊点trisector air preheater 三分仓空预器trunk cable pair 主电缆对trunnion air seal assembly 端轴空气密封tube exchanger 管式热交换器tubing stress analysis 管系应力分析turbidity analyser 浊度分析仪turbine lube oil and conditioning system 汽机润滑油及净化系统turning oil 循环油twisted pair conveyer 双绞线传送器undercut 坡口underflow 地流、潜流、下溢union 活接头、管节unit control 单元控制unloadding spout vent fan 卸料口通风风机unloading valve 卸载阀urgent need equipment 急需设备urgtented need equipment 急需设备u-shape hanger chains u形曲链片吊挂装置UT ultrasonic testing 超声波探伤UTS ultimate tensible strength 极限抗拉强度vacuum belt filter 皮带真空吸滤器valve opening chart at load rejection 甩负荷阀门开启阀valve seat body seat 阀座valve spindle 阀轴、阀杆valve stem 阀杆vapor proof 防水灯variable inlet guide vane centrifugal fan 进口可调导叶离心式风机variable moning blade axial flow fan 动叶可调轴流式风机variable moving blade double stage axial fan 动叶可调双级轴流式风机variable speed driver 变速马达variables 变量vent capacity 排放量vent line 放气管ventilator valve 通风阀vernier caliper 游标卡尺vertical deflection 垂直挠度vertical movement 垂直位移vertical spindle coal pulveriser 立式磨煤机vibration isolation 隔振装置viewing lamp 观察指示灯viscosity 粘滞度、内摩擦viscous fluid 粘性液体visual examination of coating 外观质量vlve body 阀体void 无效volatily 挥发分voltage class 电压等级vortex gasket 涡流垫片wall type and retractable soot blower 墙式、伸缩式吹灰器warm air curtain 热风幕rwarming line 加热管water balance 水平衡water induction prevent control 防进水控制water level gauge 水位计water stop flange 止水法兰water supply facility island 水工岛wear hardness 可抗磨能力wear template 防磨板wearing bush 防磨套wearing plate 防磨板、护板weigh feeder 重量计量进料器weld bolt 焊接螺栓weld contamination 焊接杂质weld groove 焊缝坡口weld pass 焊道weld penetration 熔深weld preparation 焊缝坡口加工weld with shop beveled ends 工厂加工坡口焊接welder helment 面罩welding line 焊缝welding plate flange 焊接板式法兰welding rod 焊条welding rods dryer barrel 焊条保温筒welding run 焊道welding seam 对接焊缝welding technological properties 焊接工艺性能welding tool 电焊钳welding torch 焊枪welding wire 焊丝welds counting quantity 焊口统计数量wellington boot 防水长统靴whirl plate 折流板wide column 宽立柱winding resistance 绕组电阻wire feed speed 送丝速度wire netting/metal mesh 铁丝网wire wool 擦洗用的)钢丝绒,百洁丝withstand voltage test 耐压试验working medium 工质worm hole (焊缝)条虫状气孔yield strength 屈服强度yoke 磁轭、人孔压板、座架联板firproof paint 防火漆manifold valve 汇集阀saw trace 锯痕tapping point 取样点bushing current transformer 套管式电流互感器light gauge plate/sheet 薄钢板notch 槽口、凹口holding strip 压板straight edge 校正装置trailing edge 后缘lance 喷枪lighting off 点火gaseous fuel 气体燃料entrain 夹带、传输combustion air 助燃风hot stand by 热备用行波travelling wave模糊神经网络fuzzy-neural network神经网络neural network模糊控制fuzzy control研究方向research direction副教授associate professor电力系统the electrical power system大容量发电机组large capacity generating set输电距离electricity transmission超高压输电线supervltage transmission power line 投运commissioning行波保护Traveling wave protection自适应控制方法adaptive control process动作速度speed of action行波信号travelling wave signal测量信号measurement signal暂态分量transient state component非线性系统nonlinear system高精度high accuracy自学习功能selflearning function抗干扰能力antijamming capability自适应系统adaptive system行波继电器travelling wave relay输电线路故障transmission line malfunction仿真simulation算法algorithm电位electric potential短路故障short trouble子系统subsystem大小相等,方向相反equal and opposite in direction 电压源voltage source故障点trouble spot等效于equivalent暂态行波transient state travelling wave偏移量side-play mount电压electric voltage附加系统add-ons system波形waveform工频power frequency延迟变换delayed transformation延迟时间delay time减法运算subtraction相减运算additive operation求和器summator模糊规则fuzzy rule参数值parameter values可靠动作action message等值波阻抗equivalent value wave impedance附加网络additional network修改的modified反传算法backpropagation algorithm隶属函数membership function模糊规则fuzzy rule模糊推理fuzzy reasoning样本集合sample set给定的given模糊推理矩阵fuzzy reasoning matrix采样周期sampling period三角形隶属度函数Triangle-shape grade of membership function 负荷状态load conditions区内故障troubles inside the sample space门槛值threshold level采样频率sampling frequency全面地all sidedly样本空间sample space误动作malfunction保护特性protection feature仿真数据simulation data灵敏性sensitivity小波变换wavelet transformation神经元neuron谐波电流harmonic current电力系统自动化power system automation继电保护relaying protection中国电力China Power学报journal初探primary exploration标准的机组数据显示(Standard Measurement And Display Data) 负载电流百分比显示Percentage of Current load(%)单相/三相电压Voltage by One/Three Phase (Volt.)每相电流Current by Phase (AMP)千伏安Apparent Power (KVA)中线电流Neutral Current (N Amp)功率因数Power Factor (PF)频率Frequency(HZ)千瓦Active Power (KW)千阀Reactive Power (KVAr)最高/低电压及电流Max/Min. Current and Voltage输出千瓦/兆瓦小时Output kWh/MWh运行转速Running RPM机组运行正常Normal Running超速故障停机Overspeed Shutdowns低油压故障停机Low Oil Pressure Shutdowns高水温故障停机High Coolant Temperature Shutdowns起动失败停机Fail to Start Shutdowns冷却水温度表Coolant Temperature Gauge机油油压表Oil Pressure Gauge电瓶电压表Battery Voltage Meter机组运行小时表Genset Running Hour Meter怠速-快速运行选择键Idle Run – Normal Run Selector Switch运行-停机-摇控启动选择键Local Run-Stop-Remote Starting Selector Switch其它故障显示及输入Other Common Fault Alarm Display and input给水排水设计基本术语一、通用术语给水排水工程的通用术语及其涵义应符合下列规定:1、给水工程water supply engineering 原水的取集和处理以及成品水输配的工程。
Voltage sag immunity factor considering severity and duration
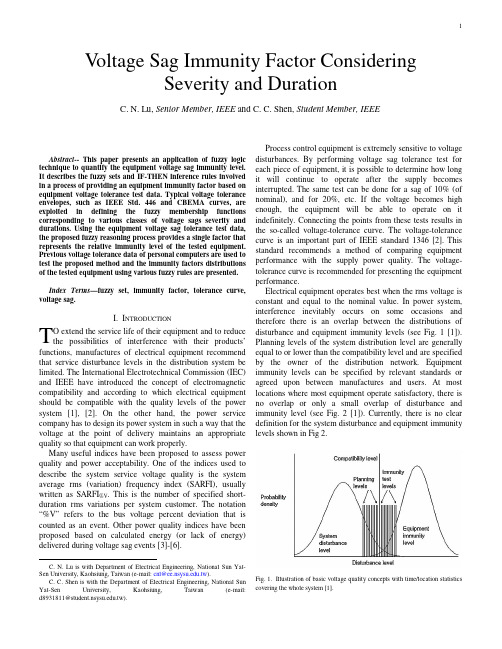
Abstract-- This paper presen ts an application of fuzzy logic technique to quantify the equipment voltage sag immunity level. It describes the fuzzy sets and IF-THEN inference rules involved in a process of providing an equipment immunity factor based on equipmen t voltage toleran ce test data. Typical voltage toleran ce en velopes, such as IEEE Std. 446 an d CBEMA curves, areexploited in defining the fuzzy membership functionscorrespon din g to various classes of voltage sags severity an d duration s. Usin g the equipmen t voltage sag toleran ce test data, the proposed fuzzy reasoning process provides a single factor that represen ts the relative immun ity level of the tested equipmen t. Previous voltage tolerance data of personal computers are used to test the proposed method and the immunity factors distributions of the tested equipment using various fuzzy rules are presented.Index Terms—fuzzy set, immun ity factor, toleran ce curve, voltage sag.I. I NTRODUCTIONO extend the service life of their equipment and to reduce the possibilities of interference with their products’ functions, manufactures of electrical equipment recommend that service disturbance levels in the distribution system be limited. The International Electrotechnical Commission (IEC) and I EEE have introduced the concept of electromagnetic compatibility and according to which electrical equipment should be compatible with the quality levels of the power system [1], [2]. On the other hand, the power service company has to design its power system in such a way that the voltage at the point of delivery maintains an appropriate quality so that equipment can work properly.Many useful indices have been proposed to assess power quality and power acceptability. One of the indices used to describe the system service voltage quality is the system average rms (variation) frequency index (SARFI), usually written as SARFI%V. This is the number of specified short-duration rms variations per system customer. The notation “%V” refers to the bus voltage percent deviation that is counted as an event. Other power quality indices have been proposed based on calculated energy (or lack of energy) delivered during voltage sag events [3]-[6].C. N. Lu is with Department of Electrical Engineering, National Sun Yat-Sen University, Kaohsiung, Taiwan (e-mail: cnl@.tw).C. C. Shen is with the Department of Electrical Engineering, National Sun Yat-Sen University, Kaohsiung, Taiwan (e-mail: d8931811@.tw).Process control equipment is extremely sensitive to voltage disturbances. By performing voltage sag tolerance test for each piece of equipment, it is possible to determine how long it will continue to operate after the supply becomes interrupted. The same test can be done for a sag of 10% (of nominal), and for 20%, etc. I f the voltage becomes high enough, the equipment will be able to operate on it indefinitely. Connecting the points from these tests results in the so-called voltage-tolerance curve. The voltage-tolerance curve is an important part of I EEE standard 1346 [2]. This standard recommends a method of comparing equipment performance with the supply power quality. The voltage-tolerance curve is recommended for presenting the equipment performance.Electrical equipment operates best when the rms voltage is constant and equal to the nominal value. I n power system, interference inevitably occurs on some occasions and therefore there is an overlap between the distributions of disturbance and equipment immunity levels (see Fig. 1 [1]). Planning levels of the system distribution level are generally equal to or lower than the compatibility level and are specified by the owner of the distribution network. Equipment immunity levels can be specified by relevant standards or agreed upon between manufactures and users. At most locations where most equipment operate satisfactory, there is no overlap or only a small overlap of disturbance and immunity level (see Fig. 2 [1]). Currently, there is no clear definition for the system disturbance and equipment immunity levels shown in Fig 2.Fig. 1. Illustration of basic voltage quality concepts with time/location statistics covering the whole system [1].V oltage Sag Immunity Factor ConsideringSeverity and DurationC. N. Lu, Senior Member, IEEE and C. C. Shen, Student Member, IEEETFig. 2. Illustration of basic voltage quality concepts with time statistics relevant to one site within the whole system [1].Fig. 3 shows the well-known Computer Business Equipment Manufacturers Association (CBEMA) curve that was recommended by CBEMA to its members. The curve is a kind of reference for equipment voltage tolerance as well as for severity of voltage sags. The “revised CBEMA curve” adopted by the nformation Technology ndustry Council (ITIC), the successor of CBEMA, is shown as a dashed line in Fig. 3 [3].Fig. 3. Voltage tolerance requirements for computing equipment [3].A standard that currently describes how to obtain voltage tolerance of equipment is I EC 61000-4-11 [7]. I t defines a number of preferred magnitudes and durations of sags for which the equipment has to be tested. The equipment does not need to be tested for all these values, but one or more of the magnitudes and durations may be chosen. The preferred combinations of magnitude and duration are shown in Table 1.TABLE IP REFERRED M AGNITUDES AND D URATIONS FOR E QUIPMENT I MMUNITYT ESTING A CCORDING TO IEC-61000-4-11 [7]Duration in Cycles of 50 HzMagnitude 0.5 1 5 10 25 5070%40%0 %While describing equipment behavior through the voltage-tolerance curve, a number of assumptions are made. The basic assumption is that sag can be uniquely characterized through its magnitude and duration. As we have seen in the previous literature, the definitions of magnitude and duration of a voltage sag currently in use for tolerance tests are far from unique. So far there is no generally accepted standard for quantifying equipment voltage sag immunity level. The two-dimensional voltage-tolerance curve clearly has its limitation. An approach that extends the voltage tolerance curve idea for representing the relative voltage sag immunity level is proposed in this paper.II. Q UANTIFYING E QUIPMENT V OLTAGE S AG I MMUNITY L EVEL Voltage sensitivity varies depending on the manufacture, differences in equipment or applications, years-of-use, and operating conditions, etc. I n this paper, the uncertainty of sensitive load in dealing with voltage sag events is formulated by fuzzy logic theory through membership functions that do not use strict boundaries.I n fuzzy logic reasoning, membership function describes the degree of a certain variable belonging to a fuzzy set. This degree of membership, expressed with a number in the interval of [0,1], is a measure of proximity to that set. A membership value of 1 means that the variable is fully satisfactory for that fuzzy set, whereas a value of 0 means that it is completely unacceptable in that fuzzy set. Any deviation is acceptable with an intermediate degree of satisfaction between 0 and 1. Such feature is suitable for modeling the vagueness associated with the power quality and many engineering problems [8], [9].To simulate the human reasoning process, IF-THEN logic rules are used to combine membership values of fuzzy variables. All the consequences for each defined rule are aggregated to give a final value indicating the closest to the real knowledge being modeled. The following steps are generally used to solve the practical problems [8], [9]:1): Describe of the problem in a linguistic form.2): Define the input and output variables for the fuzzy inference system, whose range and thresholds are based on empirical knowledge.3): Define the number and shape of membership functions for each input and output variables.4): Define the IF-THEN inference rules that represent the system practical behavior being modeled.5): Select the fuzzy operators for the defuzzification process.6): Tuning the fuzzy inference system.In our application, the two input variables are the voltage sag magnitudes expressed in percentage, and duration of the event expressed in logarithm of seconds. The voltage sag immunity factor that represents the relative capability of equipment in dealing with the voltage sag problems is chosen as the output variable of the fuzzy system.In this study, the input variable membership functions arebased on IEC 61000-4-11 and ITIC curves. Fig. 4 and Fig. 5show the fuzzy sets of voltage sag magnitude (severity) and duration using numbers suggested by I EC for voltage sag tolerance tests. Fig. 6 and Fig. 7 are the membership functions defined according to I TI C curve. I n order to have an even distribution of the fuzzy sets for both input variables, a combination of Fig. 4 and Fig. 7 is also tested to determine the immunity factor of the equipment under study, The fuzzy membership function of the output variable, i.e., the voltage sag immunity factor, is shown in Fig. 8.Fig. 4. Sag duration membership function based on IEC data.Fig. 5. Sag magnitude membership function based on IEC data.Fig. 6. Sag duration membership function based on ITIC curve.Fig. 7. Sag magnitude membership function based on ITIC curve.Fig. 8. Membership function of voltage sag immunity factor.To represent the behavior of the studied phenomena, agreed I F-THEN rules based on actual operating knowledge can be used to form the fuzzy inference mechanism. One possible set of rules that can be used in the reasoning process is shown in Table I I. Table I I shows 30 (6x5) rules. For instance, if an equipment can sustain a “ Medium” voltage sag with a “Very Long” duration then its voltage sag immunity level is “Medium”. In this study, all IF-THEN rules have the same weight, and the implication method is implemented by “product”, which scales the output fuzzy set. For each combination of the fuzzy set values corresponding to the crisp input variable data, through the reasoning process, a fuzzy set output is generated from each rule. The outputs are then aggregated. The aggregation method is “sum”, which is simply the sum of each rule’s output set. The defuzzification method is the centroid calculation, which returns the center of area under the curve. After the defuzzification, a voltage sag immunity factor corresponding to the input sag test event is obtained. Refer to [8] for a detail description of the inference operations.TABLE II V OLTAGE S AG I MMUNITY L EVEL IF-THEN R ULESVoltage Sag Duration Voltage SagMagnitude Extremely Short Very Short Short Medium Long Very LongVery Small Low Low Low Low Medium MediumSmall Low Low Low Medium Medium Medium Medium Low Low Medium Medium Medium High Large Low Medium Medium Medium High High Very Large Medium Medium Medium High High HighAs mentioned above, the voltage tolerance curve was recommended in IEEE Std. 1346 for representing the voltage sensitivity of equipment, therefore, it is used in this study to determine the equipment voltage sag immunity factor. Previous test results indicate that different types of equipment have different shape of tolerance curve. Fig. 9 shows three different tolerance curves of equipment. Equipment #3 is intuitively more sensitive than the others. To assess theequipment voltage tolerance capability, the immunity factors of the “start” (A or B) and “knee” (C or D) point(s) calculated by the proposed fuzzy inference operation are averaged. As shown in Fig. 9, each point has a combination of voltage sag severity and duration, and is used as input for fuzzy logic operations. Using the membership functions shown in Fig. 4 and Fig. 5, Fig. 6 and Fig. 7, Fig. 4 and Fig. 7 as separate groups test cases, the immunity factors corresponding to the three equipments shown in Fig. 9 are presented in Table III. From Table I I I, it can be seen that using membership functions shown in Fig. 4 and Fig. 7, it provides better results than the other two choices. It has better differentiation.Fig. 9. Equipment tolerance curvesTABLE IIIV OLTAGE S AG I MMUNITY F ACTORS U SING D IFFERENT M EMBERSHIP F UNCTIOND EFINITIONSImmunity Factors Equipment No. Tolerance Curve “Start” Point “Knee” Point(s) Fig. 4 & 5 Fig. 6 & 7 Fig 4 & 7 1 B- C- F B C 0.7994 0.7783 0.7994 2 A- C- F A C 0.6000 0.7783 0.6000 3 A- C- D- E A C, D 0.6000 0.6531 0.5713III. T EST R ESULTS ON P ERSONAL C OMPUTERSFig. 10 shows voltage tolerance curves of 17 personal computers obtained from Japanese and U.S. studies [3]. Voltage sag immunity factors of these tested PCs can be obtained from the proposed the fuzzy inference system. The distribution of the immunity factors and its accumulated density function are shown in Fig. 11. It can be seen that using the membership functions shown in Figures 4 and 7, and the inference rules shown in Table II, the immunity factors have a distribution similar to a normal distribution.f a normal distribution curve is plotted using the mean (0.617) and the standard deviation (0.138) of the data shown in Fig. 11, then an estimate of the immunity capability of the tested PCs can be obtained and is shown in Fig. 12. This curve can be used to determine the average number of equipment failures due to voltage problems per year if a similar curve representing the power service quality is available.Fig. 10. Voltage tolerance curves of the 17 tested PCs.Fig. 11. The distribution of immunity factors of the tested PCs101010Duration in second (s)M a g n i t u d e i n p e r c e n tFig. 12. Immunity factor distribution estimated for tested PCsDifferent inference rules are also tested, if the rules are changed to those shown in Table I V, then the immunity factors distribution of the PCs becomes to that shown in Fig.13. I t can be seen that the distribution skews to the right. Thus, the distribution of the immunity factors depends strongly on the design of the I F-THEN rules used in the inference system. As long as a set of general rules are agreed, then the proposed method can be used to determine relative voltage sag immunity levels of same products from different manufacturers.TABLE IVD IFFERENT V OLTAGE S AG I MMUNITY L EVEL IF-THEN R ULESVoltage Sag DurationVoltage Sag Magnitude ExtremelyShortVeryShortShort Medium LongVeryLongVery Small Low Low Low Medium Medium Medium Small Low Low Medium Medium Medium High Medium Low MediumMediumMediumHigh High Large MediumMediumMedium High High High VeryLarge Medium Medium High High High High Fig. 13. Immunity factors distribution of the tested PCs based on Table IVIV. C ONCLUSIONI n the past, equipment users had very few help in thedetermination of the appropriate voltage quality of the supply for their equipment, manufacturers’ recommendations were not so well defined and were mostly limited to long duration events. This paper proposes a method of building up a single factor that represents the relative voltage sag immunity level of an equipment. Using the IEC and IEEE recommend voltage sag severity and duration for voltage tolerance tests, the input variables membership functions are defined and several inference rules are tested. Test results have shown that the proposed factor provides a convenient way for comparing voltage sag immunity level of sensitive equipment. If a similar procedure is used to determine the disturbance level of a power service environment, an average number of equipment failures due to voltage sag incidents in a period of time can then be properly assessed.V. R EFERENCES[1] Assessment of emission limit of fluctuating load in MV and HV PowerSystem, IEC 61000-3-7, 1996.[2] IEEE Recommended Practice for Evaluating Electric Power SystemComp atibility with Electronic Process, I EEE Standard 1346-1998, May 1998.[3] Math H. J. Bollen, Understanding Power Quality Problems- Voltage Sagsand Interruptions, IEEE Press, 2000.[4] G. T. Heydt, R. Ayyanar, R. Thallam, “Power Acceptability,” IEEEPower Engineering Review, pp. 12-15, Sept. 2002.[5] R. S. Thallam, and G. T. Heydt, “Power acceptability and voltage sagindices in the three phase sense,” paper presented at the Panel Session on “Power Quality: Voltage Sag I ndices in the Three Phase Sense,” I EEE PES Summer meeting, Seattle, WA, July 2000.[6] R. S. Thallam, “Power quality indices based on voltage sag energyvalues,” Proceedings of Power Quality 2001 Conference and Exposition, Chicago, IL, Sept. 2001.[7] Testing and measurement techniques-Voltage dip s, short interrup tionsand voltage variations immunity tests, IEC 61000-4-11, 2001-03.[8] Tutorial on Fuzzy Logic Ap p lication in Power Systems, EEE PESPublication No, TP140-0. Jan. 2000.[9] B. D. Bonatto, T. Niimura, H. W. Dommel, “A Fuzzy Logic Application toRepresent Load sensitivity to Voltage Sag,” Proceedings of 8th International Conference on Harmonics And Quality of Power, vol. 1, pp.60-64, 1998.VI. B IOGRAPHIESChan-Nan Lu received Ph.D. degree from Purdue University. He was with General Electric Co. Pittsfield, Mass., and Harris Corp. Control Division, Melbourne Fl. His current interests are in power system operations and power quality.Cheng-Chieh Shen received his M.S. degree from the National Sun Yat-sen University. He is now pursuing his Ph.D. degree at the National Sun Yat-sen University.。
灰 狼 优 化 算 法 ( G W O ) 原 理

GWO(灰狼优化)算法以优化SVM算法的参数c和g为例,对GWO算法MATLAB源码进行了逐行中文注解。
————————————————tic % 计时器%% 清空环境变量close allformat compact%% 数据提取% 载入测试数据wine,其中包含的数据为classnumber = 3,wine:178*13的矩阵,wine_labes:178*1的列向量load wine.mat% 选定训练集和测试集% 将第一类的1-30,第二类的60-95,第三类的131-153做为训练集train_wine = [wine(1:30,:);wine(60:95,:);wine(131:153,:)];% 相应的训练集的标签也要分离出来train_wine_labels = [wine_labels(1:30);wine_labels(60:95);wine_labels(131:153)] ;% 将第一类的31-59,第二类的96-130,第三类的154-178做为测试集test_wine = [wine(31:59,:);wine(96:130,:);wine(154:178,:)];% 相应的测试集的标签也要分离出来test_wine_labels = [wine_labels(31:59);wine_labels(96:130);wine_labels(154:178 )];%% 数据预处理% 数据预处理,将训练集和测试集归一化到[0,1]区间[mtrain,ntrain] = size(train_wine);[mtest,ntest] = size(test_wine);dataset = [train_wine;test_wine];% mapminmax为MATLAB自带的归一化函数[dataset_scale,ps] = mapminmax(dataset',0,1);dataset_scale = dataset_scale';train_wine = dataset_scale(1:mtrain,:);test_wine = dataset_scale( (mtrain+1):(mtrain+mtest),: );%% 利用灰狼算法选择最佳的SVM参数c和gSearchAgents_no=10; % 狼群数量,Number of search agents Max_iteration=10; % 最大迭代次数,Maximum numbef of iterationsdim=2; % 此例需要优化两个参数c和g,number of your variableslb=[0.01,0.01]; % 参数取值下界ub=[100,100]; % 参数取值上界% v = 5; % SVM Cross Validation参数,默认为5% initialize alpha, beta, and delta_posAlpha_pos=zeros(1,dim); % 初始化Alpha狼的位置Alpha_score=inf; % 初始化Alpha狼的目标函数值,change this to -inf for maximization problemsBeta_pos=zeros(1,dim); % 初始化Beta狼的位置Beta_score=inf; % 初始化Beta狼的目标函数值,change this to -inf for maximization problemsDelta_pos=zeros(1,dim); % 初始化Delta狼的位置Delta_score=inf; % 初始化Delta狼的目标函数值,change this to -inf for maximization problems%Initialize the positions of search agentsPositions=initialization(SearchAgents_no,dim,ub,lb);Convergence_curve=zeros(1,Max_iteration);l=0; % Loop counter循环计数器% Main loop主循环while lMax_iteration % 对迭代次数循环for i=1:size(Positions,1) % 遍历每个狼% Return back the search agents that go beyond the boundaries of the search space% 若搜索位置超过了搜索空间,需要重新回到搜索空间Flag4ub=Positions(i,:)ub;Flag4lb=Positions(i,:)lb;% 若狼的位置在最大值和最小值之间,则位置不需要调整,若超出最大值,最回到最大值边界;% 若超出最小值,最回答最小值边界Positions(i,:)=(Positions(i,:).*(~(Flag4ub+Flag4lb)))+ub.*F lag4ub+lb.*Flag4lb; % ~表示取反% 计算适应度函数值cmd = [' -c ',num2str(Positions(i,1)),' -g ',num2str(Positions(i,2))];model=svmtrain(train_wine_labels,train_wine,cmd); % SVM 模型训练[~,fitness]=svmpredict(test_wine_labels,test_wine,model); % SVM模型预测及其精度fitness=100-fitness(1); % 以错误率最小化为目标% Update Alpha, Beta, and Deltaif fitnessAlpha_score % 如果目标函数值小于Alpha狼的目标函数值Alpha_score=fitness; % 则将Alpha狼的目标函数值更新为最优目标函数值,Update alphaAlpha_pos=Positions(i,:); % 同时将Alpha狼的位置更新为最优位置if fitnessAlpha_score fitnessBeta_score % 如果目标函数值介于于Alpha狼和Beta狼的目标函数值之间Beta_score=fitness; % 则将Beta狼的目标函数值更新为最优目标函数值,Update betaBeta_pos=Positions(i,:); % 同时更新Beta狼的位置if fitnessAlpha_score fitnessBeta_score fitnessDelta_score % 如果目标函数值介于于Beta狼和Delta狼的目标函数值之间Delta_score=fitness; % 则将Delta狼的目标函数值更新为最优目标函数值,Update deltaDelta_pos=Positions(i,:); % 同时更新Delta狼的位置a=2-l*((2)-Max_iteration); % 对每一次迭代,计算相应的a 值,a decreases linearly fron 2 to 0% Update the Position of search agents including omegas for i=1:size(Positions,1) % 遍历每个狼for j=1:size(Positions,2) % 遍历每个维度% 包围猎物,位置更新r1=rand(); % r1 is a random number in [0,1]r2=rand(); % r2 is a random number in [0,1]A1=2*a*r1-a; % 计算系数A,Equation (3.3)C1=2*r2; % 计算系数C,Equation (3.4)% Alpha狼位置更新D_alpha=abs(C1*Alpha_pos(j)-Positions(i,j)); % Equation (3.5)-part 1X1=Alpha_pos(j)-A1*D_alpha; % Equation (3.6)-part 1r1=rand();r2=rand();A2=2*a*r1-a; % 计算系数A,Equation (3.3)C2=2*r2; % 计算系数C,Equation (3.4)% Beta狼位置更新D_beta=abs(C2*Beta_pos(j)-Positions(i,j)); % Equation (3.5)-part 2X2=Beta_pos(j)-A2*D_beta; % Equation (3.6)-part 2r1=rand();r2=rand();A3=2*a*r1-a; % 计算系数A,Equation (3.3)C3=2*r2; % 计算系数C,Equation (3.4)% Delta狼位置更新D_delta=abs(C3*Delta_pos(j)-Positions(i,j)); % Equation(3.5)-part 3X3=Delta_pos(j)-A3*D_delta; % Equation (3.5)-part 3% 位置更新Positions(i,j)=(X1+X2+X3)-3;% Equation (3.7)Convergence_curve(l)=Alpha_score;bestc=Alpha_pos(1,1);bestg=Alpha_pos(1,2);bestGWOaccuarcy=Alpha_score;%% 打印参数选择结果disp('打印选择结果');str=sprintf('Best Cross Validation Accuracy = %g%%,Best c = %g,Best g = %g',bestGWOaccuarcy*100,bestc,bestg);disp(str)%% 利用最佳的参数进行SVM网络训练cmd_gwosvm = ['-c ',num2str(bestc),' -g ',num2str(bestg)];model_gwosvm = svmtrain(train_wine_labels,train_wine,cmd_gwosvm);%% SVM网络预测[predict_label,accuracy] = svmpredict(test_wine_labels,test_wine,model_gwosvm);% 打印测试集分类准确率total = length(test_wine_labels);right = sum(predict_label == test_wine_labels);disp('打印测试集分类准确率');str = sprintf( 'Accuracy = %g%% (%d-%d)',accuracy(1),right,total);disp(str);%% 结果分析% 测试集的实际分类和预测分类图plot(test_wine_labels,'o');plot(predict_label,'r*');xlabel('测试集样本','FontSize',12);ylabel('类别标签','FontSize',12);legend('实际测试集分类','预测测试集分类');title('测试集的实际分类和预测分类图','FontSize',12);%% 显示程序运行时间% This function initialize the first population of search agentsfunctionPositions=initialization(SearchAgents_no,dim,ub,lb) Boundary_no= size(ub,2); % numnber of boundaries% If the boundaries of all variables are equal and user enter a signle% number for both ub and lbif Boundary_no==1Positions=rand(SearchAgents_no,dim).*(ub-lb)+lb;% If each variable has a different lb and ubif Boundary_no1for i=1:dimub_i=ub(i);lb_i=lb(i);Positions(:,i)=rand(SearchAgents_no,1).*(ub_i-lb_i)+lb_i;代码修改及说明:安装libsvm下载libsvm将下载的libsvm直接放在matlab安装路径toolbox下点击matlab “主页-设置路径” 选择libsvm包中的windows文件夹将libsvm windows文件夹下的 svmtrain 及svmpredict函数修改为 svmtrain2 和 svmpredict2等形式,目的是防止与matlab下冲突(注:2017及以下版本可以使用svmtrain,高版本不再支持)源码修改将所有svmtrain()及svmpredict() 函数改为 svmtrain2()及svmpredict2() ;将代码[~,fitness]=svmpredict(test_wine_labels,test_wine,model); % SVM模型预测及其精度改为[~,~,fitness]=svmpredict(test_wine_labels,test_wine,model); % SVM模型预测及其精度或者[fitness,~,~]=svmpredict(test_wine_labels,test_wine,model); % SVM模型预测及其精度(至于为什么还未清楚?目前我还没有看代码,原理也还没有看,仅改了下代码)将代码[output_test_pre,acc]=svmpredict2(output_test',input_test', model_gwo_svr); % SVM模型预测及其精度改为[output_test_pre,acc,~]=svmpredict2(output_test',input_test ',model_gwo_svr); % SVM模型预测及其精度(同上,仅是为了解决维度的问题)%%%%%%%%%%%%%%%%%%%%%%%%%%%%%%%%%%%%人们总是能从大自然中得到许多启迪,从生物界的各种自然现象或过程中获得各种灵感,由此提出了许多能够解决复杂函数优化的启发式算法,主要分为演化算法和群体智能算法。
- 1、下载文档前请自行甄别文档内容的完整性,平台不提供额外的编辑、内容补充、找答案等附加服务。
- 2、"仅部分预览"的文档,不可在线预览部分如存在完整性等问题,可反馈申请退款(可完整预览的文档不适用该条件!)。
- 3、如文档侵犯您的权益,请联系客服反馈,我们会尽快为您处理(人工客服工作时间:9:00-18:30)。
Generating fuzzy membership function with self-organizing feature map qChih-Chung Yang,N.K.Bose*Department of Electrical Engineering,Spatial and Temporal Signal Processing Center,The Pennsylvania State University,121Electrical Engineering East,University Park,PA 16802,USAReceived 24September 2004;received in revised form 22July 2005Available online 18October 2005Communicated by A.M.AlimiAbstractAutomatic fuzzy membership generation is important in pattern recognition.A new scheme is proposed to generate fuzzy membership functions with unsupervised learning using self-organizing feature map.Simulation results on different datasets support this new scheme.Ó2005Elsevier B.V.All rights reserved.PACS:07.05.MhKeywords:Fuzzy membership function;Pattern recognition;Self-organizing feature map;Computational intelligence1.IntroductionThe problem of fuzzy membership function generation is of fundamental importance (Medasani et al.,1998).For applications applying fuzzy set theory,one crucial part is the proper design of fuzzy membership function.For a discursive documentation,see (Cox,1999).Many methods could be adapted to generate membership from data.These include the histogram method,transformation of prob-ability distributions to possibility distributions,based on Zadeh Õs possibility theory (Zadeh,1978),and methods based on clustering.Procedures based on clustering followed by generation of grades of membership include (Chi et al.,1995;Horikawa,1997)using parameters (mean,variance,etc.)determined from the clusters,and fuzzy c-means (FCM)(Bezdek,1981)algorithm capable of gener-ating fuzzy membership function during the clustering process.Feedforward neural network (FFNN)(Bose and Liang,1996)can also be utilized to generate membership func-tions (Takagi and Hayashi,1991;Jang and Sun,1993)from training data with labelling.The number of neurons used in the input and output layers are the dimension of input features and the number of class labels,respectively.The desired target vector associated with the n th input feature vector is represented by a unit vector [0ÁÁÁ010ÁÁÁ0],where 1occurs in the c th position for encoding the labelling information of class c .After the training procedure con-verges with a supervised training algorithm in the learning phase,the FFNN serves as a membership generation net-work in the retrieving phase.Nonrecurrent and recurrent neural network structures in conjunction with a fuzzy neural network training proce-dure has been used recently to classify patterns in feature space with improved capability for discriminating between patterns close to the boundaries resulting from the parti-tioning of the feature space (Stadter and Bose,2000).The topology of the SOFM also has feedforward and feedbackqThis research was partially supported by Army Research Office Grant DAAD 19-03-1-0261.*Corresponding author.Tel.:+18148653912;fax:+18148657065.E-mail address:nkb@ (N.K.Bose)./locate/patreccomponents which is exploited here to generate graded fuzzy membership during clustering process as a one-step procedure.The self-organizing feature map(SOFM)(Bose and Liang,1996;Kohonen,1990),which applies unsuper-vised learning,is often considered to be a clustering tech-nique.However,it is also possible to extract the fuzzy membership function directly during the training and retrieving phases of SOFM.The proposed method achieves a similar objective in a one-step procedure that combines clustering with grade of membership generation.In Section 2,the proposed technique(PT)utilizing SOFM to elicit fuzzy membership function from data with labelling infor-mation is described.In Section3,the technique is applied on an artificial dataset,and the well-known iris dataset. Comparison is made between the PT,a simple frequency transformation technique(referred to here as SFTT),the histogram based technique,and those using FCM and feedforward neural network.In Section4,some insightful discussion on the proposed technique is provided.2.New fuzzy membership function generation technique through SOFM2.1.Self-organizing feature map(SOFM)The SOFM is,usually,a two-layered network where the neurons in the output layer are organized into either a one-or two-dimensional lattice structure(Bose and Liang, 1996).The number of neurons in the input layer is the dimension d of input feature vector x n¼½x n1x n2ÁÁÁx ndT. The synaptic weight vector at neuron j in the output layer is denoted by w j=[w j1w j2ÁÁÁw jd]T,j=1,2,...,J,where J is the total number of neurons in the output layer and w jk,k=1,2,...,d,is the connecting weight from the j th neuron in the output layer to the k th neuron in the input layer.In the learning phase,thefirst step,with x n as the input vector,is tofind the best matching neuron fromqðx nÞ¼min8jk x nÀw j k;ð1Þwhere,for input vector x n,q(x n)is the index label of the winning neuron q2{1,...,J},in the output layer and kÆk is a distance measure(usually the Euclidean norm).The next step is to update the weight vectors associated with the label q(x n).The learning rule for neuron j2N q,where N q is the chosen neighborhood of winning neuron q for input vector x n,is given byw j½tþ1 ¼w j½t þg qj½t ðx n½t Àw j½t Þ;ð2Þwheregqj½t ¼l½t if j2N q;0if j2N q.ð3ÞHere,l[t]is the learning rate,0<l[t]<1,at time index t.In the retrieving phase,when x n is the input vector,only the winning neuron,after convergence,will have positive response.Two different information could be retrieved from the winning neuron q,namely its index label q(x n) and its associated weight vector w q.C.-C.Yang,N.K.Bose/Pattern Recognition Letters27(2006)356–3653572.2.Utilizing SOFM to elicit membership functionfrom labelled dataThe generation of fuzzy membership function via SOFM has,so far been a two-step procedure(Horikawa, 1997).Thefirst step generates the proper clusters.Then, the fuzzy membership function is generated according to the clusters in thefirst step.However,it is possible to inte-grate the two-step procedure and generate the fuzzy mem-bership function directly during the learning phase.The proposed technique is illustrated in Fig.1.The main idea is to augment the input feature vector with the class label-ling information.Similar notion can be found in(Koho-nen,1990;Mitra and Pal,1994).In(Kohonen,1990),the variables associated are semantic with the objective to clus-ter and visualize the data distribution.In(Mitra and Pal, 1994),the focus was on how SOFM could be used to han-dle fuzzy information.Therefore,the information being associated are all fuzzy variables.A key step in the proposed technique is to combine theinput feature vector x n¼½x n1x n2ÁÁÁx ndT with the vectory n ¼½y n1yn2ÁÁÁy ncT coding the class labelling informa-tion.The dimensions of x n and y n are respectively,the number of input features d and the number of class labels c.That is,a new vector z n of dimension c+d is constructed according toz n¼½x n y n T¼½x n0 Tþ½0y n T.ð4ÞIn the learning phase,the newly constructed z n will be the input feature vector to SOFM.The weight updating is according to Eqs.(1)–(3)with,in this case,the weight vector w j=[w j1ÁÁÁw jd w j(d+1)ÁÁÁw j(d+c)]T=[w j d;w j c], j=1,...,J.After the learning phase,the SOFM can be considered as a membership generation network just like its counterpart,the feedforward multilayer neural network trained with a supervised learning algorithm(Takagi and Hayashi,1991).However,in the retrieving phase,it is not as straightforward as in the case of the feedforward multi-layer neural network and some modification,described next,is required.In the retrieving phase,the input feature vector is only x n.Therefore,the input feature vector willfind the best matching neuron q by considering only the weight sub-vector w j d=[w j1ÁÁÁw jd]T related to input features,that is, qðx nÞ¼min8jk x nÀw j d k.ð5ÞAfterfinding the winning neuron q,the output of SOFM is the weight subvector w q c=[w q(d+1)ÁÁÁw q(d+c)]T,associated with the labelling information.Also,it is the fuzzy mem-bership generated by SOFM.In order to better understand the proposed technique,an example is provided as follows. Example.Suppose fuzzy membership functions for fuzzy variablesÔtallÕandÔshortÕin heights among a group of people are to be generated.The dataset could be collected labelling information may be represented by2-D unit vectors[10]T and[01]T for fuzzy variableÔtallÕandÔshortÕ, respectively.In the training phase of SOFM,the input feature height was augmented with the labelling informa-tion to form a3-D vector,which would be the input training sample for the SOFM.Suppose there arefive neurons in the output layer as in Fig.2and the associated weights after training process are listed in Table1.The fuzzy membership functions for the fuzzy variables tall and short are illustrated in Fig.3.Table1Weights of SOFM after training processNeuronindexAssociatedweightFeatureheightFuzzy variableTall Short1[501]T5012[5.60.30.7]T 5.60.20.83[60.60.4]T60.60.44[6.40.80.2]T 6.40.80.25[710]T710358 C.-C.Yang,N.K.Bose/Pattern Recognition Letters27(2006)356–3653.Experimental results on different datasetsIn this section,the proposed technique is applied to two different datasets:an artificial dataset and the well-known iris dataset(Fisher,1936).There are many ways to obtain the iris dataset.For example,it could be downloaded from an anonymous FTP site‘‘’’under the direc-tory‘‘pub/machine-learning-databases’’.parison of PT with SFTTTwo computer-generated datasets are designed to exem-plify some basic properties of the fuzzy membership func-tion elicited by the proposed technique.Thefirst dataset contains two classes A and B,which have the one-dimen-sional(1-D)Gaussian distribution with same variance r2=9and different mean values l A=À10,and l B=10, respectively.One hundred samples are randomly generated for each class and the range[À20,20]is considered.The histogram is illustrated in Fig.4(a).The dotted and solid lines show plots for the probability functions of Gaussian distributions for classes A and B,respectively.Two tech-niques applying SOFM are compared here as a starting point.Thefirst technique,which could be called the simple fre-quency transformation technique(SFTT),combines the notions of histogram and transformation of probability distributions to possibility distributions(Medasani et al., 1998).The1-D SOFM with10neurons in the output layer is trained with2001-D feature vectors(without labelling information).After the SOFM converges,the positive re-sponses for all output neurons are recorded according to the class labels for all training vectors.The relative fre-quencies for the two classes are calculated for all10neu-rons.For example,suppose there were20input samples to output neuron4.Among these20input samples,16were in class A and the rest4were in class B.The relative frequencies for classes A and B were16/20=0.8and4/ 20=0.2,respectively.The relative frequencies are plotted according to the weights w j associated with the10neurons of output layer,as in Fig.4(b).The resulting fuzzy mem-bership functions for classes A and B are plotted as dotted and solid lines,respectively,by connecting and·.For the proposed technique(PT),the class label vectors [10]T and[01]T for classes A and B,respectively,arefirst augmented with the associated1-D input feature vectors. Then,the SOFM with the same topology(10neurons in the output layer)is trained with the newly constructed 3-D input vectors(1-D input feature plus2-D class infor-mation vector)until the SOFM converges.The weights associated with class information A and B provide the grade of membership which is plotted against the weights associated with1-D input feature vector,as in Fig.4(c). As before,the resulting fuzzy membership functions for classes A and B are plotted as dotted and solid lines, respectively,by connecting and·.In real applications,the number of data samples for different classes may not be the same.Therefore,it isC.-C.Yang,N.K.Bose/Pattern Recognition Letters27(2006)356–365359reasonable to unbalance the training samples to observe the effects on the shape of fuzzy membership function. First,the number of training samples for class A was reduced to50and the histogram was shown in Fig.4(d). As Fig.4(a),the dotted and solid line indicates the Gauss-ian probability functions that generated the data samples for classes A and B,respectively.The membership func-tions generated by the two techniques using SOFM are shown in Fig.4(e)for SFTT and(f)for PT.For the SFTT, the cross-over point is slightly shifted to the right in com-parison with Fig.4(b).For the PT,there are no apparent changes.In an extreme case,the number of training samples for class A is further reduced to10,as the histogram illustrated in Fig.4(g).Again,the membership functions generated by the two techniques using SOFM are shown in Fig.4(h)and (i).For the SFTT,oneÔdeadÕneuron(has no response to any training data sample)emerged in the transition region between the two classes A and B.Therefore,no relative fre-quencies could be calculated.Therefore,no membership value was assigned to that neuron and the associated re-gion is connected by a dash–dot line to indicated possible interpolated fuzzy values in that region.For the PT,the cross-over point slightly moves to the left and the situation ofÕdeadÕneuron was avoided because there was no transformation of probability distributions to possibility distributions.The second dataset again contains two classes A and B. However,the probability model for the random generation of data samples is uniform distribution.The data ranges for classes A and B are[À20,0]and[0,20]with mean values at l A=À10,and l B=10,respectively.Similar to the pre-vious three experimental setups for the Gaussian dataset, the number of training samples coming from class A were 100,50,and10.For class B,all the100samples are used for training SOFM.The histograms of the training sets, which were consistent with the uniform distribution model (plotted in dotted and solid lines for classes A and B,res-pectively),were as shown in Fig.5(a),(d),and(g).Again,the fuzzy membership functions generated with the SFTT are shown in Fig.5(b),(e),and(h),accordingly. The results generated by the PT are shown in Fig.5(c),(f), and(i).By applying the PT,the shape of fuzzy membership is robust to unbalanced training datasets as well as different model assumption of data distribution(by comparing Figs. 4and5).parison of PT with histogram,FCM and FFNNIn order to better exemplify the superiority of the pro-posed technique,three different fuzzy membership function eliciting methods were visually compared based on the same artificial datasets.The methods being compared were the histogram,the fuzzy c-means(FCM),and the feedfor-ward neural network(FFNN).For the histogram method, the number of training samples in each bin was counted first according to the labelling information.Then,the his-togram was normalized by dividing the maximum number360 C.-C.Yang,N.K.Bose/Pattern Recognition Letters27(2006)356–365among all bins.Therefore,the maximum fuzzy member-ship value would equal to1.The resulting fuzzy member-ship functions were plotted in thefirst column(subplots (a),(d),and(g))in Figs.6and7for Gaussian and uniform distributions,respectively.It is obvious that the shapes of the output fuzzy membership function were highly affected by the distribution and the number of training samples. This method might not be suitable for application with small data samples.FCM(Bezdek,1981)is a clustering method which em-beds the generation of fuzzy membership function while clustering.The algorithm is based on minimization of the objective function:J m¼X Ni¼1X Cj¼1u mijk x iÀc j k2;m>1;where m is any real number greater than1,u ij is the degree of fuzzy membership of data sample x i in cluster j,c j is the center of the j th cluster,and k k is any norm expressing the similarity between any data sample and the center.An iter-ative optimization of the objective function is carried out through the update of membership u ij,u ij¼1P Ck¼1k x iÀc j kk x iÀc k k2mÀ1;ð6Þand the cluster centers c j,c j¼P Ni¼1u mijx iP Ni¼1u mij.ð7ÞThis iteration will stop when certain termination criterionis met.That is,max ij fj uðkþ1ÞijÀuðkÞij jg<e,where e satisfies0<e<1and the superscript k denotes iteration number.In the simulation of FCM on artificial dataset,the param-eters were set to be m=2and e=10À5.The labelling infor-mation was used for initialization of the FCM algorithm.The resulting fuzzy membership functions were plotted inthe second column(subplots(b),(e),and(h))in Figs.6and7for Gaussian and uniform distribution,respectively.It is observed that the imbalanced data samples caused dis-tortion in shape both for the Gaussian and uniform distri-bution cases(Figs.6(h)and7(h)).The last method being evaluated was the FFNN method.The model being used had eight neurons in the hidden layerand two neurons in the output layer.The target vectorsfor classes A and B were[10]T and[01]T,respectively.The outputs of the fuzzy membership generation networkare respectively shown in the third column(subplots(c),(f),and(i))in Figs.6and7for Gaussian and uniform dis-tributions.It could be noticed that this method is betteragainst the imbalance in training samples.However,the dis-tribution of the training samples would influence the shapesof fuzzy membership functions by comparing Figs.6and7.C.-C.Yang,N.K.Bose/Pattern Recognition Letters27(2006)356–3653613.3.Further comparison of PT with FCMExtended from previous simple cases,more complicated datasets with different degrees of overlapping on class boundaries are examined in this section.In Figs.8and9, three different overlap conditions based on,respectively, Gaussian and uniform distributions are shown.Again, there are two classes A and B,each of which has100 samples.Class A histogram is inverted for demonstration purpose.The proposed method and FCM method are com-pared.The variance of each class is9in Fig.8and the mean values are{À6,6},{À3,3},and{À1.5,1.5},as shown in subplots(a),(d),and(g),respectively.The results apply-ing our proposed method for the three different cases are shown in subplots(b),(e),and(h),respectively.The results applying FCM for three different cases are shown in subplots(c),(f),and(i),respectively.The advantages of our proposed method are obvious. The more typical patterns(at extreme ends)have the high-est fuzzy grade of membership assignment.At the transi-tion region,depending on the relative frequency of both classes around neuron position,a proper membership value is assigned.In Fig.9,the data span for classes A and B are {[À17.5,2.5],[À2.5,17.5]},{[À15,5],[À5,15]},and {[À12.5,7.5],[À7.5,12.5]},as shown in subplots(a),(d), and(g),respectively.The respective results applying our tively.An interesting phenomenon in this example is the flat membership value assignment in the transition region, as shown in the center parts of subplots(e)and(h).It is proper to assign equal membership value in the overlapped region,as is done by applying our proposed method,be-cause the equal uniform distribution of the datasets have the same possibility in the overlapped center region.The model-based FCM method failed to assign proper fuzzy membership value due to its Gaussian model assumption.3.4.Iris datasetIn the iris dataset,there were three different classes:iris Setosa,iris Versicolour,and iris Virginica.There were four measured features:sepal length,sepal width,petal length, and petal width(unit:cm).The iris dataset demonstrates that the proposed technique can be applied to multidimen-sional input features with multiple labelling information. The output layer of the SOFM used for this experiment has a3·3square grid topology for simplicity.For demon-stration purpose,the four input features were grouped into two2-D vectors x sepal and x petal,which contain the length and width of the sepal and the petal,respectively.The target vectors y n were designed to be unit vectors[100]T, [010]T and[001]T for iris Setosa,iris Versicolour,and iris Virginica,respectively.Therefore,the input vectors z n used for training SOFM were5-D vectors.The results after362 C.-C.Yang,N.K.Bose/Pattern Recognition Letters27(2006)356–365C.-C.Yang,N.K.Bose/Pattern Recognition Letters27(2006)356–365363364 C.-C.Yang,N.K.Bose/Pattern Recognition Letters27(2006)356–365of paring the subplots(d)with the other three fuzzy membership functions in subplots(a), (b),and(c),it could be observed that the estimation of fuz-zy membership function was consistent with the distribu-tion of patterns in feature space.4.Discussion and conclusionThe proposed technique and experimental results offer a neural network view(NN view)on the meaning of fuzzy membership.Since fuzzy set theory and neural networks originate from the same model—human brain,a trend to-ward combining of the techniques from these twofields is natural(Stadter and Bose,2000;Jang et al.,1997).Unlike the supervised NN technique,a minor drawback is the discrete output due to the limited number of neurons J in the output layer of SOFM.However,this could be overcome by incorporating proper interpolation methods. The proposed technique(or,broadly speaking,the neural network driven techniques)is also suitable for generating multidimensional fuzzy variables.The advantage lies on the reduction of number of rules in the rule-based system (Takagi and Hayashi,1991).Furthermore,the visualiza-tion capability(see the plots of the grades of membership versus neuron location in Figs.10and11)of SOFM on high dimensional data is a valuable characteristic in any fast prototype design procedure.Another important feature is the robustness of this pro-posed technique.In other automatic fuzzy membership function elicitation methods,the frequency of occurrence, the imbalance of dataset,or the different distribution model assumption will have impacts on the shape of membership function.From the simulation experiments reported here,it can be observed that the proposed tech-nique is robust.It also agrees with thefinding of(Hersh et al.,1979)that frequency of occurrence of the elements does not affect the location and form of the membership function.Our results also suggest that the membership function is not only a function of the object from the uni-verse of discourse but the discourse as well(Hersh et al., 1979).Summarizing,a fuzzy membership generation tech-nique has been proposed which fully uncovers the capabil-ity of SOFM in eliciting fuzzy membership directly from data with labelling information.In the future,this new idea of fuzzy clustering is expected to be used on diverse data-sets by different researchers.AcknowledgementThe authors thank the three reviewers and the editor for their constructive suggestions,which have been incorpo-rated in the several revisions of the original submission.ReferencesBezdek,J.C.,1981.Pattern Recognition with Fuzzy Objective Function Algorithms.Plenum Press,New York.Bose,N.K.,Liang,P.,1996.Neural Networks Fundamentals with Graphs,Algorithms,and Application,first ed.Prentice-Hall,Inc., New York,NY.Chi,Z.,Wu,J.,Yanm,H.,1995.Handwritten numeral recognition using self-organizing maps and fuzzy rules.Pattern Recognition28(1),59–66.Cox,E.,1999.The Fuzzy Systems Handbook:A PractitionerÕs Guide to Building,Using,and Maintaining Fuzzy Systems,second ed.AP Professional,San Diego.Fisher,R.A.,1936.The use of multiple measurements in taxonomic problems.Ann.Eugenics7,179–188.Hersh,H.,Carmazza,A.,Brownell,H.H.,1979.Effects of context on fuzzy membership functions.In:Gupta,M.M.,Ragade,R.M.,Yager, R.R.(Eds.),Advances in Fuzzy Set Theory.North-Holland,Amster-dam,pp.389–408.Horikawa,S.1997.Fuzzy classification system using self-organizing feature map.Oki Tech.Rev.63(159),[Online].Available from: </en/otr/html/nf/otr-159-05.html>.Jang,J.-S.R.,Sun,C.-T.,1993.Functional equivalence between radial basis functions and fuzzy inference systems.IEEE Trans.Neural Networks4(1),156–159.Jang,J.R.,Sun, C.T.,Mizutani, E.,1997.Neuro-Fuzzy and Soft Computing.Prentice-Hall,Inc.,Upper Saddle River,NJ. Kohonen,T.,1990.The self-organizing map.Proc.IEEE78(9),1464–1480.Medasani,S.,Kim,J.,Krishnapuram,R.,1998.An overview of membership function generation techniques for pattern recognition.Internat.J.Approx.Reason.19,391–417.Mitra,S.,Pal,S.K.,1994.Self-organizing neural network as a fuzzy classifier.IEEE Trans.Systems Man Cybernet.24(3),385–399. Stadter,P.A.,Bose,N.K.,2000.Neuro-fuzzy computing:Structure, performance measure and applications.In:Pal,S.K.,Ghosh, A., Kundu,M.K.(Eds.),Soft Computing for Image Processing.Physica-Verlag,Heidelberg,pp.337–374.Takagi,H.,Hayashi,I.,1991.NN-driven fuzzy reasoning.Internat.J.Approx.Reason.5,191–212.Zadeh,L.A.,1978.Fuzzy sets as a basis for a theory of possibility.Fuzzy Sets System1,3–28.C.-C.Yang,N.K.Bose/Pattern Recognition Letters27(2006)356–365365。