度300MHz超导核磁共振谱仪上机操.ppt
Varian 300 MHz 核磁共振波谱仪培训指南说明书
PINMRFVarian 300 MHz NMR SpectrometersTraining Guide for Basic 1D NMR SpectroscopyINCLUDING:Inova-300-1 w/ 5mm 4-Nucleus Plus probe – 365 WTHRInova-300-2 w/ 5mm Autoswitchable probe – 369 WTHRTable of Contents1. Basic Spectrometer Operation (1)2. Supplementary Instructions (7)3. Parameter File and Macro Listings (9)4. VNMR Commonly Used Keyboard Commands (10)5. Checkout Requirements (11)11-03-2015: Revision – JDH.11-27-2007: Revision - JSH.11-20-2006: Revision - JSH.Basic Spectrometer Operation Guidelines – 1D SpectraVarian 300 MHz NMR SpectrometersPINMRFPlease note the following generalities•Under no circumstances lean against or otherwise move the magnet.•The Varian VNMR software enables the user to easily access and change functions, options, and their properties. If you are not sure about an option, button or command contact PINMRF staff for assistance.•If you encounter problems at any time during locking, shimming, acquiring you should halt the experiment and reload the standard parameters for your experiment.•In order for shimming to work well, samples should be filtered and prepared in good-quality tubes. Sample volume should be at least 0.7 mL. Do not use more than 0.1% TMS.•The VNMR software works best with the Common Desktop Environment (CDE) graphics on the Sun computer. Please check when you log in that you are using CDE.Conventions in this guide•Buttons are depicted with small caps in bold, e.g. A BORT A CQ.•Commands entered in the command window are described in geneva font, e.g. h1cdcl , and are executed by hitting the return key.Important basic functions•A BORT A CQ button -> aborts acquisition (BEWARE this discards data!)•R ESIZE button -> enlarges/reduces spectrum window•F LIP button -> flips the spectrum window over the display window and vice versa •jexpx command -> switches to experiment number x (1, 2, 3, 4, etc.)•ds command -> switches back to interactive display modeLogging on to the Sun computer and starting VNMR1. In order to log in enter your login ID, followed by the password into the welcome screens.2. Click the spectrum icon on the left side of the toolbar to start the VNMR software.Sample change3. e(ejects existing sample)4. Remove sample from spinner and replace it with your cleaned sample (use Kimwipe and Isopropanol).5. i(inserts new sample)Acquisition of 1H-NMR Spectra6. jexp1(join experiment 1)7. h1xxxx(macro loads solvent-dependent parameters; xxxx = cdcl, acet, d2o, dmso, meth; for benzene use xxxx = cdcl) then WAIT for the BEEP!8. acqi(opens acquisition window)9. click L OCK to open lock sub-window, then set and/or check the following:•turn on sample spinning (if not on already) by setting the spin value to 20 (Hz.)•the sample should be locked - lock should be established automatically•decrease lock power until lock level is stable (not bouncy; 24 for cdcl3)•Change lock gain in steps of 4 units until lock level is between 30 - 60%•if sample is not locked, increase lock power by 16, wait for lock to be established, then decrease lock power in steps of 4 units until lock level is stable•do not change the Z0 and lock phase values10. click S HIM to open shim sub-window11. adjust Z1C and Z2C (if the lock level increases beyond 100, decrease the lock gain at the bottom of the current window)12. click C LOSE13. nt=xx(sets number of scans; default is nt=8)14. ga(starts acquisition) – then WAIT for the BEEP! (spectrum should be displayed)15. aph(automatic phasing)for manual phasing:•click P HASE•click and hold on peak farthest to the right•while holding the click, drag to correct the phasing for this peak (NOTE: right mouse button allows for fine phase control)•then click and hold on peak farthest to the left, and drag until correctly phased•interactively repeat phasing these two peaks until phasing is completed•ds (switches back to interactive display mode)16. vsadj(vertical scale adjustment - highest peak automatically adjusted to top of window)for manual vertical scale adjustment:•use the center mouse button, a left mouse click above the baseline causes the spectrum to scale up and a left click below the baseline causes the spectrum to scaledown, the distance of the cursor from the baseline while clicking determines themultiplication factoralternative vertical scale adjustment:•vs=xxx, the current value of the vertical scale (vs) is displayed in the lower portion of the spectrum window17. C URSOR,B OX,E XPAND,F ULL:•left-click and drag red left cursor to desired left cutoff position (cr position is shown at bottom of spectrum window)•click B OX•right-click and drag red right cursor to desired right-hand cutoff position (delta = difference in ppm)•click E XPAND (expands spectrum to cursor box limits)•click F ULL (returns spectrum to full size)18. integration:•NOTE: the button for integration consists of three sequential choices: P ART(ial)I NTEGRAL, F ULL I NTEGRAL, N O I NTEGRAL; the button shows the next mode thatcan be accessed, not the current integration mode•click P ART I NTEGRAL(green integral trace appears; see also ‘Adjustment of Integral Trace’ at the end of this document)•cz(clears currently defined integral)•click R ESETS•click the left mouse button closely to the left of the left-most peak•click the left mouse button closely to the right of the left-most peak•repeat for each peak or group of peaks across the spectrum (clicking the right mouse button at any time anywhere in the spectrum window causes an undo of the lastintegral section)•click F ULL I NTEGRAL,N O I NTEGRAL,P ART I NTEGRAL•click inside a known integral region to leave the cursor inside the region•click S ET I NT•enter desired whole integral for the selected region (the display window generates a list of integrals)•click N O I NTEGRAL19. set peak picking threshold:•click T H to display the yellow threshold line•click and drag the yellow line to the desired threshold•click T H20. view chemical shift labels and scale:•dpf displays the peak labels•dscale displays a scale beneath the spectrum•ds clears the labels and scale to redisplay the spectrum alone21. text('xxxxx') (enters a title to be printed on top of your spectrum)22. print, printp, printi or printpi (i = with integration, p = with peak labels)Proceed with additional samples from step 3, continue to step 23 for 13C spectrum, or to step 39 ‘Finishing up Acquisition of Spectra’Acquisition of 13C-NMR Spectra (note: 1H spectrum must be acquired first)23. jexp2 (join experiment 2)24. c13xxxx (macro loads solvent-dependent parameters; xxxx = cdcl, acet, d2o, dmso, meth; for benzene use xxxx = cdcl). WAIT for the BEEP!25. nt=xx (sets number of scans; default is 256)26. ga (starts acquisition) - then WAIT for the BEEP! (spectrum should be displayed)27. wft (check progress before the beep) sa (stops acquisition and retains data)28. aph (automatic phasing, the software does a good job if the signal-to-noise ratio is good)for manual phasing see step 1529. vsadj (vertical scale adjustment - highest peak automatically adjusted to top of window)for other vertical scale adjustment methods see step 1630. C URSOR,B OX,E XPAND,F ULL: (same as step 17)31. set peak picking threshold: (T H same as step 19)32. view chemical shift labels and scale: (dpf, dscale,ds, same as step 20)33. text('xxxxx') (enters a title to be printed on top of your spectrum)34. print or printp (p = with peak picking)Proceed with additional samples from step 3, continue to step 35 for 19F or 31P spectrum, or to step 39 ‘Finishing up Acquisition of Spectra’Acquisition of 19F and 31P NMR Spectra (note: 1H-NMR must be acquired first)35. jexp4(join experiment 4)36. f19cdcl or p31cdcl(loads solvent-dependent parameters)37. nt=xx(sets number of scans)38. ga(starts acquisition) - then WAIT for the BEEP! (spectrum should be displayed) Phasing and other processing procedures are exactly as for 1H spectra; see steps 15 – 21, above.Finishing up Acquisition of Spectra and Logging Out39. e (eject sample)40. remove your sample and insert standard sample (clean with Kimwipe and Isopropanol)41. i42. jexp1 (go back to experiment 1)43. standard - then WAIT for the BEEP!44. exit – then WAIT for all 4 VNMR windows to close.45. Log out from the Sun computer by clicking the E XIT button in the toolbar at the bottom of desktop.Supplementary InstructionsMiscellaneous Functions•to change the chemical shift reference, place the cursor on the peak of known shift, then enter rl(x.xx*sfrq). x.xx is the chemical shift value to be entered (e.g. 7.26) •to observe a spectrum during acquisition enter wft and process the spectrum as described above•if the number of scans was not satisfactory repeat wft after additional scans•if the spectrum is satisfactory type sa (stop acquisition) and process the spectrum•axis='h' changes the axis unit to Hertz; axis='p' changes it to ppm•if you would like to restart phasing with its initial values type lp=0 rp=0 ds, then repeat the phasing procedureStoring and Retrieving NMR Data and Shim sets•to save NMR data from the current experiment, enter: svf(‘filename’)(filenames can include letters, numbers, dash and underscore characters ONLY)•to retrieve stored NMR data into the current experiment, enter: rt(‘filename’)•to save and retrieve shims files use: svs(‘filename’) and rts(‘filename’) (after retrieving shims you must enter su to load the shim values into hardware)Adjustment of the integral traceThe L VL/T LT button activates interactive zero and first-order baseline correction mode. The zero order correction is represented by the L VL parameter; the first order correction is represented by the T LT parameter.Position the cursor on an integral region of interest, about halfway vertically up the screen, and click the left mouse button. A horizontal line will intersect at the cursor and two vertical lines will be placed on either side of the cursor. Now moving the cursor above or below the horizontal line, but within the two vertical lines, and clicking the left or right mouse button will adjust the zero-order baseline correction parameter L VL. Placing the cursor right on the horizontal line and clicking the mouse button will restore the initial value of L VL.Now move the cursor to another region of the spectrum, outside the vertical lines, and click the left mouse button again. A new horizontal line and two vertical lines will be displayed again and a single vertical line will be displayed in the middle of the region where L VL was being updated. The mouse will now control the first-order baseline correction parameter T LT. Clicking the left or right mouse button above or below the horizontal line will now increase or decrease T LT., and will also change L VL so that the total drift correction at the single vertical cursor in the middle of the previous region will be held constant. This process substantially reduces the necessity to iteratively adjust the two parameters L VL and T LT. As with the zero-order correction, clicking onto the horizontal baseline will restore the initial value of T LT.Each time the cursor is moved outside the two vertical lines and the mouse button is clicked, a new vertical and horizontal line is displayed. The parameter adjustment alternates between adjusting L VL and adjusting L VL and T LT. The left and the right mouse button both adjust the baseline correction parameters and differ only in their sensitivity; changes with the left mouse button are eight times larger than changes caused with the right mouse button.The middle mouse button adjusts the integral scale (height of integral trace). To exit the interactive baseline correction mode, type ds .Using the sample temperature controller for Variable Temperature NMRIf you need to carry out VT experiments, please consult with PINMRF staff for further training. VT operation requires extended instrument time for the probe to return to room temperature prior to the next user starting his or her experiment. The upper limit for sample temperature control is 80˚ Celcius, or 10˚C below the boiling point of your solvent, whichever is lower.Varian 300 MHz NMR SpectrometersParameter Files and MacrosBoth Inova300-1 and Inova300-2h1acet h1cdcl h1d2o h1dmso h1methf19cdclhomodecjsh (sets up a homonuclear decoupling experiment from the current 1H experiment) noediffjsh (sets up an NOE difference experiment from the current 1H experiment) presatjsh (sets up a presaturation experiment from the current 1H experiment)Inova300-1 onlyb11cdclh2cdcl (requires training and recabling)Inova 300-2 onlyc13acet c13cdcl c13d2o c13dmso c13methp31cdcl (requires training on retuning the probe)deptjsh (sets up DEPT-135 experiment from the current 13C experiment)cosyjsh (sets up a 2D-COSY experiment from the current 1H experiment)hetcorjsh(1) (sets up 2D-HETCOR experiment from the current 13C experiment with the 1H spectrum already in experiment 1)VNMRCommonly Used Keyboard CommandsExperiment Setupjexpn - join (go to) experiment #nrt(‘abcd’) - read NMR data file “abcd”rtp(‘abcd’) - read parameter set “abcd”rts(‘abcd’) - read shim set “abcd”svf(‘abcd’) - save NMR data file “abcd”svp(‘abcd’) - save parameter set “abcd”svs(‘abcd’) - save shim set “abcd”mf(x,y) - move NMR data (FID and parameters) from experiment “x” to experiment “y” Data Acquisitionh1xxxx - load acquisition and lock parameters for 1H experiment in solvent xxxx (xxxx = acet, cdcl, d2o, dmso, meth)acqi - open lock / shim windowsu - set up all parameters in hardwaregain=xy - set receiver gain to value “xy” (“xy” = 1 – 60)nt=xy - set number of scans to value “xy”bs=xy - set block size to “xy” scansga - zero current data, start acquisition, and automatically display spectrumgo - zero current data and start acquisitionaa - abort data acquisition and discard datasa - stop acquisition and keep datastandard - set up spectrometer for CDCl3 standard sample and next userf19xxxx - load acquisition parameters for 19F experiment in solvent xxxxp31xxxx - load acquisition parameters for 31P experiment in solvent xxxxc13xxxx - load acquisition parameters for 13C experiment in solvent xxxxdeptjsh - set up DEPT-135 experiment from current 13C experimenthomodecjsh - sets up a homonuclear decoupling experiment from the current 1H experiment noediffjsh - sets up a nOe difference experiment from the current 1H experiment presatjsh - sets up a presaturation experiment from the current 1H experimentcosyjsh - set up 2D-COSY experiment from current 1H experimenthetcorjsh - set up 2D-HETCOR experiment from current 13C experimentData Processing and Plottingtext(‘abcd’) - set title for plot to be the text string “abcd”ft - Fourier transformationwft - exponential multiplication and Fourier transformation (can use after bs scans completed) lb=xy - set amount of exponential multiplication equal to “xy”aph - automatic phase correctionrl(x.yz*sfrq) - set chemical shift at location of cursor to x.yz ppmth - set threshold for peak picking using mousedpf - show peak labelsds - display spectrum with cursor activedir - show a listing of the current directoryprint, printp, printi, printpi - print spectrum. Include peak labels (p) and/or integration (i)print135, print135p - print DEPT-135 spectrum with/without peak labels (p)Practical Demonstration Checkout RequirementsPINMRF Varian 300 MHz NMR SpectrometersPrior to performing this practical demonstration you must first take a 30 minute written quiz. The quiz will test you on material from this document and the Facility Overview document, and other NMR-related matters. For both the quiz and checkout, you may use any training handouts and notes.This is an outline of the tasks you will be required to perform correctly in order to pass the practical demonstration checkout. You will be allowed up to 30 minutes to complete the following tasks. Standard samples will be used for the checkout and will be provided by the NMR lab. PINMRF staff may, at their discretion, observe you performing all or part of the checkout exam.Test Sample - 10% Ethylbenzene in CDCl3 (or other sample as required)- login to computer and start VNMR- remove CDCl3 standard, insert new sample, lock and shim- run 1H spectrum, process, integrate and print- set up new experiment for 13C spectrum- run 13C spectrum, process and printStandard Sample - 100% CDCl3- remove test sample and replace with CDCl3 standard sample, lock and shim- reset spectrometer for next user- shutdown VNMR and logout from UNIX。
2014年度400MHz超导核磁共振谱仪上机操作

升温指令
如果需要温度设置,在命令行输入temp=# su(回 车),(#指所需的温度。最高不要超过100度。比 如要升至30度,temp=30 su)(本实验室不做低温 实验)此时需注意状态栏里VT,如果 ‘NOT.REG’,温度值不变,一直不能达到 ‘Regulated’,此时需通知管理员。 关闭温度设置,在命令行输入temp=‘n’ su(回车)。 此时VT的状态应为’off’
退出程序
退出程序,点击Main Menu more 在CDE界面上,点击exit ok
Exit vnmr
LOGO
苏州大学分析测试中心核磁中心
注意事项
注意,更改参数后,必须经ga才能成功更改. lb=#,线宽。改变此参数无需扫描。该参数将会影 响谱图的分辨率。谱线将变宽。但是噪音会变小。 可以根据谱图具体情况来改变该参数
打印指令
pl:打印图谱 pscale:打印标尺 ppf:打印化学位移 pir:打印积分 page:将图纸送出 以上打印指令是各司其职。需要打印某项内容,就 输入某个打印指令即可。最后必须要输入page,才 能打印机打印图谱
关于上机时间的约定
注:1、如有签了机时而无故不来,造成机时浪费 者,机时费用照扣。如果同样的情况发生第二次, 除机时费照扣,另外第二周最多只能签一次。 2、如有签了机时,因故不能来者,请提前一天通 知。否则视同1处理, 以上条款从2010年3月1日起执行。如有疑问,请咨 询分析测试中心办公室。
图谱处理-积分
用鼠标左键点Part Integral, 会出现绿色积分线 (若积分线呈水平直线可用鼠标中键增加积分线之 垂直高度)。 切积分线: 点Resets,用鼠标将箭头移至吸收峰左 侧,点左键,切积分线的起点(积分线左方呈现虚 点,表示此范围不作积分,实线部分为真正积分 区域),再将鼠标移至吸收峰右侧,点左键,切积 分线终点,其余吸收峰同上。 若要重新积分,可输入cz。
核磁共振具体操作二300M-H(Topspin)[1]
![核磁共振具体操作二300M-H(Topspin)[1]](https://img.taocdn.com/s3/m/67316f4ec850ad02de804191.png)
300兆核磁氢谱操作步骤1.装样。
将装有样品(1H谱: 1 ~ 40 mg)及适量氘代溶剂(约0.5 ml)的核磁管(溶液高度不低于3.5 cm)用绸布擦干净,插入转子中,用量规(高度定为1.8 cm)确定好高度。
2.放样。
打开磁体顶端的安全盖,在BSMS控制板上点击LIFT-ON/OFF (灯亮),听到磁体中部有气流声时,放入核磁管(切记:未听到气流声绝对不可放入样品!!!)。
再点击LIFT-ON/OFF(灯灭),样品进入磁体。
3.调实验指南。
点击菜单栏的Spectrometer,选Data Acquisition Guide,出现界面(左下图):4.建新实验。
点击“New Eexperiment”图标,出现界面(右上图):①NAME 输入测试者姓名(英文字母缩写)②EXPNO 实验采样号1(下一个样品就是2,依此类推)③USER 输入所在课题组名,一般以导师名。
④其余部分不改动。
注:如果已经建立了课题组文件夹(USER),则从左侧的数据浏览器中(D盘)找出USER及NAME并选中最后的实验号,点中鼠标左键直接拖入即可。
5.锁场。
点击Lock,回车,选择所用氘代试剂(如:CDCl3,Acetone,DMSO等);锁场需等待几分钟,待状态栏显示finished后,再进行下一步操作。
注: 连续测相同溶剂的样品时,其它样品锁场可在BSMS面板直接点击Lock On/Off 完成锁场。
6.匀场。
点击“shim”,选“Gradient Shimming”,在“Gradient Shimming”界面下点中“Start Gradient Shimming”,开始自动匀场,待状态栏“setsh”显示finished后,在新出现的“Shimming Results”界面下击点“OK”,自动匀场结束。
注:1.若状态栏有“Gradient Shimming”小图标,可直接点击进入。
2.等待匀场时可点击菜单栏的“Title”设定样品标题并保存。
布鲁克400MHz超导核磁共振谱仪上机操作培训
甲方:分析测试中心
乙方:
注上: 方打 时碎 进样 行品 其管 它造 动成 作探)头二污是染样的品问管题有:暗一裂是(违多规次操使作用(过程1、中未清开洗气不。当2、、样放品置管不已当经)气。流为托此在,磁请体有 关11元课/支题)组。用我们在2006年九月就指定的品牌样品管(在实验材料供应中心(705号楼二楼)领取,
布鲁克400MHz超导核磁共 振谱仪上机操作培训
. ..
关于开放NMR仪器的协约
甲方:校测试中心
乙方:பைடு நூலகம்排上机人员的课题组
甲方对乙方上机人员进行培训,考核,乙方上机人员取得合格证后必须遵守如下约定:
必验须 室严 必格 须遵 在守 专测 门试 登中 记心 簿实 上验 登室记的时各间种,规以章核制磁度室,时严钟格为遵准守,开进放出仪时器间的精规确定到。 分上 钟机 。者进出NMR实
核磁管
进样品管之前,需检查核磁管 核磁管是否有裂纹,破损
量规测量样品溶液高度-不低于40mm(溶质至少0.5mL)
当班操作造成磁体失超的;
违规操作造成核头烧坏;
打碎样品管,并造成探头污染,须返厂家修复的
其他违规操作,造成仪器损坏,修复在5万元以上的;
以上各项所需维修费用由测试中心承担50%,造成事故的上机者所在课题组应承担50%。
当班操作必须注意安全,卫生,不得大声喧哗,除送样人外,劝阻其他人进入NMR实验室。
容 师 复( 签 印包字。括,签送院字样系不人相得,关仿送领冒测 导 ,样 签 如品 字 果代 。 发号 请 现, 注 ,结 意 一构 , 律, 空 一溶 白 个剂 登 月, 记 之测 表 内试 可 不要 以 准求 复 测等印试),样,签品课字。题单目组不前导得本 单 将 本位 收 中对取心校一将内个不科样定研品期样检20品查0元测 各测试 课试费 题费用 组,优 的同惠 测时, 试该如 样课发 品题现 。组有将夹一带个外月样内,不或准者测横试向样样品品。,
《核磁共振图谱》课件
核磁共振图谱课件核磁共振简介核磁共振现象核磁共振(NMR)是一种物理现象,指的是具有奇数个中子的原子核在外加磁场中会产生共振吸收特定频率的射频辐射。
最常见的核磁共振现象是氢原子的核磁共振,即氢核磁共振(^1H NMR)。
发展历史1946年,美国物理学家Bloch和Purcell独立发现了核磁共振现象。
此后,核磁共振技术得到了迅速发展,广泛应用于物理、化学、生物、医学等多个领域。
核磁共振的原理核磁共振的原理基于原子核的自旋和外加磁场之间的相互作用。
具有奇数个中子的原子核(如氢原子核)在外加磁场中会呈现出不同的能级,当射频辐射的频率与原子核的进动频率相原子核会吸收射频辐射,产生核磁共振信号。
核磁共振图谱核磁共振图谱的定义核磁共振图谱是一种用来表征样品中不同核素共振频率和强度信息的谱图。
它反映了样品中不同化学环境下的核磁共振信号,常用于分析化合物的结构、鉴定化合物和了解化合物的物理化学性质。
核磁共振图谱的主要参数1. 化学位移(δ):表示共振信号相对于参照标准的偏移量,化学位移的大小与原子核所处的化学环境有关。
2. 耦合常数(J):表示相邻原子核之间的耦合作用强度,反映了原子核之间的空间接近程度。
3. 积分强度:表示某个特定化学位移处的信号强度,与该化学位移处原子核的数目有关。
核磁共振图谱的类型1. 一维核磁共振图谱:最基本的核磁共振图谱,显示了一个检测器频率维度上的信号。
2. 二维核磁共振图谱:通过两个检测器频率维度上的信号进行绘图,可以提供更丰富的化学信息。
3. 三维核磁共振图谱:通过三个检测器频率维度上的信号进行绘图,具有更高的化学分辨率。
核磁共振图谱的解析核磁共振图谱的解析步骤1. 确定化学位移范围:根据样品的化学成分,确定核磁共振图谱的化学位移范围。
2. 寻找特征峰:在核磁共振图谱中寻找具有代表性的特征峰,这些峰对应于样品中的不同化学环境。
3. 分析耦合常数:根据耦合常数的大小,判断相邻原子核之间的连接方式,从而推断化合物的结构。
300兆核磁操作步骤

---------------------------------------------------------------最新资料推荐------------------------------------------------------300兆核磁操作步骤300 兆核磁操作步骤 BRUKER DPX 300 13C 谱: 100~300 mg)及适当氘代溶剂 (约1. 预备。
将装有样品(1H 谱: 1~40 mg;0.5 ml)的核磁管(溶液高度一般不低于 4cm)用绸布擦干净,插入转子中,用量规(1. 8cm) 量好高度。
2. 放样。
打开 BSMS 控制面板,点击 Lift On-Off(灯亮) ,听到磁体中部有气流声时,方可放入核磁管(切记:未听到气流声绝对不可放入样品!!! ) 。
再点击Lift On-Off(灯灭) 使样品进入磁体。
将 BSMS 面板最小化(点右上角小圆点) 。
3. 建立新的文件或查找已有文件。
键入 edc,回车,出现以下界面:Current data Parameter name of current data set Experiment number PROCNO 1 DU /u USER guest Owner of data TYPE nmr NAME EXPNO processed data number disk unit Data type ①Name 输入自己的姓名 (英文字母) ②Expno 实验采样号 1(下一个样品就是 2,依此类推) ③其余部分不需要改动。
④如果您已经建立了自己的文件名,则从 File 中点search 寻找自己的名字,点中最后的实验号,点 append 后再点1/ 5apply,将出现主界面 Xwin-nmr 将实验号改为新的号码,并保存。
4. 锁场。
键入 Lock 后回车,选择所用氘代试剂 (如:CDCl3, Acetone, DMSO 等) ,待主界面(Xwinnmr 下面) 显示finished 后,打开 Lock 和 BSMS 两个界面,点击 spin on-off,该灯亮而且不闪则表明样品旋转稳定。
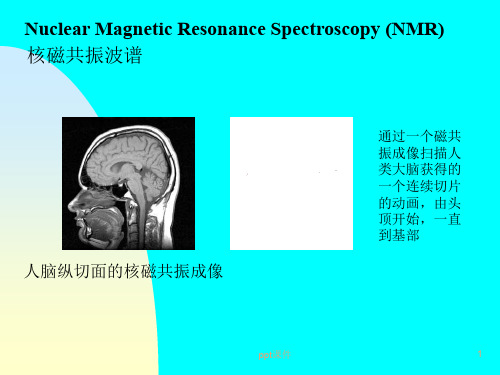
核磁共振波谱 ppt课件
ppt课件
28
1. 化学位移表示方法: 位移的标准 没有完全裸露的氢核,没有绝对的标准。 相对标准:四甲基硅烷 Si(CH3)4 (TMS)
(内标), 位移常数 TMS=0
ppt课件
13
ppt课件
14
ppt课件
15
3. 核磁共振仪 : A. 连续波核磁共振仪
(1)固定外磁场强度 H0 不变,改变电磁波频率ν ,称 为扫频。
(2)固定电磁波频率ν 不变,改变磁场强度 H0 ,称为 扫场。
两种方式的共振仪得到的谱图相同,实验室多 数采用后一种,如60 MHz,100 MHz,400 MHz就是 指电磁波频率。
试样浓度:5-10%;需要纯样品15-30 mg; 傅立叶变换核磁共振波谱仪需要纯样品1 mg ; 标样浓度(四甲基硅烷, TMS) : 1%; 溶剂:1H谱 四氯化碳,二硫化碳;氘代溶剂:氯
仿,丙酮、苯、二甲基亚砜的氘代物;
ppt课件
25
二、1H-NMR的化学位移
由于化学环境不同,即各种氢核 周围的电子云 密度不同(结构中不同位置),引起分子中的H核 磁共振信号位置的变化称为化学位移,用 表示。
实际上,氢核受周围不断运动着的电子影响。在外磁场 作用下,运动着的电子产生相对于外磁场方向的感应磁场, 起到屏蔽作用,使氢核实际受到的外磁场作用减小:
H=(1- )H0 :屏蔽常数。 越大,屏蔽效应越大。
ppt课件
27
0 = [ / (2 ) ](1- )H0
由于屏蔽作用的存在,氢核产生共振需 要更大的外磁场强度(相对于裸露的氢 核),来抵消屏蔽影响。
现代仪器分析——核磁共振波谱法ppt课件

探头
• 样品管座 发射线圈 接收线圈 预放大器 变温元 件
可编辑课件PPT
11
扫描单元
• 用于控制扫描速度、扫描范围等参数; • 一般为扫场模式。在一定范围内,通过扫描线圈
在外磁场上附加一个连续作微小变化的小磁场, 依次使不同共振位置的自旋核共振。射频接收器 会检测到信号的损失并放大记录下来。 • 连续波共振仪为单通道式共振仪,为得到较好的 谱图,许多次扫描累加,费时。
可编辑课件PPT
8
主要部件
磁铁:提供稳定均匀的外磁场
• 永久磁铁:<25kG,100MHz • 电磁铁:<25kG,100Mhz • 超导磁铁:可达100kG以上,>200MHz
– 铌-钛超导材料线圈,置于双层液氦杜瓦瓶 (外层装液氮),逐步加上电流,达到要求后 撤去电源。
可编辑课件PPT
9
射频发射器
• 偶合是短程的
– 相互裂分的氢核间只 能间隔两到三个化学 键;
• 峰裂分的n + 1规律
可编辑课件PPT
17
五、应用
未知化合物1H NMR谱图的解析
解析步骤: ① 根据分子式计算不饱和度; ② 测量积分曲线每一个台阶的高度,折算成整数比,然后 折算成每组峰所对应的氢原子数; ③ 根据化学位移值、质子数目及峰裂分情况推测结构单元 ; ④ 计算剩余的结构单元的不饱和度; ⑤ 组合结构单元成为可能的结构式; ⑥ 对所有可能结构进行指认,排除比可能的结构; ⑦ 借助其它仪器分析法进行进一步确认。
CH3CH2I
CH2I
-CH3
TMS
8.0
7.0
6.0
5.0
4.0
3.0
仪器分析-核磁共振波谱法ppt课件
一般过程是:样品置于样品管中,并插入 磁场中,样品管以一定的速度旋转,经波 谱仪扫描后,接收器获得核磁共振信号, 经一系列检波、放大后,显示在示波器和 记录仪上,得到核磁共振谱。一张核磁共 振谱图一般都经过N次(100次左右)重复 扫描,在计算机中累加得到,这样可以提 高信噪比。 优点:价格较低,稳定易操作,适合化学 工作者例行分析。
γ B0
ν共振= 2π (1-σ ) ⑨ 由上式可知,同种原子核( 1H核)由于所 处的化学环境不同,亦即受到核外电子屏 蔽作用不同,其共振频率各不相同,共振吸 收峰将分别出现在NMR谱的不同频率区域
或不同磁场强度区域,此即为化学位移。 若固定照射频率进行扫场,则σ 大的1H核 出现在高磁场处,σ 小的1H核出现在低磁 场处。据此,我们可以进行氢核结构类型 的鉴定(即有机化合物结构鉴定)。 2.化学位移的表示方法 尽管同一分子中不同类型的1H核,共振频 率各有差异,但差异不大,相对于B0或ν0 来说,仅为百万分之十左右,对其绝对值 的测量难以达到所需要的精度。
ห้องสมุดไป่ตู้
标准物质TMS的特点:TMS即四甲基硅烷 (Tetramethyl Silane) ① TMS中12个氢化学环境相同,在NMR谱 中只给出一个尖锐的单峰,易辨认。 ② TMS与一般有机物相比,氢核外围的电 子屏蔽作用较大,共振吸收峰位于高场端。 一般有机物的1H谱或13C谱峰大都出现在 TMS峰的左边。 ③ TMS化学性质稳定,沸点低,便于回收 ④ 在1H谱或13C谱中都规定δ TMS=0。
故实际工作中是采用测定相对值来表示, 即以某标准物质的共振峰为原点,测定样 品中各质子共振峰与原点的相对距离,这 种相对距离就称为化学位移(chemical shift)。 IUPAC建议,化学位移一律采用位移常数δ 值表示 :
300M核磁共振仪操作
300M核磁共振仪操作(1D谱)1、装样1、用抹布沿一个方向擦核磁管;用手拿着核磁管上侧,另一手捏着转子(勿捏着两白点处),垂直转入,使黑线为于液体一半处。
2、点击Acqi——eject;用右手拇指、食指捏住核磁管上方,中指、无名指夹住转子下方将核磁管插入使之浮在其中;点击insert,听到“嗒”、“嗒”两声的声音;点击close。
二、匀场1、输入j9。
2、点击Setup Exp后,在点击Find Z0,等听到“嘀”的一声。
3、点击Aqci,点击lock——on;观察lockl evel的数值,使之不低于30(可通过调整lock power和lock gain)。
4、输入gm;点击Autoshim On Z进行自动匀场;当rms error<1时完成自动匀场。
(如十次还不能完成,输入su再次重新匀场)5、点击Acqi,点击Spin on,达到20转后,观察lock level,是在60——80之间(可通过调整lock power和lock gain)(如果平台变为直线,输入su),然后lock关掉窗口。
三、1HNMR1、输入j1;2、点击Set up,选择Solvent和Basic 1D,Experiment:Proton 1D。
3、输入参数:lb=0 fn=np nt=8。
4、当转子转速达到20Hz时,输ga。
5、处理:输入wft aph dc点击pscale;选择合适的峰区(box/ ),用红线扩开(点击extant);找到溶剂峰,用红线置于其上,输入nl,点击Ref输入位移值;点击part integral,输入cz,点击Resets,进行细积分,点full integral,再点no integral;把红线至于某一积分段上,输入nl,点击Ref,输入积分值;输入vp=12 dpir ,看一比是否合适,不合适再设积分值;点Th,调整黄线高度,确定ppm最低见出限,再点Th使黄线消失;输入dpf,看位移;输入ds,显示处理后的图谱。
核磁共振光谱是用频率为兆赫数量级的PPT资料优秀版
1946年以 F.Bloch和E.M.Purcell两位科学 家 为 首 的 研 究 小 组 同 时 发 现 核 磁 共 振 ( Nuclear Magnetic Resonance,NMR)现象,他们两人因此 获得1952年的诺贝尔物理奖。以后化学家们发现分 子的环境会影响磁场中的核的吸收,而此效应与分 子结构有密切关系,从此,核磁共振的发展极其迅 速。1966年出现了高分辨率核磁共振仪,70年代出 现了脉冲傅立叶变换核磁共振仪,进一步提高了灵 敏度。近年来又出现了新的双共振技术,改善和扩 大了核磁共振的应用,使之成为研究物质结构,有 机化学,分析化学和生物化学的重要手段。
核周围的分子相当于许多小磁体,这些小磁体快速运动产生瞬息万变的小磁场——波动磁场。
态的过程,这个过程就是弛豫过程。 3500T的磁场中的共振频率为100MHZ。
1、自旋-晶格弛豫(纵向弛豫) 高能态的核并不是通过辐射形式回到低能态的过程,这个过程就是弛豫过程。
一般液体及气体的T1很小,仅几秒钟。
1、自旋-晶格弛豫(纵向弛豫)
另外仪器的磁场若不均匀也使谱线加宽,这可以用转动样品管的方法来改善磁场的不均匀情况。
核磁共振光谱是用频率为兆赫数量级的、波长很长、能量很低的电磁波照射分子,这种电磁波能与暴露在强磁场中的磁性核相互作用,
引起磁性核在外磁场中发生磁能级的共振跃迁而产生吸收信号。
高能态的核并不是通过辐射形式回到低能 由此可见,核磁共振光谱和可见-紫外光谱、红外吸收光谱一样,都是微观粒子吸收不同能量的电磁波后在不同的能级上的跃迁。
核周围的分子相当于许多小磁体,这些小磁体快速 运动产生瞬息万变的小磁场——波动磁场。这是许多不 同频率的交替磁场之和,若其中某个波动场的频率和核 自旋产生的磁场频率一致时,这个自旋核就会与波动场 发生能量交换,即把能量传给周围分子而回到低能级。 这样的结果是高能级的核的数目减少,就全体磁核来说, 总能量降低了。这种过程所经历的时间用T1表示,T1越 小,纵向弛豫过程效率越高。一般液体及气体的T1很小, 仅几秒钟。固体样品因分子的热运动受到限制,T1就很 大,有的需要几小时,因此测定核磁共振谱时一般采用 液体试样。
超导核磁共振仪操作图示
点击
设定扫描宽度(仪器操作图示-29)
点击“dp1”
设定扫描宽度(仪器操作图示-30)
输入最大化学位移值
设定扫描宽度(仪器操作图示-31)
输入最小化学位移值
设定扫描宽度(仪器操作图示-32)
请确认!
定化学位移值(仪器操作图示-33)
点击“utilities”
输入“plot”
300HZ核磁共振谱仪操作示意
化学院实验教学中心
样品管进入磁体
将仪器调到可作常规氢谱状态(仪器操作图示-1)
点击File-search
将仪器调到可作常规氢谱状态(仪器操作图示-2)
点击Append
将仪器调到可作常规氢谱状态(仪器操作图示-3)
点击Apply
将仪器调到可作常规氢谱状态(仪器操作图示-4)
点击“calibrate”
定参考标准(仪器操作图示-23)
在此点击鼠标中键
定参考标准(仪器操作图示-24)
输入“0”
积分(仪器操作图示-25)
点击“integrate”
积分(仪器操作图示-26)
1.点击左键,使鼠标箭头向下。 2.在所需积分峰的两侧各按一次 鼠标中键。
积分(仪器操作图示-27)
化学院实验教学中心样品管进入磁体样品管进入磁体将仪器调到可作常规氢谱状态将仪器调到可作常规氢谱状态仪器操作图示仪器操作图示11点击filesearch将仪器调到可作常规氢谱状态将仪器调到可作常规氢谱状态仪器操作图示仪器操作图示22点击append将仪器调到可作常规氢谱状态将仪器调到可作常规氢谱状态仪器操作图示仪器操作图示33点击apply将仪器调到可作常规氢谱状态将仪器调到可作常规氢谱状态仪器操作图示仪器操作图示44点击close建立一个新的实验数据文件名建立一个新的实验数据文件名仪器操作图示仪器操作图示55输入edc建立一个新的实验数据文件名建立一个新的实验数据文件名仪器操作图示仪器操作图示66更改文件名建立一个新的实验数据文件名建立一个新的实验数据文件名仪器操作图示仪器操作图示77点击save锁场调分辨率锁场调分辨率仪器操作图示仪器操作图示88输入lock锁场调分辨率锁场调分辨率仪器操作图示仪器操作图示99点击cdci3锁场调分辨率锁场调分辨率仪器操作图示仪器操作图示1010点击windowslock锁场调分辨率锁场调分辨率仪器操作图示仪器操作图示1111设置采样参数设置采样参数仪器操作图示仪器操作图示1212输入eda设置采样参数设置采样参数仪器操作图示仪器操作图示1313更改采样次数设置采样参数设置采样参数仪器操作图示仪器操作图示1414点击save进入采样窗口进入采样窗口仪器操作图示仪器操作图示1515输入a自动设置接收机增益自动设置接收机增益仪器操作图示仪器操作图示1616输入rga自动设置接收机增益自动设置接收机增益仪器操作图示仪器操作图示1717设置完毕
核磁共振实验技术 教学PPT课件
Ʋ样品(600MHz) > Ʋ样品(400MHz), 分辨率 600MHz > V样品400MHz,
23
谱仪的分辨率
仪器的兆周数
1500Hz / 300 MHz = 5ppm 2000Hz / 400 MHz = 5ppm 2500Hz / 500 MHz = 5ppm 3000Hz / 600 MHz = 5ppm
3
NMR技术的起源与发展
(三)、核磁谱仪的发展 1946-1952布洛赫便和珀塞尔一起研制出世界上第一台核磁共振谱仪。 1953年,第一台商品谱仪问世。美国Varian公司,30Hz,7000高斯,0.7特斯拉 1964年,美国Varian公司,超导磁场核磁谱仪,200MHz,4.74特斯拉。 1969年,美国Varian公司,第一台傅里叶变换核磁谱仪,100MHz,2.35特斯拉。 1977年,美国Damadian,第一台人体核磁共振断层成像仪(CT) 1979年,德国Bruker公司,第一台500MHz超导核磁谱仪。 2000年,美国Varian公司,第一台900MHz超导核磁谱仪。
Methodological
Methodological Instrumental/ Methodological Methodological
TROSY
Methodological
核磁共振谱仪培训PPT
超导傅里叶变换核磁共振谱仪
张公军 公共技术服务中心 2010年9月
第一部分核磁共振的基本原理 第二部分核磁共振仪器介绍 第三部分核磁共振实验 第四部分核磁共振实验室安全注意事项
2010-10-12
S(ω)
第二部分核磁共振谱仪介绍——
400MHz AVANCEIII核磁共振谱仪 一、仪器的组成
磁体系统 机柜
操作控制台
2010-10-12
1.磁体系统, 包括磁体, 探头、匀场 系统和前置 放大器 (HPPR)
磁体
2010-10-12
(1)磁体,提供强而均匀的磁场 超屏蔽磁体,磁场强度9.4特斯 拉,具有液氦液面监视、液氦最小 液面报警,液氦自动监视和自动定 时记录功能。 (2)匀场系统 安装在磁体的下端,是一组载 流线圈,作用是通过补偿磁场不均 匀度来改善磁场一致性。
2010-10-12
六、傅里叶变换谱仪的工作原理: 磁化矢量、射频脉冲和FID信号
B0 M
±
B0 FID信号
±
±
RF 脉冲,覆盖了 很宽的频率范围。
M
接收器 Receiver FT
S(t)
当相应频率的射频场(RF)脉冲照射时,宏观 磁化矢量将围绕着射频场作用的方向从Z-轴 转到X-Y平面上.由该平面上的检测线圈检测 出时间域的FID信号,再通过傅立叶变换得到 频率域的核磁共振谱图.
2010-10-12
核的自旋角动量是量子化的,与核的自旋量子数I 的关系如下:
p= h 2π I ( I + 1) 1 3 I可以为0, , ,⋅ ⋅ ⋅ ⋅ ⋅ ⋅等值 1, 2 2 2
- 1、下载文档前请自行甄别文档内容的完整性,平台不提供额外的编辑、内容补充、找答案等附加服务。
- 2、"仅部分预览"的文档,不可在线预览部分如存在完整性等问题,可反馈申请退款(可完整预览的文档不适用该条件!)。
- 3、如文档侵犯您的权益,请联系客服反馈,我们会尽快为您处理(人工客服工作时间:9:00-18:30)。
▪ 甲方:分析测试中心
乙方:
▪ 注:打碎样品管造成探头污染的问题:一是违规操作(1、未开气。2、样品管已经气流托在磁体上 方时进行其它动作)二是样品管有暗裂(多次使用过程中清洗不当、放置不当)。为此,请有关课 题组用我们在2006年九月就指定的品牌样品管(在化学化工学院物流中心领取,10元/支)。
▪ 制样和进样时要严格检查样品管,即使未发现样品管暗纹,如因清洗、放置时样品管和其它玻璃 器发生材碰撞的情况,该样品管就应废弃不用。再次重申不得使用不明身份的样品管
这3列参数更改后,必须 执行Ga指令,仪器才会认可
参数
tn:检测核。 tn=H1,检测核是H,是氢谱; tn=C13,检测核是C,是碳谱; tn=F19,检测核是F,是氟谱; tn=P31,检测核是P,是磷谱
参数
nt:扫描次数,一般建议为8的倍数 ga:执行扫描并进行FID变换 wft:将FID转换成图形 aph:自动校正相位 ds:显示图谱 dg:显示所有参数 dpf:显示化学位移 jexp#:连接到第#实验区 sw:谱宽 movesw:移动合适的谱宽。(注意:输入该命令后,必须要
▪ 1、当班操作时,带领或默许无上机证人员进入核磁 室;
▪ 2、样品管检查不严格,造成打碎并污染探头的(污染 程度不严重而中心能自行修复)。
▪ 3、遇到仪器软硬件故障而不及时报告管理人员,自 行试图排故,而造成仪器停机或轻度受损的。
协约
▪ 下列情况属重大违规事故,对上机者处5003000元罚款,情节严重的并报学校另行处理。
▪ 1、当班操作造成磁体失超的; ▪ 2、违规操作造成探头烧坏; ▪ 3、打碎样品管,并造成探头污染,须返厂家修复的 ▪ 4、其他违规操作,造成仪器损坏,修复在5万元以上
的;
协约
▪ 以上各项所需维修费用由测试中心承担50%,造 成事故的上机者所在课题组应承担50%。
协约
▪ 当班操作必须注意安全,卫生,不得大声喧哗, 除送样人外,劝阻其他人进入NMR实验室。
协约
▪ 甲方对乙方上机人员进行培训,考核,乙方 上机人员取得合格证后必须遵守如下约定:
协约
▪ 必须严格遵守测试中心实验室的各种规章制度, 严格遵守开放仪器的规定。上机者进出NMR实 验室必须在专门登记簿上登记时间,以核磁室 时钟为准,进出时间精确到分钟。
协约
▪ 下列情况之一属违规行为,对上机者进行教育 并处100元以上的罚金。
▪ 当班操作造成磁体失超的;
▪ 违规操作造成核头烧坏;
▪ 打碎样品管,并造成探头污染,须返厂家修复的
▪ 其他违规操作,造成仪器损坏,修复在5万元以上的;
▪ 以上各项所需维修费用由测试中心承担50%,造成事故的上机者所在课题组应承担50%。
▪ 当班操作必须注意安全,卫生,不得大声喧哗,除送样人外,劝阻其他人进入NMR实验室。
再次重申不得使用不明身份的样品管 。绝对禁 止使用核磁管口附近有个类似α标志的 核磁管。
关于上机时间的约定
▪ 注:1、如有签了机时而无故不来,造成机时浪费 者,机时费用照扣。如果同样的情况发生第二次, 除机时费照扣,另外第二周最多只能签一次。
▪ 2、如有签了机时,因故不能来者,请提前一天通 知。否则视同1处理,
错误的做法
请注意,虽然虚线框是 在溶液中间,但是上部 的转子位置是错的. 这样做的后果就是整
个样品进入探头的长
度过长,有可能会损坏 探头
Username
PASSWORD
操作界面
鼠标右键进入TERMINAL
选择“OPEN TERMINAL”
Terminal-输入vnmrj
操作系统
请注意,如果出现这个提示, 需要点击
ga后,再查看全图,才能看到谱宽的更改)。
实验区
脉冲序列
注意事项
▪ 注意,更改参数后,必须经ga才能成功的是这3列 参数,以及movesw.
▪ lb=#,线宽。改变此参数无需扫描。该参数将会影 响谱图的分辨率。谱线将变宽。但是噪音会变小。 可以根据谱图具体情况来改变该参数
▪ 下列情况之一属违规行为,对上机者进行教育并处100元以上的罚金。
▪ 当班操作时,带领或默许无上机证人员进入核磁室;
▪ 样品管检查不严格,造成打碎并污染探头的(污染程度不严重而中心能自行修复)。
▪ 遇到仪器软硬件故障而不及时报告管理人员,自行试图排故,而造成仪器停机或轻度受损的。
▪ 下列情况属重大违规事故,对上机者处500-3000元罚款,情节严重的并报学校另行处理。
RESET-PNEUMATIC FAULT
RESET-PNEUMATIC FAULT
START-STANDAD
点击此处更换溶剂
选择溶剂
Spin/temp
弹出样品/进样
FIND Z0/LOCK
LOCK-ON
黄色-锁场线 蓝色-相位线
SHIM
GRADIENT SHIM
TEXT OUTPUT
注意事项
▪ 注:打碎样品管造成探头污染的问题:一是违规
操作(1、未开气。2、样品管已经气流托在磁体 上方时进行其它动作)二是样品管有暗裂(多次
使用过程中清洗不当、放置不当)。为此,请 有关课题组用我们指定的品牌样品管, 在实验材料供应中心领取。
▪ 制样和进样时要严格检查样品管,即使未发现样
品管暗纹,如因清洗、放置时样品管和其它玻璃 器发生材碰撞的情况,该样品管就应废弃不用。
以上条款从2010年3月1日起执行。如有疑问,请咨 询分析测试中心办公室。
▪ 以上是一些注意事项,请每个课题组的同学一定 要认真阅读。日后在上机过程中,一旦被本室工 作人员发现有违规现象,将严惩不怠。
核磁管
▪ 进样品管之前,需检查核磁管 ▪ 核磁管是否有裂纹,破损
量尺
样品管高度-溶剂约0.5mL
LOGO
2010年度300MHz超导核 磁共振谱仪上机操作培训
苏州大学分析测试中心核磁室 2010年10月
关于开放NMR仪器的协约
▪ 甲方:校测试中心
▪ 乙方:安排上机人员的课题组
▪ 甲方对乙方上机人员进行培训,考核,乙方上机人员取得合格证后必须遵守如下约定:
▪ 必须严格遵守测试中心实验室的各种规章制度,严格遵守开放仪器的规定。上机者进出NMR实验室 必须在专门登记簿上登记时间,以核磁室时钟为准,进出时间精确到分钟。
