Minpet使用说明(中英对照)
韩国综合美容仪说明书

综合美容仪原理及使⽤说明书(超声波 + 护肤 + 电离⼦透⼊ + 提拉)※本教材为公司内部培训使⽤注意事项▣下⾯所诉注意事项,是为防⽌使⽤不当⽽造成⼈命损伤为安全请务必仔细阅读.※在以下情况下请停⽌使⽤• 使⽤中,如感到⾝体不适,或发现产品有异常,请⽴即关闭电源,停⽌使⽤.• 如使⽤强度过⼤,有可能会发⽣抽筋的现象.如发⽣以上情况,请⽴即停⽌使⽤.• 请不要对幼⼉使⽤.• 请放置于婴幼⼉不容易触碰到的地⽅.• 产品如发⽣异常,请⽴即停⽌使⽤,并联系经销商.• 除了本公司技术⼈员以外,请不要随意对产品进⾏拆卸,改造.• 在浴缸⾥⾯使⽤时,不要浸泡于⽔中.会有触电危险.• 使⽤后请务必将电源插头拔掉.请熟记使⽤说明书及操作⽅法再使⽤.• 请不要保管于以下场所.- 有直射光线的场所- 容易接近风⾬的场所及易积⽔的场所- 使⽤⽕的场所,此外其他温度⾼的场所- 湿⽓及灰尘严重的场所• 请不要破坏电源线,并对其进⾏加⼯,切勿对其进⾏弯曲捆绑. 如电源线破损,有可能会造成⽕灾及触电.• 请不⽤使⽤ 220V以外的电压.有可能会造成⽕灾及触电.• 请不要对猫狗等宠物使⽤.• 不⼩⼼产品操作盘进⽔,可能会有触电及短路的现象,请⽴即停⽌使⽤,并联系经销商 进⾏检查.• 使⽤后,拔出插头时,请务必抓住插头拔出. 有可能因为触电及短路造成⽕灾.• 不适⽤产品时,请务必将插头与插座进⾏分离.• 刚开始使⽤时,请不要将强度调的太⾼,请从低强度开始使⽤.• 如⽪肤产⽣红肿的现象及瘙痒的现象,请减⼩输出强度,选择适合⾃⼰⽪肤的强度.Ultrasound 超声波 1. 效果(1) 清洁效果超声波可利⽤⾼速微⼩的震动,来产⽣⼩的泡沫,并在共同作⽤下,排除⽑孔及⽪肤组织中的沉积物.还可促进⼈体的新陈代谢,对沉积物的排出及美⽩也有不错的效果.(2) 提拉效果对⽪肤使⽤超声波,可促进真⽪组织内的纤维组织活动正常化,从⽽增加⽪肤的弹⼒.还对因失去保⽔度及弹⼒⽽肌⾁松弛,⽪肤粗糙,产⽣皱纹的⽼化⽪肤也有很好的效果.(3) 分解脂肪使⽤超声波时,产⽣的热量可作⽤于组织深处,从⽽加强其效果,使脂肪更加容易得到分解,并可通过⽼化物质的排出,促进脂肪分解。
韩国综合美容仪说明书
综合美容仪原理及使⽤说明书(超声波 + 护肤 + 电离⼦透⼊ + 提拉)※本教材为公司内部培训使⽤注意事项▣下⾯所诉注意事项,是为防⽌使⽤不当⽽造成⼈命损伤为安全请务必仔细阅读.※在以下情况下请停⽌使⽤• 使⽤中,如感到⾝体不适,或发现产品有异常,请⽴即关闭电源,停⽌使⽤.• 如使⽤强度过⼤,有可能会发⽣抽筋的现象.如发⽣以上情况,请⽴即停⽌使⽤.• 请不要对幼⼉使⽤.• 请放置于婴幼⼉不容易触碰到的地⽅.• 产品如发⽣异常,请⽴即停⽌使⽤,并联系经销商.• 除了本公司技术⼈员以外,请不要随意对产品进⾏拆卸,改造.• 在浴缸⾥⾯使⽤时,不要浸泡于⽔中.会有触电危险.• 使⽤后请务必将电源插头拔掉.请熟记使⽤说明书及操作⽅法再使⽤.• 请不要保管于以下场所.- 有直射光线的场所- 容易接近风⾬的场所及易积⽔的场所- 使⽤⽕的场所,此外其他温度⾼的场所- 湿⽓及灰尘严重的场所• 请不要破坏电源线,并对其进⾏加⼯,切勿对其进⾏弯曲捆绑. 如电源线破损,有可能会造成⽕灾及触电.• 请不⽤使⽤ 220V以外的电压.有可能会造成⽕灾及触电.• 请不要对猫狗等宠物使⽤.• 不⼩⼼产品操作盘进⽔,可能会有触电及短路的现象,请⽴即停⽌使⽤,并联系经销商 进⾏检查.• 使⽤后,拔出插头时,请务必抓住插头拔出. 有可能因为触电及短路造成⽕灾.• 不适⽤产品时,请务必将插头与插座进⾏分离.• 刚开始使⽤时,请不要将强度调的太⾼,请从低强度开始使⽤.• 如⽪肤产⽣红肿的现象及瘙痒的现象,请减⼩输出强度,选择适合⾃⼰⽪肤的强度.Ultrasound 超声波 1. 效果(1) 清洁效果超声波可利⽤⾼速微⼩的震动,来产⽣⼩的泡沫,并在共同作⽤下,排除⽑孔及⽪肤组织中的沉积物.还可促进⼈体的新陈代谢,对沉积物的排出及美⽩也有不错的效果.(2) 提拉效果对⽪肤使⽤超声波,可促进真⽪组织内的纤维组织活动正常化,从⽽增加⽪肤的弹⼒.还对因失去保⽔度及弹⼒⽽肌⾁松弛,⽪肤粗糙,产⽣皱纹的⽼化⽪肤也有很好的效果.(3) 分解脂肪使⽤超声波时,产⽣的热量可作⽤于组织深处,从⽽加强其效果,使脂肪更加容易得到分解,并可通过⽼化物质的排出,促进脂肪分解。
湿氧系统中英对照操作手册基本操作

操作手册目录Preface.序言 (III)Tempress documentation set. 文件设置 (III)User Definition. 用户定义 (IV)Notes, Cautions and Warnings..注意,小心,警告 (V)Contents description (VI)Revision History (VI)1. Introduction.......................................................................1-11.1 General.....................................................................................1-11.2 Operator area description.........................................................1-22. Safety.................................................................................2-22.1 Emergency Off (EMO)..............................................................2-22.2 Alarm Signals............................................................................2-22.2.1 Buzzer / LED.............................................................2-22.2.2 Touchscreen..............................................................2-22.2.3 Light tower.................................................................2-32.2.4 TSC Alarm menu.......................................................2-32.3 Light tower signal description (optional)....................................2-32.4 Toxic Material...........................................................................2-52.5 Safety measures.......................................................................2-53. Operator Instructions.....................................................2.5-13.1 Load or Unload process wafers.............................................3.1-13.1.1 Load process wafers...............................................3.1-13.1.2 Unload wafers.........................................................3.1-13.2 Selecting a new process recipe.............................................3.2-13.2.1 Touchscreen...........................................................3.2-13.2.2 TSC-2.....................................................................3.2-33.3 Start/Continue a new process recipe.....................................3.3-1 3.3.1 Touchscreen...........................................................3.3-13.3.2 TSC-2.....................................................................3.3-23.4 Stop a running process recipe...............................................3.4-1 3.4.1 Touchscreen...........................................................3.4-13.4.2 TSC-2.....................................................................3.4-23.5 Abort a running process recipe..............................................3.5-1 3.5.1 Touchscreen...........................................................3.5-13.5.2 TSC-2.....................................................................3.5-23.6 Clear Alarms..........................................................................3.6-1 3.6.1 Required action.......................................................3.6-13.6.2 Touchscreen...........................................................3.6-13.6.3 TSC-2.....................................................................3.6-2Preface序言This set of manuals explains how to operate a Horizontal Diffusion/LPCVD furnace.这套手册是操作水平扩散炉/ LPCVD的说明。
Pellicon Mini和MiniX 保持器用户指南说明书

Pellicon® Mini and MiniX HoldersUser GuideThe life science business of MerckKGaA, Darmstadt, Germany operates asMilliporeSigma in the U.S. and Canada.2 Pellicon® Mini and MiniX Holders User Guide 3 ContentsIntroduction (5)Unpacking (6)Plumbing and Instrumentation (8)Assembling the Holders (9)Feed and Retentate Fitting Connections (9)Permeate Fitting Connections (9)Connecting Pressure Gauge AdapterFittings to FEED and RETENTATE Fittings (10)Connecting the Pressure Gauge (12)Connect the Permeate Fittings (13)Inserting the Pellicon® Cassettes (13)Attaching the End Plate (15)Autoclave Setup (17)Ordering Information (18)Spare Parts and Accessories (18)4 Pellicon® Mini and MiniX Holders User Guide 5 IntroductionThe Pellicon® Mini and MiniX holders are for use with 0.1 m2 Pellicon®2 cassettes and 88 cm2 and 0.11 m2 Pellicon® 3 cassettes.The Pellicon® Mini Holder is recommended for 1 to 3 cassettes in parallel.The Pellicon® MiniX holder is recommended for 3 to 5 cassettes in parallel or 2 to 4 cassettes in series with diverter plates.6 UnpackingMini and MiniX Holders include the following:The Pellicon®2. Remove the FEED and RETENTATE fittings from the holder.3. Loosen and remove the two nuts on the tie rods.4. Remove the washers, spacers, and end plate from the holder.Remove the shipping insert located between the holder manifold and end plate.5. Place the holder base on a level surface.Pellicon® Miniand MiniX HolderTie Rod FilterPellicon ®Tie Rod FilterPellicon ®Pellicon ® Mini and MiniX Holders User Guide 78 Plumbing and InstrumentationThe concentration mode is the most commonly used mode forthe concentration of proteins and viruses and is shown below without the diafiltrate. During this mode, material retained bythe membrane (retentate) flows out of the retentate fitting and is recirculated to the original product container. The material passing through the membrane (permeate) flows out of the permeate outlet fitting onto the permeate collection container.The constant volume diafiltration mode, shown below, is used for washing product that is retained by the membrane or for recovering additional product that is passed through the membrane. The mode involves the addition of water or buffer to the feed container at the same rate as permeate is being removed from the process.Plumbing and Instrumentation DiagramAssembling the HoldersFeed and Retentate Fitting ConnectionsConfigurations for connecting fittings to the FEED and the RETENTATE fittings include:1. Connecting a pressure and sanitary diaphragm valve to theRETENTATE fitting, and a pressure gauge to the FEED fitting.2. Connecting separate tubing to the FEED and the RETENTATEfittings.Feed and Retentate Fitting ConnectionsPermeate Fitting ConnectionsConfigurations for connecting fittings to the PERMEATE fittings include:1. Connecting the two PERMEATE fittings together with tubing usinga tee or Y connection.2. Connecting separate tubing to the two PERMEATE fittings.Pellicon ® Mini and MiniX Holders User Guide 9Permeate Fitting ConnectionsConnecting Pressure Gauge Adapter Fittings to FEED and RETENTATE FittingsThe Pellicon ® Mini and MiniX Holder Pressure Gauge Adapter Fittings are short-leg tees to keep the working fluid volume low and avoid non-sanitary low-flow areas in the piping. Two ¾-inch sanitary gaskets and twosanitary fitting clamps are supplied with each pressure gauge adapter fitting.1. Seat a 3/4-inchsanitary gasket in the groove on the FEED fitting.Installing the Gasket and Positioning the Pressure Gauge Adapter Fittings10 Pellicon® Mini and MiniX Holders User Guide 112. Hold the sanitary gasket in place and press the pressure gaugeadapter fittings flange against the FEED fitting flange so thefitting branch is parallel to the holder case and oriented asshown above.Note The gasket moves easily if not held in place whenpressing the pressure gauge adapter fittings flangeagainst the holder fitting flange.3. Secure the Pressure Gauge Adapter Fittings to the FEED fittingwith the sanitary clamp, as shown below.4. Open the sanitary clamp by moving the swing bolt out of theclamp slot.5. Place the sanitaryclamp over the FEEDfitting connection andclose the sanitaryclamp by moving theswing bolt into theclamp slot.6. Hand tighten thesanitary clampclosure.7. Repeat steps 1-3 toconnect a pressuregauge adapter fittingsto the RETENTATEfitting.Clamping the Pressure Gauge Adapter Fittings to theMini Holder Fitting12 Connecting the Pressure GaugeAnalog and digital pressure gauges are available from your local representative.1. Seat the ¾-inch sanitary gasket in the groove on the pressuregauge adapter fittings.2. Hold the gasket in place and press the pressure gaugediaphragm against the ¾-inch side branch of the pressure gauge adapter fittings.3. Secure the pressure gauge to the Pressure Gauge Adapter Fittingswith the sanitary clamp.4. Open the sanitaryclamp by moving theswing bolt out of theclamp slot.5. Place the sanitaryclamp over the PressureGauge Adapter Fittings-PRESSURE GAUGEconnection and closethe sanitary clamp bymoving the swing boltinto the clamp slot.6. Hand tighten thesanitary clamp closure.7. Repeat steps 1-3 toconnect a PressureGauge Adapter Fittingsto the RETENTATEfitting.Attaching the Pressure Gauge to the Pressure GaugeAdapter FittingsPellicon® Mini and MiniX Holders User Guide 13 Connect the Permeate FittingsTwo gaskets and two clamps are supplied for attaching fittings to the two PERMEATE fittings located on the sides of the manifold plate. The PERMEATE fittings accommodate standard ½-inch or¾-inch sanitary fittings and adapters.Inserting the Pellicon® CassettesInstall the required number of cassettes. Permeate flow rate increases as filter area increases.1. Inspect the tie rods and nuts for signs of burrs or strippedthreads. Nuts should turn freely on the tie rods for propertightening of the holder.2. Holding the manifold with one hand, slide the filter gasket (Pellicon®2 Cassettes only) tabs over the tie rods and press the filter gasketagainst the manifold, as shown below.Note Pellicon® 2 Cassettes ONLYThe large feed and retentate holes on the filter gasketmust align to the large feed and retentate holes onthe manifold. Two filter gaskets are supplied witheach filter. One filter gasket must be installed betweeneach pair of filters, and one gasket must be installedbetween each end of the filter and the adjacentstainless steel plate.Inserting the Filter Gaskets and Filter3. Align the filter cut-outs with the tie rods, and insert the filter soit is parallel with the manifold as shown.NoteThe filter will extend beyond the edges of the manifold and end plate if the filter does not properly align to the feed, retentate, and permeate holes.4. Holding the manifold with one hand, slide the filter gasket(Pellicon ® 2 Cassettes only) tabs over the tie rods and press the filter gasket (Pellicon ® 2 Cassettes only) against the filter , as shown.5. Repeat steps 3–5 for additional cassettes.14 Attaching the End Plate1. Holding the manifold gaskets (Pellicon ® 2 Cassettes only) andfilter(s) in place with one hand, slide the end plate holes over the tie rods and press the end plate against the filter.Attaching the end plate2. Place an equal number of spacers on each tie rod depending onthe number of filters in use.3. Place one washer and one nut on each tie rod, as shown above,and hand tighten.4. Tighten the holder with the torque wrench and socket. Thetorque wrench setting for 180-200 inch-pounds (20.3-22.6 Newton-meters). Check the torque wrench (not supplied with the holder) setting for 180-200 inch-pounds (20.3-22.6 Newton-meters) prior to use. Refer to the next section to set the torque wrench.5. Attach the deep socket to the torque wrench by firmly pressingPellicon ® Mini and MiniX Holders User Guide 1516 the deep socket onto the torque wrench drive. Attaching thedeep socket may require force.6. Hand tighten the nuts evenly by alternating from one nut to theother.7. Brace the holder with one hand. With a continuous motion, turneach nut ¼ turn with the torque wrench, alternating from onenut to the other until torque wrench “clicks” when it reaches180-200 inch-pounds (20.3-22.6 Newton-meters).8. Wait 5-10 minutes; re-torque to 180-200 inch-pounds (20.3-22.6 Newton-meters).Waiting allows gasket(s) to relax before re-torquing.9. Re-torque to a maximum of 200 inch-pounds (22.6 Newton-meters) as needed to create a liquid-tight seal. The torquewrench may have a fixed head or a ratchet-style head. If yourwrench has a ratchet-style head, move lever to the right lockposition to tighten nuts and move the lever to the left lockposition to loosen the nuts.Note Non-uniform tightening of the nuts can damage the filter.Non-parallel plates or compression of the filter(s) at oneend can cause leakage.Setting the Torque Wrench1. Pull down the spring-loaded lock collar to unlock the torquewrench.2. Hold down the spring-loaded lock collar while turning the handleuntil the 180-200 inch-pound (20.3-22.6 Newton-meters) mark on the wrench handle aligns with the zero mark on the sleevedie.Note One side of the torque wrench handle displays units as inch-pounds and the other side displays units asNewton-meters.3. Rotate the handle slightly so the lock collar springs back andlocks into place. When the lock collar locks into place the handle will not rotate.Setting the Torque WrenchAutoclave Setup1. Remove all filters and filter gaskets from the Pellicon ® Mini andMiniX Holder before autoclaving.2. Rest the holder FEED and RETENTATE fittings and the end plateon a soft material to protect the fitting faces and end plate from being scratched in the autoclave.Do not autoclave with the holder in an upright position, because the feet will compress and become loose.3. Autoclave the Pellicon ® Mini and MiniX Holder at 121º C to 125º Cfor 30 minutes per cycle.Pellicon ® Mini and MiniX Holders User Guide 1718 Spare Parts and AccessoriesStandard Product WarrantyThe applicable warranty for the products listed in this publication may be found at /terms (within the “Terms and Conditions of Sale” applicable to your purchase transaction).Pellicon ® Mini and MiniX Holders User Guide 19The vibrant M and Pellicon ® are trade-marks of Merck, KGaA, Germanyor its affiliates. All other trademarks are the property of their respective owners. De-tailed information on trademarks is avail-able via publicly accessible resources.MK_UG3586EN Rev 1.0 02/2019 Previ-ously published as document number P35447. © 2015, 2019 Merck KGaA,Darmstadt, Germany and/or its affiliates. All Rights Reserved.For technical assistanceand worlwide contact informationplease visit: .For additional information and documentation please contact: Merck KGaA, Darmstadt, Germany Corporation with General Partners Frankfurter Str . 25064293 Darmstadt, Germany Phone: + 49 6151-72 0We provide information and advice to our customers on application technologies and regulatory matters to the best of our knowledge and ability, but without obligation or liability. Existing laws and regulations are to be observed in all cases by our customers. This also applies in respect to any rights of third parties. Our information and advice do not relieve our customers of their own responsibility for checking the suitability of our products for the envisaged purpose.。
Minpet使用说明(中英对照)

Minpet使用说明(中英对照)Basic StatisticsWith this option you can calculate the minimum, maximum, mean, st. deviation, variance and number of cases in your data file.在这选项中,可以计算最小的,最大者,平均值,st ,偏离,变量,数据文件中的大量数据。
Results of these calculations are displayed in a grid format.计算的结果以栅格格式显示To calculate the standard Basic statistics计算标准的基本统计表1. Choose Statistics from the main menu.1. 从主菜单中选择统计表。
2. Choose Basic statistics (in type of statistics)2. 选择基本的统计表 (在统计表的类型中)3. Select the desired statistics e.g. mean, st. deviation... from basic statistics. Note: an X indicates that a condition has been selected.3. 从基本统计表中选择要的平均数,st,偏离等等。
注意: X 表示一种情况已经被选择。
4. Select All variates (in Output)4. 选择所有的变量(在输出)5. Choose Only selected data (in calculate using). If you want to access all data click on All data.5. 选择已选择了的数据.( 在计算使用中) 如果你想计算所有的数据点击所有数据(all data)。
休闲裤贴袋机 Chino Pocket Setter (MB1002D-1-S7300A-305P)
休闲裤贴袋机Chino Pocket Setter (MB1002D-1-S7300A-305P)使用说明书Instruction Manual常州智谷机电科技有限公司CHANGZHOU WISDOM &VALLEY ELECTRICAL TECHNOLOGY CO.,LTD在使用本设备之前请先阅读本使用说明书Please read the operation manual of the touch screen interface before using the device 请将本使用说明书放在便于查阅的地方保管Please keep this operation manual of touch screen interface in convenient placeforreference2020.03版本信息/Version感谢购买IMB工业用缝纫机。
在使用此机器之前,请仔细阅读以下的说明,这样可以更好地帮到您了解此机器的相关操作。
这些说明是根据现行的条例明确阐述了正确的工作方法。
Thank you for purchasing this industrial sewing machine from IMBBefore using this automatic unit,please read the following instructions,which will help you tounderstand how the machine operates.These instructions illustrate the correct working methods to comply with current regulations.在没有得到IMB授权许可的前提下,此说明书的任何部分是不可以被复制或者转录的。
说明书的内容可能被修改,而不需预先通知。
No part of this manual may be copied or transcribed without requesting prior authorization from IMBThe contents of this manual may be subject to change without advance notification.我们将欣然接受各位提出的改进此说明书的任何建议和指示We are happy to receive suggestions and/or indications on ways we could improve this manual.本机介绍说明分为三部分,具体请参照《MB1002D休闲裤贴袋机-使用说明书》、《MB1002D休闲裤贴袋机-零件手册》、《MB1002D休闲裤贴袋机-触摸屏界面操作说明》。
Minpet使用图文教程
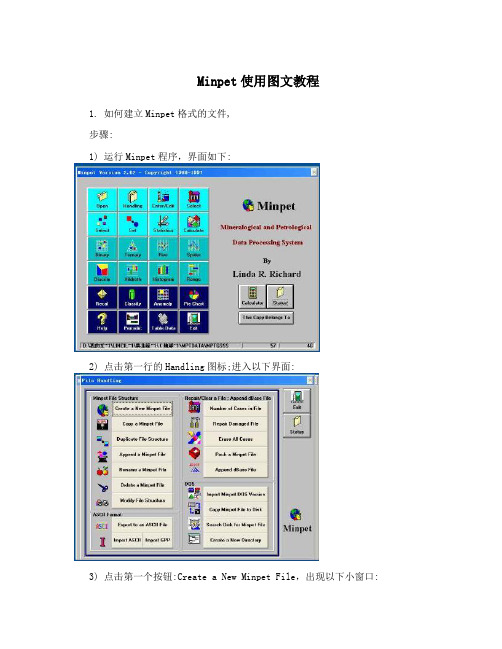
Minpet使用图文教程1. 如何建立Minpet格式的文件,步骤:1) 运行Minpet程序,界面如下:2) 点击第一行的Handling图标;进入以下界面:3) 点击第一个按钮:Create a New Minpet File,出现以下小窗口:4) 选择文件,路径:c:\20Minpet,名称:WHOLE.LIS说明:*.LIS文件是来限定Minpet文件的内容,比如一般情况下地球化学的数据,包括主量元素,微量元素和同位素等都能在WHOLE.LIS的项目里面包含。
5) 选好文件后按确定,得到如下界面:这里显示了所能导入的项目,包括Major,Trace and isotopic Data。
6) 点击“OK”,得到一个小的对话框:这里要输入*.dbf格式的文件名,相当于建立一个内部的数据库,保存的是用户的样品的数据,所以一般要选择在一定的文件夹下,以便于以后的寻找和拷贝到其他的电脑上来使用,建议保存在系统盘C盘以外的确定文件夹下,比如D:\user\MptData\。
7)做为例子,这里在目录:D:\user\MptData\下建立一个名字为MptDt1.dbf的文件,如下:7) 点击确定,回到Handling界面:8) 点击右上角的按钮“Exit”,退回到上一级界面:此时在最下面的状态栏(红色方框内)显示了刚创建的文件,总的样品数目“0”,所选择的样品数目“0”,也就是里面没有数据。
2. 如何导入数据导入数据很关键,当第一次使用Minpet程序的时候,一般用户不知道其中的文件格式以及内部各个项目的排列次序,因此要先创建一个Minpet数据导入的格式文件,方法如下: 2.1创建导入的数据文件步骤:1) 点击Handling,进入下级界面:点击Export to an ASCII File,红色方框内。
2) 出现一个对话框,如下:点击“OK”。
3) 进入新的窗体,如下:就在当前路径下,输入文件名:MptFmt.dat,如红线所划,这就是所创建的格式文件。
Henny Penny 多用途保持柜技术手册说明书

TABLE OF CONTENTSSection Page Section 1. MAINTENANCE ............................................................................................................1-1 1-1. Introduction .............................................................................................................1-11-2. Safety ......................................................................................................................1-11-3. Test Instruments ......................................................................................................1-21-4. Error Codes .............................................................................................................1-21-5. Control Board..........................................................................................................1-31-6. Power Switch .........................................................................................................1-41-7. Transformer.............................................................................................................1-51-8. Relays ......................................................................................................................1-61-9. Heating Elements ....................................................................................................1-71-10. Temperature Probe ..................................................................................................1-81-11. Drawer Gasket ........................................................................................................1-91-12. High Limit (335˚ F) ................................................................................................1-101-13. Wiring Diagrams .....................................................................................................1-11 Section 5. PARTS INFORMATION ................................................................................................2-1 2-1. Introduction .............................................................................................................2-12-2. Genuine Parts ..........................................................................................................2-12-3. How To Order .........................................................................................................2-12-4. Prices .......................................................................................................................2-12-5. Delivery...................................................................................................................2-12-6. Warranty .................................................................................................................2-12-7. Recommended Spare Parts for Distributors ............................................................2-1 106 FM06-014 iRevised 07-10-071-1. INTRODUCTION This section provides procedures for checking andreplacement of the various parts used within the cabinet.1-2. SAFETY Where information is of particular importance or is safetyrelated, the words NOTICE, CAUTION, or WARNING areused. Their usage is described below:SAFETY ALERT SYMBOL is used with DANGER,WARNING, or CAUTION which indicates a personalinjury type hazard.NOTICE is used to highlight especially importantinformation.CAUTION used without the safety alert symbolindicates a potentially hazardous situationwhich, if not avoided, may result in property damage.CAUTION used with the safety alert symbolindicates a potentially hazardous situation which, ifnot avoided, may result in minor or moderate injury.WARNING indicates a potentially hazardoussituation which, if not avoided, could result indeath or serious injury.203 1-11-3. TEST INSTRUMENTS You may use two test instruments to check the electricalcomponents.1. A continuity light.2. An ohmmeter.When the manual refers to the circuit being closed, thecontinuity light will be illuminated or the ohmmeter shouldread zero unless otherwise noted. When the manual refers tothe circuit being open, the continuity will not illuminate orthe ohmmeter will read one or infinite resistance.An ohmmeter must be used to check coils.1-4. ERROR CODESDISPLAY CAUSE PANEL BOARD CORRECTION“E-4”Control board Turn switch to OFF position, then turn switch back tooverheating ON; if display shows “E-4”, the control board isgetting too hot; make sure unit is not overheating “E-6”Faulty temperature Check to see if unit is set to the correct number ofprobe drawers, ex: “MP-942=2” drawers (see Operationand Programming Section in Operator’s Manual)“E-41”Memory scrambled Press and release the UP and DOWN buttons toinitialize the program; if “E-41” persists replace thecontrol board“Hi”Unit over-heating; Have relay or control board replacedfaulty relay orcontrol board1-2 203To avoid electrical shock or property damage,move the POWER switch to OFF and disconnectmain circuit breaker, or unplug cord at wallreceptacle.2. Remove the two screws on the front of the controlpanel and pull control drawer out (Figure 1-1).Figure 1-13. Using a 5/16" socket, remove nuts securing the boardand remove board from the panel (Figure 1-2).Figure 1-24.Remove the connectors from the control board(Figure 1-3).5. Install new control board in reverse order.Do not over-tighten the nuts securing the controlboard, or the buttons on the controls may notfunction.Figure 1-3103 1-3To avoid electrical shock or property damage,move the POWER switch to OFF and disconnectmain circuit breaker, or unplug cord at wallreceptacle.2. Remove the two screws on the front of the controlpanel and pull control drawer out.Mark the wires when removing them from the switchto be sure the switch is rewired correctly.3.Remove the wires from the switch (Figure 1-4).Check for continuity across the top and bottom Figure 1-4terminals, on both left and right side of the switch.With the switch in the ON position, the circuit shouldbe closed. With the switch in the OFF position, thecircuit should be open. If the switch is defective,replace it by continuing with this section.4.Squeeze the tabs on the back of the switch and pullthe switch out from the front of the panel(Figure 1-5).5. Install new POWER switch in reverse order.Figure 1-51-4 203To avoid electrical shock or property damage,move the POWER switch to OFF and disconnectmain circuit breaker, or unplug cord at wallreceptacle.Figure 1-6 2. Remove the two screws on the front of the controlpanel and pull control drawer out.Before pulling the control panel out on the HC-944s,remove the four screws securing the control box(Figure 1-6).bel wires and remove them from the transformer(Figure 1-7).Figure 1-74. Using a Phillips head screwdriver, remove the twoscrews securing the transformer and remove thetransformer (Figure 1-8).5. Install the new transformer in reverse order.Figure 1-8203 1-5To avoid electrical shock or property damage,move the POWER switch to OFF and disconnectmain circuit breaker, or unplug cord at wallreceptacle.Figure 1-9 2. Remove the two screws on the front of the controlpanel and pull out the control panel.Before pulling control panel out on HC-944s, removefour screws securing control box (Figure 1-9).The front relay controls the heat of the left drawer, theback relay controls the right drawer, and the middlerelays control the middle drawers.Checkout:3. With no power (24 volts) going to the relay, 120 voltsshould show on the output side of the relay, and 0volts on the input (24 volts).To avoid electrical shock, make connections beforeapplying power, take reading, and remove powerbefore removing meter leads. The followingchecks are performed with the wall circuit breakerclosed and the POWER switch in the ON position.4. With the component energized, 0 volts should showon the output side of the relay, and 12 volts on theinput side.5. If voltage varies from steps 3 and 4, remove power tounit pull input wires from relay and place leads ofmeter onto input wires. Reapply power to unit.When unit is running, if the input wires to relayshows 5vdc, the relay is faulty.1-6 203Model MP-941/942/943/9441-8. RELAYS (Continued) Replacement:6. Remove power supplied to unit.7. Label and remove wires from the appropriate relay(Figure 1-10).8. Using a Phillips head screwdriver, remove the screwssecuring the relay and remove the relay from the unit(Figure 1-11).Figure 1-109. Coat the back of the relay with the thermal jointcompound and install new relay.Failure to use the thermal joint compound willshorten the life of the relay.10. Replace control panel and unit is now ready for use.Figure 1-111-9. HEATING ELEMENTS 1. Disconnect the electrical supply to the cabinet.To avoid electrical shock or property damage,move the POWER switch to OFF and disconnectmain circuit breaker, or unplug cord at wallreceptacle.2. Remove the drawer from the appropriate liner.Figure 1-12 3. Using a 3/8” socket, remove the four acorn nutssecuring the front of the bracket (Figure 1-12).4. Using a Phillips head screwdriver, remove the sixscrews securing the bracket and remove the bracket(Figure 1-13).Model MP-941/942/943/9441-9. HEATING ELEMENTS (Continued) 5. Using a Phillips head screwdriver,remove the twoscrews securing the element to the back of the liner(Figure 1-14).6. Pull the element out towards you until the terminalsare exposed.Figure 1-147. Pull the wires off of the terminals and removeelement from the unit (Figure 1-15).To check the elements, they should show an ohmreading of 30 ohms, after the wires have beenremoved.8. Install new element in reverse order.Figure 1-151-10. TEMPERATURE PROBE 1. Disconnect the electrical supply to the cabinet.To avoid electrical shock or property damage,move the POWER switch to OFF and disconnectmain circuit breaker, or unplug cord at wallreceptacle.2.Remove the appropriate drawer.Figure 1-163. Using a flat blade screwdriver, pry the rubber strainrelief from the liner (Figure 1-16).4. Pull the probe wires out of the unit far enough toaccess the connector incased in a protective cover.5. Cut the wire ties on the ends of cover and slide theModel MP-941/942/943/9441-10. TEMPERATURE PROBE 6. Disconnect the wires at the connector.(Continued)7. Reconnect the new probe assembly to the unit andpull protective cover back over the connector, thensecure with wire ties.8. Thread the wire back through the hole and push thestrain relief back into the liner (Figure 1-17).9. Place drawer back into unit and the unit is now ready.for use.Figure 1-171-11. DRAWER GASKET 1. Remove the drawer from the unit.2. Using a Phillips head screwdriver, remove the drawerhandle by removing the two screws fastening thehandle to the drawer (Figure 1-18).Figure 1-183. Using a Phillips head screwdriver, remove the sixscrews that secure the backing plate and gasket to thedrawer front (Figure 1-19).4. Separate the drawer frame from the drawer front.5. Remove the gasket from the drawer front.Figure 1-19 6. Reassemble the drawer frame and drawer front inreverse order of disassembly. Make sure the twodrawer-handle spacers, between the drawer front andbacking plate, remain centered over the holes so thatthe handle screws pass through the spacers.Model MP-941/942/943/944 1-12. HIGH LIMIT (335 F) 1. Disconnect the electrical supply to the cabinet.To avoid electrical shock or property damage,move the POWER switch to OFF and disconnectmain circuit breaker, or unplug cord at wallreceptacle.2. Remove the drawer from the appropriate liner.3. Using a 3/8” socket, remove the four acorn nutssecuring the front of the bracket(Figure 1-12).Figure 1-20 4. Using a Phillips head screwdriver, remove the sixscrews securing the bracket and remove the bracket(Figure 1-13).5. Using a Phillips head screwdriver,remove the twoscrews securing the plate to the back of the liner(Figure 1-20).6. Pull the element out towards you until the terminalsare exposed.7. Label and pull the wires off of the terminals and highlimit remove element from the unit.8. Once the wires have been removed from the highlimit, check for continuity across the terminals. Thecircuit should be closed if the high limit is good, if itshows open, continue on to step 9 and replace highlimit.9. Using a 5/16” socket, remove the nuts securing thehigh limit and remove the high limit from the unit(Figure 1-21).10. Install new high limit in reverse order.Figure 1-211-13. WIRING DIAGRAMS1-13. WIRING DIAGRAMS (Continued)2-1. INTRODUCTION This section identifies and lists the replaceable parts of theHenny Penny Multipurpose Holding Cabinets.2-2. GENUINE PARTS Use only genuine Henny Penny parts in your cabinet.Using a part of lesser quality or substitute design may resultin cabinet damage or personal injury.2-3. HOW TO ORDER Once the part you want to order has been found in the PartsList, write down the following information:1. From the Parts List:(Sample)Item Number 1Part Number 51718Description Gasket – Drawer2. From the data plate:(Sample)Product Number 05882Serial Number 0001Voltage 120V2-4. PRICES Your independent Henny Penny distributor has a price partslist and will be glad to inform you of the cost of your partsorder.2-5. DELIVERY Commonly replaced items are stocked by your independentHenny Penny distributor and will be sent out when yourorder is received. Other parts will be ordered by thedistributor from Henny Penny Corporation. Normally,these will be sent to your distributor within three workingdays.2-6. WARRANTY All replacement parts (except lamps and fuses) are coveredunder warranty for 90 days against manufacturing defectsand workmanship. If damage occurs during shipping,notify the carrier at once so that a claim may be properlyfiled. Refer to warranty on the front of this section forother rights and limitations.2.7. RECOMMENDED Recommended replacement parts, stocked by yourSPARE PARTS FOR distributor, are indicated with in the parts lists. Please DISTRIBUTORS use care when ordering recommended parts, because allvoltages and variations are marked. Distributors shouldorder parts based upon common voltages and equipmentFigure 2-1. Shell and DrawerFIG. &ITEM QTY QTY QTY QTY NO. PART NO. DESCRIPTION 941 942 943 944 2-1 SHELL AND DRAWER1 51514 SHELL ASSY. - 941 1 - - -1 52626 SHELL ASSY. - 942 - RH - 1 - -1 52649 SHELL ASSY. - 942 - LH - 1 - -1 52650 SHELL ASSY. - 943 - RH - - 1 -1 52651 SHELL ASSY. - 943 - LH - - 1 -1 52652 SHELL ASSY. - 944 - RH - - - 11 52653 SHELL ASSY. - 944 - LH - - - 12 SC01-034 SCREWS 10 10 10 103 PL01-014 PLUG - 1 1/16” 2 3 3 14 51306 PANEL - ACCESS - RH 1 1 1 -4 51912 PANEL - RH - SIDE ACCESS - 944 - - - 1√ 5 51718 GASKET - DRAWER 1 2 3 46 49548 DRAWER ASSY. 1 2 3 47 14715 . KIT - DRAWER FRONT ASSY (1 VENT) 1 2 3 48 SC02-016 . SCREW, FRONT RETAINING 5 10 15 209 49550 . DRAWER WELD ASSY. 1 2 3 410 31395 . DRAWER HANDLE 1 2 3 411 SC01-144 . SCREW, HANDLE RETAINING 2 4 6 812 51497 . SLIDE VENT 1 2 3 413 27501 . MOLDED BLOCK - VENT 1 2 3 414 NS02-006 . NUT 3 6 9 1215 26411 FOOT 4 4 5 -16 51503 BASE ASSY. - 941 1 - - -16 53639 BASE ASSY. - 942 - RH - 1 - -16 52640 BASE ASSY. - 942 - LH - 1 - -16 52641 BASE ASSY. - 943 - RH - - 1 -16 52642 BASE ASSY. - 943 - LH - - 1 -√17 14113 BEARING KIT 1 2 3 418 51505 LINER WELD ASSY. 1 2 3 419 NS02-002 NUT 4 8 12 1620 52131 LINER - TOP STUD ASSY. 1 2 3 421 51097 PANEL - ACCESS - LH 1 1 1 -21 51912 PANEL - ACCESS - LH - - - 122* 52701 DECAL - TEMP. CALIBRATION 1 1 1 123 14458 KIT – BEARING SUPPORT 2 4 6 8√recommended parts*not shown512 2-32-4 607FIG. &ITEM QTY QTY QTY QTY NO. PART NO. DESCRIPTION 941 942 943 944 2-2 HEATER AND COVER PLATE√ 1 52100 TEMPERATURE SENSOR ASSY. 1 2 3 42 51951 BRACKET – HEATER (BEFORE SN: GA0407031) 1 23 43 SC01-034 SCREW 2 4 6 84 NS03-024 ACORN NUT 3 6 9 125 51329 DEFLECTOR – HEAT(BEFORE APRIL 1, 2001) 1 2 3 45 70793 DEFLECTOR – HEAT(APRIL 1, 2001 & AFTER) 1 2 3 4√ 6 51796 HEATER - 475 W. - 120 V. 1 2 3 4 √ 6 51932 HEATER - 475 W. - 240 V. 1 2 3 47 SC02-041 SCREW 2 2 2 28 51325 PLATE - HEATER COVER 1 2 3 4√9 18201 HIGH LIMIT - 335ºF 1 2 3 410 NS02-005 NUT 2 2 2 211 52237 COVER - TEMP. SENSOR 1 2 3 412* 51468 INSULATION - NON-CONTROL SIDE RH 1 1 1 - 12* 52689 INSULATION - LINER - CONTROL SIDE LH - 1 1 - 12* 51473 INSULATION - LINER - CONTROL SIDE RH - - - 1 12* 52691 INSULATION - LINER - CONTROL SIDE LH - - - 1 12* 51469 INSULATION - SHELL TOP 1 2 3 4 12* 51470 INSULATION - LINER - BOTTOM 1 2 3 4 12* 51471 INSULATION - LINER - REAR - LOWER 1 2 3 4 12* 51472 INSULATION - LINER - REAR - TOP 1 2 3 4 12* 51474 INSULATION - LINER - TOP 1 2 3 4 12* 52093 INSULATION - LINER - TOP 1 - - 4 12* 51475 INSULATION - CONTROL SIDE RH 1 1 1 - 12* 52690 INSULATION - LINER - NON-CONTROLSIDE LH - 1 1 - 12* 51116 INSULATION - LINER - NON-CONTROLSIDE RH - - - 1 12* 52692 INSULATION - LINER - NON-CONTROLSIDE LH - - - 1√recommended parts*not shown607 2-5Figure 2-3. Rear Panel2-6 204FIG. &ITEM QTY QTY QTY QTY NO. PART NO. DESCRIPTION 941 942 943 944 2-3 REAR PANEL3 1 51297 REAR ACCESS PANEL - 941 1 - - - 3 1 51351 REAR ACCESS PANEL - 942 - 1 - - 3 1 51947 REAR ACCESS PANEL - 943 - - 1 - 3 1 52647 REAR ACCESS PANEL STUD ASSY. - - - 1 3 2 40297 POWER CORD ASSY. 1 1 1 - 3 2 27555 POWER CORD ASSY. - 944 - - - 1 3 2 63837 POWER CORD ASSY. – CE 1 2 3 4 3 3 MS01-197 RECEPTACLE - NEMA 5-15 R 1 - - - 3 4 27639 STRAIN RELIEF 1 1 1 1 3 5 40298 PLUG - ANGLED - 125 V. - 15 AMP 1 1 1 - 3 5 27692 PLUG - ANGLED - 125 V - 20 AMP - - - 1 36 52676 MIDDLE SUPPORT BRACKET - 944 - - - 1 37 27645 KNOB - CORD WRAP – 941 (BEFORE 3-6-06) 2 - - - 38 SC01-172 SCREW (BEFORE 3-6-06) 4 - - -607 2-7Figure 2-4. Electrical Controls2-8 204FIG. &ITEM QTY QTY QTY QTY NO. PART NO. DESCRIPTION 941 942 943 944 2-4 ELECTRICAL CONTROLS1 33073 TERMINAL BLOCK – 4 POLE 1 1 1 12 SC01-053 SCREW 3 3 3 33 NS02-007 NUT 3 3 3 34 51925 CONTROL BRACKET WELD ASSY. - - - 1√ 5 52755RB PC BOARD ASSY. – GEN. MKT. 1 1 1 1 √ 5 51102RB PC BOARD ASSY. –WENDY’S 1 1 1 16 NS02-005 NUT 4 4 4 47 51924 CONTROL PANEL STUD ASSY. - - - 17 51545 CONTROL PANEL STUD ASSY. 1 2 3 -8 SC04-003 SCREW 2 2 2 29 51463 DECAL - CONTROL - 941 - WENDY’S 1 - - -9 52695 DECAL - CONTROL - 941 - GEN. MKT. 1 - - -9 52699 DECAL - CONTROL - 941 - DAIRY QUEEN 1 - - -9 51560 DECAL - CONTROL - 942 - WENDY’S- 1 - -9 52696 DECAL - CONTROL - 942 - GEN. MKT. - 1 - -9 51561 DECAL - CONTROL - 943 - WENDY’S- - 1 -9 52697 DECAL - CONTROL - 943 - GEN. MKT. - - 1 -9 51464 DECAL - CONTROL - 944 - WENDY’S- - - 19 52698 DECAL - CONTROL - 944 - GEN. MKT. - - - 1√10 72277 SWITCH - POWER DPST SPLASH PROOF 1 1 1 1 √10 52224 POWER SWITCH – CE 1 1 1 111 EF02-072 BUSHING - SPLIT 1 1 1 112 EF02-040 BUSHING - SNAP 1 1 1 1√13 40645 RELAY 1 2 3 414 SC04-003 SCREW 2 2 2 2√15 28979 TRANSFORMER - 208/240 V. 1 1 1 1 √15 30978 TRANSFORMER - 120 V. 1 1 1 116 SC01-034 SCREW 2 2 2 217 NS02-007 NUT 2 2 2 2√18* 51390 EMC FILTER – CE 1 1 1 1 √18* FA53-005 FUSE – CE 1 1 1 1 √19* EF02-114 FUSE HOLDER 1 1 1 1√recommended parts*not shown607 2-9Figure 2-5. Paper Tray2-10 204FIG. &ITEM QTY QTY QTY QTY NO. PART NO. DESCRIPTION 941 942 943 944 2-5 PAPER TRAY1 NS-02-007 NUT - - - 122 52854 PANEL - BOTTOM ACCESS - - - 13 52845 BRACKET – PAPER TRAY - - - 44 05940 3 PAPER TRAY –WENDY’S- - - 25 SC01-153 SCREW - - - 126 05941 2 PAPER TRAY –WENDY’S- - - 2 204 2-11。
分钟人 EX12 地毯清洁机使用说明书

Parts and Instruction ManualThis manual is furnished with each new MINUTEMAN EX12 . This provides the necessary operating and preventive maintenance instructions. Operators must read and understand this manual before op-erating or servicing this machine.This machine was designed to give you excellent performance and efficiency. For best results and minimal cost, please follow the general guidelines below:· Operate the machine with reasonable care.· Follow the manufacturers suggested maintenance instructions as provided in this booklet.· Use original Minuteman supplied parts.TECHNICAL SPECIFICATIONS ModelEX 12 EX12H 121153 Stage 100 cfm100 psi N/A 12 gal.50’ (15m) 12-312” (30.5cm)5” (13cm)99 lbs (45kg)19” (48cm)30” (76cm)48” (122cm)Model No.Vac Motor Pump Heater Capacity Cord(s)Wheels Casters Weight Length Width Height12115H 3 Stage 100 cfm250 psi2000 watt - 210° Max Temp12 gal.(2) 50’ (15m) 12-312” (30.5cm)5” (13cm)118 lbs (53.5kg)19” (48cm)30” (76cm)48” (122cm)Table of ContentsSafety Precautions (1)Grounding Instructions (1)Safety Labels (2)Electrical Requirements (2)Machine Components (2)Machine Set Up (3)Operation (4)Draining Recovery Tank (4)Machine Maintenance (4)Maintenance (4)Weekly Maintenance (4)Troubleshooting (5)Storing Machine (5)Exploded Views (7)EX12 - Base Assembly (7)EX12 - Solution Tank Assembly (8)EX12 - Recovery Tank Assembly (9)EX12 - Bill Of Materials (10)EX12H - Base Assembly (11)EX12H - Solution Tank Assembly (12)EX12H - Recovery Tank Assembly (13)EX12H - Bill Of Materials (14)Minuteman International Made Simple Commercial Limited Warranty (15)4. Before leaving or servicing machine:-Turn off machine.-Unplug cord from wall outlet.5. When servicing machine:-Unplug cord from wall outlet.-Avoid moving parts.-Do not wear loose jackets, shirts, or sleeves.-Use manufacturer supplied or approved replacement parts. WARNING: Hazardous Voltage. Shock or electrocution can result. Always unplug machine before servicing.WARNING: Flammable materials cancause an explosion or fire. Do not use flammable materials in tank(s).WARNING: Flammable materials orreactive metals can cause an explosion or fire.Machine must be grounded. If it shouldmalfunction or breakdown, grounding provides a path of least resistance for electrical shock. This machine is equipped with a cord having anequipment-grounding conductor and grounding plug. The plug must be plugged into anappropriate outlet that is properly installed in accordance with all local code and ordinances.Do not remove ground pin; if missing, replace plug before use.Grounding InstructionsThis machine is intended for commercial use. It is designed to clean carpet and upholstery in an indoor environment and is not constructed for any other use. Use only recommended cleaning solutions and accessory tools.All operators must read, understand and practice the following safety precautions.The following safety alerts symbols are used throughout this manual as indicated in their description:WARNING: To warn of hazards or unsafe practices which could result in severe personal injury or death.FOR SAFETY: To identify actions which must be followed for safe operation of equipment.The following information signal potentiallydangerous conditions to the operator or equipment:FOR SAFETY:1. Do not operate machine:-Unless trained and authorized.-Unless operator manual has been read and understood.-In flammable or explosive areas.-Unless cord is properly grounded.-With damaged cord or plug.-If not in proper operating condition.-In outdoor areas.-In standing water.-With the use of an extension cord.2. Before operating machine:-Make sure all safety devices are in place and operate properly.3. When using machine:-Do not run machine over cord.-Do not pull machine by plug or cord.-Do not pull cord around sharp edges or corners-Do not unplug by pulling on cord.-Do not stretch cord.-Do not handle plug with wet hands.-Keep cord away from heated surfaces.-Report machine damage or faulty operation immediately to your distributor.-Follow mixing and handlinginstructions on chemical containers.Electrical RequirementsThe safety labels appear on the machine in various locations. Replace labels if they become damaged or cannot be read.WARNING: Flammable materials can cause an explosion or fire. Do not use flammablematerials in tank(s). Flammable materials or reactive metals can cause explosion or fire.ABCDPre-Operation1. Vacuum carpet and remove other debris.2. Perform MACHINE SETUP procedures.3. Inspect power cord for damage.1. Carefully check carton for signs of damage. Report damage at once to freight carrier. The machine is shipped fully assembled and is ready for use.2. Open lid of solution tank. Fill solution tank with water or approved cleaning agent.WARNING: Flammable materials cancause an explosion or fire. Do not use flammable solutions or materials in tank(s).FOR SAFETY: When using machine, follow mixing and handling instructions on chemical containers.ATTENTION: If using powdered cleaning chemicals, mix prior to adding.3. Attach solution hose. (Located front of machine.)NOTE: Make sure the quickdisconnects snap together firmly. As you do this, always inspect hoses for cracks or fraying. Do not use if hoses are damaged.4. Attach other end of solution hose to wand.5. Attach vacuum hose to recovery tank.6. Plug machine’s cord into a grounded wall outlet.FOR SAFETY: Do not operate machine unless cord is properly grounded.FOR SAFETY: Do not operate machine with the use of an extension cord.Set Up7. Connect solution hose and make sure it is firmly secured.8. Turning machine on:A. Turn pump switch on.B. Pull up on wand lever to release air in the line. Hold lever until you have a steady flow of water coming out of the wand.C. Once pump is primed and you have pressure in the solution line, turn on heater switch(s) and wait a few minutes for water to heat up.NOTE: For best results leave pump and heater switch on for approximately 10 minutes before using as a pre-heat cycle.Also, the heater may be run in either 1000W or 2000W mode by rocking the switch up and down.D. Once water is heated, turn on vacuum motors and begin cleaning.To keep machine in good working condition, simply follow machine’s daily and weekly maintenance procedures.FOR SAFETY : When servicing machine, unplug cord from wall outlet.DAILY:1. Empty and rinse out solution tank thoroughly.2. Wipe off power cord and check for damage, replace if necessary. Coil cord neatly after use.3. Clean machine with an all purpose cleaner and damp cloth.(EVERY 20 HOURS OF OPERATION)1. Flush solution system with a system maintainer to dissolve normal chemical buildup.a. Pour 7.5L (2 gal) of hot water 60°C (140°F) into solution tank. Add system maintainer according to mixing instructions on bottle FOR SAFETY: When using machine,follow mixing and handling instructions on chemical containers.b. Operate machine for one minute.c. Shut off machine and allowremaining solution to break down chemical buildup overnight.d. Next day, spray out remaining solution and flush system with 11L (3gal) of clean water.2. Inspect vacuum hoses for holes and loose cuffs.3. Inspect spray pattern for clogging. If clogged, remove spray tips and soak them in arecommended liquid neutralizer for up to six hours. To remove spray tip, twist spray tip body counter-clockwise. Do not use pointed objects to unplug tips, damage will occur.4. Lubricate wheels with water resistant oil.5. Inspect machine for water leaks and loose hardware.6. Remove float shut-off screen from recovery tank and clean.WARNING: Flammable materials orreactive metals can cause an explosion or fire.Do not pick up.1. Work away from outlet and power cord to prevent cord damage.2. Use a recommended foam control solution in the recovery tank to prevent vacuum motor damage. Periodically check for excessive foam buildup in solution tank.3. To clean heavily soiled areas, repeat cleaning path from different direction.4. When ball float shuts off vacuum, it is time to empty the dirty water from the recovery tank, and refill solution tank.NOTE: When cleaning upholstery, always check cleaning instructions sewn in furniture by manufacturer5. After cleaning, relieve water pressure from tool before disconnecting hose. Squeeze trigger for five seconds after turning main power switch off.FOR SAFETY : When servicingmachine, unplug cord from wall outlet.1. Turn machine off and unplug power cord.2. Remove solution & vacuum hose3. Lift up drain valve lever to empty solution tank.Operation Draining Recovery TankMachine MaintenanceWeekly MaintenanceMaintenanceStoring MachineTroubleshooting1. Before storing machine, be certain to completely drainandrinse tanks of all water and solution.2. Drain and dry the vacuum hose as well, using the drain hose provided3. Store machine in a dry area in the upright position.4. Open recovery tank cover to promote air circulationSYMPTOM:UNIT WILL NOT TURN ON:PROBLEM:Not plugged in.SOLUTION:Plug machine in proper outlet.PROBLEM:Circuit breaker has popped.SOLUTION:Reset circuit breaker. Make sure no other items are running on the same circuit as machine. Outlet must be a 15-amp circuit.PROBLEM:Wire from power cord has become disconnected from terminal block.SOLUTION:Reattach wire to terminal block.SYMPTOM:PUMP IS NOT RUNNING PROPERLY:PROBLEM:Quick disconnects are not completely locked together.SOLUTION:Snap quick disconnects firmly together.PROBLEM:The solution tank is empty.SOLUTION:Fill the solution tank up with a premixed detergent.PROBLEM:Jet on upholstery tool is clogged.SOLUTION:Clean jet with soft wire brush or remove jet and flush clean.PROBLEM:Filters are clogged.SOLUTION:Remove filters and rinse clean with water.PROBLEM:Heater is blocked with hard water deposits.SOLUTION:Flush out heaters with system maintainers. If they are still blocked, replace heaters.PROBLEM:Brass check valve is stuck.SOLUTION:Replace with new check valve.PROBLEM:Pump wire has become disconnected.SOLUTION:Reconnect wire.PROBLEM:Switch on switch plate is bad.SOLUTION:Replace switch.PROBLEM:Pump motor brushes are worn out.SOLUTION:Replace pump.SYMPTOM:HEATER IS NOT WORKING PROPERLY:PROBLEM:The back up sensor, mounted on the heater has popped. SOLUTION:Reset sensor by pushing in button.PROBLEM:Heating element is bad.SOLUTION:Replace element.SYMPTOM:VACUUM MOTOR IS NOT WORKING PROPERLY: PROBLEM:Hose not connected tightly to upholstery tool or machine. SOLUTION:Connect hose tightly.PROBLEM:Drain valve is not shut completely.SOLUTION:Close drain valve completely.PROBLEM:Vacuum tank lid is not on tightly.SOLUTION:Secure the vacuum tank tightly.PROBLEM:Ball float is shut off.SOLUTION:Empty the vacuum tank of all wastewater.PROBLEM:Water is coming out of vacuum motor.SOLUTION:Use a low foaming detergent.PROBLEM:Floor wand or is clogged with hair, carpet fibers and or debris. SOLUTION:Clean floor wand.PROBLEM:Ball float is not installed correctly.SOLUTION:Make sure that ball float is firmly installed on the elbow.EX12 - Base AssemblyBill Of Material - EX12Item Part No.Qty.Description Item Part No.Qty.Description11210522 cap, axle, 1/2" 401211552 bolt, 1/4-20 x 1-1/4" hex head21210592 wheel, 12" 411211192 Bracket, L 070-03631211676 washer, axle, cut 1/2" id 421212091 sol tank, speedster41210661 axle, 1/2" x 18-1/2", sp, breeze 431210751 bracket, rear, fb/spy512116212 nut, lock, 1/4-20, nylon insert 441211606 washer, 1/4" lock, s/s612115716 washer, 1/4" flat, s/s 451210762 knob, thumb screw, for bracket71211758 bolt, 1/4-20 x 1" hex head, s/s 461210181 elbow, brass, 90 deg, 3/8"mpt x 3/8" fmpt 81210732 caster, 5" 471211732 washer, 11/16"id x 1-1/2"od x .075, s/s91212081 base, speedster 481210201 nipple, brass, 3/8" x close101210612 guard, cooling fan, wire 491210191 bushing, brass, 1/2"mpt x 3/8" fpt, hex 111212038 screw, #10 x 5/8" hex head, zinc 501210121 filter, strainer, 1/2"121211631 nut, lock, 1/2" steel 511210681 bracket, front hinge, sp/fb131210531 fitting, strain relief, cord 521212022 bolt, 1/4-20 x 1-1/2" hex head, s/s141210321 power cord, end, 25', 14/3 grey 531210052 elbow, brass, 90 deg, 1/4"mpt x 1/4" fpt 151211812 bolt, 1/4-20 x 3/4" serrated hex flange, zinc 541211594 washer, 9/16"id x 1"od, flat, s/s161211171 plate, single manifold, 6.5" x 9" 551210081 nipple, brass, 1/4"m, hex171212111 manifold, single vac 561211491 hose, 3/8" x 17-1/2", (OAL), f x -fsw, surge, 1600psi 181211545 bolt, 1/4-20 x 1/2" hex head, zinc 571211772 washer, nylon, 9/16id x 1-1/16od x .031 191210381 gasket, vacuum motor 581210071 nipple, brass, 1/4" x close201211253 v ac support, 3 stage, 4-1/16" 591210101 adapter, brass, extender, 1/4" mpt x 1/4" fpt, hex 211211829 bolt, 1/4-20 x 1/2" serrated hex flange, zinc 601210041 qd, brass, 1/4" f221210211 v ac motor, 3 stage, 115V, tangential 611210691 float, 2", ball style231210421 exhaust boot, plastisol 621210771 elbow, 2" float241211261 cuff, 2" 631211351 pipe, pvc, 2"251211921 v ac hose, 2", wire reinforced 641211371 adaptor, pvc 2, fmsl x fmt261210512 clamp, hose, 2-1/4 DIA 651212002 gasket, 2" inlet polyethylene, 3" OD 2.35" ID 271211961 sol hose, 1/4" x 24 1/2", (OAL), f x fsw, 3000psi 661210551 spout, drain, 45 degree281210141 elbow, brass, 90 deg, 1/4" mpt x 1/4" mpt 671210541 valve, drain, 1-1/2"291210061 bushing, brass, 3/8"mpt x 1/4" 681212101 vac tank, speedster301210161 adapter, brass, 1/2" barb x 3/8" fsw, ball end 691211382 inlet, 2"311210171 elbow, brass, 90 deg, 1/2" barb x 3/8"mpt 701210722 washer, #8 flat, s/s321210642 clamp, hose, 5/16-29/32 711211762 screw, #10-32 x 1/2" SHCS, alloy331211901 sol hose, 1/2" kuri 100psi 721210631 plate, switch, sp, 3 hole341211694 nut, kep, #10-32 zinc 731210282 switch, rocker, 2 position351211644 screw, #10-32 x 1-1/4" phil pan head, zinc 741212171 gasket, vac lid, 6.5" i.d 7.5" o.d361210221 pump, 100psi, demand, 115V 751210441 lid, vac tank, black, 7"371211612 nut, hex, 1/4-20 s/s 761211746 screw, #8 x 5/8 phil oval, s/s381211584 washer, 1/4"id x 1"od, flat, s/s 771211141 gasket, 2" inlet391210414 washer, buna 1-1/8" od x 3/16" id 781211941 elbow, inlet assembly 2"BILL OF MATERIAL - EX12HITEM PART NO.QTY.DESCRIPTION ITEM PART NO.QTY.DESCRIPTION1 1211632 NUT-LOCK 1/2" STEEL 52 1211253 SUPPORT-VAC 3 STAGE 4-1/16"2 121053 2 FITTING-STRAIN RELIEF CORD 53 121182 9 BOLT-SERRATED 1/4-20 X 1/2"3 121032 2 CORD-POWER END 25' GRY 54 121021 1 MOTOR-VAC 3 STAGE 115V TANG4 121052 2 CAP-AX LE 1/2" 55 121042 1 EX HAUST BOOT-PLASTISOL5 121059 2 WHEEL-12" 56 121126 1 CUFF-HOSE 2 X 2 WIRE REINFORCED6 121167 6 WASHER-AX LE CUT 1/2" ID 57 121192 1 HOSE-VAC 2" WIRE REINFORCED7 121066 1 AX LE-SP 1/2" x 18-1/2" 58 121051 2 CLAMP-HOSE 2-1/4 DIA8 121208 1 BASE-SPEEDSTER BURGUNDY 59 121209 1 TANK-SOLUTION SPEEDSTER BURGUNDY9 121162 12 NUT-LOCK 1/4-20 NYL INSERT 60 121161 2 NUT-HEX 1/4-20 S/S10 121157 16 WASHER-FLAT 1/4" S/S 61 121160 6 WASHER-LOCK 1/4" S/S11 121175 8 BOLT-HEX HEAD 1/4-20 X 1" S/S 62 121158 4 WASHER-FLAT 1/4" ID X 1" OD S/S12 121073 2 CASTER-5" 63 121041 4 WASHER-BUNA 1-1/8" O.D. x 3/16"13 121023 1 FAN-COOLING 115V 64 121155 2 BOLT-HEX HEAD 1/4-20 X 1-1/4"14 121061 3 GUARD-COOLING FAN WIRE 65 121119 2 BRACKET-"L"15 121203 8 SCREW-HEX HEAD #10 X 5/8" ZINC 66 121075 1 BRACKET-REAR FB/SP16 121152 1 REGULATOR-200 PSI 67 121076 2 KNOB-THUMB SCREW FOR BRACKET17 121064 8 CLAMP-HOSE 5/16-29/32 68 121159 8 WASHER-FLAT 9/16" ID X 1" OD18 121226 1 sol hose, kuriyama, 3/8" 69 121010 3 ADAPTER-BRASS EX TENDER 1/4"19 121227 2 adapter, brass, 3/8" barb x 1/4" fsw 70 121018 1 ELBOW-BRASS 90 DEG 3/8" MPT20 121169 6 NUT-#10-32 ZINC 71 121173 2 WASHER-11/16" ID X 1-1/2"OD X .075 S/S21 121168 2 SCREW-PHIL PH #10-32 X 3/4" 72 121020 1 NIPPLE-BRASS 3/8" x CLOSE22 121228 1 bracket, heater mounting, dual 73 121019 1 BUSHING-BRASS 1/2" MPT x 3/8"23 121074 2 HEATER-ALUMINUM CAST SINGLE 74 121012 1 FILTER-STRAINER 1/2"24 121095 1 HEATING ROD-600 WATT 115V 75 121068 1 BRACKET-FRONT HINGE SP/FB25 121030 1 HEATING ROD-1000W 115V 76 121202 2 BOLT-HEX HEAD 1/4-20 X 1-1/2" S/S26 121035 2 THERMOSTAT- 200 DEG AUTO 1/4" V 77 121008 1 NIPPLE-BRASS 1/4" M HEX27 121229 8 screw, #6 x 3/16, phil pan head, self-tapping 78 121149 1 HOSE-3/8" X 17-1/2" (OAL)28 121036 2 THERMOSTAT-310 DEG F +/- 10 DEG F MAN 79 121177 2 WASHER-9/16 ID X 1-1/16 X .031 NYLON29 121005 8 ELBOW-BRASS 90 DEG 1/4" MPT 80 121004 1 QD-BRASS 1/4" F30 121151 1 HOSE- 3/8" X 6", (OAL) 81 121069 1 FLOAT-BALL STYLE 2"31 121011 1 TEE-BRASS 1/4" FPT 82 121077 1 ELBOW-2" FLOAT32 121007 4 NIPPLE-BRASS 1/4" x CLOSE 83 121135 1 PIPE-2" PVC33 121149 1 HOSE-3/8" X 17-1/2" (OAL) 84 121137 1 ADAPTOR-2" FMSL x FMT PVC34 121230 1 hose, 3/8" x 9" (OAL), f x f, surge, 1600psi 85 121200 2 GASKET-2" INLET POLYETHYLENE 3" OD 2.35" ID35 121164 4 SCREW-PHIL PH #10-32 X 1-1/4" ZINC 86 121054 1 VALVE-DRAIN 1-1/2"36 121024 1 PUMP-250 PSI BYPASS 115V 87 121055 1 SPOUT-DRAIN 45 DEG37 121231 1 plug, brass, 1/4"mpt, hex 88 121002 1 ELBOW-INLET ASSY 1-1/2"38 121131 1 VALVE-PRIME HIGH PRESSURE 89 121114 1 GASKET, 2" INLET39 121232 1 adapter, brass, 3/8" barb x 1/4"mpt 90 121044 1 LID-VAC TANK 7" BLACK40 121233 1 sol hose, kuriyama, 3/8" 91 121174 6 SCREW-PHIL OVAL #8 X 5/8 S/S41 121014 1 ELBOW-BRASS 90 DEG 1/4" MPT 92 121217 1 GASKET-VAC LID 6.5" ID 7.5" OD42 121234 1 adapter, brass, 1/2" barb x 1/4" mpt 93 121056 1 FITTING-INLET PVC 1-1/2"43 121212 1 HOSE-SOLUTION 1/2" KURI 100 PSI 21" 94 121025 2 LIGHT-RED 250V44 121104 1 FILTER CUP IN-LINE 95 121029 1 SWITCH-ROCKER 3 POSITION45 121235 1 sol hose, 1/2" kuri 100psi 96 121028 2 SWITCH-ROCKER 2 POSITION46 121016 1 REDUCER-BRASS SWIVEL BALL 97 121026 1 LIGHT-INDICATOR 125V AMBER47 121181 2 BOLT-SERRATED 1/4-20 X 3/4" 98 121176 2 SCREW-SHCS #10-32 X 1/2" ALLOY48 121117 1 PLATE-SINGLE MANIFOLD 6.5" 99 121072 2 WASHER-FLAT #8 S/S49 121154 5 BOLT-HEX HEAD 1/4-20 X 1/2" 100 121138 1 INLET-2"50 121211 1 MANIFOLD-SINGLE VAC 101 121065 1 PLATE-SWITCH SP 4 HOLE51 121038 1 GASKET-VAC MOTOR 102 121210 1 TANK-VAC SPEEDSTER BURGUNDYMinuteman International Made Simple Commercial Limited WarrantyMinuteman International, Inc. warrants to the original purchaser/user that the product is free from defects in workmanship and materials under normal use. Minuteman will, at its option, repair or replace without charge, parts that fail under normal use and service when operated and maintained in accordance with the applicable operation and instruction manuals. All warranty claims must be submitted through and approved by factory authorized repair stations.This warranty does not apply to normal wear, or to items whose life is dependent on their use and care, such as belts, cords, switches, hoses, rubber parts, electrical motor components or adjustments. Parts not manufactured by Minuteman are covered by and subject to the warranties and/or guarantees of their manufacturers. Please contact Minuteman for procedures in warranty claims against these manufacturers.Special warning to purchaser -- Use of replacement filters and/or prefilters not manufactured by Minuteman or its designated licensees, will void all warranties expressed or implied. A potential health hazard exits without original equipment replacement.All warranted items become the sole property of Minuteman or its original manufacturer, whichever the case may be.Minuteman disclaims any implied warranty, including the warranty of merchantability and the warranty of fitness for a particular purpose. Minuteman assumes no responsibility for any special, incidental or consequential damages.This limited warranty is applicable only in the U.S.A. and Canada, and is extended only to the original user/purchaser of this product. Customers outside the U.S.A. and Canada should contact their local distributor for export warranty policies. Minuteman is not responsible for costs or repairs performed by persons other than those specifically authorized by Minuteman. This warranty does not apply to damage from transportation, alterations by unauthorized persons, misuse or abuse of the equipment, use of non-compatible chemicals, or damage to property, or loss of income due to malfunctions of the product.If a difficulty develops with this machine, you should contact the dealer from whom it was purchased.This warranty gives you specific legal rights, and you may have other rights which vary from state to state. Some states do not allow the exclusion or limitation of special, incidental or consequential damages, or limitations on how long an implied warranty lasts, so the above exclusions and limitations may not apply to you.Cord Electric Group………. Three years parts, two years labor, ninety days travel (Not to exceed two hours) Exceptions………. Port-A-Scrub, one year parts, six months laborMPV 13, one year partsMPV 14 and 18, two years parts, one year laborRapidAir blower, one year parts, one year laborExplosion-Proof Vacuum, one year parts, one year laborPneumatic Vacuums, three years parts, one year laborEX 12 and EX12H, one year parts, one year laborBattery Operated Group….. Three years parts, two years labor, ninety days travel(Not to exceed two hours)Exceptions……Sweepers, one year parts, one year labor, ninety days travel(Not to exceed two hours)Internal Combustion Group….One year parts, one year labor, ninety day travel(Not to exceed two hours)Replacement Parts……………..Ninety daysBatteries………………………….0-3 months replacement, 4-12 months pro-ratePolypropylene Plastic Tanks…Ten years, no additional labor111 South Rohlwing Road · Addison, Illinois 60101 USAPhone 630- 627-6900 · Fax 630- 627-1130E-Mail, 。
魅玛轻型迷你PTZ控制器RM-LP5用户手册说明书

Mini PTZ Controller RM-LP5User ManualParameters & Specs Communication & Control Interface Camera Control or Operation Control Signal FormatPower Supply and ConsumptionPhysical & Others Description of Button & Knob FunctionInterface Function and Connection Diagram Upgrade Interface RS422/RS485 Interface RS232 Interface LAN Interface12V DC Power InterfaceSystem Menu Operation Instructions System Menu Function Explanation Keyboard System Menu System Setting Comm Setting Ethernet SettingPassword SettingSystem Menu Guide Products DimensionsContent2 2 2 2223 7 7788910 10 10 10 11 11 12 12 13④⑤⑪⑮①This Rotation Knob which was to adjustment the Camera Exposure Parameter or Red Gain Value, Turn Right Rotation was to changed the valued Increased, Turn Left Rotation was changed the Valued Decreased.②This Rotation Knob which was to adjustment the Camera Exposure Parameter or Blue Gain Value, Turn Right Rotation was to changed the valued Increased, Turn Left Rotation was changed the Valued Decreased.③This Rotation Knob which was to adjustment the Camera Exposure Parameter, Turn Right Rotation was to changed the valued Increased, Turn Left Rotation was changed the Valued Decreased.④LED Display, Real-time display of items and parameter values of adjusted by " knob ①".⑤LED Display, Real-time display of items and parameter values of adjusted by " knob ②".⑥LED Display, Real-time display of items and parameter values of adjusted by " knob ③".⑦Zoom Bridge KeyIt is used to control the camera to Zoom In/Out, for example, press the TELE end of the bridge key, the camera will Zoom in the TELE direction object, When you Press with more Large Pressure, then the Zoom Speed changed more Faster.⑧ Focus Function ZoonWhen the Backlight of [AUTO]Button is Light up, it means that the current focusing mode is the automatic; When the Backlight of [AUTO] Button is Light Off, it means that Current Focus Mode is changed to Manual. User can Press this button to switch the mode.[OPT key] is used to trigger the single focus of the camera.At the same time, the camera enters the one-shot auto focus mode.⑨PTZ Speed Adjustment KnobThis knob is used to adjust the speed of Camera Pan, Tlit and Zoom, with a total of 7 gears.The Current Gear will be display at Led Display. The Gear Value is more small then the pan/tilt rotation speed or the zoom speed of the camera controlled by the keyboard will be more Slowly.⑩ 2-Aixs JoystickThe joystick supports control camera to Up/Down, Left and Right movement. When the camera or keyboard menu is opened, the joystick is used to control the menu cursor Up/Down,Left/Right movement and modify parameters.⑪ Channel Button Zone[ CAM1 ] to [ CAM5 ] are shortcut keys for camera channels, which can be Freely switched and selected according to your need. When you select any camera channel, the backlight of the corresponding camera channel will be light up in green, and all the parameters and settings of the keyboard will be changed to the current Channel.Note: The communication parameters (address ID, protocol, baud rate, IP address, port number, etc.) of each channel can be set individually.Support mixed use of multiple protocols through different channel.⑫ Presets Function Zone●[ Number Keys ]SETING PRESETS :Long Press and hold the number key for 2 seconds (such as [Number key 1], when the screen displays "Set Preset 1” means that preset 1 has been saved) CALL PRESETS :Short press the preset number to be call Presets, (for example, [Number key 1],when you press the [Number key 1]the screen displays "Show Preset 1", it means that preset 1 has been call).●[ RESET Key ]TO BE CLEAR THE PRESET SETTINGPress[RESET key]+[Number key]to clear the preset position setting. After pressing the [RESET key], the green backlight starts to flash, Then press the preset number that needs to be cleared, (for example,[RESET]+ [Number key 1], at this time, the green Backlight of button of the [RESET key]stops flashing, and at the same time, “Reset Preset 1” is displayed on the screen, which means that preset 1 has been cleared.⑬ FOCUS KnobThis Knobs is using to adjustment camera’s focal length, Rotation right direction is adjustment focus length near, Rotation Left direction is adjustment focus length Far; (When User using this function, the keyboard’s Focus mode will be changed to Manual, It wasn’t available on AUTO Mode).⑭ Function Key Zone●[Menu Key]This key is to Turn ON/OFF Camera Menu, Long Press with 3secs will turn on Keyboard system Menu.●[AE MODE Key]This key is used to change the automatic exposure mode of the camera. Each time is pressed, the camera changes to different exposure mode. Under in difference of exposure mode, the corresponding functions of Knob 1, Knob 2 and Knob 3 are different. It is shown in real time on the display at the right of the knob.● [ WB MODE Key ]This Key is used to changed the White Balance of the camera. Each Time is pressed, the camera will be changed to different WB Mode.Under in difference ofWB mode, the corresponding functions of Knob 1, Knob 2 are different.The specific functions of the knobs are shown in Table 2:●[ Fn Keys ]This key is reserved for adding custom functions.The factory default state is: short press this key to send the command to enter theSub-menu of the camera, long press this key for 3 seconds to back Home Position of Camera.⑮ LED DISPLAYIt is used to display the current status information & Setting information of the keyboard in real time (including IP address, Port number, serial port address, communication protocol, Baud Rate and other information) and keyboard menu,the brightness of the display can be set through the keyboard menu.White Balance ModeKnob 1Knob 2AutoNOT USED NOT USED Manual Red GainBlue GainTable 2The interface is for upgrade of Hardware of keyboard by Laptop. Using Micro USB Cable direct connection with PC, And Upgrade by our upgrade tools software.This Interface is using to Connection with Camera by RS422 or RS485,detail connection diagram as follows pictures:③ RS232 InterfaceThis Interface is using to connection with Camera through RS232, detailThe LAN Interface is using for connection with Network switch or others.Network PTZ Camera, detail connection diagram as follows:●This interface is the Power supply interface, you can direct connection it with Power adapter; please don’t using non-original Power adapter.⑤ DC Power Supply Interface● Connect with multiple cameras by LAN interface detail connection diagram as follows:(When connecting multiple cameras, you need to set the IP of each camera separately1.Long Press [ MENU ] with 3secs will turn on Keyboard system Menu;2.The joystick swings up and down: control the system menu cursor to move up and down / change the parameters of the current menu item;3.The Joystick swings Right: enter the current menu item / save and exit the current menu item;4.The Joystick swings Left: Exist current Menu item/ No Saved and Exit current Menu item;5.Press [ MENU ]to exist System Menu;6.Press the number keys[0]~[9]: input numerical value (only valid for menu items that need to input numerical value). example IP Address or Port number setting.7.When the current value is number input, the green backlight of [CAM1]~[CAM5] is Light on, and at this time [CAM1]~[CAM5] Corresponds to the numbers 6~0 on the silk screen above the buttons.SYSTEM MENU 1.Long Press [ MENU ] with 3 secs will turn on Keyboard system Menu.2.The joystick swings up and down to control the menu cursor to move up and down SYSTEM SETTING The joystick swings up and down the Cursor to [ System Setting ], then Movement right to enter System Setting menu.● [ Language ]The Joystick swings up/down to [Language], then Movement right to enter setting. The Joystick swing up/down can changed the current Parameters setting, Swing the joystick to the right to save the current parameters and exit the language settingstate. The following menus operate setting is same.Optional Language: Chinese, English; other languages can be customized and developed according to customer needs.● [ LED Display Brigtness ]Change the brightness of the LED display: Low, Normal, High.● [ Automatically Standby ]Set the keyboard to automatically enter standby mode without any operation within a limited time.Select-able: Off, 1 minute, 2 minutes, 5 minutes, 10 minutes, 20 minutes, 30 minutes, 60 minutes.● [ Itself IP ]To setting Keyboard itself IP Address / Port Number, default IP is 192.168.1.88, default Port 52381.System Menu Operation & Explanation 1. System Setting 2. COMM Setting 3. Ethernet Setting 4. Password Setting1. Language : English2. LED Display Brigtness: Normal3. Automatically Standby: Off4. Itself IP: 192.168.001.0885. Itself Port: 523816. Factory default Setting7. About Keyboard●[ Factory default Setting ]To change the Keyboard restore to Factory default setting.● [ About Keyboard ]To review the relevant information of the keyboard, including: keyboard model, Firmware version, factory S/N and other information.●[ Address ]To set the serial communication address of the corresponding channel.If the current communication protocol is VISCA, the communication address can be selected from 1~7. If the current communication protocol is PELCO-D/P,The communication address can be selected from 1~255.●[ Baud Rate ]To set the serial communication Baud Rate of the corresponding channel.Available in: 2400, 4800, 9600, 19200, 38400bps.●[ Protocol ]To set the Serial communication Protocol of the corresponding channel ( Including Serial Communication Protocol and Internet Communication Protocol).Available in: VISCA, PELCO P/D, UDP .ETHERNET SETTINGTo move the cursor to [ Ethernet Setting ], then Movement right to enter Ethernet Setting:●[ Channel ]The available channels CAM1~5 correspond to the buttons [CAM1]~[CAM5].●[ Cam IP ]To set the Cam IP of the corresponding channel, which can be directly input through the number keys. When the number of input digits reaches 3, the cursor will automatically Jump to the next entry.●[ Port ]To set the UDP Port of the corresponding channel, it depend for the UDP Port 1. Channel: CAM1 2. Cam IP: 192.168.1.1623. Port: 52381PASSWORD SETTINGTo move the cursor to [ Password Setting ], then Movement right to enter Password :●[ Using Password ]How to Using the Password Function:To changed the Password setting is Enable;When the password function is Enable, a password is required to enter the menu.The default password is: 8888●[ Modify Password ]The user can change the password by himself. If the password is not changed, the password is the default password.Warning: Please use this function with caution. If the product cannot be used normally due to the password set by the customer, the manufacturer does not assume any responsibility.1. Using Password: Enabled2. Modify PasswordSYSTEM MENU GUIDE nguage: Chinese, EnglishProducts Dimensions The size for Mini Pro PTZ Controller is as below:(Unit of length: mm)。
米特(meteor)绕线机的英文说明书

User ManualContent1. Standard operation procedure 22. The explanation of the menu on the screen 173. How to lead the wire through the winding machine? (28)4. How to write a new program for ferrite 305. How to modify the program which has been written and stored in the touch screenDisplay (editing area) .376. About the “Product name” 39Note:The programs for all your products (01, 02, 03, and 04) have been written, please refer to chapter 1 to call out the program.If the winding quality is not satisfied, please chapter 5 to modify the parameters and debug & refine it.Two copies are stored for each product. Even one copy is destroyed by mis-operation, you can select another program to download and execute it.1. Standard operation procedure.1.1 Switch the power to “ON”Note: For below steps please see the video of “how to call out a program to wind the ferrite”.1.2 Touch the “single-step” menu. (Note: NOT “single-cycle”, don’t be confused). We have writtenall the programs for the 4 products (ferrites) and additional one copy is prepared to make sure you don’t need to develop new program in case that you delete or destroy one program.1.3 Touch the “Pro Store” menu1.4 Touch “Program Download” select the “program #” (Note: it is the “NO” that shall be selected instead of “product name”.) by touch “Add” or “Dec”. eg. If you wind product 04, you should select NO 6 or NO 7)1.5 Touch “download” menu.1.6 Touch the “Program Save” menu and the screen will switch to 11.71.7 Touch “executing” menu and the program is downloaded and sent to the controller from the touch screen display (editing area).Note: when a program is downloaded and executing, it is no need to repeat 1.1 to 1.7.1.8 Pull backward and back-clamp and insert the ferrites into the fixture1.9 Release the back clamp and the ferrite is fixed1.10 Pick up the wire end from the spring and make the wire go through the bottom edge.1.11 Make the wire tie the bold with an o-ring for two times.1.12 Press down the “ZERO” for 2 seconds until the lamp is on.1.13 Press down “START” button1.14 The winding and traversing motion will be automatically executed.1.15 Press the “START” button and the wire nozzle move away.1.16 Dispensing the glue on the end1.17 Press the “start” button again and the nozzle will move away to make room for dispensing in other locations.1.18 Tie the other end of the wire to the bold with O-ring..1.19 Pull the wire into the spring to fix it.1.20 Cut the wire end to specified length.1.21 Pull backward and take out the wound ferrite.2 The explanation of the menu on the screen2.1 Main screenWhen the hardware checking is finished, the main screen will automatically show as this picture. The information of below parameters will show on the screen:W Axis: The winding spindle speedY Axis: The traversing coordinatesCycle: Cycle timeOutput: The accumulated output .In the mode of “manual”, the output will be zero clearedStatus: The executing status of the program.Work program: single step, or single cycle or continuous production.On the left side of the main screen, the meanings of the menu are as follows:Pro Edit: Program editPar. Setting: Set parameterPro store: Store programFault Inquiry: Touch the menu and the screen will be switched to the screen of failure warning.Manual: Touch the menu to and the screen will be switched to the screen of “manual”. It should be under the mode of “manual” to write a new program for a new product.Single-step: The machine will only run one cycle.2.2 Pro Edit:Password: the original password is 111111Enter the password and parameter screen will be switched to below screenThe instruction selecting menu (down). When touch the menu one by one the instruction sequence will be: move—traverse—executing—wait—action--program end.The instruction selecting menu (up). When touch the menu one by one the instruction sequence will be: program end—wait- move—traverse—moveUP:Step “up” menu. The program will come back the previous step when touch itDn:Step “down” menu. The program will go forward to the next step when touch it.Under the mode of “pro edit” and “manual”, touch the “insert”menu and a new instruction will be showed to be edited. Touch the “delete”menu and the instruction will be deleted.2.3 ManualTouch the “teach” menu and the “manual” screen will be showed as below:The operation is the same as the “manual” mode, which will show off when touch the manual menu.2.4 Winding and Traverse:Traversing width: Set the traverse widthWire Dia.: Set the wire diameterNO. of turns: Set the number of the turns and the range is from 0-99999.Speed: the rotating speed of the spindles and the range is from 0—18000RPMStop angle: Set the angle where the spindles stop when winding is finished.2.5 Waiting Instruction:Wait: The time lag between every program step: 0.00—99.99 seconds and the range is from 0.00—99.99 seconds.2.6 Par. SettingSet below parameters on the par. setting screen:Y Axis JOG speed: The traverse speedW Axis JOG speed: The max. turn speed of the spindles. For Schaffer products, the turn speed shall be less than 1000RPM.Y Program zero point: It is to set the winding start point2.7 Move Command:The instruction is to set the winding start point and the original angle of the spindle.Y Axis: winding start point: the data is from ±0.0 ~999.999 mm , if the winding start point is not in accordance with the specification, you can set specific data to modify .W Axis: The original angle before winding ±0.0 ~ 359.9. For Scaffner’s product, the degree is defaulted as “0 “ degree.Y AxisAcc/Dcc: Accelerating/decelerating time of the move speed: 1—9.999sec. Speed: Nozzle move speed when the nozzles return to the original point.2.8 Program endWhen the program is finished, the screen will show as this interface.2.9 Program storedWhen the program edit is finished, it should be stored in the touch screen display(editing area) by touching the” save” menu. The program NO shall be assigned to the program by touch”Add” or “dec”2.10 Program downloadedThe programs for the product (ferrites) are stored in the touchscreen display(editing area). When winding one new product, the operator should select the program No. by touch “Add” or “Dec” and then touch the “download” menu and the specified program will be called out.When Touch the “executing” and the program will be sent to the controller from the editing area and then the instructions of the program will be executed.When the program is downloaded and executed, it is no need to do the same operation and what need to do is to depress the zero and start button.If the program need to be changed, please touch the interface of “pro edit” and edit the program as needed.2.11 Fault inquiryThis screen will show the fault message in red in the screen. When the text become green, it shows that the fault is solved.3. How to lead the wire through the winding machine? Please see below pictures.4. How to write a new program for ferriteNote: Please see the video of “how to set the parameter”.The program framework has been done and what the operator needs to do is to set the parameter.4.1 Touch the “Pro Edit” and key in the password 111111Touch “UP” or “Dn” to select step 000 ---- step 005.4.2 Modify the winding start point. (Step 000)The “move command” of “step 000” is to make the wire nozzle return to the original point. In general the data are as follows:Y Axis: To specify the winding start point. If the winding start point is not in accordance with the specification, you can set specific data to modify it.4.3 Modify traverse width (step 001)4.4 Modify the nozzle position setting for glue dispensing (step 002)4.5 Modify the nozzle position setting for glue dispensing. (Step 003)4.6 Resetting the Nozzle position for the wire end leading. (Step 004)4.7 The modification shall be ended by “Program End” command. (Step 005)4.8 Select the “product NO” by touch “Add” or “Dec” and touch the “save”. (Note: Both the “product NO” and product name are number and they are easy to be confused. )At this step as indicated in red circle instead of the product name. Don’t confuse the product” NO” and product name!4.9 Touch “save” and the program will be stored in the display (editing area).4.10 As for the next steps to wind the ferrite, please refer to chapter 1.0.5. How to modify the program which has been written and stored in the touch screen display (editing area).The program has been finished and the operator only needs to call out the program. The operator can call out the program to winding the ferrite.If the winding quality needs to be refined, the operator should modify the parameters:5.1 Touch the data which needs to be modified and the soft keyboard will show.5.2 Key in the correct number on the soft keyboard and then touch “confirm” menu.5.3 The modification shall be ended by “Program End” command.5.4 Select the SAME “product NO” (which is being under modifying) by touch “Add” or “Dec” and touch the “save” (Note: Both the “product NO” and product name are number and they are easy to be confused.)At this step as indicated in red circle instead of the product name. Don’t confuse the product” NO” and product name!5.5 Touch “save” and the updated program will cover the old program..6. About the “Product name”.The product name 01/02/03/04 are defined temporarily as follows.Product 01Product 02Product 03Product 04Both the “product NO” and product name are number and they are easy to be confused.The operator can modify them if you don’t like them. (Please be kindly advised that when choice the program, the operator shall select the “NO” by touch “Add” or “Dec”.7. How to adjust the nozzle positionLoose the 3 bolts and re-locate the nozzle holding bar and then tighten the bolts.8. How to make a quick-change over for the fixture.This location is for product 01, 02 and 03. This location is only for product 04.The start point (size C) for product 01 is 10mm’ and the fixture is marked as “10” which is indicated as below.。
迷你宠物追踪器208PA用户手册说明书
Product DescriptionSpecificationsPackage ContentsHow to apply/wear the Base and Tag unitsTag UnitPage 1Page 2Tag UnitBase UnitAdditional Out-of-range Alert notes1. When the T ag Unit is within the safe range, the lights on the Base and T ag units blink dimly at regular intervals,i ndicating an active link between Base and T ag units – this is referred to as “Standby Mode”.2. When the Base loses the signal to a T ag unit (i.e. out-of-range), the Base unit beeps for 10 seconds and the T ag unit beeps for 15 seconds. If the Base unit and the T ag unit are not reunited, both units go into Sleep Mode after 10 and 15 seconds respectively. However, the Base unit will intermittently beep until the link is re-established with the T ag unit.3. When the T ag unit is once again reunited with the Base Unit, press the Search button on the Base unit (Base unit will enter Search mode). Press the Base unit button a second time to re-establish the link.Power Switch(Hold button over 3 seconds to turn ON/OFF)FrontBackLEDBuzzerHanging hole for strap T op coverBottom coverT op coverBuzzerFindMe button Power switchRing Attachmentwondering too far away or trying to play hide and seek with you, the Mini Pet Tracker shows you an easier way to keep an eye on your lovely pet. It works through closets, walls, indoors and outdoors no matter where your pet decides to hide. The approximate range of the Mini Pet Tracker is 984 feet. When you cannot locate them, press the search button and listen for the beep. It’s loud enough to help you to locate them but did not bother my cats at all. The Tag unit is designed to wear on dog collar, and it is water splash resistant with a silicon cover. Different from other pet tracker products, the Mini Pet Tracker 208PA offers an alarm function: when dog or cat is certain distance away from host, the base unit would sound a series beep sound.1. Place battery into the Base unit and the T ag unit.2. Make sure that the Base and T ag units are away 50 cm from each other.3. T urn ON the Power switch on the Base (as Figure 6). Both units will establish a link and begin to blink synchronously.4. Place the T ag unit in a stationary location. With the Base unit in hand, walk away from the T ag. At about 164 feet, both Base and T ag units will begin to beep and flash, indicating an out-of-range alert condition. (As Figure 7)5. Return to the T ag unit location and the alerts will cease.6. Place the T ag into the provided silicon case(as figure 8) and attach the case using the ventilation openings at the bottom onto the Pet’s collar . If the Collar is too wide to fit into theSilicon case vents please use the provided Velcro strap on the larger collar and fit the case onto the strap. (As picture 9)7. Congratulations, you just completed the Quick Setup!Setting Safe Range distances for the Tag unitYou can set the safe range distances for the T ag unit to Near (164 ± 65 feet) or Far (328 ± 98 feet). The factory setting is for 164 feet.1. Press and hold the “Search/Setting” button on the Base unit - notice how the LED changes from Red and Green. Red represents “Near” and Green “Far”.2. When the LED shows the color (i.e. distance) you want to set, simply release the button to set the option.Note that when you are in Standby mode, the Base Unit LED will blink the color of the safe distance that you set.Base Unit1. Open the battery cover by placing your thumb on the cover (as Figure 1) and pulling it backwards until it clicks open; then lift off the cover.2. Insert the battery into the battery compartment with the “+”sign on the battery facing up (as Figure 2). Then replacethe battery cover by sliding it up into compartment opening.T ag Unit1. Remove the top cover with your hand. Force the top cover to slide from its mounted position towards the top of the T ag. (as figure 3 & 4)2. Insert the battery into the battery compartment with the the ”-” sign on the battery facing up. Then replace the top cover by sliding it down into compartment opening.(as figure 5)LEDFigure 2Figure 8Figure 9Figure 4Power SwitchFigure 5Figure 6Page 3Page 4A. The Remote base unit collects and compares RF signal strength from the T ag unit to determine location. However, when the T ag unit is already very close to the Remote base unit, the signals can appear emanating from several directions. This can also occur when both units are in an enclosed environment, which causes signal reflection off of walls from different directions, indicating a false location. If this is the case, you can mute the Remote base unit, and simply follow the audio beep issued by the T ag unit during search mode.Q. Why does the Remote base unit occasionally indicate a false direction?A. This is also caused by the reflection or blockage of the signal. Signal reflection from walls or wire fences sometimes may indicate a false location. A body of water (e.g. fish tank) for even people may block the signal and weaker reflectedsignals from surrounding metal objects may indicate a false direction. T o remedy this problem, try adjusting your position, wait for the “Status Indicators” to settle and try your search again.1. The T ag units are water-repellent, but not waterproof! Keep the device dry. Precipitation, humidity, and all types of liquids or moisture can contain minerals that may corrode electronic circuits. If your unit gets wet, remove the battery, and allow the unit to dry completely before replacing it.2. If you want to use the device during air flight, please comply with the air safety regulations for each respective country.3. We reserve the right to change the hardware/software specifications and designs, as well as the information in the manuals, at any time without prior notice.4. Proper operating temperatures for this product are between 40˚F ~104˚F (5˚C~40˚C). Proper storage T emperatures are between -4˚F~185˚F (-20˚C~85˚C). For operating temperatures under 40°F (5°C) please use LIR2032 batteries only – Ask your PetFinder agent.5. Under low battery charge conditions, both Remote base and T ag will alert with a beep every 2 minutes - in this case, replace batteries immediately. Low battery conditions may result in unpredictable product behavior, such as low alert volume and false readings. T o save battery charge, turn off both units when appropriate (e.g. evenings at home).6. The batteries provided in this product should be disposed of properly according to national or regional recycling regulations - contact local authorities for more information.Warning: Do not expose the batteries to fire or heat - this may result in danger from explosions.Additional Search Function Information1. In an enclosed room, the green direction indicator may show a false tag location. This is because the RF signals m ay be reflecting off of walls from different angles. In this case, hold down the button on the Base unit to Mute the Base chirping and follow the T ag beep audible to pin-point its location.2. This product uses RF signals which can penetrate off walls and floors - however, these signals are also sometimes affected by materials and terrain, such as bodies, water, metal/wire fences, concrete walls, and crowds (e.g. in malls, amusement parks) - for children, it is important to teach them to move to open areas when lost to assure optimal conditions for searching from the Remote Base unit.When a tagged item is misplaced, you can use the Remote Base unit to start searching if it is within a 300 metres (line of sight) radius. Try this first in an open area (e.g. large room, or in your yard).Notice: In order to get good signal reception, please follow the holding way to hold the Base unit.1. T ake the Base Unit and stand apart from the T ag unit (about 10 m). T urn On the Remote Base unit and it will begin to chirp.2. Before searching in a new area, you must first calibrate the PetFinder, you only need to do this once , unless your pet goes into an area with very differentsurroundings as calibration helps make tracking easier. In the current terrain and environment, hold the Remote Base unit in front of you at chest level, in searching mode and scan the area slowly in a circular direction, from right to left for 360° (a) and again from left to right (b), one 360° turn in 3-4 seconds - slowly.Note: You don’t have to scan a full 360°; you can use a narrower search angle (e.g. 180°).Note II: If the “Direction Indicator” illuminates green on the Base unit during this calibration process, it does not yet indicate the T ag unit’s direction.3. Next, begin the search by slowly scanning a third time from right to left (c). The “Direction Indicator” on the Base Unit will illuminate (green) when it establishes the direction of the tagged tem location.4. Move in the direction of the T ag Unit. As you approach the T ag unit, the frequency of the chirping and blinking (LED) on the Base Unit will increase.5. If the T ag unit is hidden (e.g. in a pocket), you can hold down the search button to emit light beeps.Turn ON the Remote Base Left = on Right = off。
MIDI控制器设置中英文对照表

MIDI控制器设置中英文对照表MIDI控制器设置MIDI控制器设置中英文对照表包括常用灯光通道英文中文对照蓝色字体的表示设置电位器推杆的黑色字体是设置按键的Toggle all fixtures 切换所有灯具Toggle favorite 切换常用灯具Toggle blackout 总黑场切换Open gobo 打开图案控制窗口Open color 打开颜色控制窗口Open Pan/Tilt 打开X/Y控制窗口Open beam 打开特殊通道控制窗口Open special 打开形状结构控制窗口Tap Sync 轻打控制键Open Lamp 打开点灯控制窗口Create sequence 打开程序制作窗口Open cue 打开Cue控制窗口Open sound 打开声控窗口Show output 显示输出窗口Show sliders 打开程序编辑Next gobo 图案1下一个图案Next color 颜色1下一个颜色Next gobo2 图案2下一个图案Next color2 颜色2下一个颜色Pan right 水平X 右移Pan left 水平X 左移Tilt up 倾斜Y 上移Tilt down 倾斜Y 下移New sequence 新建程序Insert scene 插入步(场景)Remove scene 删除步(场景)Add scene 增加步(场景)Show framing 显示步Zone 1 区域1Zone 2 区域2Zone 3 区域3Zone 4 区域4Group 1-10 编组1-10选择Enable joystick 打开游戏杆控制Multiselect 多个程序同时选择Sequence 1-20 序列程序播放1-20 Button 1-30 场景按键1-30 Blackout group 1-24 编组灯具黑场1-24Toggle joystick Pan/Tilt 打开游戏杆控制X/YToggle Freeze 程序暂停总控制Gobo1 channel 图案1通道推杆电位器控制调节Gobo2 channel 图案2通道推杆电位器控制调节Gobo1 Rotation channel 图案1旋转通道推杆电位器控制调节Gobo2 Rotation channel 图案2旋转通道推杆电位器控制调节Color channel 颜色1通道推杆电位器控制调节Color2 channel 颜色2通道推杆电位器控制调节Cyan channel 蓝绿通道推杆电位器控制调节Magenta channel 品红通道推杆电位器控制调节Yellow channel 黄色通道推杆电位器控制调节Pan 8bit channel 水平X通道推杆电位器控制调节Disable tab / manual trigger 关闭手动触发Tilt 8bit channel 倾斜Y通道推杆电位器控制调节Shutter channel 频闪光闸通道推杆电位器控制调节Intensity channel 亮度通道推杆电位器控制调节Prism channel 菱镜通道推杆电位器控制调节Zoom channel 缩放通道推杆电位器控制调节lris channel 光圈通道推杆电位器控制调节Forst channel 雾化通道推杆电位器控制调节midi Page1-5 midi翻页1-5页Toggle Relative Pan/Tilt 切换相对水平X/倾斜YMaster 100% 总输出最大Master 0% 总输出最小Fade in 总输出淡入Fade out 总输出淡出Master Intensity 总亮度控制Sequence speed 1-20 Cue序列程序速度控制1-20Fog/ Smoke 烟机点控Previous Gobo 图案1前一个图案Previous Gobo2 图案2前一个图案Previous Color 颜色1前一个颜色Previous Color2 颜色2前一个颜色Lock MIDI input 锁定MIDI输入Toggle Submaster 1-5 集控程序播放和停止按键1-5 Submaster Go 1-5 集控程序选择下一个程序1-5 Submaster Back 1-5 集控程序选择前一个程序1-5 Submaster Page 1-4 集控程序窗口翻页1-4Subm.Intensity 1-5 集控亮度控制1-5推杆Masterspeed 总输出速度控制推杆Manual trigger 手动触发按键MIDI to DMX 1-24 MIDI推杆直接输出控制1-24独立通道推杆Sound To Light trigger 声控控制Release fixture overrideOverridebettons tab 1-6Dis.override group 1-24Shift functionDisable all buttonsCuelist tab 1-6Toggle Cuelist 1-16 集控程序按键 1-16 Select next fixture 选择下一个灯具Select prveious fixture 选择前一个灯具Select even fixture 选择双数灯具Select odd fixture 选择单数灯具Select same even fixture 选择相同的双数灯具Select same odd fixture 选择相同的单数灯具Locate selected fixtures 查找已选的灯具Enabie sound Selected fixture 选择灯具时开启声控Previous group 前一个编组Next Group 下一个编组Previous Overr.tabNext overr.tabPrevious cuelist tabNext cuelist tabPrevious submaster tabNext submaster tabFog level 烟机喷烟量控制推杆Fog fan level 烟机风量控制推杆DMX400 master DMX400主控制推杆DMX400 background DMX400返回推杆DMX400 Program Select DMX400程序选择DMX400 Speed DMX400速度控制推杆DMX400 Blackout DMX400 黑场键DMX400 Full onDMX400 Fade DMX400 渐变DMX400 Fadetime DMX400渐变时间推杆DMX400 interval DMX400程序间隔时间推杆DMX400 auto change DXM400自动变换DMX400 color change DMX400 换色DMX400 same color DMX400单色DMX400 Vivid colors DMX400 多色变换。
飞利浦一日精灵保健器 9000说明书

Shaver series 9000 V-Track Precision Blades8 direction ContourDetect HeadsSmartClean System SmartClick precision trimmerS9031/26Perfection in every passCuts up to 20% more hair* in a single passThe Shaver 9000 is our most advanced shaver yet. The unique contour-detect technology offers exceptional coverage over every contour of your face, and the V-Track system guides hairs into the best cutting position for the closest results.Easy to useShaver can be rinsed clean under the tapIntuitive icons make the functions easy to use50 minutes' cordless shaving after a one-hour chargeWith 2 year guaranteeA comfortable shaveGet a comfortable dry or refreshing wet shave with AquatecDense beards don't stand a chanceDesigned for perfectionBlades perfectly guide hairs into position for a close shaveHeads flex in 8 different directions for a superb resultGet the most of your shaverKeep your shaver like new with SmartCleanClick-on trimmer for perfect moustache and sideburn trimmingHighlightsV-Track precision blade systemGet the perfect close shave. The V-TrackPrecision Blades gently position each hair in the best cutting position, even flat-lying hairs and hairs of different lengths. Cuts 30% closer in fewer strokes, leaving your skin in great condition.8 direction ContourDetect HeadsFollow every contour of your face and neck with 8 directional ContourDetect heads. You'll catch 20% more hairs with every pass,resulting in an extremely close, smooth shave.Aquatec Wet & DryChoose how you prefer to shave. With the Aquatec Wet & Dry seal, you can opt for a quick yet comfortable dry shave. Or you can shave wet – with gel or foam – even under the shower.BeardAdapt SensorThis electric shaver comes complete with a BeardAdapt Sensor that reads the density of your beard. It then auto-adjusts the power for the job at hand. Easy.SmartClean SystemAt the touch of a button, SmartClean cleans,lubricates and charges your shaver, keeping it performing at its best, day in, day out.SmartClick precision trimmerClick on our skin-friendly Precision Trimmer to finish your look. It's ideal for maintaining your moustache and trimming your sideburns.3-level LED displayThe intuitive display shows relevantinformation, enabling you to get the best performance out of your shaver: - 3-levelbattery and travel lock indicators - Cleaning Indicator - Battery Low Indicator -Replacement Head Indicator50 minutes of cordless shavingOur advanced charging system gives you two convenient options: charge for one hour and you'll get 50 minutes of running time, or do a quick charge for one full shave. All 9000Series Shavers contain a powerful, energy-efficient, long-lasting lithium-ion battery. They are designed to operate only in cordless mode to ensure you'll always be safe when shaving with water, even in the shower.Fully washable shaverSimply open the shaver head to rinse it thoroughly under the tap.Built to lastWe back this Philips shaver with a 2-year guarantee. Our 9000 Series Shavers are designed for performance and durability,promising you an extremely close shave time after time.SpecificationsShaving PerformanceContour following: 8 direction ContourDetect HeadsSkinComfort: Aquatec Wet and Dry, BeardAdapt SensorShaving system: V-Track Precision Blade System, Super Lift & Cut ActionEase of useDisplay: 3 level battery indicator, Cleaning indicator, Battery low indicator, Replace shaving heads indicator, Travel lock indicator Cleaning: Fully washable DesignHandle: Ergonomic grip and handlingColour: Black SatinAccessoriesSmartClick: Precision trimmerPouch: Travel pouchSmartClean: Cleans, Charges, Lubricates,Cleaning cartridge (included)PowerCharging: Quick charge for 1 shave, 1 hour fullchargeBattery Type: Lithium-ionAutomatic voltage: 100-240 VRun time: 50 min / 17 shavesStand-by power: 0.1 WMax power consumption: 9 WServiceReplacement head: Replace every 2 yrs withSH902 year guaranteeSoftwareSoftware update: Philips offers relevantsoftware updates for a period of 2 years afterthe date of purchase* Cuts up to 20% more hair – versus SensoTouch© 2022 Koninklijke Philips N.V.All Rights reserved.Specifications are subject to change without notice. Trademarks are the property of Koninklijke Philips N.V. or their respective owners.Issue date 2022‑08‑30 Version: 8.0.1。
韩国美塑枪操作手册

MESO-PRI: 韩国美塑枪MESO-PRI01:11 Meso-Pri main frame: Meso-Pri主机01:13 Guide 导板01:15 adapter适配器01:18 1cc exclusive use holder:1cc专用固定器01:21 Manual CD 使用手册光盘01:35 Joining method (1cc) 安装方法(1cc)02:42 Joining method (10cc) 安装方法(10cc)03:39 Isolation 分离04:04 Switch on 开启04:18 Injector capacity indication department (1cc, 5cc,10cc)注射器容量指示(1cc, 5cc,10cc)04:38 10cc Choice 选择10cc04:42 Mode selection indication department (PPP, Auto, NPG)模式选择指示(PPP模式,自动模式,NPG模式)05:00 Auto mode choice选择自动模式05:04 Auto mode 自动模式Dosage choice 剂量选择1mm-10mm 1毫米-10毫米Dosage剂量06:09 PPP mode choice 选择PPP模式06:15 PPP mode PPP模式Injection velocity choice 选择注射速度06:30 Depth choice (1mm-10mm) 深度选择(1毫米-10毫米)06:57 Running time 运行时间Dosage 剂量07:02 Mode selection indication department (PPP, Auto, NPG)模式选择指示(PPP模式,自动模式,NPG模式)NPG mode choice 选择NPG模式07:08 NPG mode NPG模式Rate control choice (per minute 120th ~ maximum 360th)NPG模式(120针/分钟~最多360针/分钟)07:30 Depth choice (1mm-3mm) 深度选择(1毫米-3毫米)07:41 NPG mode NPG模式Running time 运行时间Dosage 剂量07:51 Caution 警告Battery residual quantity tribe 电池残电量不足07:57 I am marked on the battery residual quantity tribe city LCD right side top portion.右上部的液晶显示器显示电池残电量。
跳舞毯使用说明书

地址:深圳市南山区南海大道新街口广场C座501 跳舞毯使用说明书深圳市科得斯科技有公司,是一家生产、批发、零售、服务于一体的民营科技企业,本公司所有商品直接从厂家出货,避开销售公司等环节,所以价格较低,走货量大,没有陈货旧货,质量保证,产品主要包括:跳舞毯、扭吧扭吧及其他相关游戏机配件、电脑游戏设备产品等。
公司成立以来一直本着为顾客提供最好服务为宗旨,以诚信深得广大客户的信赖。
科得斯科技本着诚实守信的原则,竭诚为客户提供:优质的产品、实惠的价格、满意的售后服务。
希望科得斯科技能成为你最可信赖的合作伙伴。
产品宗旨:劲歌热舞挥汗如雨娱乐至死瘦身成功舞出健康舞出美丽服务宗旨:我们不吹嘘我们的产品100%的好,但是我们保证100%的解决问题!我们秉承:沟通创造价值,态度决定一切,服务到您满意为止!!公司网站:淘宝直销店:/拍拍直销店:/349436153电视跳舞毯使用说明:规格:电子盒内置迪士高音乐舞曲,直接连电视,无须光盘。
第一步:把跳舞毯上自带的连接线插到电视机相应的视频和音频接口(红对红,黄对黄,白对白);第二步:插上电源适配器(毯子上有专门接电源的插孔);第三步:把电源接到家用插座上;第四步:把电视频道调至AV频(平常放VCD的频道);第五步:打开跳舞毯上开关(指示灯亮启),就能立刻玩了。
电视TV跳舞毯使用说明一、准备工作:1、确保电源已经通电并开关已经打开(毯面上有一个开关,在毯面盒子的边上。
),此时毯面上的灯会“亮”起接好音频、视频线。
(黄色线为视频线,红色和白色为音频线)电视调至AV模式(也就是看DVD和VCD 的模式)地址:深圳市南山区南海大道新街口广场C座501 二、毯面的介绍:毯面上四个箭头代表是个方向,SELECT(左上角):表示选择。
START(右上角):表示开始。
正中间为使用者的站立空间。
其他方位为装饰位和辅助位,一般情况没有什么用途。
(START正下方的键很重要接下来我们会介绍)三、使用详细介绍当完成了“准备工作”此时会进入跳舞毯的初始画面(有音乐有图象)。
木头电子钟中英文说明书
双屏数码声控木钟使用说明书(升级版)一.产品简介1)开机/复位:RESET键2)功能特征:◆工作电压:DC5V/500MA 或4节7号干电池(AAA)◆万年历从2000年到2099年,共100年。
◆时间,日期,温度,可自动切换显示,也可手动锁定显示时间,单按SET键切换。
◆12/24小时:可以进行12/24小时制转换,默认24小时制,2016年1月1日,12:00◆三组闹铃,每组闹铃时长1分钟◆声控开关自由调节(按Down键)◆工作日闹铃设置(长按SET键进入设置,ON E是打开,即周六周日不响闹铃;--E是关闭,即周一至周日每天都响闹铃)2)产品常规配置温馨提示:当您打开产品包装时请检查包装盒内是否有如下配件:◆数码木钟一台◆使用说明书一份◆USB线一条二.产品主要技术参数◆本产品直接配电源适配器使用,电源适配器的输入电压:AC110V-240V,50/60HZ,电源适配器的输出电压:DC5V/500MA-1000MA。
也可以使用AAA*4节电池备用。
(使用电池时建议开启声控功能。
)◆声控模式下,当近距离声音大于60分贝时就可以唤醒显示。
三.显示及按键介绍1)显示功能说明2)按键功能说明四.功能设置在正常显示状态下,长按设置键(SET),3秒不放,显示闪动。
设置顺序为:年-月-日→12H/24H→时-分→闹钟(A1-时-分,A2-时-分,A3-时-分)→工作日闹铃开关。
◆年设置:按住设置健(SET)三秒,年所在位闪动,按向上键(UP)/向下键(DOWN)可以向上或向下调整,长按可以快进/快退◆月设置:年设置完成后,再按设置健(SET)进入月调整,月所在位闪动,按向上键(UP)/向下键(DOWN)可以向上或向下调整,长按可以快进/快退◆日设置:月设置完成后,再按设置健(SET)进入日调整,日所在位闪动,按向上键(UP)/向下键(DOWN)可以向上或向下调整,长按可以快进/快退◆12/24H设置:日设置完成后,再按设置健(SET)进入12/24小时调整,按向上键(UP)/向下键(DOWN)可切换12/24小时制。
电子门垫用户指南说明书

1 Suitable programme for running at night: it takes longer, but is extremely quiet.
1
3. Close the lid of the dispenser for rinse aid. a The lid clicks into position.
9001633434 (020408) SMH6ZDX00E
*9001633434*
How to use your appliance
1. Load the tableware.
tate freely.
Only clean tableware that is suitable for dish-
2. Add detergent.
gether and lift
1
the coarse filter
out .
Cleaning spray arms
1. Unscrew the upper spray arm and
2
pull down to remove .
1
2
5. Clean the filter elements under running water.
Setting the water softening sys-
H02
tem
H03
1. Press .
H04
2. To open the basic settings, press
H05
for 3 seconds.
H06
a The display shows Hxx.
H07
a The display shows .
- 1、下载文档前请自行甄别文档内容的完整性,平台不提供额外的编辑、内容补充、找答案等附加服务。
- 2、"仅部分预览"的文档,不可在线预览部分如存在完整性等问题,可反馈申请退款(可完整预览的文档不适用该条件!)。
- 3、如文档侵犯您的权益,请联系客服反馈,我们会尽快为您处理(人工客服工作时间:9:00-18:30)。
Basic StatisticsWith this option you can calculate the minimum, maximum, mean, st. deviation, variance and number of cases in your data file.在这选项中,可以计算最小的,最大者,平均值,st ,偏离,变量,数据文件中的大量数据。
Results of these calculations are displayed in a grid format.计算的结果以栅格格式显示To calculate the standard Basic statistics计算标准的基本统计表1. Choose Statistics from the main menu.1. 从主菜单中选择统计表。
2. Choose Basic statistics (in type of statistics)2. 选择基本的统计表 (在统计表的类型中)3. Select the desired statistics e.g. mean, st. deviation... from basic statistics. Note: an X indicates that a condition has been selected.3. 从基本统计表中选择要的平均数,st,偏离等等。
注意: X 表示一种情况已经被选择。
4. Select All variates (in Output)4. 选择所有的变量(在输出)5. Choose Only selected data (in calculate using). If you want to access all data click on All data.5. 选择已选择了的数据.( 在计算使用中) 如果你想计算所有的数据点击所有数据(all data)。
6. Choose Calculate to proceed.6. 下一步选择计算。
Copying data to the clipboard复制数据到剪贴板Y ou can send the results of your calculations to the clipboard to later past them in another application.可将计算结果放在剪贴板上运用在另外的一个计算中。
Copying all data to the clipboard.将所有的数据复制到剪贴板上。
1. Click on All cells, and Minpet will highlight all cells (select all).1.点击所有的按钮,将高亮显示。
2. Click on Copy and the data are copied to the clipboard.2.点击复制(copy)数据就会拷贝到剪贴板上3. Click on any cell of the grid and the highlight is removed.3.点击格板上的任一处高亮消除To select a limited region of the grid选择格板上的限定区域1. Y ou must define the highlight box manually. Click on the starting top,left cell of the highlight box, hold the mouse button down and drag the mouse to the lower right corner of the box and release the mouse. Y ou may now copy the highlighted region to the clipboardusing steps 2 and 3 as defined above.1.必须手工设定高亮区域(box),点击左上角高亮区域,按下鼠标左键拖到区域的右下角并放开鼠标,这时你可以拷贝高亮区域到剪贴板上。
Note: When you copy something to the clipboard any previous information stored in the clipboard is lost.注意:当你拷贝东西到剪贴板时,以前复制在剪贴板上的东西将被删除Y ou may not want to calculate your statistics using all the variates present in your file. To select the variates that you do want to计算时你可能不会用上所有参数,你可以选择所需要的参数。
use:(用法)1. Click on Define list of V ariates.点击参数详细列表。
2. A new window will be displayed containing to the right a list of all variates in your Minpet file. The idea is to copy to the left list boxonly those variates that you want to use for your calculations.在Minpet文件中一个新的窗口会在右边框内显示所有的参数,你可以选择你要的参数到左边的框内。
Drag a variable from the right list box and drop it in the left list box. Note a dark left arrow will replace the standard mouse pointerwhile you are dragging a variable. Repeat this process to select all variables that you want to normalize. When you have selected all yourvariables choose O.K.把参数从右边的框内拖到左边的框内,在拖动过程中鼠标将变成朝左的箭头,重复拖动你要的参数,选好后点确定(OK)To remove a variate from the left list box (variables selected), drag and drop the variate from the left list box to the right list box.要去除左边框内的参数时只须将参数拖回右边框内即可。
Y ou can also clear all variates from the left list box by choosing the Clear button.你可以点击清除按钮(clear)来清除所有的左边框内的参数。
Binary Plot二维图形This option will allow you to produce a binary diagram .这个选项可以画二维图形1. Choose Binary plot from the main menu.1.从主菜单中选择二维图形按钮(Binary)2. Enter the X and Y variates. Y ou can drag and drop a variable from the left list box into the X and Y text boxes or enter their a variate name using the keyboard. We remind you that you can plot complex expressions such (SiO2/100)+(TiO2/100).2.输入X和Y变量,可以将左边框内的的变量拖到X和Y文本框中,或者从键盘输入变量名。
你也可以写象(SiO2/100)+(TiO2/100)复杂的表达式(公式)。
3. Choose plot to view your binary diagram.3.选择绘图来察看二维图形Selecting the data to plot选择数据到图中Y ou can instruct Minpet to plot only selected data by choosing this option under data to plot. This means that only the data flagged as selected are plotted. Alternatively, you can bypass this flag and choose to plot all data. Note: Selecting to plot all data does not affect the selection flag of your data, it simply ignores the flag that you have set.你可以通过选择这个选项来设置要所要计算的数据来进行绘图,也就是说你所选的数据才会进行绘图。
或者不选取这步而选取所有的数据。
注意:选择所有数据绘图不影响所标识的数据,会忽略你所标识的数据。
Turning the grid on or off开关栅格Y ou can have Minpet draw a grid on your binary diagram by choosing the grid on option. The grid off option obviously turn the grid off.可以通过选择grid选项来在二维图中画一个栅格(grid)。
不用时取消即可Plot sample number绘制样本数When you turn the plot sample number option on, Minpet will plot the sample number below each analysis displayed on your binary diagram.选取绘制样本数(plot sample number)选项,Minpet将会在分析显示的二维图形下绘制出样本数。
Plot other variate绘制其他变量Instead of plotting the sample number below your data points on your diagram, you can have Minpet plot a variable or complex expression instead. Y ou can drag and drop a variable from the left list box into the plot other variate text box or enter a variable name or complex expression using the keyboard.如果不在数据和图据下绘制样本数,可以绘制变量或者复杂的表达式(公式)。