switching_loss_calculation(开关损耗)
电荷泵电路的效率优化研究
交叠时钟信号。当Vo为低电平时,电荷由VDD给V1节 点充电至VDD-Vth;当Vo为高电平时,Vob为低电平,
程,产生相应的功率消耗。电荷泵工作时的电荷再 分配过程如图3。
作者简介:夏天,聚辰半导体股份有限公司,研究方向:集成电路设计。 收稿日期:2021-04-06,修回日期:2021-04-22。
集成电路应用 第 38 卷 第 5 期(总第 332 期)2021 年 5 月 1
研究与设计 Research and Design
图3 电荷泵工作过程中的电荷再分配 电荷泵工作过程中产生电荷再分配功耗的根本原 因是负载电流Iout的存在。由于持续地向负载端输出 Iout,因此即便在最终的稳定状态时,Cout上仍存在 φ1阶段电荷流出,φ2阶段电荷流入的充放电电荷, 这一过程产生的功耗为式(3)。
图8 电荷泵效率与开关管宽度关系 3 仿真及测试结果
使用SMIC 0.13μm ASEE工艺,按照前述的方 法,优化设计了一款电荷泵电路,如图9所示。同 时搭载了一颗原型设计作为对比。
由于级数和主电容大小一致,因此两款电荷泵 的面积基本一致。两款电荷泵的效率测试结果如下 表1所示。通过针对功耗损失的精心优化,电荷泵 的效率提升接近14%。
式(2)所示。
(2)
该值看作一个N级电荷泵的效率极值,实际电
图1 Dickson电荷泵原理图
路中由于各种寄生及非理想因素的存在,电荷泵的
输入电压通过单向导通的二极管传导至下级电
效率将远低于该理想值。本文第二部分将详细分析
容上极板,而后互补的周期性时钟信号φ和φb,交 替将电荷向下一级传导,直至输出端。
软开关变换器

5.1.2 软开关的特征及分类
u i
0
ton t
p
0 (a)开通过程 t
u i
0
toff
t
p
0 (b)关断过程 t
图5-2 软开关的开关过程
➢ 通过在原来的开关电路中增加很小 的电感、电容等谐振元件,构成辅 助换流网络,在开关过程前后引入 谐振过程,使开关开通前电压先降 为零,或关断前电流先降为零,就 可以消除开关过程中电压、电流的 重叠,降低它们的变化率,从而大 大减小甚至消除开关损耗和开关噪 声,这样的电路称为软开关电路。
tontof 6
f
f
UCIC
5-1
➢在式工中作:电P压S —和功工率作管电开流关一损定耗的;条件下,功率管在每个开关周期中 的开关损耗ton是—功恒率定管的开,通变时换间器;总的开关损耗与开关频率成正比。 ➢开关损耗tfof的f——存功—在率功管限率开制管关了关频变断率时换;间器;开关频率的提高,从而限制了变换 器的小型U化C—和关轻断量后化功。率同管时承,受开的关电管压工;作在硬开关时还会产生较高 的di/dt和dIvC/d—t,导从通而后产流入生功较率大管的电电流磁。干扰。
L
r
di Lr dt
u Cr
Ui
C
r
du Cr dt
iLr
I0
5-5
5.1.3 谐振电路的构成与特性
iLr Ui
Lr uCr
➢ 假设在t0时刻,谐振电感的初始电流为
iLr(t0)=ILr0 , 谐 振 电 容 的 初 始 电 压
Cr
I0
uCr(t0)=UCr0,解微分方程组(5-5),得 到
5.1.2 软开关的特征及分类
➢ 软开关技术问世以来,经历了不断的发展和完善,前后出 现了许多种软开关电路,新型的软开关拓扑仍不断的出现。
全软开关SEPIC变换器损耗分析

全软开关SEPIC变换器损耗分析摘要:本文基于全软开关SEPIC直流开关变换器,着重分析其工作过程中功率开关管、续流二极管产生的各种损耗,最终得出结论,由于软开关的介入,可以将极大地减小开关电路中各元件产生的损耗,提高变换器的效率,有广泛的应用前景。
关键词:SEPIC变换器软开关损耗效率Loss Analysis of An Soft Switching SEPIC ConverterSUN Xinfeng(The Detachment of Warship Training,Dalian Naval Academy,Dalian 116018)Abstract: Based on an soft-switching SEPIC DC-DC converter, the loss of the power switch and the freewheeling diode are analysised. Finally we can find out that thanks to adding the soft switch part the loss of the electronic elements are right smart reduced, the efficiency is increased, and it has extensive of applied foreground.Keywords:SEPIC converter, soft-switching, loss, efficiency1引言关于直流变换器在损耗问题上的研究,国内外文献多建立在对电路原理的数学仿真上[1-3],而对其损耗机理的定量分析和计算尚不多见。
由直流变换器的工作原理可知,电路中功率MOSFET、续流二极管的损耗主要由器件的物理特性决定,限制了电路的工作频率的进一步提高,特别是在高于300kHz时,其损耗已经很大,由于损耗引起温升,降低了可靠性。
寄生电感在IGBT 开关损耗测量中的影响

寄生电感在IGBT开关损耗测量中的影响Effects of Parasitic Inductance over IGBT Switching Loss Measurement浙江大学沈燕群,邓焰,何湘宁 E-mail: dengyan@摘要:MOS门极功率开关元件的开关损耗受工作电压、电流、温度以及门极驱动电阻等因素影响,在测量时主要以这些物理量为参变量。
但测量的非理想因素对测量结果影响是值得注意的,比如常见的管脚引线电感。
本文在理论分析和实验数据基础上阐述了各寄生电感对IGBT开关损耗测量结果的影响。
Abstract: The switching losses of MOS-Gated power components are decided mostly by operation voltage, current, temperature and driving, which are usually adopted as the loss measurement variables. In addition, measurement is remarkably influenced by non-ideal test conditions such as lead inductance. How the different parasitic inductances effecting over the IGBT transient losses are described based on theoretic analysis and experimental results.关键词:开关损耗测量,寄生电感,IGBTKeywords: Switching loss measurement, Parasitic inductance, IGBT1简介[1]功率半导体开关元件的开关损耗特性研究对功率变流器设计的意义是不言而喻的,在有紧凑性要求或散热条件特殊场合或可靠性要求较高场合,都需要严格按器件损耗特性进行大余量热设计[2-3]。
变 频 控 制 中 IGBTIPM 模 块 的 选 型 问 题

vEC
vout
iout
VEC
t
IEP : Max. peak emitter current =ICP
From application
IEP
iC
j
Power factor: cosj
From application
1-6
VEC @ IEP
From data-sheet
5) 续流二极管恢复损耗 (FWD recovery loss)
1-10
附录:三菱提供的IGBT-MODIPM功耗计算仿真软件
由于上述功耗计算是重点也是难点,三菱公司为此开发了一套关于 IGBT/IPM模块的功耗计算仿真软件,利用此软件便可方便地进行前述 的计算与判断。同时此仿真软件也给出了一些对设计人员进行设计判 断来说非常有用的参数曲线,如:在一定条件下,允许的最大负载峰 值电流随开关频率的变化情况,结温随峰值电流的变化情况,等等。 另外,计算出来的功耗还可用于进行散热器设计。 客户可从下列有关网站下载此计算仿真软件: 三菱电机半导体中文网站: /China/index.html
P ( Esw ( on ) Esw ( off ) ) f c sw
E
Esw(on) E
i
1
t
Tsw=1/fsw
i ICP ICP i
Esw(on) at ICP
From data-sheetsheet
fC : Carrier freq.
Rth(j-c)Q
ΔT(c-f)
功率模块的热等效电路
Rth(c-f)
Heat sink
1-8
ΔT(j-c)R
PD=PDC+Prr
Rth(j-c)R
基于模型预测控制的并网逆变器开关损耗优化方法

基于模型预测控制的并网逆变器开关损耗优化方法杨兴武;冀红超;甘伟【摘要】提出一种应用于单相并网逆变器的可降低开关损耗的模型预测控制方法.该方法基于单相逆变器的离散状态模型,首先加入参考电流方向的判断,对开关状态进行初步筛选并且闭锁部分器件的状态,设置电流跟踪差为指标函数,将筛选出的开关状态代入指标函数进行寻优,选出可使指标函数最小的开关状态;其次引入降损指标函数,判断当前时刻的控制误差,若控制误差在限定范围,保持前一时刻开关状态输出,否则根据当前时刻指标函数最小值更新开关状态,从而大幅降低系统开关频率.该控制方法原理简单、数字化控制易于实现,与传统的控制方式相比,其不用整定PI参数,且系统具有较强鲁棒性.仿真结果表明控制器对并网电流跟踪性能良好,大幅降低了开关频率.【期刊名称】《电力自动化设备》【年(卷),期】2015(035)008【总页数】6页(P84-89)【关键词】模型预测控制;开关状态;跟踪控制;开关频率;优化;逆变器【作者】杨兴武;冀红超;甘伟【作者单位】上海电力学院电气工程学院,上海200090;上海电力学院电气工程学院,上海200090;上海电力学院电气工程学院,上海200090【正文语种】中文【中图分类】TM862;TM4640 引言近年来,为了保障我国的能源安全,新能源的利用得到广泛重视,并网逆变器作为新能源与电网的接口,其控制技术的先进性对新能源的发展至关重要。
目前,应用于单相并网逆变器的控制策略有比例积分控制、电流滞环控制、比例谐振控制、电流预测控制、电流模型预测控制等。
比例积分控制应用广泛,控制思想简单,可采用频域分析和极点配置方法进行参数设计,存在的问题是稳态误差难以消除、参数设计较复杂;电流滞环控制方法简单,动态响应快,性能好,但要求系统采样精度高,导致开关频率高,系统开关频率的不固定使得滤波器设计困难[1];定频的滞环控制能够取得较好的控制效果,并且能够改善电流频谱特性,但使得控制过程变得复杂,控制精度降低[2-9];电流预测控制属于线性控制的范畴,具有控制精度高、电流谐波含量小等优点,但存在的问题是对模型参数准确性依赖比较强;电流模型预测控制是近年发展起来的一种控制方法,利用系统离散模型,通过设置指标函数直接选择开关状态,实现目标变量的直接跟踪控制,这种控制方法原理简单、设计容易、电流响应速度快、易于数字化实现,但存在的问题是计算量大,开关频率比较高[10-15]。
纯电动物流车用PMSM降开关损耗控制

10.16638/ki.1671-7988.2021.08.003纯电动物流车用PMSM降开关损耗控制吴雪松,戴晶,文翔,周冬冬(武汉第二船舶设计研究所,湖北武汉430064)摘要:物流车是城市内部运送货物的重要交通工具,具有运行距离短、启停频率高、运行时间长的特点。
城市内部物流车都逐步采用纯电动物流车代替传统的燃油车。
针对物流车运行特点,文章对电动物流车电机控制算法进行优化,在考虑不同工况下使用不同的开关频率,降低开关损耗,减少控制器发热。
通过对降低开关损耗控制方法与传统控制方法在不同车辆运行工况下对比,电机控制器发热均有所降低,同时电机控制器效率有所增加。
关键词:电动物流车;PMSM;降低开关损耗;新能源中图分类号:U469.72;TM301.2 文献标识码:A 文章编号:1671-7988(2021)08-06-04Switching Loss Reduction Control of PMSM for Pure Electrics VehicleWu Xuesong, Dai Jing, Wen Xiang, Zhou Dongdong(Wuhan Second Ship Design Institute, Hubei Wuhan 430064)Abstract: Logistics vehicle is an important means of transportation of goods within the city, with the characteristics of short running distance, high starting and stopping frequency and long running time. In view of the city internal logistics vehicles are gradually using pure electric logistics vehicles to replace the traditional fuel vehicles. According to the operation characteristics of the logistics vehicle, the motor control algorithm of the electric logistics vehicle is optimized in this paper. Different switching frequency is used under different working conditions to reduce the switch loss and reduce the heating of the controller. By comparing the control method of reducing switching loss with the traditional control method under different vehicle operating conditions, the heating of motor controller is reduced, and the efficiency of motor controller is increased. Keywords: Electric logistics vehicle; PMSM; Reduce switching loss; New energyCLC NO.: U469.72; TM301.2 Document Code: A Article ID: 1671-7988(2021)08-06-041 引言物流车多用于城市内部或城市之间运送货物,具有行驶距离短、启停频率高、运行时间长的特点。
LCC谐振变换器开关损耗特性的分析

理论与算法2018.06LCC谐振变换器开关损耗特性的分析黎佳慧,蒋正荣,张慧岳(北方工业大学,北京,100144 )摘要:L C C谐振变换器在具体应用的过程中,具有效率高、电磁干扰小、输出电压纹波小等特征,在服务器电源场合中的应用 优势十分突出。
文章主要对L C C谐振变换器开关损耗特性进行了分析和研究。
关键词:L C C谐振变换器;开关损耗;谐振元件;高次谐波;时域分析法Analysis of switching loss characteristics of LCC resonant converterLi Jiahui,Jiang Zhengrong,Zhang Huiyue(North China U niversity of Technology,B eijing, 100144)Abstract: LCC resonant converter has many advantages, such as high efficiency, small electromagnetic interference and small output voltage ripple in the specific application. It has great advantages in server power applications. In this paper, the switching loss characteristics of LCC resonant converter are analyzed and studied.Keywords: LCC resonant converter; switching loss;resonant element;high order harmonic; time domain analysis method1l c c激关键性技术和难点分析功率开关管的高频化,不仅可减小变压器体积、电感和电容,同时还可节约元件应用成本,提升变换器设备的应用效率。
开关电源的开关损耗
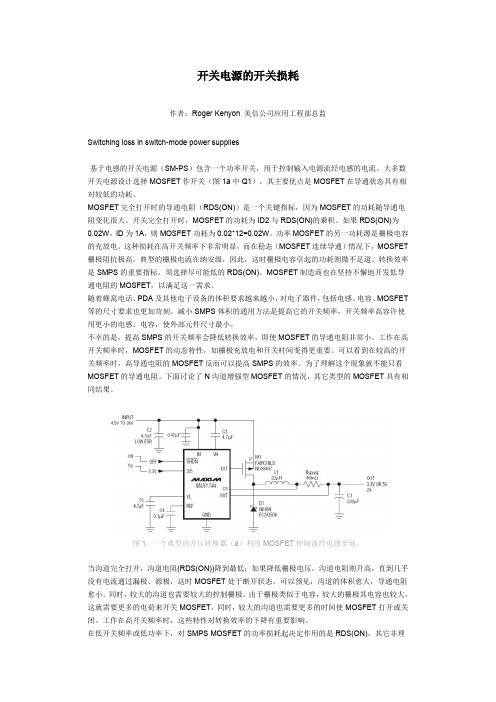
开关电源的开关损耗作者:Roger Kenyon 美信公司应用工程部总监Switching loss in switch-mode power supplies基于电感的开关电源(SM-PS)包含一个功率开关,用于控制输入电源流经电感的电流。
大多数开关电源设计选择MOSFET作开关(图1a中Q1),其主要优点是MOSFET在导通状态具有相对较低的功耗。
MOSFET完全打开时的导通电阻(RDS(ON))是一个关键指标,因为MOSFET的功耗随导通电阻变化很大。
开关完全打开时,MOSFET的功耗为ID2与RDS(ON)的乘积。
如果RDS(ON)为0.02W,ID为1A,则MOSFET功耗为0.02*12=0.02W。
功率MOSFET的另一功耗源是栅极电容的充放电。
这种损耗在高开关频率下非常明显,而在稳态(MOSFET连续导通)情况下,MOSFET 栅极阻抗极高,典型的栅极电流在纳安级,因此,这时栅极电容引起的功耗则微不足道。
转换效率是SMPS的重要指标,须选择尽可能低的RDS(ON)。
MOSFET制造商也在坚持不懈地开发低导通电阻的MOSFET,以满足这一需求。
随着蜂窝电话、PDA及其他电子设备的体积要求越来越小,对电子器件,包括电感、电容、MOSFET 等的尺寸要求也更加苛刻。
减小SMPS体积的通用方法是提高它的开关频率,开关频率高容许使用更小的电感、电容,使外部元件尺寸最小。
不幸的是,提高SMPS的开关频率会降低转换效率,即使MOSFET的导通电阻非常小。
工作在高开关频率时,MOSFET的动态特性,如栅极充放电和开关时间变得更重要。
可以看到在较高的开关频率时,高导通电阻的MOSFET反而可以提高SMPS的效率。
为了理解这个现象就不能只看MOSFET的导通电阻。
下面讨论了N沟道增强型MOSFET的情况,其它类型的MOSFET具有相同结果。
图1. 一个典型的升压转换器(a)利用MOSFET控制流经电感至地。
【2017年整理】DCDC简介

简介DC/DC 【中文解释】就是指直流转直流电源。
概念是指将一个固定的直流电压变换为可变的直流电压,也称为直流斩波器。
这种技术被广泛应用于无轨电车、地铁列车、电动车的无级变速和控制,同时使上述控制获得加速平稳、快速响应的性能,并同时收到节约电能的效果。
用直流斩波器代替变阻器可节约电能(20~30)%。
直流斩波器不仅能起调压的作用(开关电源),同时还能起到有效地抑制电网侧谐波电流噪声的作用。
工作原理DC/DC变换是将原直流电通过调整其PWM(占空比)来控制输出的有效电压的大小。
DC/DC转换器又可以分为硬开关(Hard Switching)和软开关(Soft Switching)两种。
硬开关DC/DC转换器的开关器件是在承受电压或流过电流的情况下,开通或关断电路的,因此在开通或关断过程中将会产生较大的交叠损耗,即所谓的开关损耗(Switching loss)。
当转换器的工作状态一定时开关损耗也是一定的,而且开关频率越高,开关损耗越大,同时在开关过程中还会激起电路分布电感和寄生电容的振荡,带来附加损耗,因此,硬开关DC/DC转换器的开关频率不能太高。
软开关DC/DC转换器的开关管,在开通或关断过程中,或是加于其上的电压为零,即零电压开关(Zero-Voltage-Switching,ZVS),或是通过开关管的电流为零,即零电流开关(Zero-Current·Switching,ZCS)。
这种软开关方式可以显著地减小开关损耗,以及开关过程中激起的振荡,使开关频率可以大幅度提高,为转换器的小型化和模块化创造了条件。
功率场效应管(MOSFET)是应用较多的开关器件,它有较高的开关速度,但同时也有较大的寄生电容。
它关断时,在外电压的作用下,其寄生电容充满电,如果在其开通前不将这一部分电荷放掉,则将消耗于器件内部,这就是容性开通损耗。
为了减小或消除这种损耗,功率场效应管宜采用零电压开通方式(ZVS)。
开关电源磁性元件损耗计算

About Power Electronics Technology | For Advertisers | Contact Us | Subscribesearch the site DiscreteSemisPowerManagementMotor PowerManagementPassives/Packaging ThermalManagementPowerSystemsTargeting Switcher Magnetics Core Loss CalculationsFeb 1, 2002 12:00 PMBy Clifford Jamerson, Consultant, Christiansburg, Va.Magnetics product catalogs derive core loss vs.frequency curves by measuring the core lossesthat result from sinusoidal excitation at varyingfrequencies and voltage amplitudes. The “B” inthe family of curves is the maximum flux eitherside of the origin of the B-H curve. Thus, the totalswing in flux is twice that shown in the core losscharts. The formulas for core loss in the catalogsare empirical ones that give a best-fit to themeasured values.Most application notes when estimating the coreloss of a magnetic component have a proceduresimilar to:1.Calculate the total flux swing usingFaraday's Law. If the voltage applied toa transformer winding is constant duringa pulse, then the total flux swing is:∆B=(V∆t×108)/NAe (1)Where:∆B=Total flux swing in gaussV∆t=Volt-seconds in the pulseN=Number of turns in windingAe=Cross-sectional area of core in cm22.Assume the total flux swing from (1) isthe same as that for a sinusoid withsame volt-seconds. Divide the total fluxswing by two and go to the core losscurves at the specified switch frequencyto find the core loss per unit volume (orunit weight), either in mW/cm3 or W/lb.3.Multiply the core loss per unit volume×cm3, or W/lb×the core's weight.The classical procedure is easy to use. However, for pulsed operation where the duty cycle is low, theactual core loss will be higher than predicted by the classical procedure. For these pulsed applications,you'll find a better procedure some experienced magnetic designers have used.Core LossCore loss is proportional to the area enclosed inside the hysteresis curve. In reality, the actual width ofthe hysteresis loop is influenced by the rate of change of flux, dB/dt, which has a nonlinear relationshipwith frequency and flux amplitude. If the frequency is doubled and flux amplitude is held constant, thenthe dB/dt is doubled. If the frequency is held constant and the flux swing is doubled, then the dB/dt isalso increased by a factor of 2. However, when we look at either the core loss curves or the best-fitformula for any magnetic material, we see the core loss isn't directly proportional to the flux amplitude orthe frequency. Instead, the actual relationships are exponential.Consider Magnetics “P” material as a typical example. For the frequency range of 100 kHz to 500 kHz, thebest-fit formula [1] is:NEWS FROM PETECH TIMESSynchronous Rectification Passes Muster forMilitary ApplicationsAsia Utility Meter Market Could Reach $3.5 billionin 2009Analog Chip Maker Acquires PowerSemiconductorsAcquisition Expands Thermal ManagementPortfolioWafer Fab Installs BCD ProcessNanocrystal Discovery Promises Cheap SolarCellsSee More HeadlinesPET RESOURCESAuto Electronics NewsletterBuyer's GuideConferencesEngineering JobsPower Electronics EventsRent Our ListsWards Auto ElectronicsOctober 2005AdvertisementBack IssuesP L =0.0434×f 1.63×B 2.64 (2)Where:P L =mW/cm 3B=One-half the total flux swing in kilogauss f=kHzEquation (2) predicts that if the amplitude of the flux swing is held constant and the frequency is tripled,then the core loss increases not by a factor of 3, but by a factor of 31.63=6. Similarly, if frequency is held constant but the flux swing is tripled, then the best-fit formula predicts a core loss increase, not by afactor of 3, but by a factor of 32.64, or about 18.2. Obviously, with this highly nonlinear behavior,predicting the core loss in a high-frequency, low-duty cycle, pulsed operation via the classical procedure found in most application notes (assumes core loss is the same for sinusoidal excitation) will result in a gross underestimation of the total core loss.Because of this nonlinear core loss behavior, the large exponential increase in core loss with an increase in dB/dt is due to eddy currents in the core. The amplitude of eddy currents is proportional to dB/dt and thus the voltage applied to the coil winding. This means the core loss due to eddy currents is proportional to the square of the eddy currents and proportional to the distribution of the eddy currents (core eddycurrent loss = I 2R). Thus, the eddy current losses in the core are proportional to the square of dB/dt,which in turn is proportional to the volts per turn of the winding [2]. You can model core eddy currentlosses in a choke via a resistor across the winding and in a transformer by a resistor across the primary.Skin EffectThe penetration depth (D pen ) of the fields in the core material is:meters (3)Where:ρ = Resistivity of the materialµr = Relative permeability of coref = Frequency.Thus, there's a complex relationship between core material, frequency, and eddy currents. Magnetic materials in Permalloy tape cores are conductive, thus have a much smaller penetration depth than do ferrites that have high resistivity. In most power ferrites, the skin effect upon eddy currents losses can be ignored. However, this isn't true with tape cores whenever the tape thickness exceeds the penetration depth. Thus the exponential to dB/dt in core loss for tape cores depends greatly upon the frequency.Obviously, an actual measurement of core loss of a magnetic component in actual circuit operation is desirable. However, any reliable measurement of core loss would require a specialized test setup, normally outside the resources of an SMPS development lab. What alternative is there? One approach is a thermal measurement of core temperature made inside a supply under actual operating conditions, which lumps the copper loss with the core loss and is affected by other variables including airflow and nearby hot components. Thus, the effects of winding loss, surface area, airflow, and surrounding hot components make it extremely difficult to deduce the core loss from a temperature rise measurement.There's a simple, easy-to-use alternative procedure that can give the SMPS designer some confidence that his estimation of core loss under pulse operation is approximately correct. The procedure calculates the apparent frequency, finds the core loss for the apparent frequency, then multiplies that core loss by the duty cycle of the apparent frequency. We “approximate” by assuming that the one-cycle core loss for the apparent frequency is the same as that for one cycle of a sinusoid at the apparent frequency (a sinusoid with the same total flux swing).Forward Converter ExampleConsider a typical 100 kHz, two-switch forward converter with 20 ms of hold-up time at low input line. Assume that at high line the steady-state voltage, seen on the primary of the power transformer, is that shown in Fig. 1. Also, assume the total flux swing in the P-material core is 1600 gauss.In Fig. 1, one complete cycle of flux swing is completed in 5 µsec. Although the switch frequency is 100kHz, the apparent frequency seen by the transformer during a combined period of PWM pulse time and flyback time is 200 kHz. The duty cycle for the apparent frequency is 5 µs/10 µs=½. Using the classical method to estimate core loss, we divide 1600 gauss by 2 and go to the P-material loss curve at 800gauss and 100 kHz, the switch frequency. The core loss from the P-material loss curve is 45mW/cm 3[1].However, using the apparent frequency method, we go into the loss curves at 800 gauss and 200 kHz to get about 130mW/cm 3, which we then multiply by the one-half duty cycle of the switch frequency to get65mW/cm 3. The 65mW value is 44% more than the 45mW value obtained by the classical method.Note that the above analysis uses data from core loss curves at 80°C. At temperatures much lower or higher than 80°C, the core loss is higher. Also note that the flux vs. time transition (Fig. 1b ) is atriangular wave, not a sinusoid. In most PWM supplies, the flux swings vs. time are triangular since flux is proportional to the integral of voltage.Source ESB Part Search Search inventories from hundreds of distributorsquickly and easily!Magamp ExampleAssume a 2714A amorphous-material saturable reactor in a magamp post regulator connected to the 100 kHz forward converter above. Assume that the turns and cross-sectional area of the saturable reactor (SR) are such that during the blocking time and reset time that there's a total flux swing of 6000 gauss and that the voltage waveforms are those shown in Fig. 2.Consider region (a) in Fig. 2 as one-half cycle at an apparent frequency of 1/(0.8 µs+0.8 µs) or an apparent frequency of 625 kHz. The duty cycle of this apparent frequency while the SR is blocking is 0.8 µs/10 µs=0.08. Consider region (b), the reset voltage, as one-half cycle at a second apparent frequency of 1/(2×2.7 µs)=185 kHz. The duty cycle of the apparent frequency during reset is (5 µs-2.3 µs)/10 µs=0.27. Now we go to the loss curves for 2714A material in[3] at both 625 kHz and 185 kHz for a 6000 gauss/2 flux swing, then multiply each core loss by its corresponding duty cycle and sum the two results together. The calculation based upon the loss curve figures and best-fit formula is:Core loss/lb=587W/lb×0.08 duty cycle+100W/lb×0.27 duty cycle =74W/lb (4)The core loss for a frequency of 625 kHz and 3000 gauss is outside the range of the core loss chart. Thus, the core loss (P L) for 625 kHz was predicted from the “best-fit” formula:P L ??? 0.0458×10⁻⁴×f1.55×B1.67 (5)Where:B=Flux density in Teslas(Note: This is a Magnetics Inc. formula whose accuracy at 625 kHz isn't known. However, it's the best available data).Using the classical procedure given for magamp design, the predicted core loss for a 3000 gauss flux swing at 100 kHz on either side of the origin of the B-H curve, the core loss would have been only42W/lb. Compare this to the 74W/lb obtained using the apparent frequency procedure. This discrepancy explains why saturable reactors in magamp post regulators seem to run hotter than first predicted. Another factor is the added area inside the hysteresis loop resulting from driving the core deep into and out of saturation. Driving the core in and out of deep saturation adds a significant amount of stored energy. However, much of this energy transfers back to the primary.To find the total core loss via the apparent frequency procedure, multiply the watts per pound times the weight of the core. For example, assume a 50B10-1E core weighing 3.5 g. The estimated core loss for the saturable reactor example above is 74W/lb×3.5 g×1.0 lb/454 g=0.57W.Full-Bridge ExampleA good example of the usefulness of the apparent frequency approach is to estimate the core loss in the resonant choke in series with the primary of the transformer in a phase-shifted full-bridge supply[4]. The resonant choke Lr is shown in Fig. 3.Fig. 4, on page 22, shows a typical transformer primary current waveform for the 200 kHz phase-shifted full bridge. In a choke, the B field is directly proportional to the current, and the voltage across the choke is proportional to the derivative of the current (V=Ldi/dt). Since we know that the core loss increases exponentially with dB/dt, then for a quick approximation of core loss, we will consider only the high dB/dt portion of the flux curve and its duty cycle. At the leading edge of the pulse, the bulk voltage is divided between the resonant choke and the leakage inductance of the transformer. For the transition we can assume that Cc is a short circuit. Assume that the flux transition from (a) to (b) in Fig. 4 is 1200 gauss and that the transition time is 0.5 µs and the switch frequency is 200 kHz. The apparent frequency from combining the 0.5 µs positive transition with the 0.5 µs negative transition is 1/(0.5 µs+0.5 µs)=1 MHz and the duty cycle is 1 µs/5 µs=20%. Assume P-material ferrite. Enter the loss curve for 1 MHz at1200/2=600 gauss to get 5.5W/cm3. Multiply 5.5W/cm3 by 20% duty cycle to get 1.1W/cm3.This is an unacceptably high power loss. A core volume of only 10 cm3 results in an estimated 11W of core loss. If we had used the traditional approach, considering 1600 gauss at 200 kHz, (entered curve at 800 gauss) the estimated core loss would have been only 0.13W/cm3. This “traditional calculation result” would have seemed “marginally acceptable” until the supply is tested and choke winding begins to smoke. A larger core and larger air gap are needed in this example to reduce the overall flux swing and core loss.Snubber ExampleA good example of how to use the apparent frequency method is one in which a saturable reactor (SR) core is in series with an output rectifier diode, as shown in Fig. 5.Assume the output filter is in the 100A output of a 100 kHz supply. Also assume that the SR cores are Magnetics 50B12-1D[3] and tests indicate that when rectifiers are hot, the flux swing in the SR2 core is 4000 gauss in 200 ns, both for the set and reset times.Use the apparent frequency method to estimate the core loss. The apparent frequency is 1/(200 ns+200 ns)=2.5 MHz. Duty cycle is 400 ns/10 µsec=0.04. Obviously 5 MHz is outside the parameters of the published core loss curves, so we will use the best-fit formula:P L ??? 0.351×10⁻⁴×f1.5×B1.8 (5)Here:B=0.2 Teslas.f=2.3 MHzP L=7530 W/lbMultiply by the 0.04 duty cycle to get 301W per lb. Multiply by 1.2 g core weight to get:Core loss=301W/lb×1 lb/454 g×1.2g=0.8WCompare this estimate to one derived by the traditional method. Enter 100 kHz loss curve at4000/2=2000 gauss to get 60W/lb. Multiply 60W/lb by 1.2 g core weight to get 0.16W. This value is only 20% of the core loss predicted by use of the apparent frequency and duty cycle method.PFC CircuitOne difficult core loss problem is found in the resonant PFC circuit, shown in Fig. 6. Assume current in L1 is continuous and all components are ideal. At the beginning of a switch cycle, L1 is flying back into Cb through D1. S2 turns on. Current ramps up through Lr, as shown in Fig. 7, on page 24, until voltage across Cr goes to zero. S1 turns on, S2 turns off, and current through Lr ramps down as Lr flies back into Cb through D2 and D3. SR1 prevents high-frequency ringing due to reverse recovery of boost rectifiersD2 and D3[4].Core loss of Lr choke is difficult to calculate because not only is the peak current and thus the flux swing modulated at a 120 Hz rate, the apparent frequency and duty cycle are also varying at a 120 Hz rate. There are several approaches for estimating the choke's core loss, including:1.Pick the worst-case steady state, input, ac low-line condition. Estimate the core loss for themaximum (peak current) via the apparent frequency and duty cycle method, then multiply result by some “J factor” between 0.5 and 0.7.2.Pick a condition on the skirt of the ac waveform for which the current is perhaps 0.8 that of thepeak current at worst-case, steady state low line, then apply the method.3.Do simulation using assumed estimated circuit conditions. Repeat at regularly spaced intervals ofthe rectified 60 Hz input sinusoidal current waveform, then average the results.In any case, there are many factors (and some unknowns) at work that no matter what method is used, one should do a verification test in the lab. The bottom line is the temperature rise at full load and low input line after supply has warmed-up. Some factors that effect temperature rise are: winding loss (which will be dominated by the proximity effect), the 120 Hz current changes in the resonant circuit, which in turn effect the function of many other variables. Other factors at work are the value of the components, the surface area of choke, airflow, ambient temperature, the core material, the delay time after voltage across Cr reaches zero and S2 is turned on, the current in L1, and even the snap-off characteristics of D1. Don't rely solely upon calculated values to predict temperature rise. There are simply too many variables at work.The core loss in SR1 is also very difficult to estimate accurately, for many of the same reasons as is Lr. In a typical circuit, SR1 may be five turns on an amorphous tape core with Ae of 0.1 cm3 and le of 5 cm. The core will saturate at less than 0.5 Oe, which occurs at about 0.4A. Before it saturates, the SR blocks hundreds of volts. With only five turns, the dB/dt in core is extremely high. The apparent frequency seen by SR1 is in the megahertz range. It will run hot. For a PFC switch frequency of 100 kHz, a good approach is to mount the SR up off the p. c. board and into the airflow for better cooling. SR1 will require heat sinking at 200 kHz and up.AcknowledgmentWarren Martin, formally of Fair-Rite and Magnetics (now retired), introduced the author to the method of using apparent frequency and duty cycle to estimate core loss of a forward converter transformer.References1.Magnetics Ferrite Core Catalog, 1997.2.Unitrode, “Magnetics Design Handbook”, Mag 100A.3.Magnetics, “TWC-300T, Design Manual Featuring TAPE WOUND CORES.”4.Unitrode, “Power Supply Design Seminar,” SEM-900, Topic 3, pp 4-1 to 4-18, 1993.For more information on this article, CIRCLE 331 on Reader Service CardWant to use this article? Click here for options!© 2005, PRIMEDIA Business Magazines & Media Inc.Back to TopContact Us For Advertisers For Search Partners Privacy Policy Subscribe© 2005 Primedia, Inc. All rights reserved.。
DD转换

DC/DCDC/DC 【中文解释】就是指直流转直流电源。
DC/DC概念是指将一个固定的直流电压变换为可变的直流电压,也称为直流斩波器。
这种技术被广泛应用于无轨电车、地铁列车、电动车的无级变速和控制,同时使上述控制获得加速平稳、快速响应的性能,并同时收到节约电能的效果。
用直流斩波器代替变阻器可节约电能(20~30)%。
直流斩波器不仅能起调压的作用(开关电源),同时还能起到有效地抑制电网侧谐波电流噪声的作用。
DC/DC工作原理DC/DC变换是将原直流电通过调整其PWM(占空比)来控制输出的有效电压的大小。
DC/DC转换器又可以分为硬开关(Hard Switching)和软开关(Soft Switching)两种。
硬开关DC/DC转换器的开关器件是在承受电压或流过电流的情况下,开通或关断电路的,因此在开通或关断过程中将会产生较大的交叠损耗,即所谓的开关损耗(Switching loss)。
当转换器的工作状态一定时开关损耗也是一定的,而且开关频率越高,开关损耗越大,同时在开关过程中还会激起电路分布电感和寄生电容的振荡,带来附加损耗,因此,硬开关DC/DC转换器的开关频率不能太高。
软开关DC/DC转换器的开关管,在开通或关断过程中,或是加于其上的电压为零,即零电压开关(Zero-Voltage-Switching,ZVS),或是通过开关管的电流为零,即零电流开关(Zero-Current·Switching,ZCS)。
这种软开关方式可以显著地减小开关损耗,以及开关过程中激起的振荡,使开关频率可以大幅度提高,为转换器的小型化和模块化创造了条件。
功率场效应管(MOSFET)是应用较多的开关器件,它有较高的开关速度,但同时也有较大的寄生电容。
它关断时,在外电压的作用下,其寄生电容充满电,如果在其开通前不将这一部分电荷放掉,则将消耗于器件内部,这就是容性开通损耗。
为了减小或消除这种损耗,功率场效应管宜采用零电压开通方式(ZVS)。
软开关技术综述

软开关技术综述开关电源就是采用功率半导体器件作为开关元件,通过周期性通断开关,控制开元件的占空比来调整输出电压。
开关电源的构成框图如图1所示,它由输入电路、变换电路、输出电路和控制电路等组成。
功率变换是其核心部分,主要由开关电路和变压器组成。
为了满足高功率密度的要求,变换器需要工作在高频状态,开关晶体管要采用开关速度高、导通和关断时间短的晶体臂,最典型的功率开关晶体管有功率晶体管(CTR)、功率场效应管(MOSFET)和绝缘型双极型晶体管(IGBT)等3种。
控制方式分为脉宽调制、脉频调制、脉宽和频率混合调制等3种,其中最常用的是脉宽调制(PWM)方式。
从60年代开始得到发展和应用的DC-DC PWM功率变换技术是一种硬开关技术。
为了使开关电源在高频状态下也能高效率地运行,国内外电力电子界和电源技术界自70年代以来,不断研究开发高频软开关技术。
软开关和硬开关波形比较如图2所示。
从图可以看出,软开关的特点是功率器件在零电压条件下导通(或关断),在零电流条件下关断(或导通)。
与硬开关相比,软开关的功率器件在零电压、零电流条件下工作,功率器件开关损耗小。
与此同时,du/dt和di/dt大为下降,所以它能消除相应的电磁干扰(EMI)和射频干扰(RFI),提高了变换器的可靠性。
同时,为了减小变换器的体积和重量,必须实现高频化。
要提高开关频率,同时提高变换器的变换效率,就必须减小开关损耗。
减小开关损耗的途径就是实现开关管的软开关,因此软开关技术软开关技术已经成为是开关变换技术的一个重要的研究方向。
本文对软开关和硬开关的工作特性进行比较,并对软开关技术进行了详细阐述。
2 硬开关的工作特性是开关管开关时的电压和电流波形。
开关管不是理想器件,因此在开关管开关工作时,要产生开通损耗和关断损耗,统称为开关损耗(Switching Loss)。
开关频率越高,总的开关损耗越大,变换器的效率就越低。
开关损耗的存在限制了变换器开关频率的提高,从而限制了变换器的小型化和轻量化。
开关型的DC-DC和LDO的区别

LDOLDO是low dropout regulator,意为低压差线性稳压器,是相对于传统的线性稳压器来说的。
传统的线性稳压器,如78xx系列的芯片都要求输入电压要比输出电压高出2v~3v以上,否则就不能正常工作。
但是在一些情况下,这样的条件显然是太苛刻了,如5v转3.3v,输入与输出的压差只有1.7v,显然是不满足条件的。
针对这种情况,才有了LDO类的电源转换芯片。
LDO是一种线性稳压器,使用在其线性区域内运行的晶体管或FET,从应用的输入电压中减去超额的电压,产生经过调节的输出电压。
所谓压降电压,是指稳压器将输出电压维持在其额定值上下100mV之内所需的输入电压与输出电压差额的最小值。
正输出电压的LDO(低压降)稳压器通常使用功率晶体管(也称为传递设备)作为PNP。
这种晶体管允许饱和,所以稳压器可以有一个非常低的压降电压,通常为200mV左右;与之相比,使用NPN复合电源晶体管的传统线性稳压器的压降为2V左右。
负输出LDO使用NPN作为它的传递设备,其运行模式与正输出LDO的PNP设备类似。
新的发展使用MOS功率晶体管,它能够提供最低的压降电压。
使用功率MOS,通过稳压器的唯一电压压降是电源设备负载电流的ON 电阻造成的。
如果负载较小,这种方式产生的压降只有几十毫伏。
低压降(LDO)线性稳压器的成本低,噪音低,静态电流小,这些是它的突出优点。
它需要的外接元件也很少,通常只需要一两个旁路电容。
新的LDO线性稳压器可达到以下指标:输出噪声30μV,PSRR为60dB,静态电流6μA(TI的TPS78001达到Iq=0.5uA),电压降只有100mV(TI量产了号称0.1mV的LDO)。
如果输入电压和输出电压不是很接近,就要考虑用开关型的DCDC了,因为从上面的原理可以知道,LDO的输入电流基本上是等于输出电流的,如果压降太大,耗在LDO上能量太大,效率不高。
LDO线性稳压器的性能之所以能够达到这个水平,主要原因在于其中的调整管是用P沟道MOSFET,而普通的线性稳压器是使用PNP 晶体管。
开关损耗吸收回路

在硬开关电路的开关中,存在三 种损耗:
(1)开通时,由续流二极管的反向恢复电流 引起的浪涌电流,会导致较大的导通损耗;
(2)开通时,MOSFET的寄生结电容放电会 引起损耗;
(3)关断时,MOSFET的结电容电压的快速 增加,会导致较大的关断损耗。
•一、开关损耗(switch loss)的组成
•Vgs
•二、二极管的关断损耗
•D的损耗在高频下是重要的损 耗
•trr = t2 - t0
•UF
•t1 •t2
•t
•tF
•t0
•P •+
•IF •UR,UF
••N
•UR
•IRP •URP
•三、吸收回路 •IGBT逆变器中二极管的关断过 程
•P
•N
•1. RCD snubber •在关断时加吸收回路后抑制了器件两端电压的上升率,减小 了关断损耗。
•1. RCD snubber
•without
•关断时间 •关断时承受的最大电压
•3. 电阻R1的计算
•通态时间
•电阻R1上的功耗
•3. RCD snubber 的等效接法
无源无损缓冲电路的结构原理
• 针对硬开关电路的上述损耗构成,一个基本的无源无损缓 冲电路一般都包含三个功能回路:
•Transformer-aided snubber
➢
这时D1导通,V2被钳位于零电位(忽略SWB前后电压和D1、D2电压压降)。在T4
~T5期间,L1、C1出现了一个1/4周期的谐振,L1储存过剩能量。由于DB的反向恢
复电流和C2的放电电流都传输到C1,
可以看出因为有C2的能量传输,即使IR=0,VE(V1(T5))仍然有正值,确保
电气工程及其自动化专业英语翻译

Semiconductor switches are very important and crucial components in power electronicsystems.these switches are meant to be the substitutions of the mechanical switches,but they are severely limited by the properties of the semiconductor materials and process of manufacturing. 在电力电子系统,中半导体开关是非常重要和关键部件。
半导体开关将要替换机械开关,但半导体材料的性质和生产过程严重限制了他们。
Switching losses开关损耗Power losses in the power eletronic converters are comprised of the Switching losses and parasitic losses. 电力电子转换器的功率损耗分为开关损耗和寄生损耗the parasitic losses account for the losses due to the winding resistances of the inductors and transformers,the dielectric losses of capacitors,the eddy and the hysteresis losses. 寄生损失的绕组电感器、变压器的阻力、介电损耗的电容器,涡流和磁滞损耗the switching losses are significant and can be managed. 这个开关损耗是非常重要的,可以被处理。
they can be further divided into three components:(a)the on-state losses,(b)the off-state losses and the losses in the transition states. 他们可以分为三个部分: 通态损耗,断态损耗和转换过程中产生的损耗。
mos管开关功率损耗

mos管开关功率损耗
开关功率损耗是指在开关动作过程中,由于开关器件内部电流的通断和导通状态的转换,导致的功率耗散。
开关功率损耗通常通过两个部分来评估:导通损耗和关断损耗。
1. 导通损耗(Conduction Loss):当开关器件处于导通状态时,会有电流通过器件,并且在器件内部会有一定的电压降。
导通损耗可以通过以下公式计算:
导通损耗 = 导通电流 x 导通电压降
2. 关断损耗(Switching Loss):当开关器件从导通状态切换
到断开状态时,会产生关断损耗。
关断损耗主要由两部分组成: a) 开关过程中的反向恢复(reverse recovery)损耗:当开关
器件从导通状态切换到断开状态时,由于内部载流子的存储效应,会产生反向电流。
这会消耗能量并引起额外的功耗。
b) 开关过程中的开关损耗:当开关器件从导通状态切换到断
开状态,会有瞬态电压和电流的变化,这会导致额外的功耗。
总的开关功率损耗可以通过导通损耗和关断损耗之和得到。
为了降低开关功率损耗,可以通过改变开关频率、使用高效的开关器件和控制电路等方式进行优化。
开关损耗的影响因素分析与仿真

开关损耗的影响因素分析与仿真夏兴国;陈乐柱;宁平华【摘要】The factors that affect the switching losses and the losses are analyzed,The experimental sim-ulation is compared and studied base on 4 kinds of influencing factors are determined.The reference value of 4kinds of influencing factors was set up according to the circuit,then the parameters are changed,the voltage and current waveforms of the opening and closing process are simulated by set up the simulation circuit with the IGBT as the object.Through the measurement and comparison of a large number of data,the relationship and influence of the switching loss and the factors are summarized.%分析了开关损耗和影响开关损耗的因素,确定了4种影响因素为主要对象,对其参数配置进行了实验仿真比较和研究. 以IGBT为对象搭建了仿真电路,根据电路先设定4种影响因素参数的基准参考值,后改变其参数值,仿真出IGBT开通与关断过程的电压和电流波形. 通过大量仿真数据的测量和比较分析,总结出开关损耗与各因素间的关系和影响.【期刊名称】《常州工学院学报》【年(卷),期】2015(028)005【总页数】5页(P23-27)【关键词】功率开关器件;开关损耗;PSpice【作者】夏兴国;陈乐柱;宁平华【作者单位】马鞍山职业技术学院电气工程系,安徽马鞍山 243031;安徽工业大学电气与信息工程学院,安徽马鞍山 243002;马鞍山职业技术学院电气工程系,安徽马鞍山 243031【正文语种】中文【中图分类】TM930当前,随着非再生能源的过度使用和节能环保意识的增强,提高电能利用率显得非常重要。